Abstract
The significance of accurate heating load (HL) approximation is the primary motivation of this research to distinguish the most efficient predictive model among several neural-metaheuristic models. The proposed models are formulated through synthesizing a multi-layer perceptron network (MLP) with ant lion optimization (ALO), biogeography-based optimization (BBO), the dragonfly algorithm (DA), evolutionary strategy (ES), invasive weed optimization (IWO), and league champion optimization (LCA) hybrid algorithms. Each ensemble is optimized in terms of the operating population. Accordingly, the ALO-MLP, BBO-MLP, DA-MLP, ES-MLP, IWO-MLP, and LCA-MLP presented their best performance for population sizes of 350, 400, 200, 500, 50, and 300, respectively. The comparison was carried out by implementing a ranking system. Based on the obtained overall scores (OSs), the BBO (OS = 36) featured as the most capable optimization technique, followed by ALO (OS = 27) and ES (OS = 20). Due to the efficient performance of these algorithms, the corresponding MLPs can be promising substitutes for traditional methods used for HL analysis.
1. Introduction
Energy consumption analysis of buildings is a very significant task, due to the high rate of energy consumed in this sector [1]. Heating, ventilating, and air conditioning (HVAC) [2] is a state-of-the-art system that controls the heating load (HL) and cooling load (CL) in the buildings. Considering the crucial importance of the subject, the approaches such as regression analysis [3,4] and time series [5] cannot satisfy the accuracy required for estimating these parameters. As well as this, other difficulties such as the non-linearity of the problem have driven many scholars to improve the flexibility of intelligent models. As discussed by many scholars, along with well-known models (e.g., decision-making [6,7,8,9]), the artificial intelligence techniques have provided a high capability in the estimation of non-linear and intricate parameters [10,11,12]. Plenty of scientific efforts (e.g., concerning environmental subjects [13,14,15,16,17,18,19,20,21,22,23], gas consumption modeling [24,25], sustainable developments [26], pan evaporation and soil precipitation simulation [26,27,28,29,30,31], energy-related estimations [32,33,34,35,36,37,38,39], water supply assessment [16,40,41,42,43,44,45,46,47,48,49], computer vision and visual processing [50,51,52,53,54,55,56,57], building and structural design analysis [8,58,59,60,61], behavior of structural components [60,62,63,64], measurement techniques [43,50,65,66], climatic-related calculations [64], and analysis that deals with feature selection [64,67,68,69,70,71,72]) have been associated with these computational technologies. In an artificial neural network (ANN), for example, a mapping process between the input and target parameters is carried out by mimicking the neural-based method established in the human brain [73,74,75,76]. Different structures (and consequently diverse types) of ANNs have been designed for specific objectives (e.g., multi-layer perceptron (MLP) [77,78,79]). Going into deep processors such as ANN, a so-called method “deep learning” emerges, which has successfully modeled various phenomena and parameters [8,80,81,82]. Diagnostic problem and medical sciences, for instance, are two subjects which have been nicely solved by extreme machine learning approaches [83,84,85,86].
Up to now, diverse notions of soft computing techniques (e.g., support vector machine (SVM) and artificial neural network (ANN)) have been effectively used for energy consumption modeling [87,88,89,90,91]. Roy, et al. [92] proposed multivariate adaptive regression splines (MARS) coupled with an extreme learning machine (ELM) for predicting the HL and CL. They used the first model to perform importance analysis of the parameters to feed the second model. Likewise, Sholahudin and Han [93] used an ANN along with the Taguchi method for investigating the effect of the input factors on the HL. The feasibility of a random forest predictive method was investigated by Tsanas and Xifara [94] and Gao et al. [95] for both HL and CL factors. The latter reference is a comprehensive comparative study that compares the simulation capability of sixteen machine learning models (e.g., elastic net, radial basis function regression). This study also confirmed the high efficiency of alternating model tree and rules decision table models. Chou and Bui [91] proposed the combination of ANN and SVM as a proper model for new designs of energy-conserving buildings. The applicability of the neuro-fuzzy approach (ANFIS) for predicting the HL and CL was explored by Nilashi et al. [96]. They used expectation-maximization and principal component analysis along with the ANFIS, respectively, for clustering objective and removing noise. Referring to obtained values of mean absolute error (MAE) (0.16 and 0.52 for the HL and CL predictions, respectively), they concluded that the proposed model is accurate enough for this aim.
In addition, studies in different fields have shown that utilizing metaheuristic algorithms is an effective idea for improving the accuracy of typical predictors [97,98]. For energy-efficient buildings, Moayedi et al. [99] improved the ANN for forecasting the CL by benefiting from the foraging/social behavior of ants, Harris hawks, and elephant (i.e., the EHO algorithm). The results (e.g., the correlation values over 85%) show that the applied algorithms can satisfactorily handle the optimization task. An EHO-based CL predictive formula was also presented. Amar and Zeraibi [100] used the firefly algorithm to optimize the SVM (parameters) for HL modeling in district heating systems. Their model outperformed genetic programming and ANN. Moayedi et al. [99] employed a grasshopper optimization algorithm (GOA) and grey wolf optimization (GWO) algorithms for enhancing the HL prediction of ANN. A significant decrease in the MEA calculated for the ANN (from 2.0830 to 1.7373 and 1.6514, respectively, by incorporation of the GOA and GWO) means that the algorithms can build a more reliable ANN network compared to the typical back-propagation one. In addition, other studies such as [26] outlined the competency of such algorithms in the same fields. As a visible gap of knowledge, despite the variety of studies that have mainly focused on broadly used metaheuristic techniques [101], there are still some algorithms that need to be evaluated. Therefore, assessing the performance of six novel optimization techniques, namely ant lion optimization (ALO), biogeography-based optimization (BBO), many-objective sizing optimization [102,103,104], data-driven robust optimization [35,105], the dragonfly algorithm (DA), evolutionary strategy (ES), invasive weed optimization (IWO), and league champion optimization (LCA), is the central aim of the present paper.
2. Data Provision and Analysis
Providing a reliable dataset is an essential step in intelligent model implementation. These data are used in two stages. Firstly, the significant share is analyzed by the models to infer the relationship between the intended factors and independent variables. The rests are then used to represent unseen conditions of the problem and the performance of the model for stranger data.
In this article, the used dataset was downloaded from a freely available data repository (http://archive.ics.uci.edu/mL/datasets/Energy+efficiency, accessed on 20 December 2020) based on a study by Tsanas and Xifara [94]. They analyzed 768 residential buildings with different geometries using Ecotect software [106] to obtain the HL and CL as the outputs. They set the information of eight independent factors, namely relative compactness (RC), overall height (OH), surface area (SA), orientation, wall area (WA), glazing area (GA), roof area (RA), and glazing area distribution (GAD). Figure 1 shows the distribution of these factors versus the HL, which we aim to predict in this study. Based on plenty of previous studies [97], a random division process was carried out to specify 538 samples (i.e., 70% of the whole) and 230 rows (i.e., 30% of the whole) to the training and testing sets, respectively.
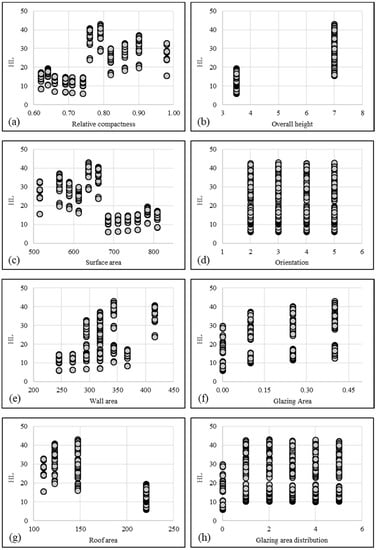
Figure 1.
The distribution of the heating load (HL) versus environmental factors: (a) relative compactness, (b) overall height, (c) surface area, (d) orientation, (e) wall area, (f) glazing area, (g) roof area, and (h) glazing area distribution.
3. Methodology
The overall methodology used in this study is shown in Figure 2.
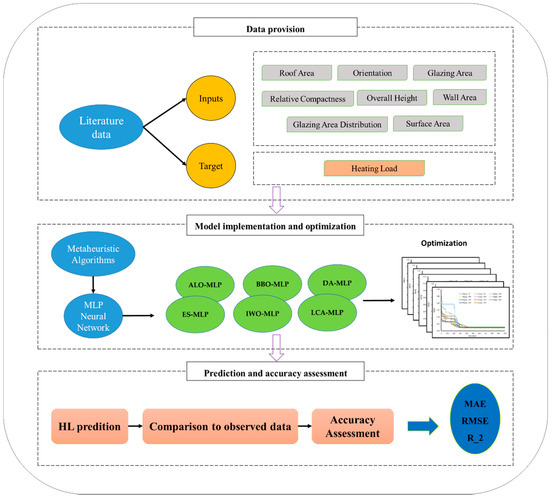
Figure 2.
The general path of the study.
3.1. Artificial Neural Network
ANNs are popular data mining techniques based on the biological mechanism of the neural network [107]. ANNs are able to deal with highly complicated engineering simulations because of the non-linear analysis option [108,109]. This approach distinguishes itself by different notions including multi-layer perceptron (MLP) [110], radial basis function [111], and general regression [112]. In this study, an MLP network was selected as the basic method. Figure 3 depicts the MLP general structure predicting M output variables by taking into consideration L input factors. It is important to note that in an MLP, more than one hidden layer can be sandwiched between two other layers. However, theoretical studies have demonstrated the efficiency of unique hidden layer MLPs for any problem.
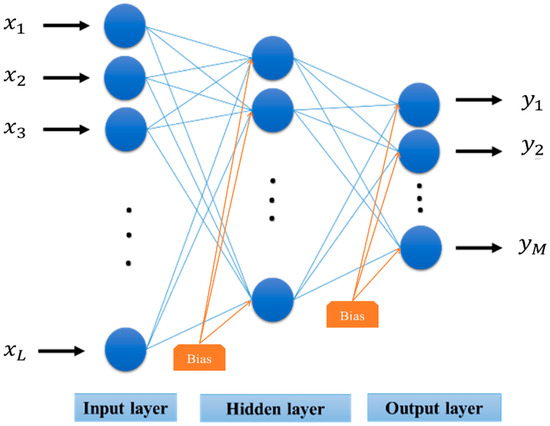
Figure 3.
Multi-layer perceptron (MLP) general structure predicting M output variables.
ANNs normally benefit from the training scheme of Levenberg–Marquardt (LM), an approximation to the method of Newton [113] (Equation (1)). The LM is known to be quicker and enjoy more power compared to conventional gradient descent technique [114,115].
where and are the gradient and the Hessian matrix, respectively. The following equation expresses as a sum of squares function:
Next, let be the Jacobean matrix, then it can be written:
Equation (1) can be written as follows when S(x) ≈ 0:
Lastly, Equation (5) presents the central equation of the LM, based on the Gauss–Newton method.
Remarkably, high and low values of turn this algorithm to steepest descent (with step ) and Gauss–Newton, respectively.
3.2. Swarm-Based Metaheuristic Ideas
Optimization algorithms which have recently been very popular for enhancing the performance of predictive models (e.g., ANNs) are based on swarm functioning of a group of corresponding individuals. They are mostly inspired by nature and seek an optimal global solution for a defined problem by analyzing the relationship between the existing parameters. Coupled with an ANN, these optimizers seek to adjust the biases and weights. This process is better explained in the next section. Here, the overall idea of the intended algorithms is briefly described.
Ant lion optimization (Mirjalili [116]) is a recently-developed hybrid model that mimics the herding behavior of ant lions. It comprises different stages in which the prey (usually an ant) gets trapped and hunted in a hole by a random walk. The capability of the individuals is evaluated by a “roulette wheel selection” function. Biogeography-based optimization is based on two items: (a) the information concerning biogeography and (b) the way different species are distributed. This algorithm was designed by Simon [117] and was used by Mirjalili, et al. [118] to train an MLP network. In the BBO, there are migration and mutation steps and the population is made up of “habits”. Note that these habits are evaluated by two indices called the habitat suitability index and suitability index variable. The dragonfly algorithm is another population-based optimization technique proposed by Mirjalili [119]. Based on the Reynolds swarm intelligence, the DA draws on three stages, namely separation, alignment, and cohesion. The name evolutionary strategy implies a stochastic search approach proposed by Schwefel [120]. In the ES, two operators of selection and mutation act during the evolution and adaption stages. The population is produced with offspring variables and the offspring’s modality is compared to that of the parents. Inspired by the colonizing behavior of weeds, invasive weed optimization was presented by Mehrabian and Lucas [121]. The optimal solution of this algorithm is the most suitable site for the plants to grow and reproduce. The algorithm begins with the initialization and after reproducing, it runs the stages called spatial dispersal and competitive exclusion, and gets stopped after meeting with the termination measures. Last but not least, league champion optimization is suggested by Kashan [122], mimicking sporting competitions in leagues. The LCA tries to find the best-fitted solution to the problem by implementing an artificial league including schedule programming and determining the winner/looser teams. More information about the mentioned algorithms (e.g., mathematical relationships) was detailed in previous studies (for the ALO [123,124], BBO [125], DA [126], ES [127], IWO [128], and LCA [129,130]).
3.3. Hybridization Process and Sensitivity Analysis
In order to develop the proposed neural-metaheuristic ensembles, the algorithms should be hybridized with the ANN. To this end, utilizing the provided data, the general equation of an MLP neural network is yielded to the ALO, BBO, DA, ES, IWO, and LCA as the problem function. But before that, it is required to determine the most suitable structure (i.e., the number of neurons) of it. As explained previously, the number of neurons in the first and the last layers is equal to the number of input and output variables, respectively. Hence, only the number of hidden neurons can be varied. Based on a trial-and-error process, it was set to five. Therefore, the network architecture was distinguished as 8 × 5 × 1.
Each ensemble was executed within 1000 repetitions, where the mean square error (MSE) was defined to measure the performance error during them (objective function = MSE). For greater reliability of the results, a sensitivity analysis was carried out in this part. Eleven different population sizes, including 25, 50, 100, 150, 200, 250, 300, 350, 400, 450, and 500, were tested for each model, and the best-fitted complexity was used to predict the HL in the following. The convergence curves belonging to elite networks of each model are presented in Figure 4. According to these charts, for all algorithms, the error is chiefly reduced within the first half of the iterations. Test best population sizes are determined 350, 400, 200, 500, 50, and 300 for the ALO-MLP, BBO-MLP, DA-MLP, ES-MLP, IWO-MLP, and LCA-MLP, respectively.
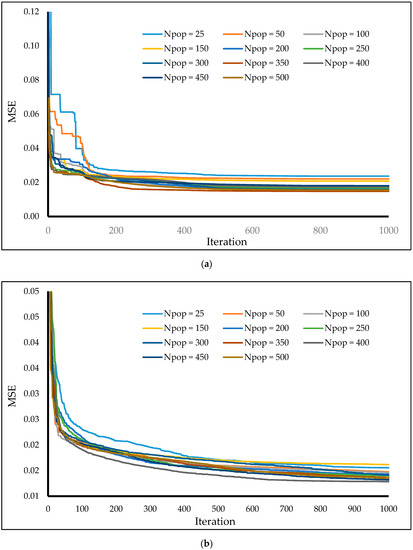
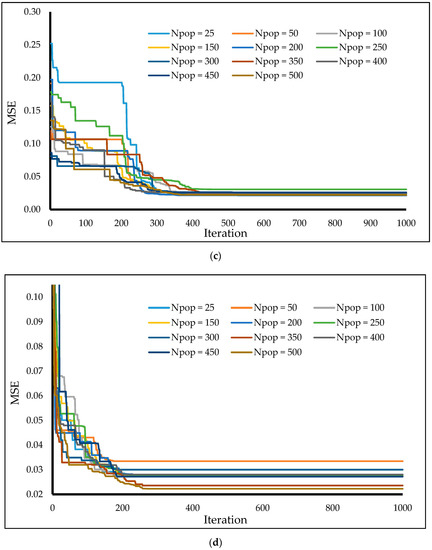
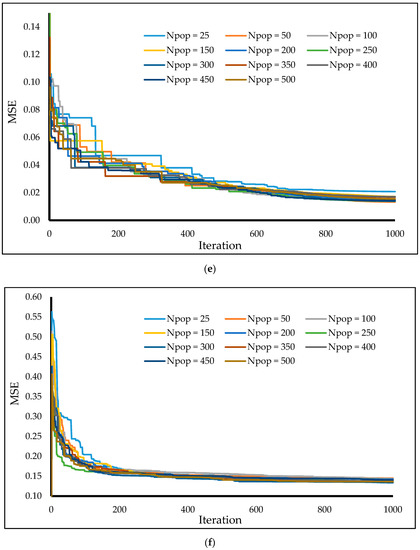
Figure 4.
The sensitivity analysis accomplished for determining the best population size of the (a) ant lion optimization (ALO)-MLP, (b) biogeography-based optimization (BBO)-MLP, (c) dragonfly algorithm (DA)-MLP, (d) evolutionary strategy (ES)-MLP, (e) invasive weed optimization (IWO)-MLP, and (f) league champion optimization (LCA)-MLP.
4. Results and Discussion
4.1. Statistical Accuracy Assessment
Three broadly used criteria are applied to measure the prediction accuracy of the implemented models by reporting the error and correlation of the results. For this purpose, MAE (along with the RMSE) and the coefficient of determination (R2) are used. These criteria are applied to the data belonging to the training and testing groups to demonstrate the qualities of learning and prediction, respectively. Assuming G as the total number of samples, and Ji observed, and Ji predicted as the real and forecasted HL values, Equations (6)–(8) formulate the RMSE, MAE, and R2.
where observed denotes the mean of Ji observed values.
4.2. Training Results
The results of elite structures of each model are evaluated in this section. Figure 5 shows the training results. In this regard, the error (=real HL − forecasted HL) is calculated and marked for all 538 samples. In this phase, the maximum and minimum of the (positive) error values were 0.0136 and 6.4455, 0.0018 and 6.0681, 0.0019 and 9.2773, 0.0248 and 7.3006, 0.0184 and 6.3776, and 0.0715 and 8.4620, respectively, for the leaning process of ALO-MLP, BBO-MLP, DA-MLP, ES-MLP, IWO-MLP, and LCA-MLP ensembles.
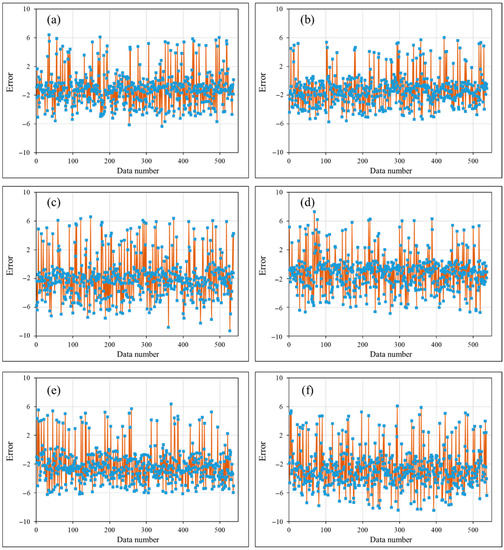
Figure 5.
The training errors calculated for the (a) ALO-MLP, (b) BBO-MLP, (c) DA-MLP, (d) ES-MLP, (e) IWO-MLP, and (f) LCA-MLP prediction.
Referring to the calculated RMSEs (2.6054, 2.5359, 3.4314, 2.7146, 3.2506, and 3.8297), all six models achieved a reliable performance in understanding the non-linear relationship of the HL and eight influential factors. Another piece of evidence that supports this claim is the MAE index (2.0992, 2.0846, 2.9402, 2.0848, 2.8709, and 3.4091). Furthermore, the correlation between the expected and real HLs is higher than 92% in all models. In detail, the values of R2 are 0.9539, 0.9596, 0.9222, 0.9357, 0.9547, and 0.9386.
4.3. Validation Results
The developed models are then applied to the second group of data to assess the generalization capability of them. Figure 6 depicts the correlation between the expected HLs and networks’ products. As is seen, all obtained R2s (0.9406, 0.9516, 0.9340, 0.9318, 0.9431, and 0.9400) reflect higher than 93% accuracy for all models. In this phase, the errors range between −5.5792 and 6.9349, −5.6311 and 6.3000, −9.3137 and 6.8288, −7.0282 and 7.0647, −6.2505 and 5.8823, and −8.2384 and 6.1992, respectively.
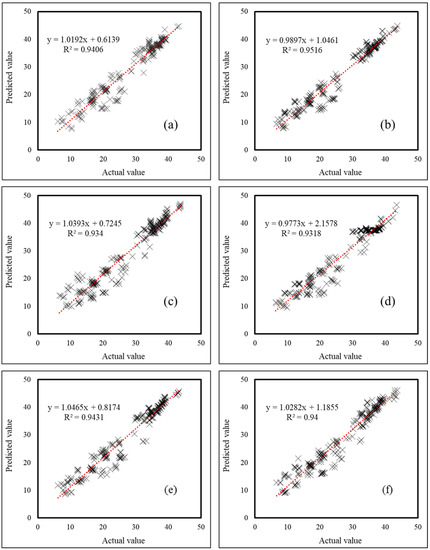
Figure 6.
The R2 results calculated in the testing phase of the (a) ALO-MLP, (b) BBO-MLP, (c) DA-MLP, (d) ES-MLP, (e) IWO-MLP, and (f) LCA-MLP models.
Considering the computed RMSE (2.7162, 2.4807, 3.3998, 3.0958, 3.3524, and 3.2954) as well as the MAE (2.1865, 1.8284, 2.8713, 2.5072, 2.9702, and 2.7807) error criteria, it can be deduced that the networks’ prediction for unseen environmental conditions has a good level of accuracy. More clearly, the values of mean absolute percentage error were 10.01%, 9.78%, 13.59%, 12.63%, 13.01%, and 13.01%, respectively.
4.4. Score-Based Comparison and Time Efficiency
Table 1 summarizes the values of the RMSE, MAE, and R2 obtained for the training and testing phases. In this section, the comparison between the performance of the used predictors is carried out to determine the most reliable one. For this purpose, by taking into consideration all three accuracy criteria, a ranking system is developed. In this way, a score is calculated for each criterion based on the relative performance of the proposed model. The summation of these scores gives an overall score (OS) to rank the models. Table 2 gives the scores assigned to each model.

Table 1.
The results of accuracy assessment.
Table 2.
The executed ranking system.
According to the results, the most significant OS (=18) is obtained for the BBO-MLP in both the training and testing phases. The ALO and ES-based ensembles emerged as the second and third most accurate ones, respectively. However, the IWO in the training phase and the LCA in the testing phase gained a similar rank to the ES. In addition, it can be seen that the results of the DA-MLP are less consistent than other colleagues.
Moreover, Figure 7 illustrates the time required for implementing the used models. This item is also measured for other well-known optimization techniques (including Harris hawks optimization (HHO) [131], GWO [132], whale optimization algorithm (WOA) [133], artificial bee colony (ABC) [134], ant colony optimization (ACO) [135], elephant herding optimization (EHO) [136], genetic algorithm (GA) [137], imperialist competitive algorithm (ICA) [138], particle swarm optimization (PSO) [139], and wind driven optimization (WDO) [140]) to be compared with ALO, BBO, DA, ES, IWO, and LCA. This figure indicates that the metaheuristic algorithms used in this study present a good time-efficiency in comparison with other models. Moreover, it was observed that the ABC, HHO, and DA take the greatest amount of time for almost all of the population sizes.
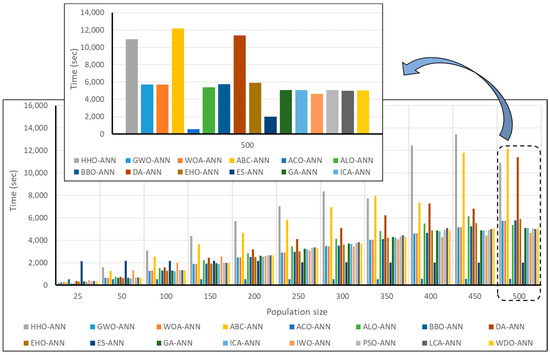
Figure 7.
The computation time needed for various hybrid methods.
4.5. Presenting the HL Predictive Equation
In the previous section, it was concluded that the BBO constructs the most reliable neural network. This means that the biases and connecting weights optimized by this technique can analyze and predict the HL more accurately compared to other metaheuristic algorithms. Therefore, the governing relationships in the BBO-MLP ensemble are extracted and presented as the best HL predictive formula (Equation (9)). As is seen, there are five parameters (Z1, Z2, …, Z5) in this equation, which need to be calculated by Equation (10). Basically, the response of the neurons in the hidden layer are represented by Z1, Z2, …, Z5. Remarkably, the term Tansig is the network activation function, which is expressed by Equation (11).
HLBBO-MLP = 0.9076 × Z1 + 0.0050 × Z2 − 0.3986 × Z3 − 0.4754 × Z4 − 0.2692 × Z5 + 0.0283
4.6. Further Discussion and Future Works
Due to the fact that the dataset used in this study is a prepared dataset dedicated to residential buildings, the applicability of the used methods is derived for this type of building. However, there are many studies that have successfully employed machine learning tools for predicting the thermal loads of buildings with other usages, such as office, commercial, and industrial ones [141]. Hence, utilizing multi-usage datasets for future works can overcome this limitation.
Another idea may be evaluating the accuracy of the new generation of hybrid models which can be divided into (a) the combination of the existing metaheuristic tools with other intelligent models, e.g., ANFIS and SVM, or (b) utilizing more recent optimizers for the existing ANN models. Both ideas are helpful to possibly recognize more efficient predictive methods. Moreover, a practical use of the implemented models is also of interest. In order to evaluate the generalizability of the methods, they can be applied to the information taken from real-world buildings noting that the input parameters considered for predicting the HL should be the same as those used in this study; otherwise, it would be a new development.
5. Conclusions
The high competency of optimization techniques in various engineering fields motivated the authors to employ and compare the efficacy of six novel metaheuristic techniques, namely ant lion optimization, biogeography-based optimization, dragonfly algorithm, evolutionary strategy, invasive weed optimization, and league champion optimization, in hybridizing the neural network for accurate estimation of the heating load. The proper structure of all seven methods was determined by sensitivity analysis and it was shown that the most appropriate population size could be varied from one algorithm to another. The smallest and largest populations were 50 and 500 hired by the IWO and ES, respectively. The high rate of accuracy observed for all models indicated that metaheuristic techniques could successfully establish a non-linear ANN-based relationship that predicts the HL from the building characteristics. Comparison based on the used accuracy indices revealed that the BBO, ALO, and ES (with around 94% correlation of the results) are able to construct more reliable ANNs in comparison with IWO, LCA, and DA. In addition, the models enjoy a good time efficiency relative to some other existing algorithms. However, the authors believe that, due to recent advances in metaheuristic science, further comparative studies may be required for outlining the most efficient predictive method.
Author Contributions
H.M. methodology; software validation, writing—original draft preparation, A.M. writing—review and editing, visualization, supervision, project administration. All authors have read and agreed to the published version of the manuscript.
Funding
This research was not funded.
Institutional Review Board Statement
Not applicable.
Informed Consent Statement
Not applicable.
Data Availability Statement
Not applicable.
Acknowledgments
This research in part is supported by the Alexander von Humboldt Foundation.
Conflicts of Interest
The authors declare no conflict of interest.
References
- IEA. Key World Energy Statistics; International Energy Agency: Paris, France, 2015. [Google Scholar]
- McQuiston, F.C.; Parker, J.D.; Spitler, J.D. Heating, Ventilating, and Air Conditioning: Analysis and Design; John Wiley & Sons: Hoboken, NJ, USA, 2004. [Google Scholar]
- Turhan, C.; Kazanasmaz, T.; Uygun, I.E.; Ekmen, K.E.; Akkurt, G.G. Comparative study of a building energy performance software (KEP-IYTE-ESS) and ANN-based building heat load estimation. Energy Build. 2014, 85, 115–125. [Google Scholar] [CrossRef]
- Catalina, T.; Iordache, V.; Caracaleanu, B. Multiple regression model for fast prediction of the heating energy demand. Energy Build. 2013, 57, 302–312. [Google Scholar] [CrossRef]
- Geysen, D.; De Somer, O.; Johansson, C.; Brage, J.; Vanhoudt, D. Operational thermal load forecasting in district heating networks using machine learning and expert advice. Energy Build. 2018, 162, 144–153. [Google Scholar] [CrossRef]
- Liu, S.; Chan, F.T.; Ran, W. Decision making for the selection of cloud vendor: An improved approach under group decision-making with integrated weights and objective/subjective attributes. Expert Syst. Appl. 2016, 55, 37–47. [Google Scholar] [CrossRef]
- Tian, P.; Lu, H.; Feng, W.; Guan, Y.; Xue, Y. Large decrease in streamflow and sediment load of Qinghai–Tibetan Plateau driven by future climate change: A case study in Lhasa River Basin. Catena 2020, 187, 104340. [Google Scholar] [CrossRef]
- Sun, Y.; Wang, J.; Wu, J.; Shi, W.; Ji, D.; Wang, X.; Zhao, X. Constraints Hindering the Development of High-Rise Modular Buildings. Appl. Sci. 2020, 10, 7159. [Google Scholar] [CrossRef]
- Liu, S.; Yu, W.; Chan, F.T.S.; Niu, B. A variable weight-based hybrid approach for multi-attribute group decision making under interval-valued intuitionistic fuzzy sets. Int. J. Intell. Syst. 2021, 36, 1015–1052. [Google Scholar] [CrossRef]
- Liu, Z.; Shao, J.; Xu, W.; Chen, H.; Zhang, Y. An extreme learning machine approach for slope stability evaluation and prediction. Nat. Hazards 2014, 73, 787–804. [Google Scholar] [CrossRef]
- Piotrowski, A.P.; Osuch, M.; Napiorkowski, M.J.; Rowinski, P.M.; Napiórkowski, J.J. Comparing large number of metaheuristics for artificial neural networks training to predict water temperature in a natural river. Comput. Geosci. 2014, 64, 136–151. [Google Scholar] [CrossRef]
- Liu, J.; Wu, C.; Wu, G.; Wang, X. A novel differential search algorithm and applications for structure design. Appl. Math. Comput. 2015, 268, 246–269. [Google Scholar] [CrossRef]
- Feng, S.; Lu, H.; Tian, P.; Xue, Y.; Lu, J.; Tang, M.; Feng, W. Analysis of microplastics in a remote region of the Tibetan Plateau: Implications for natural environmental response to human activities. Sci. Total. Environ. 2020, 739, 140087. [Google Scholar] [CrossRef]
- Fu, X.; Fortino, G.; Pace, P.; Aloi, G.; Li, W. Environment-fusion multipath routing protocol for wireless sensor networks. Inf. Fusion 2020, 53, 4–19. [Google Scholar] [CrossRef]
- Han, X.; Zhang, D.; Yan, J.; Zhao, S.; Liu, J. Process development of flue gas desulphurization wastewater treatment in coal-fired power plants towards zero liquid discharge: Energetic, economic and environmental analyses. J. Clean. Prod. 2020, 261, 121144. [Google Scholar] [CrossRef]
- He, L.; Chen, Y.; Zhao, H.; Tian, P.; Xue, Y.; Chen, L. Game-based analysis of energy-water nexus for identifying environmental impacts during Shale gas operations under stochastic input. Sci. Total. Environ. 2018, 627, 1585–1601. [Google Scholar] [CrossRef]
- He, L.; Shen, J.; Zhang, Y. Ecological vulnerability assessment for ecological conservation and environmental management. J. Environ. Manag. 2018, 206, 1115–1125. [Google Scholar] [CrossRef]
- Liu, J.; Liu, Y.; Wang, X. An environmental assessment model of construction and demolition waste based on system dynamics: A case study in Guangzhou. Environ. Sci. Pollut. Res. 2019, 27, 37237–37259. [Google Scholar] [CrossRef]
- Wang, Y.; Yuan, Y.; Wang, Q.; Liu, C.; Zhi, Q.; Cao, J. Changes in air quality related to the control of coronavirus in China: Implications for traffic and industrial emissions. Sci. Total. Environ. 2020, 731, 139133. [Google Scholar] [CrossRef]
- Liu, L.; Li, J.; Yue, F.; Yan, X.; Wang, F.; Bloszies, S.; Wang, Y. Effects of arbuscular mycorrhizal inoculation and biochar amendment on maize growth, cadmium uptake and soil cadmium speciation in Cd-contaminated soil. Chemosphere 2018, 194, 495–503. [Google Scholar] [CrossRef] [PubMed]
- Yang, Y.; Liu, J.; Yao, J.; Kou, J.; Li, Z.; Wu, T.; Zhang, K.; Zhang, L.; Sun, H. Adsorption behaviors of shale oil in kerogen slit by molecular simulation. Chem. Eng. J. 2020, 387, 124054. [Google Scholar] [CrossRef]
- Liu, J.; Yi, Y.; Wang, X. Exploring factors influencing construction waste reduction: A structural equation modeling approach. J. Clean. Prod. 2020, 276, 123185. [Google Scholar] [CrossRef]
- Sun, L.; Li, C.; Zhang, C.; Liang, T.; Zhao, Z. The Strain Transfer Mechanism of Fiber Bragg Grating Sensor for Extra Large Strain Monitoring. Sensors 2019, 19, 1851. [Google Scholar] [CrossRef] [PubMed]
- Su, Z.; Liu, E.; Xu, Y.; Xie, P.; Shang, C.; Zhu, Q. Flow field and noise characteristics of manifold in natural gas transportation station. Oil Gas Sci. Technol. Rev. IFP 2019, 74, 70. [Google Scholar] [CrossRef]
- Liu, E.; Lv, L.; Yi, Y.; Xie, P. Research on the Steady Operation Optimization Model of Natural Gas Pipeline Considering the Combined Operation of Air Coolers and Compressors. IEEE Access 2019, 7, 83251–83265. [Google Scholar] [CrossRef]
- Keshtegar, B.; Heddam, S.; Sebbar, A.; Zhu, S.-P.; Trung, N.-T. SVR-RSM: A hybrid heuristic method for modeling monthly pan evaporation. Environ. Sci. Pollut. Res. 2019, 26, 35807–35826. [Google Scholar] [CrossRef] [PubMed]
- Ghaemi, A.; Rezaie-Balf, M.; Adamowski, J.; Kisi, O.; Quilty, J. On the applicability of maximum overlap discrete wavelet transform integrated with MARS and M5 model tree for monthly pan evaporation prediction. Agric. For. Meteorol. 2019, 278, 107647. [Google Scholar] [CrossRef]
- Kisi, O.; Heddam, S. Evaporation modelling by heuristic regression approaches using only temperature data. Hydrol. Sci. J. 2019, 64, 653–672. [Google Scholar] [CrossRef]
- Roy, D.K.; Barzegar, R.; Quilty, J.; Adamowski, J. Using ensembles of adaptive neuro-fuzzy inference system and optimization algorithms to predict reference evapotranspiration in subtropical climatic zones. J. Hydrol. 2020, 591, 125509. [Google Scholar] [CrossRef]
- Zhang, B.; Xu, D.; Liu, Y.; Li, F.; Cai, J.; Du, L. Multi-scale evapotranspiration of summer maize and the controlling meteorological factors in north China. Agric. For. Meteorol. 2016, 216, 1–12. [Google Scholar] [CrossRef]
- Chao, L.; Zhang, K.; Li, Z.; Zhu, Y.; Wang, J.; Yu, Z. Geographically weighted regression based methods for merging satellite and gauge precipitation. J. Hydrol. 2018, 558, 275–289. [Google Scholar] [CrossRef]
- Chen, Y.; He, L.; Guan, Y.; Lu, H.; Li, J. Life cycle assessment of greenhouse gas emissions and water-energy optimization for shale gas supply chain planning based on multi-level approach: Case study in Barnett, Marcellus, Fayetteville, and Haynesville shales. Energy Convers. Manag. 2017, 134, 382–398. [Google Scholar] [CrossRef]
- He, L.; Chen, Y.; Li, J. A three-level framework for balancing the tradeoffs among the energy, water, and air-emission implications within the life-cycle shale gas supply chains. Resour. Conserv. Recycl. 2018, 133, 206–228. [Google Scholar] [CrossRef]
- Lu, H.; Tian, P.; He, L. Evaluating the global potential of aquifer thermal energy storage and determining the potential worldwide hotspots driven by socio-economic, geo-hydrologic and climatic conditions. Renew. Sustain. Energy Rev. 2019, 112, 788–796. [Google Scholar] [CrossRef]
- Wu, C.; Wu, P.; Wang, J.; Jiang, R.; Chen, M.; Wang, X. Critical review of data-driven decision-making in bridge operation and maintenance. Struct. Infrastruct. Eng. 2020, 1–24. [Google Scholar] [CrossRef]
- Zhu, L.; Kong, L.; Zhang, C. Numerical Study on Hysteretic Behaviour of Horizontal-Connection and Energy-Dissipation Structures Developed for Prefabricated Shear Walls. Appl. Sci. 2020, 10, 1240. [Google Scholar] [CrossRef]
- Zhao, X.; Ye, Y.; Ma, J.; Shi, P.; Chen, H. Construction of electric vehicle driving cycle for studying electric vehicle energy consumption and equivalent emissions. Environ. Sci. Pollut. Res. 2020, 27, 37395–37409. [Google Scholar] [CrossRef]
- Deng, Y.; Zhang, T.; Sharma, B.K.; Nie, H. Optimization and mechanism studies on cell disruption and phosphorus recovery from microalgae with magnesium modified hydrochar in assisted hydrothermal system. Sci. Total. Environ. 2019, 646, 1140–1154. [Google Scholar] [CrossRef]
- Zhang, T.; Wu, X.; Fan, X.; Tsang, D.C.; Li, G.; Shen, Y. Corn waste valorization to generate activated hydrochar to recover ammonium nitrogen from compost leachate by hydrothermal assisted pretreatment. J. Environ. Manag. 2019, 236, 108–117. [Google Scholar] [CrossRef]
- Chen, Y.; Li, J.; Lu, H.; Yan, P. Coupling system dynamics analysis and risk aversion programming for optimizing the mixed noise-driven shale gas-water supply chains. J. Clean. Prod. 2021, 278, 123209. [Google Scholar] [CrossRef]
- Cheng, X.; He, L.; Lu, H.; Chen, Y.; Ren, L. Optimal water resources management and system benefit for the Marcellus shale-gas reservoir in Pennsylvania and West Virginia. J. Hydrol. 2016, 540, 412–422. [Google Scholar] [CrossRef]
- Li, L.-L.; Liu, Y.-W.; Tseng, M.-L.; Lin, G.-Q.; Ali, M.H. Reducing environmental pollution and fuel consumption using optimization algorithm to develop combined cooling heating and power system operation strategies. J. Clean. Prod. 2020, 247, 119082. [Google Scholar] [CrossRef]
- Qian, J.; Feng, S.; Tao, T.; Hu, Y.; Li, Y.; Chen, Q.; Zuo, C. Deep-learning-enabled geometric constraints and phase unwrapping for single-shot absolute 3D shape measurement. APL Photon 2020, 5, 46105. [Google Scholar] [CrossRef]
- Quan, Q.; Hao, Z.; Huang, X.; Lei, J. Research on water temperature prediction based on improved support vector regression. Neural Comput. Appl. 2020, 1–10. [Google Scholar] [CrossRef]
- Yang, M.; Sowmya, A. An Underwater Color Image Quality Evaluation Metric. IEEE Trans. Image Process. 2015, 24, 6062–6071. [Google Scholar] [CrossRef]
- Cao, B.; Fan, S.; Zhao, J.; Yang, P.; Muhammad, K.; Tanveer, M. Quantum-enhanced multiobjective large-scale optimization via parallelism. Swarm Evol. Comput. 2020, 57, 100697. [Google Scholar] [CrossRef]
- Qian, J.M.; Feng, S.; Li, Y.; Tao, T.; Han, J.; Chen, Q.; Zuo, C. Single-shot absolute 3D shape measurement with deep-learning-based color fringe projection profilometry. Opt. Lett. 2020, 45, 1842–1845. [Google Scholar] [CrossRef]
- Lyu, Z.; Chai, J.; Xu, Z.; Qin, Y.; Cao, J. A Comprehensive Review on Reasons for Tailings Dam Failures Based on Case History. Adv. Civ. Eng. 2019, 2019, 1–18. [Google Scholar] [CrossRef]
- Feng, W.; Lu, H.; Yao, T.; Yu, Q. Drought characteristics and its elevation dependence in the Qinghai–Tibet plateau during the last half-century. Sci. Rep. 2020, 10, 1–11. [Google Scholar] [CrossRef]
- Yan, J.; Pu, W.; Zhou, S.; Liu, H.; Bao, Z. Collaborative detection and power allocation framework for target tracking in multiple radar system. Inf. Fusion 2020, 55, 173–183. [Google Scholar] [CrossRef]
- Xiong, Z.; Tang, Z.; Chen, X.; Zhang, X.-M.; Zhang, K.; Ye, C. Research on Image Retrieval Algorithm Based on Combination of Color and Shape Features. J. Signal Process. Syst. 2019, 1–8. [Google Scholar] [CrossRef]
- Zhu, Q. Research on Road Traffic Situation Awareness System Based on Image Big Data. IEEE Intell. Syst. 2019, 35, 18–26. [Google Scholar] [CrossRef]
- Xu, S.; Wang, J.; Shou, W.; Ngo, T.; Sadick, A.-M.; Wang, X. Computer Vision Techniques in Construction: A Critical Review. Arch. Comput. Methods Eng. 2020, 1–15. [Google Scholar] [CrossRef]
- Sun, L.; Yang, Z.; Jin, Q.; Yan, W. Effect of Axial Compression Ratio on Seismic Behavior of GFRP Reinforced Concrete Columns. Int. J. Struct. Stab. Dyn. 2020, 20, 2040004. [Google Scholar] [CrossRef]
- Chao, M.; Kai, C.; Zhang, Z. Research on tobacco foreign body detection device based on machine vision. Trans. Inst. Meas. Control. 2020, 42, 2857–2871. [Google Scholar] [CrossRef]
- Liu, D.; Wang, S.; Huang, D.; Deng, G.; Zeng, F.; Chen, H. Medical image classification using spatial adjacent histogram based on adaptive local binary patterns. Comput. Biol. Med. 2016, 72, 185–200. [Google Scholar] [CrossRef] [PubMed]
- Abedini, M.; Mutalib, A.A.; Zhang, C.; Mehrmashhadi, J.; Raman, S.N.; Alipour, R.; Momeni, T.; Mussa, M.H. Large deflection behavior effect in reinforced concrete columns exposed to extreme dynamic loads. Front. Struct. Civ. Eng. 2020, 14, 532–553. [Google Scholar] [CrossRef]
- Yang, C.; Gao, F.; Dong, M. Energy Efficiency Modeling of Integrated Energy System in Coastal Areas. J. Coast. Res. 2020, 103, 995–1001. [Google Scholar] [CrossRef]
- Xiong, Z.; Xiao, N.; Xu, F.; Zhang, X.; Xu, Q.; Zhang, K.; Ye, C. An Equivalent Exchange Based Data Forwarding Incentive Scheme for Socially Aware Networks. J. Signal Process. Syst. 2020, 1–15. [Google Scholar] [CrossRef]
- Abedini, M.; Zhang, C. Performance Assessment of Concrete and Steel Material Models in LS-DYNA for Enhanced Numerical Simulation, A State of the Art Review. Arch. Comput. Methods Eng. 2020, 1–22. [Google Scholar] [CrossRef]
- Mou, B.; Li, X.; Bai, Y.; Wang, L. Shear Behavior of Panel Zones in Steel Beam-to-Column Connections with Unequal Depth of Outer Annular Stiffener. J. Struct. Eng. 2019, 145, 4018247. [Google Scholar] [CrossRef]
- Mou, B.; Zhao, F.; Qiao, Q.; Wang, L.; Li, H.; He, B.; Hao, Z. Flexural behavior of beam to column joints with or without an overlying concrete slab. Eng. Struct. 2019, 199, 109616. [Google Scholar] [CrossRef]
- Gholipour, G.; Zhang, C.; Mousavi, A.A. Numerical analysis of axially loaded RC columns subjected to the combination of impact and blast loads. Eng. Struct. 2020, 219, 110924. [Google Scholar] [CrossRef]
- Zhang, H.; Qu, S.; Li, H.; Luo, J.; Xu, W. A Moving Shadow Elimination Method Based on Fusion of Multi-Feature. IEEE Access 2020, 8, 63971–63982. [Google Scholar] [CrossRef]
- Yang, W.; Pudasainee, D.; Gupta, R.; Li, W.; Wang, B.; Sun, L. An overview of inorganic particulate matter emission from coal/biomass/MSW combustion: Sampling and measurement, formation, distribution, inorganic composition and influencing factors. Fuel Process. Technol. 2020, 213, 106657. [Google Scholar] [CrossRef]
- Zhang, C.-W.; Ou, J.-P.; Zhang, J.-Q. Parameter optimization and analysis of a vehicle suspension system controlled by magnetorheological fluid dampers. Struct. Control. Health Monit. 2006, 13, 885–896. [Google Scholar] [CrossRef]
- Yue, H.; Wang, H.; Chen, H.; Cai, K.; Jin, Y. Automatic detection of feather defects using Lie group and fuzzy Fisher criterion for shuttlecock production. Mech. Syst. Signal Process. 2020, 141, 106690. [Google Scholar] [CrossRef]
- Zhu, G.; Wang, S.; Sun, L.; Ge, W.; Zhang, X. Output Feedback Adaptive Dynamic Surface Sliding-Mode Control for Quadrotor UAVs with Tracking Error Constraints. Complexity 2020, 2020, 8537198. [Google Scholar] [CrossRef]
- Xiong, Q.; Zhang, X.; Wang, W.-F.; Gu, Y. A Parallel Algorithm Framework for Feature Extraction of EEG Signals on MPI. Comput. Math. Methods Med. 2020, 2020, 9812019. [Google Scholar] [CrossRef] [PubMed]
- Zhang, J.; Liu, B. A review on the recent developments of sequence-based protein feature extraction methods. Curr. Bioinform. 2019, 14, 190–199. [Google Scholar] [CrossRef]
- Zhang, X.; Fan, M.; Wang, D.; Zhou, P.; Tao, D. Top-k Feature Selection Framework Using Robust 0-1 Integer Programming. IEEE Trans. Neural Netw. Learn. Syst. 2020, 1–15. [Google Scholar] [CrossRef]
- Zhao, X.; Li, D.; Yang, B.; Chen, H.; Yang, X.; Yu, C.; Liu, S. A two-stage feature selection method with its application. Comput. Electr. Eng. 2015, 47, 114–125. [Google Scholar] [CrossRef]
- Cao, B.; Zhao, J.; Lv, Z.; Gu, Y.; Yang, P.; Halgamuge, S.K. Multiobjective Evolution of Fuzzy Rough Neural Network via Distributed Parallelism for Stock Prediction. IEEE Trans. Fuzzy Syst. 2020, 28, 939–952. [Google Scholar] [CrossRef]
- Shi, K.; Wang, J.; Tang, Y.; Zhong, S. Reliable asynchronous sampled-data filtering of T–S fuzzy uncertain delayed neural networks with stochastic switched topologies. Fuzzy Sets Syst. 2020, 381, 1–25. [Google Scholar] [CrossRef]
- Shi, K.; Wang, J.; Zhong, S.; Tang, Y.; Cheng, J. Non-fragile memory filtering of T-S fuzzy delayed neural networks based on switched fuzzy sampled-data control. Fuzzy Sets Syst. 2020, 394, 40–64. [Google Scholar] [CrossRef]
- Yang, S.; Deng, B.; Wang, J.; Li, H.; Lu, M.; Che, Y.; Wei, X.; Loparo, K.A. Scalable Digital Neuromorphic Architecture for Large-Scale Biophysically Meaningful Neural Network With Multi-Compartment Neurons. IEEE Trans. Neural Netw. Learn. Syst. 2020, 31, 148–162. [Google Scholar] [CrossRef]
- Hornik, K.; Stinchcombe, M.; White, H. Multilayer feedforward networks are universal approximators. Neural Netw. 1989, 2, 359–366. [Google Scholar] [CrossRef]
- Lv, Z.; Qiao, L. Deep belief network and linear perceptron based cognitive computing for collaborative robots. Appl. Soft Comput. 2020, 92, 106300. [Google Scholar] [CrossRef]
- Adeli, H. Neural Networks in Civil Engineering: 1989–2000. Comput. Civ. Infrastruct. Eng. 2001, 16, 126–142. [Google Scholar] [CrossRef]
- Xu, M.; Li, T.; Wang, Z.; Deng, X.; Yang, R.; Guan, Z. Reducing Complexity of HEVC: A Deep Learning Approach. IEEE Trans. Image Process. 2018, 27, 5044–5059. [Google Scholar] [CrossRef] [PubMed]
- Li, T.; Xu, M.; Zhu, C.; Yang, R.; Wang, Z.; Guan, Z. A Deep Learning Approach for Multi-Frame In-Loop Filter of HEVC. IEEE Trans. Image Process. 2019, 28, 5663–5678. [Google Scholar] [CrossRef] [PubMed]
- Qiu, T.; Shi, X.; Wang, J.; Li, Y.; Qu, S.; Cheng, Q.; Cui, T.; Sui, S. Deep Learning: A Rapid and Efficient Route to Automatic Metasurface Design. Adv. Sci. 2019, 6, 1900128. [Google Scholar] [CrossRef] [PubMed]
- Chen, H.-L.; Wang, G.; Ma, C.; Cai, Z.-N.; Liu, W.-B.; Wang, S.-J. An efficient hybrid kernel extreme learning machine approach for early diagnosis of Parkinson׳s disease. Neurocomputing 2016, 184, 131–144. [Google Scholar] [CrossRef]
- Hu, L.; Hong, G.; Ma, J.; Wang, X.; Chen, H. An efficient machine learning approach for diagnosis of paraquat-poisoned patients. Comput. Biol. Med. 2015, 59, 116–124. [Google Scholar] [CrossRef]
- Wang, S.-J.; Chen, H.-L.; Yan, W.-J.; Chen, Y.-H.; Fu, X. Face Recognition and Micro-expression Recognition Based on Discriminant Tensor Subspace Analysis Plus Extreme Learning Machine. Neural Process. Lett. 2013, 39, 25–43. [Google Scholar] [CrossRef]
- Xia, J.; Chen, H.; Li, Q.; Zhou, M.; Chen, L.; Cai, Z.; Fang, Y.; Zhou, H. Ultrasound-based differentiation of malignant and benign thyroid Nodules: An extreme learning machine approach. Comput. Methods Progr. Biomed. 2017, 147, 37–49. [Google Scholar] [CrossRef] [PubMed]
- Li, Q.; Meng, Q.; Cai, J.; Yoshino, H.; Mochida, A. Applying support vector machine to predict hourly cooling load in the building. Appl. Energy 2009, 86, 2249–2256. [Google Scholar] [CrossRef]
- Urdaneta, S.; Zapata, E.; Contreras, J. Fuzzy Model for Estimation of Energy Performance of Residential Buildings. Int. J. Appl. Eng. Res. 2017, 12, 2766–2771. [Google Scholar]
- Fan, C.; Xiao, F.; Zhao, Y. A short-term building cooling load prediction method using deep learning algorithms. Appl. Energy 2017, 195, 222–233. [Google Scholar] [CrossRef]
- Xie, L. The Heat load Prediction Model based on BP Neural Network-markov Model. Procedia Comput. Sci. 2017, 107, 296–300. [Google Scholar] [CrossRef]
- Chou, J.-S.; Bui, D.-K. Modeling heating and cooling loads by artificial intelligence for energy-efficient building design. Energy Build. 2014, 82, 437–446. [Google Scholar] [CrossRef]
- Roy, S.S.; Roy, R.; Balas, V.E. Estimating heating load in buildings using multivariate adaptive regression splines, extreme learning machine, a hybrid model of MARS and ELM. Renew. Sustain. Energy Rev. 2018, 82, 4256–4268. [Google Scholar] [CrossRef]
- Sholahudin, S.; Han, H. Simplified dynamic neural network model to predict heating load of a building using Taguchi method. Energy 2016, 115, 1672–1678. [Google Scholar] [CrossRef]
- Tsanas, A.; Xifara, A. Accurate quantitative estimation of energy performance of residential buildings using statistical machine learning tools. Energy Build. 2012, 49, 560–567. [Google Scholar] [CrossRef]
- Gao, W.; Alsarraf, J.; Moayedi, H.; Shahsavar, A.; Nguyen, H. Comprehensive preference learning and feature validity for designing energy-efficient residential buildings using machine learning paradigms. Appl. Soft Comput. 2019, 84, 105748. [Google Scholar] [CrossRef]
- Nilashi, M.; Dalvi-Esfahani, M.; Ibrahim, O.; Bagherifard, K.; Mardani, A.; Zakuan, N. A soft computing method for the prediction of energy performance of residential buildings. Measurement 2017, 109, 268–280. [Google Scholar] [CrossRef]
- Moayedi, H.; Hayati, S. Artificial intelligence design charts for predicting friction capacity of driven pile in clay. Neural Comput. Appl. 2019, 31, 7429–7445. [Google Scholar] [CrossRef]
- Fu, X.; Pace, P.; Aloi, G.; Yang, L.; Fortino, G. Topology optimization against cascading failures on wireless sensor networks using a memetic algorithm. Comput. Netw. 2020, 177, 107327. [Google Scholar] [CrossRef]
- Moayedi, H.; Nguyen, H.; Foong, L.K. Nonlinear evolutionary swarm intelligence of grasshopper optimization algorithm and gray wolf optimization for weight adjustment of neural network. Eng. Comput. 2019, 1–11. [Google Scholar] [CrossRef]
- Amar, M.N.; Zeraibi, N. A combined support vector regression with firefly algorithm for prediction of bottom hole pressure. SN Appl. Sci. 2020, 2, 1–12. [Google Scholar]
- Le, L.T.; Nguyen, H.; Dou, J.; Zhou, J. A Comparative Study of PSO-ANN, GA-ANN, ICA-ANN, and ABC-ANN in Estimating the Heating Load of Buildings’ Energy Efficiency for Smart City Planning. Appl. Sci. 2019, 9, 2630. [Google Scholar] [CrossRef]
- Cao, B.; Dong, W.; Lv, Z.; Gu, Y.; Singh, S.; Kumar, P. Hybrid Microgrid Many-Objective Sizing Optimization With Fuzzy Decision. IEEE Trans. Fuzzy Syst. 2020, 28, 2702–2710. [Google Scholar] [CrossRef]
- Cao, B.; Wang, X.; Zhang, W.; Song, H.; Lv, Z. A Many-Objective Optimization Model of Industrial Internet of Things Based on Private Blockchain. IEEE Netw. 2020, 34, 78–83. [Google Scholar] [CrossRef]
- Cao, B.; Zhao, J.; Yang, P.; Gu, Y.; Muhammad, K.; Rodrigues, J.J.P.C.; De Albuquerque, V.H.C. Multiobjective 3-D Topology Optimization of Next-Generation Wireless Data Center Network. IEEE Trans. Ind. Informatics 2020, 16, 3597–3605. [Google Scholar] [CrossRef]
- Qu, S.; Han, Y.; Wu, Z.; Raza, H. Consensus Modeling with Asymmetric Cost Based on Data-Driven Robust Optimization. Group Decis. Negot. 2020, 1–38. [Google Scholar] [CrossRef]
- Roberts, A.; Marsh, A. ECOTECT: Environmental Prediction in Architectural Education; Cardiff University: Cardiff, UK, 2001. [Google Scholar]
- McCulloch, W.; Pitts, W. A Logical Calculus of the Ideas Immanent in Nervous Activity (1943). Ideas That Creat. Future 2021, 5, 79–88. [Google Scholar] [CrossRef]
- Seyedashraf, O.; Mehrabi, M.; Akhtari, A.A. Novel approach for dam break flow modeling using computational intelligence. J. Hydrol. 2018, 559, 1028–1038. [Google Scholar] [CrossRef]
- Moayedi, H.; Mehrabi, M.; Mosallanezhad, M.; Rashid, A.S.A.; Pradhan, B. Modification of landslide susceptibility mapping using optimized PSO-ANN technique. Eng. Comput. 2019, 35, 967–984. [Google Scholar] [CrossRef]
- Hornik, K. Approximation capabilities of multilayer feedforward networks. Neural Netw. 1991, 4, 251–257. [Google Scholar] [CrossRef]
- Orr, M.J. Introduction to Radial Basis Function Networks; Technical Report; Center for Cognitive Science, University of Edinburgh: Edinburgh, UK, 1996. [Google Scholar]
- Specht, D. A general regression neural network. IEEE Trans. Neural Netw. 1991, 2, 568–576. [Google Scholar] [CrossRef]
- Marquardt, D.W. An Algorithm for Least-Squares Estimation of Nonlinear Parameters. J. Soc. Ind. Appl. Math. 1963, 11, 431–441. [Google Scholar] [CrossRef]
- El-Bakry, M. Feed forward neural networks modeling for K–P interactions. Chaos Solitons Fractals 2003, 18, 995–1000. [Google Scholar] [CrossRef]
- Cigizoglu, H.K.; Kişi, Ö. Flow prediction by three back propagation techniques using k-fold partitioning of neural network training data. Hydrol. Res. 2005, 36, 49–64. [Google Scholar] [CrossRef]
- Mirjalili, S. The Ant Lion Optimizer. Adv. Eng. Softw. 2015, 83, 80–98. [Google Scholar] [CrossRef]
- Simon, D. Biogeography-Based Optimization. IEEE Trans. Evol. Comput. 2008, 12, 702–713. [Google Scholar] [CrossRef]
- Mirjalili, S.; Mirjalili, S.M.; Lewis, A. Let a biogeography-based optimizer train your multi-layer perceptron. Inf. Sci. 2014, 269, 188–209. [Google Scholar] [CrossRef]
- Mirjalili, S. Dragonfly algorithm: A new meta-heuristic optimization technique for solving single-objective, discrete, and multi-objective problems. Neural Comput. Appl. 2016, 27, 1053–1073. [Google Scholar] [CrossRef]
- Schwefel, H.-P.P. Evolution and Optimum Seeking: The Sixth Generation; John Wiley & Sons, Inc.: Hoboken, NJ, USA, 1993. [Google Scholar]
- Mehrabian, A.; Lucas, C. A novel numerical optimization algorithm inspired from weed colonization. Ecol. Inform. 2006, 1, 355–366. [Google Scholar] [CrossRef]
- Kashan, A.H. League Championship Algorithm: A New Algorithm for Numerical Function Optimization. In Proceedings of the 2009 International Conference of Soft Computing and Pattern Recognition, Malacca, Malaysia, 4–7 December 2009; IEEE: New York, NY, USA, 2009; pp. 43–48. [Google Scholar]
- Spoljaric, T.; Pavic, I. Performance analysis of an ant lion optimizer in tuning generators’ excitation controls in multi machine power system. In Proceedings of the 2018 41st International Convention on Information and Communication Technology, Electronics and Microelectronics (MIPRO), Opatija, Croatia, 21–25 May 2018; IEEE: New York, NY, USA, 2018; pp. 1040–1045. [Google Scholar]
- Kose, U. An Ant-Lion Optimizer-Trained Artificial Neural Network System for Chaotic Electroencephalogram (EEG) Prediction. Appl. Sci. 2018, 8, 1613. [Google Scholar] [CrossRef]
- Bhattacharya, A.; Chattopadhyay, P.K. Solving complex economic load dispatch problems using biogeography-based optimization. Expert Syst. Appl. 2010, 37, 3605–3615. [Google Scholar] [CrossRef]
- Vanishree, J.; Ramesh, V. Optimization of size and cost of static var compensator using dragonfly algorithm for voltage profile improvement in power transmission systems. Int. J. Renew. Energy Res. 2018, 8, 56–66. [Google Scholar]
- Yuan, C.; Moayedi, H. The performance of six neural-evolutionary classification techniques combined with multi-layer perception in two-layered cohesive slope stability analysis and failure recognition. Eng. Comput. 2020, 36, 1705–1714. [Google Scholar] [CrossRef]
- Ghasemi, M.; Ghavidel, S.; Akbari, E.; Vahed, A.A. Solving non-linear, non-smooth and non-convex optimal power flow problems using chaotic invasive weed optimization algorithms based on chaos. Energy 2014, 73, 340–353. [Google Scholar] [CrossRef]
- Kashan, A.H. League Championship Algorithm (LCA): An algorithm for global optimization inspired by sport championships. Appl. Soft Comput. 2014, 16, 171–200. [Google Scholar] [CrossRef]
- Kashan, A.H. An efficient algorithm for constrained global optimization and application to mechanical engineering design: League championship algorithm (LCA). Comput. Des. 2011, 43, 1769–1792. [Google Scholar] [CrossRef]
- Heidari, A.A.; Mirjalili, S.; Faris, H.; Aljarah, I.; Mafarja, M.; Chen, H. Harris hawks optimization: Algorithm and applications. Future Gener. Comput. Syst. 2019, 97, 849–872. [Google Scholar] [CrossRef]
- Mirjalili, S.; Mirjalili, S.M.; Lewis, A. Grey wolf optimizer. Adv. Eng. Softw. 2014, 69, 46–61. [Google Scholar] [CrossRef]
- Mirjalili, S.; Lewis, A. The Whale Optimization Algorithm. Adv. Eng. Softw. 2016, 95, 51–67. [Google Scholar] [CrossRef]
- Karaboga, D. An Idea Based on Honey Bee Swarm for Numerical Optimization; Technical Report; Citeseer Technical Report-tr06; Erciyes University, Engineering Faculty, Computer Engineering Department Kayseri Turkey: Kayseri, Turkey, 2005. [Google Scholar]
- Colorni, A.; Dorigo, M.; Maniezzo, V. Distributed optimization by ant colonies. In Proceedings of the First European Conference on Artificial Life, Paris, France, 11 December 1991; MIT Press: Cambridge, MA, USA, 1992; pp. 134–142. [Google Scholar]
- Wang, G.-G.; Deb, S.; Coelho, L.D.S. Elephant herding optimization. In Proceedings of the 2015 3rd International Symposium on Computational and Business Intelligence (ISCBI), Bali, Indonesia, 7–9 December 2015; IEEE: New York, NY, USA, 2015; pp. 1–5. [Google Scholar]
- Holland, J.H. Adaptation in Natural and Artificial Systems: An Introductory Analysis with Applications to Biology, Control, and Artificial Intelligence; University of Michigan Press: Ann Arbor, MI, USA, 1975. [Google Scholar]
- Atashpaz-Gargari, E.; Lucas, C. Imperialist competitive algorithm: An algorithm for optimization inspired by imperialistic competition. In Proceedings of the 2007 IEEE Congress on Evolutionary Computation, Singapore, 25–28 September 2007. [Google Scholar] [CrossRef]
- Kennedy, J.; Eberhart, R. Particle swarm optimization. In Proceedings of the ICNN’95—International Conference on Neural Networks, 27 November–1 December 1995; IEEE: New York, NY, USA, 1995; Volume 4, pp. 1942–1948. [Google Scholar]
- Bayraktar, Z.; Komurcu, M.; Werner, D.H. Wind Driven Optimization (WDO): A novel nature-inspired optimization algorithm and its application to electromagnetics. In Proceedings of the 2010 IEEE Antennas and Propagation Society International Symposium, Toronto, ON, Canada, 11–17 July 2010; IEEE: New York, NY, USA, 2010; pp. 1–4. [Google Scholar]
- Deng, H.; Fannon, D.; Eckelman, M.J. Predictive modeling for US commercial building energy use: A comparison of existing statistical and machine learning algorithms using CBECS microdata. Energy Build. 2018, 163, 34–43. [Google Scholar] [CrossRef]


Publisher’s Note: MDPI stays neutral with regard to jurisdictional claims in published maps and institutional affiliations. |
© 2021 by the authors. Licensee MDPI, Basel, Switzerland. This article is an open access article distributed under the terms and conditions of the Creative Commons Attribution (CC BY) license (http://creativecommons.org/licenses/by/4.0/).