
Electric Vehicles in Jordan: Challenges and Limitations

 , ,
, ,
Abstract
1. Introduction
2. Overview of the Electric Vehicles in Jordan
3. The Jordanian Distribution System
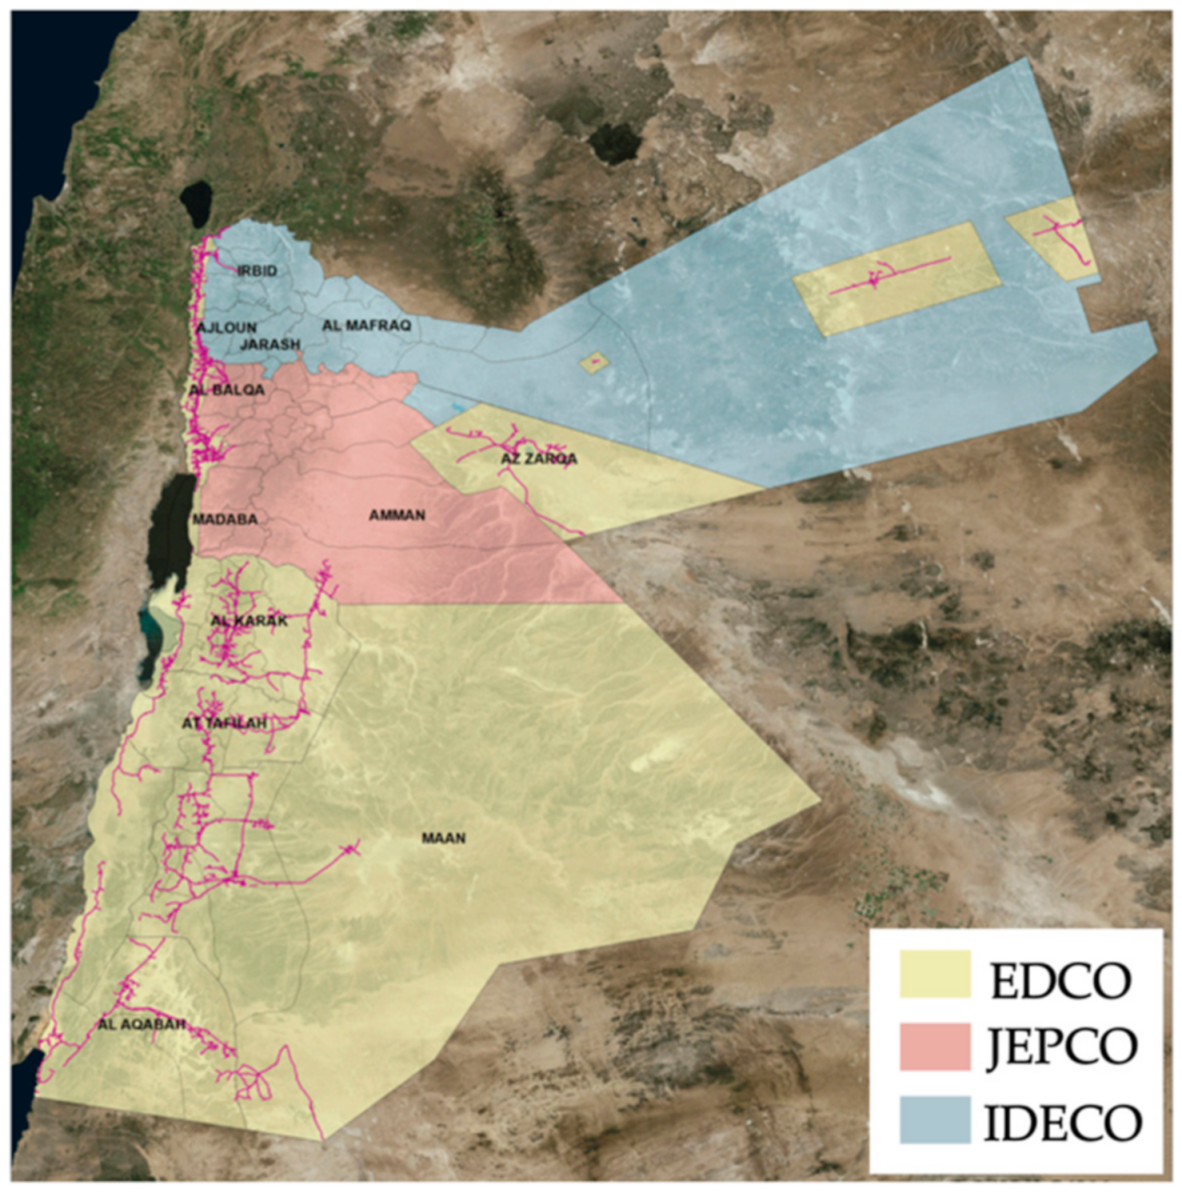
3.1. Overview
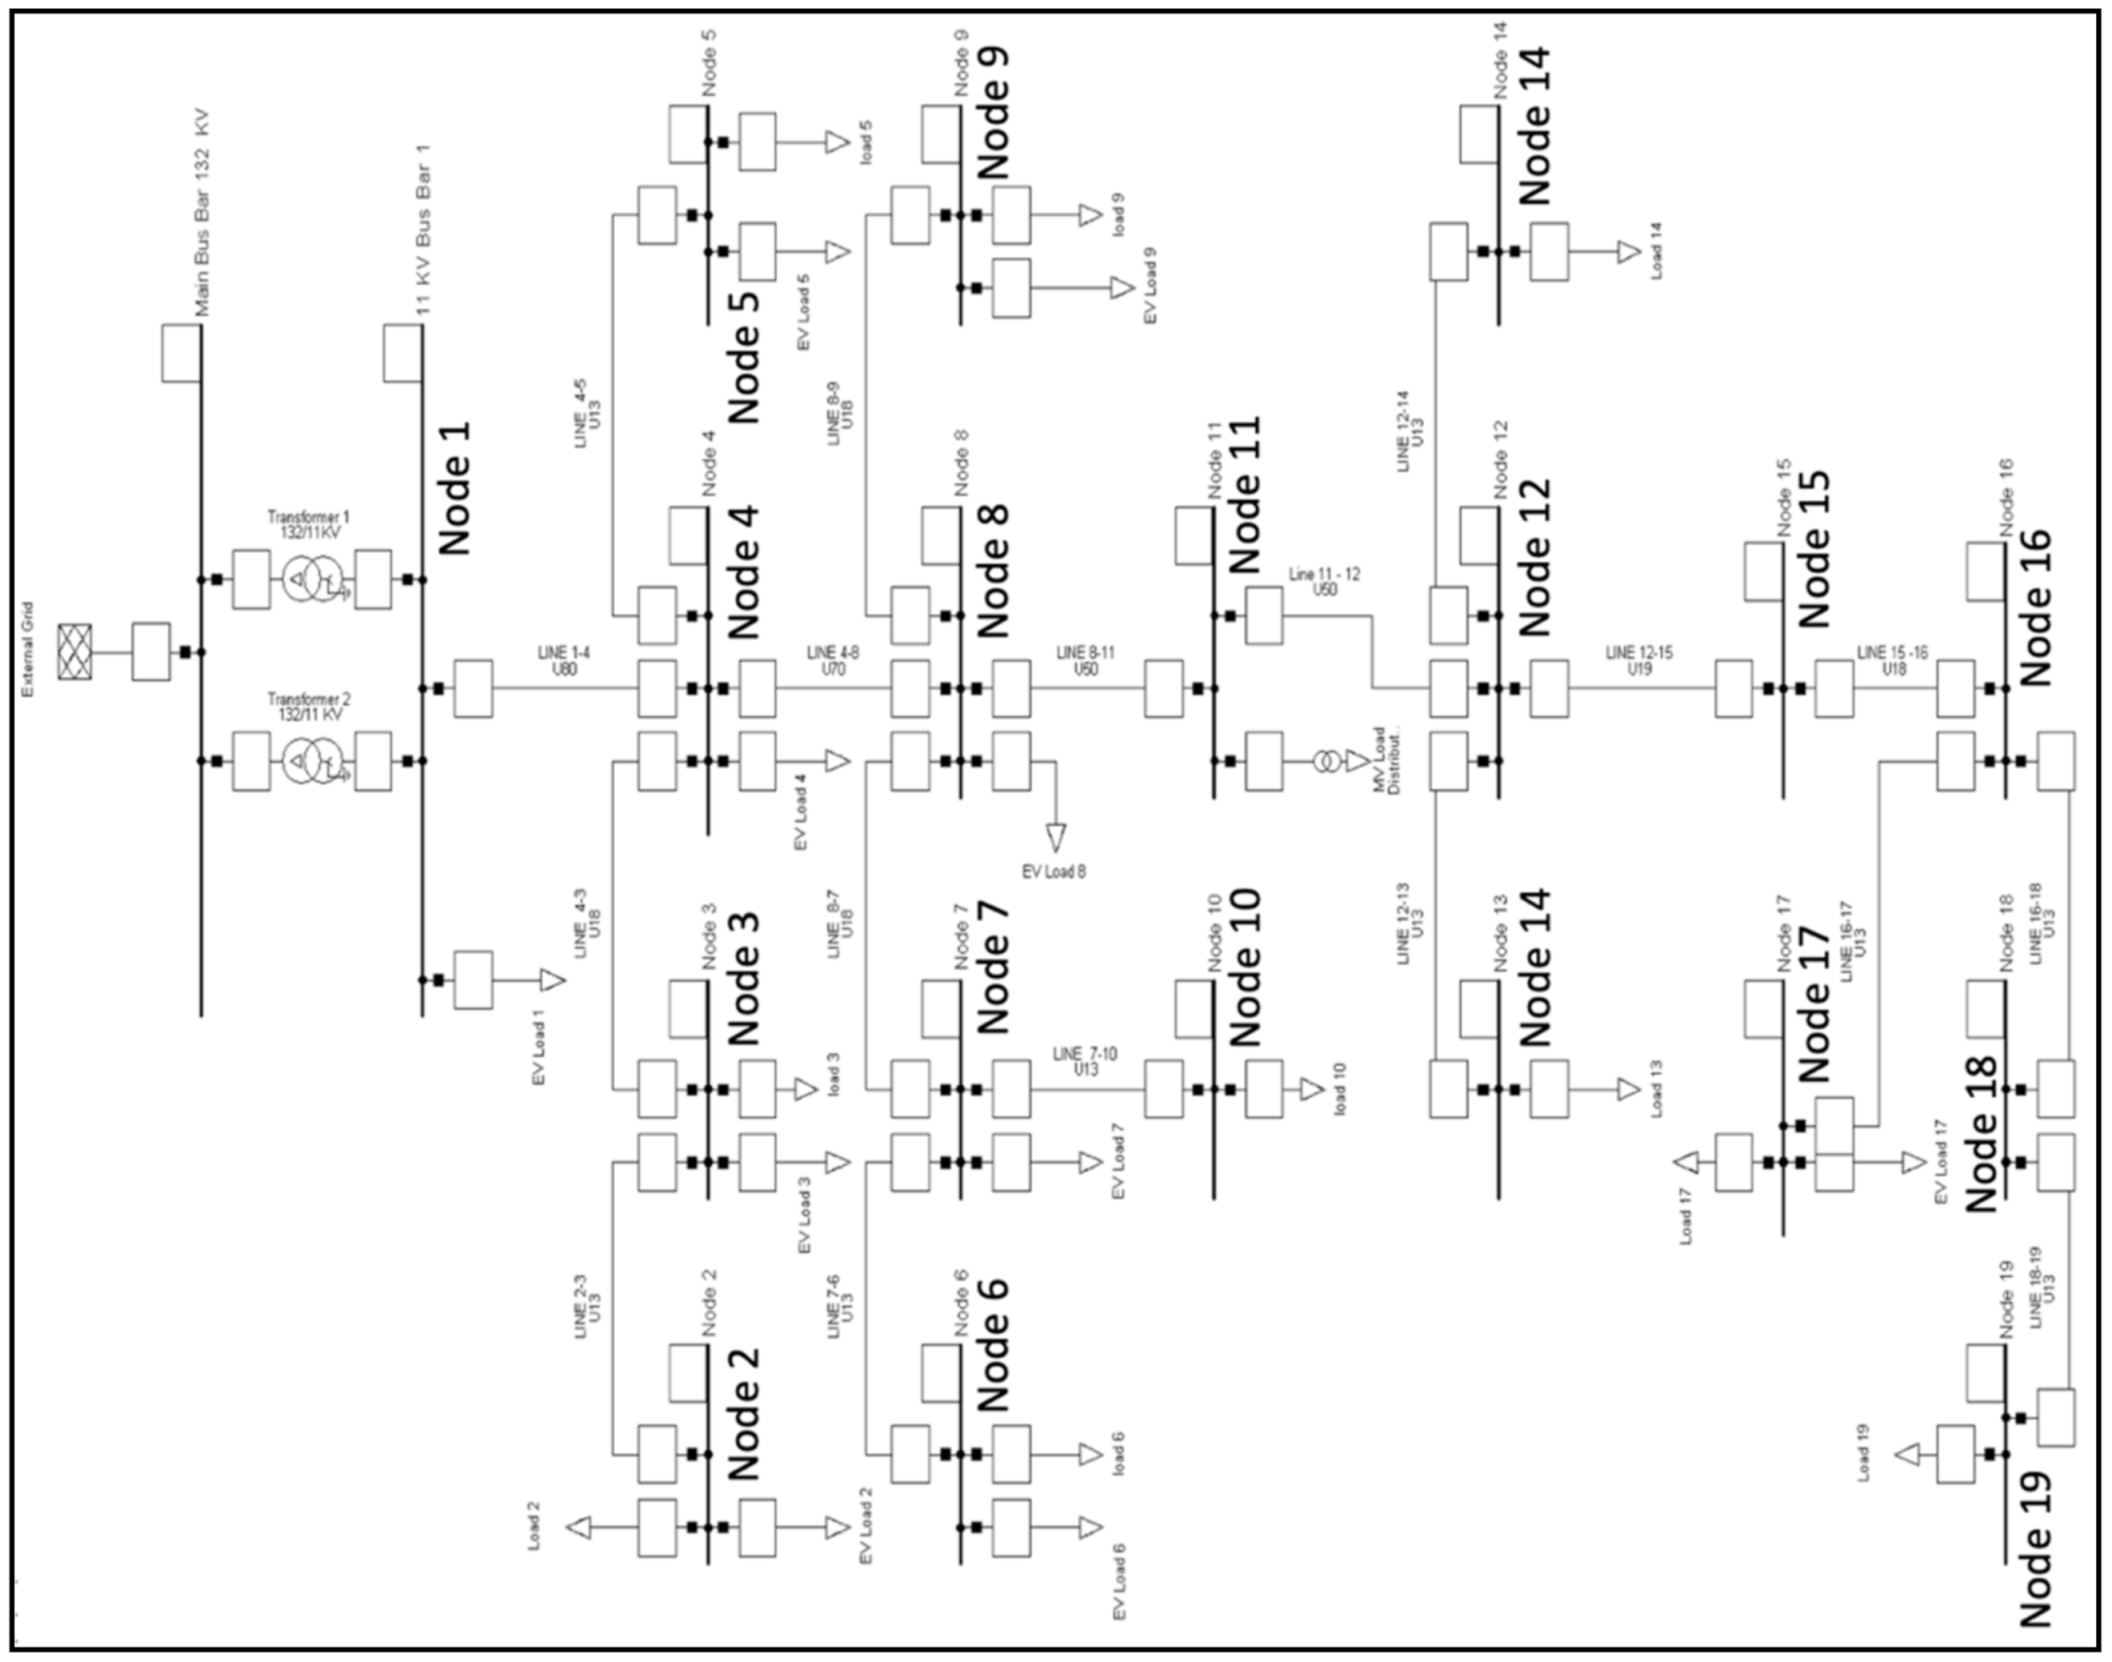
3.2. The 19-Node Distribution System (Case Study)
3.2.1. Transformers
3.2.2. Distribution Lines
3.2.3. Electrical Loads
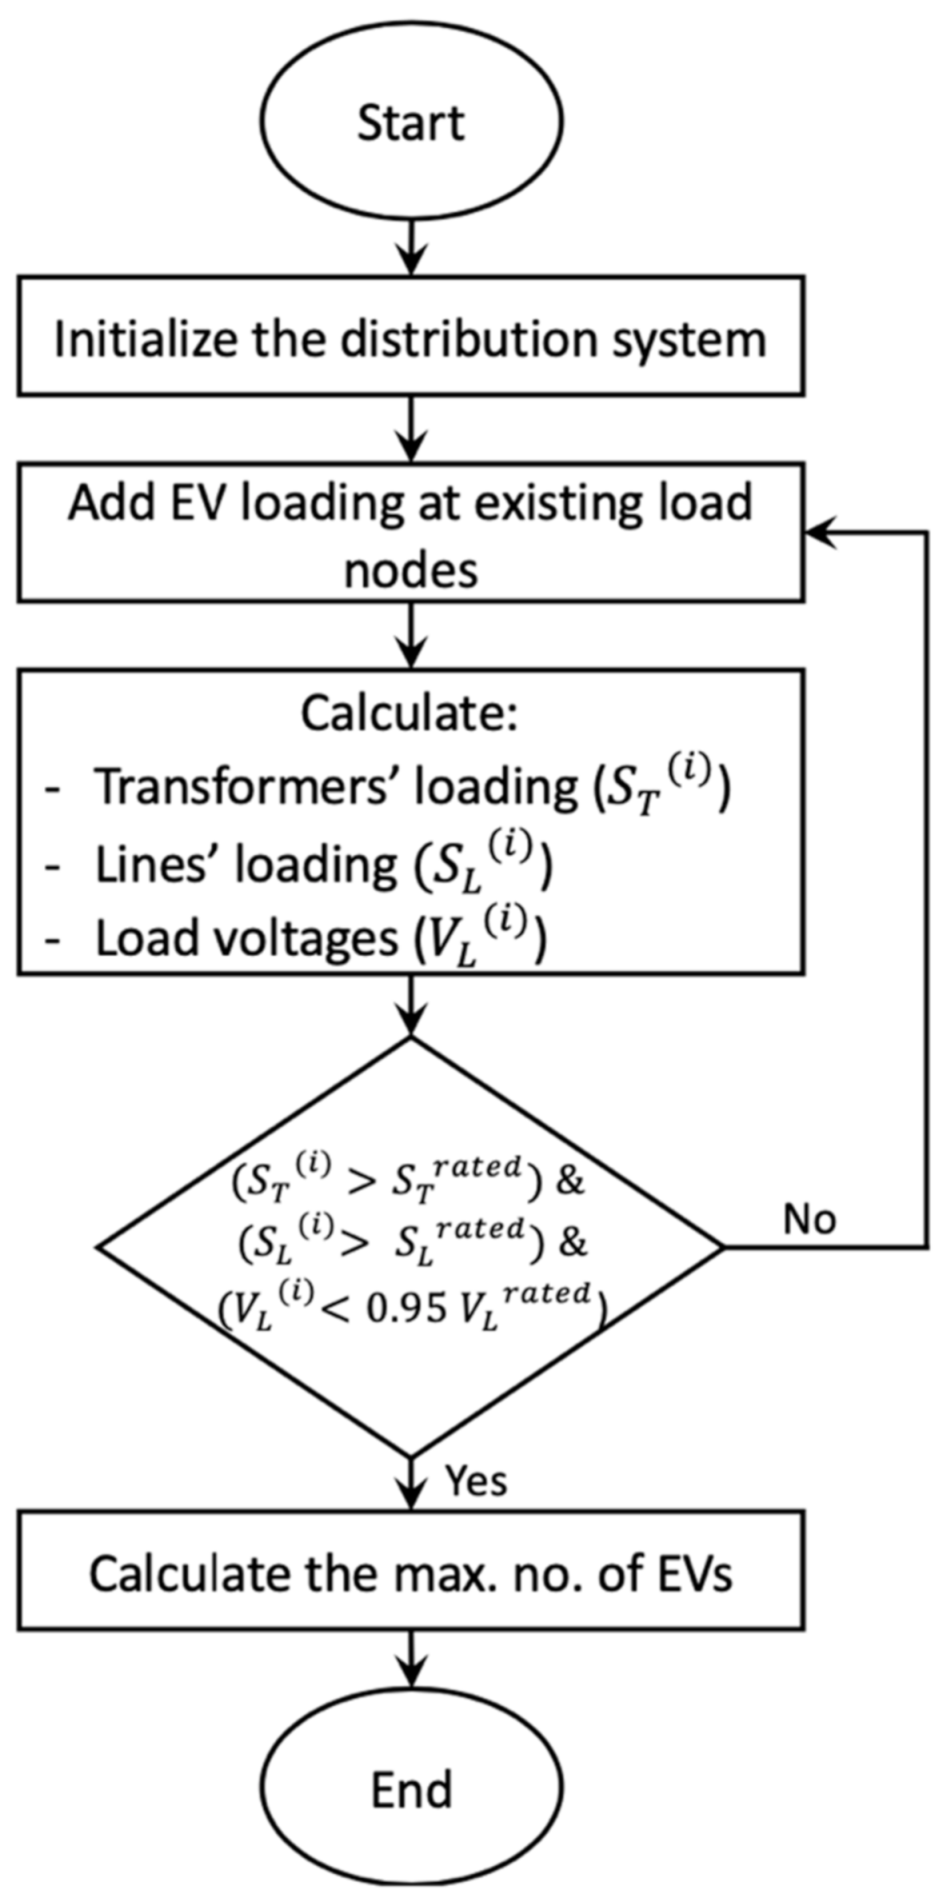
4. Results and Discussion
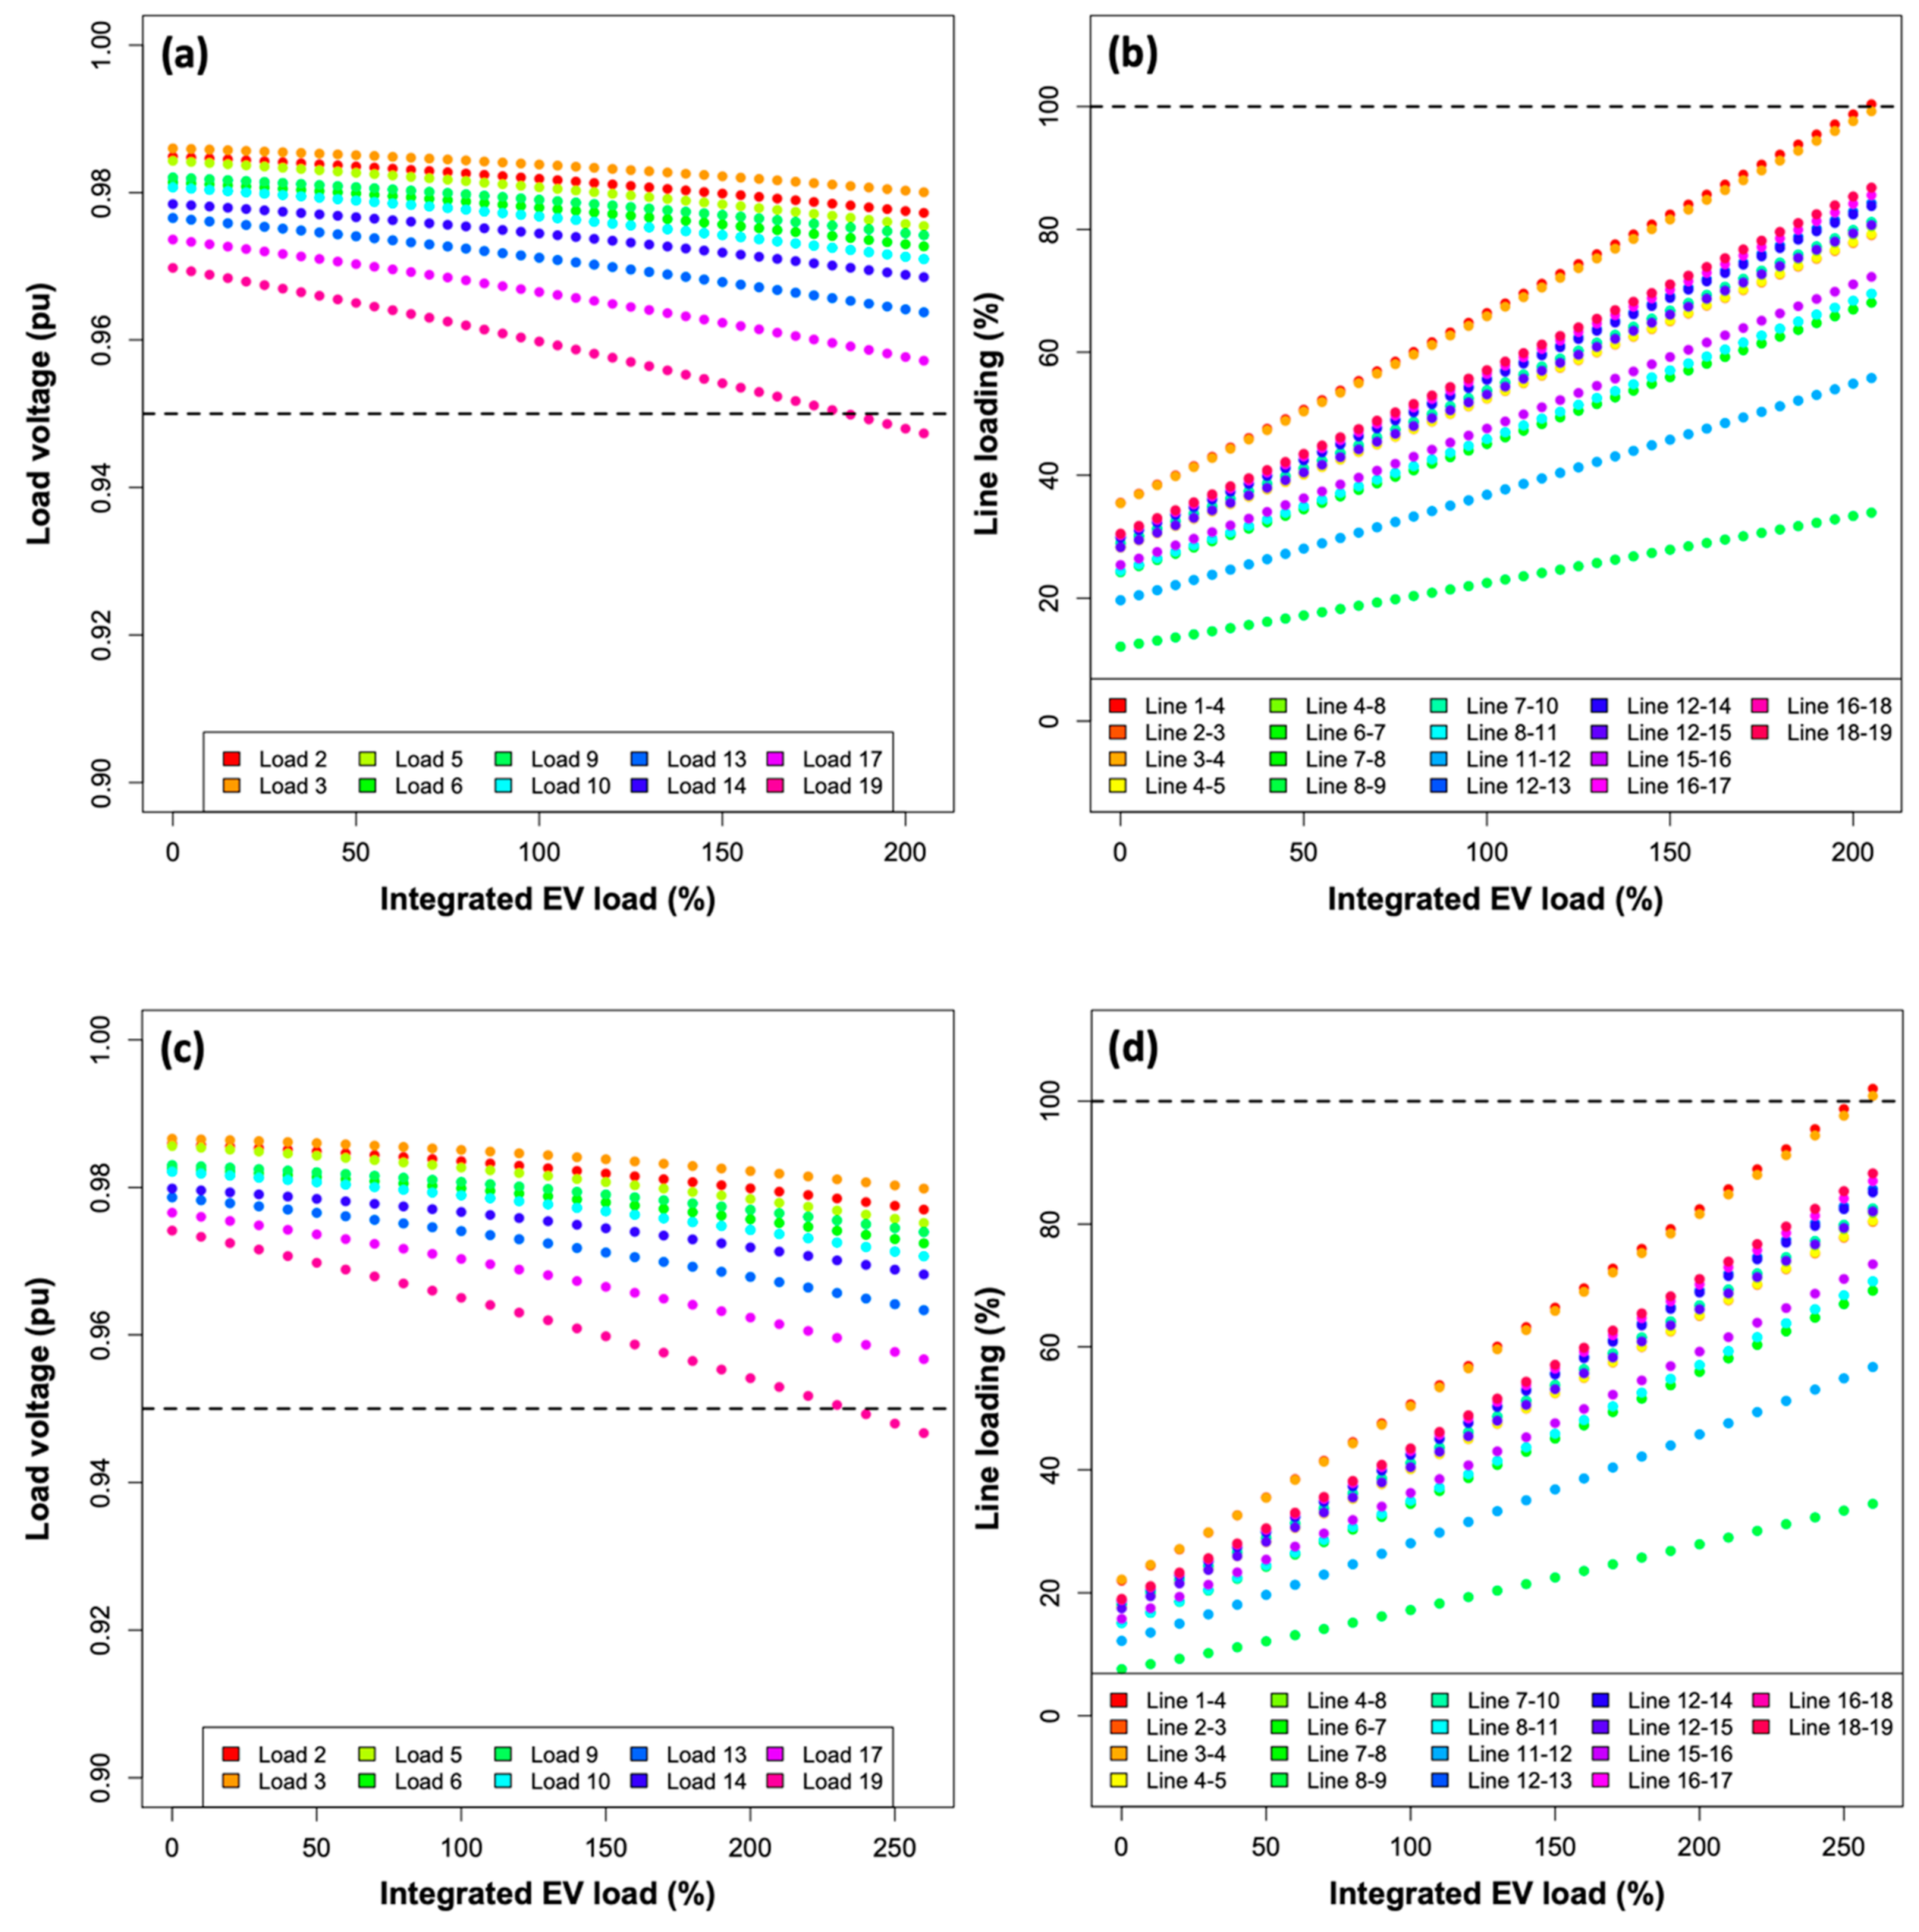
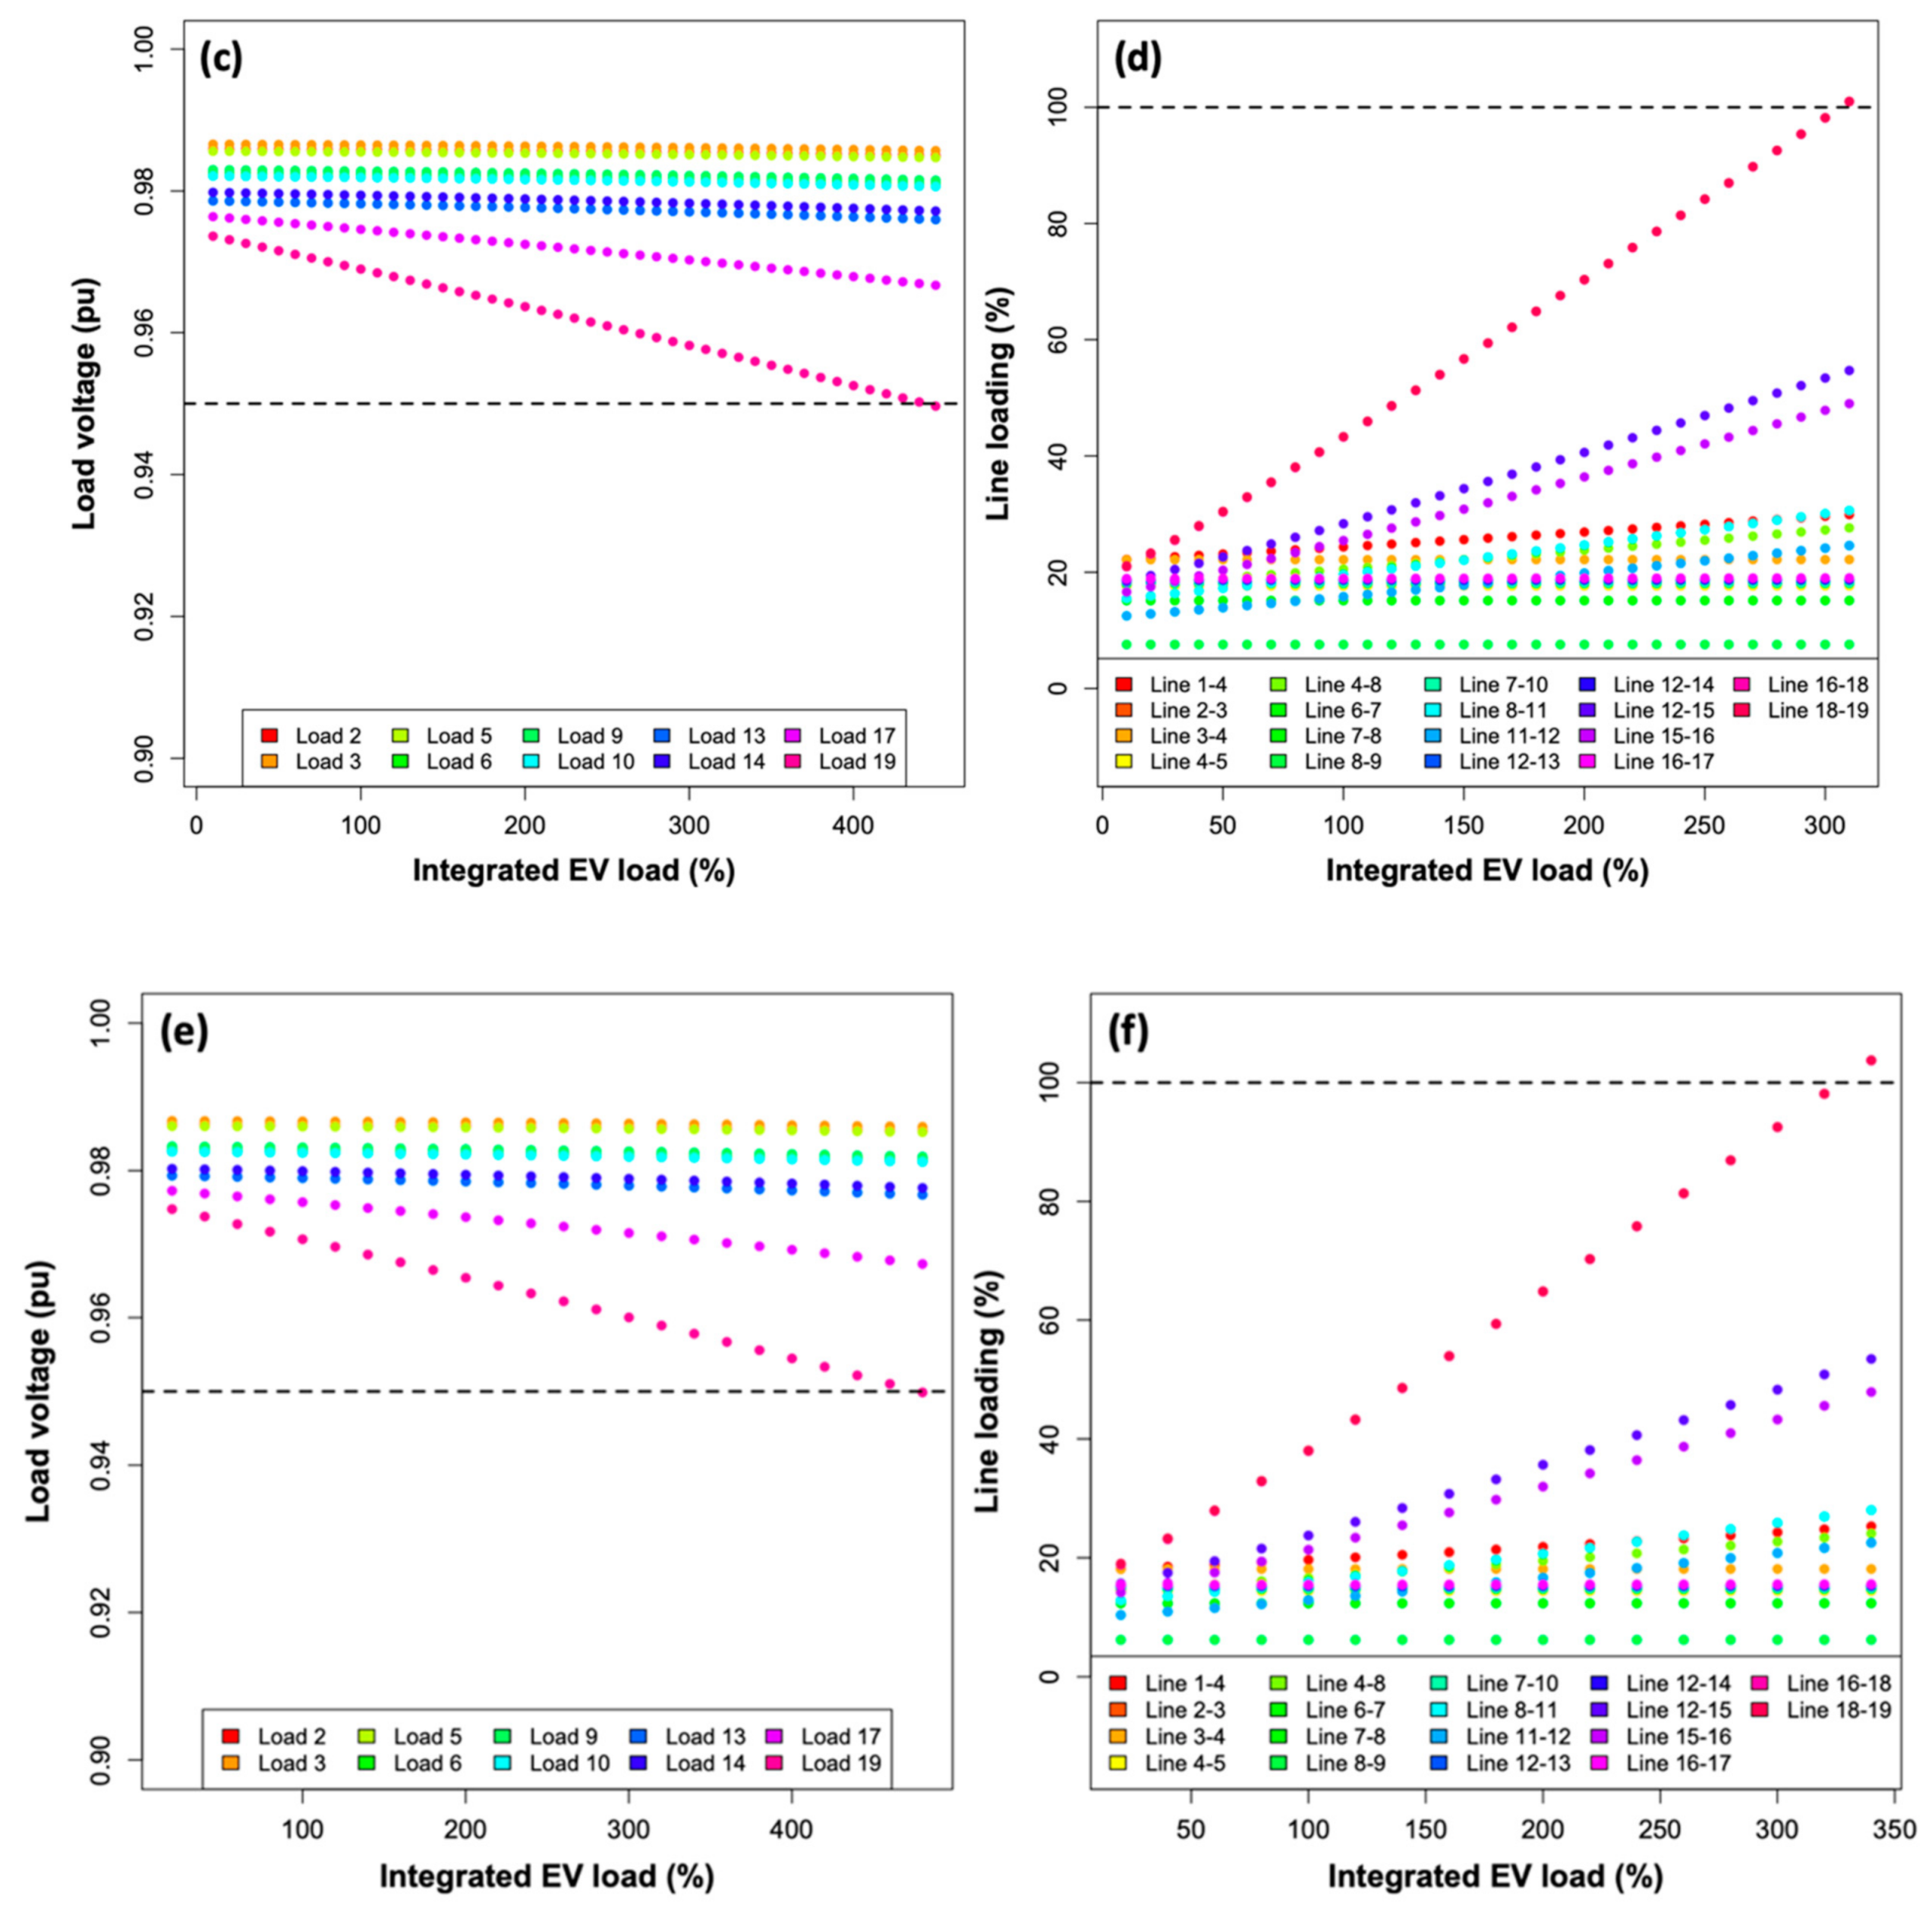
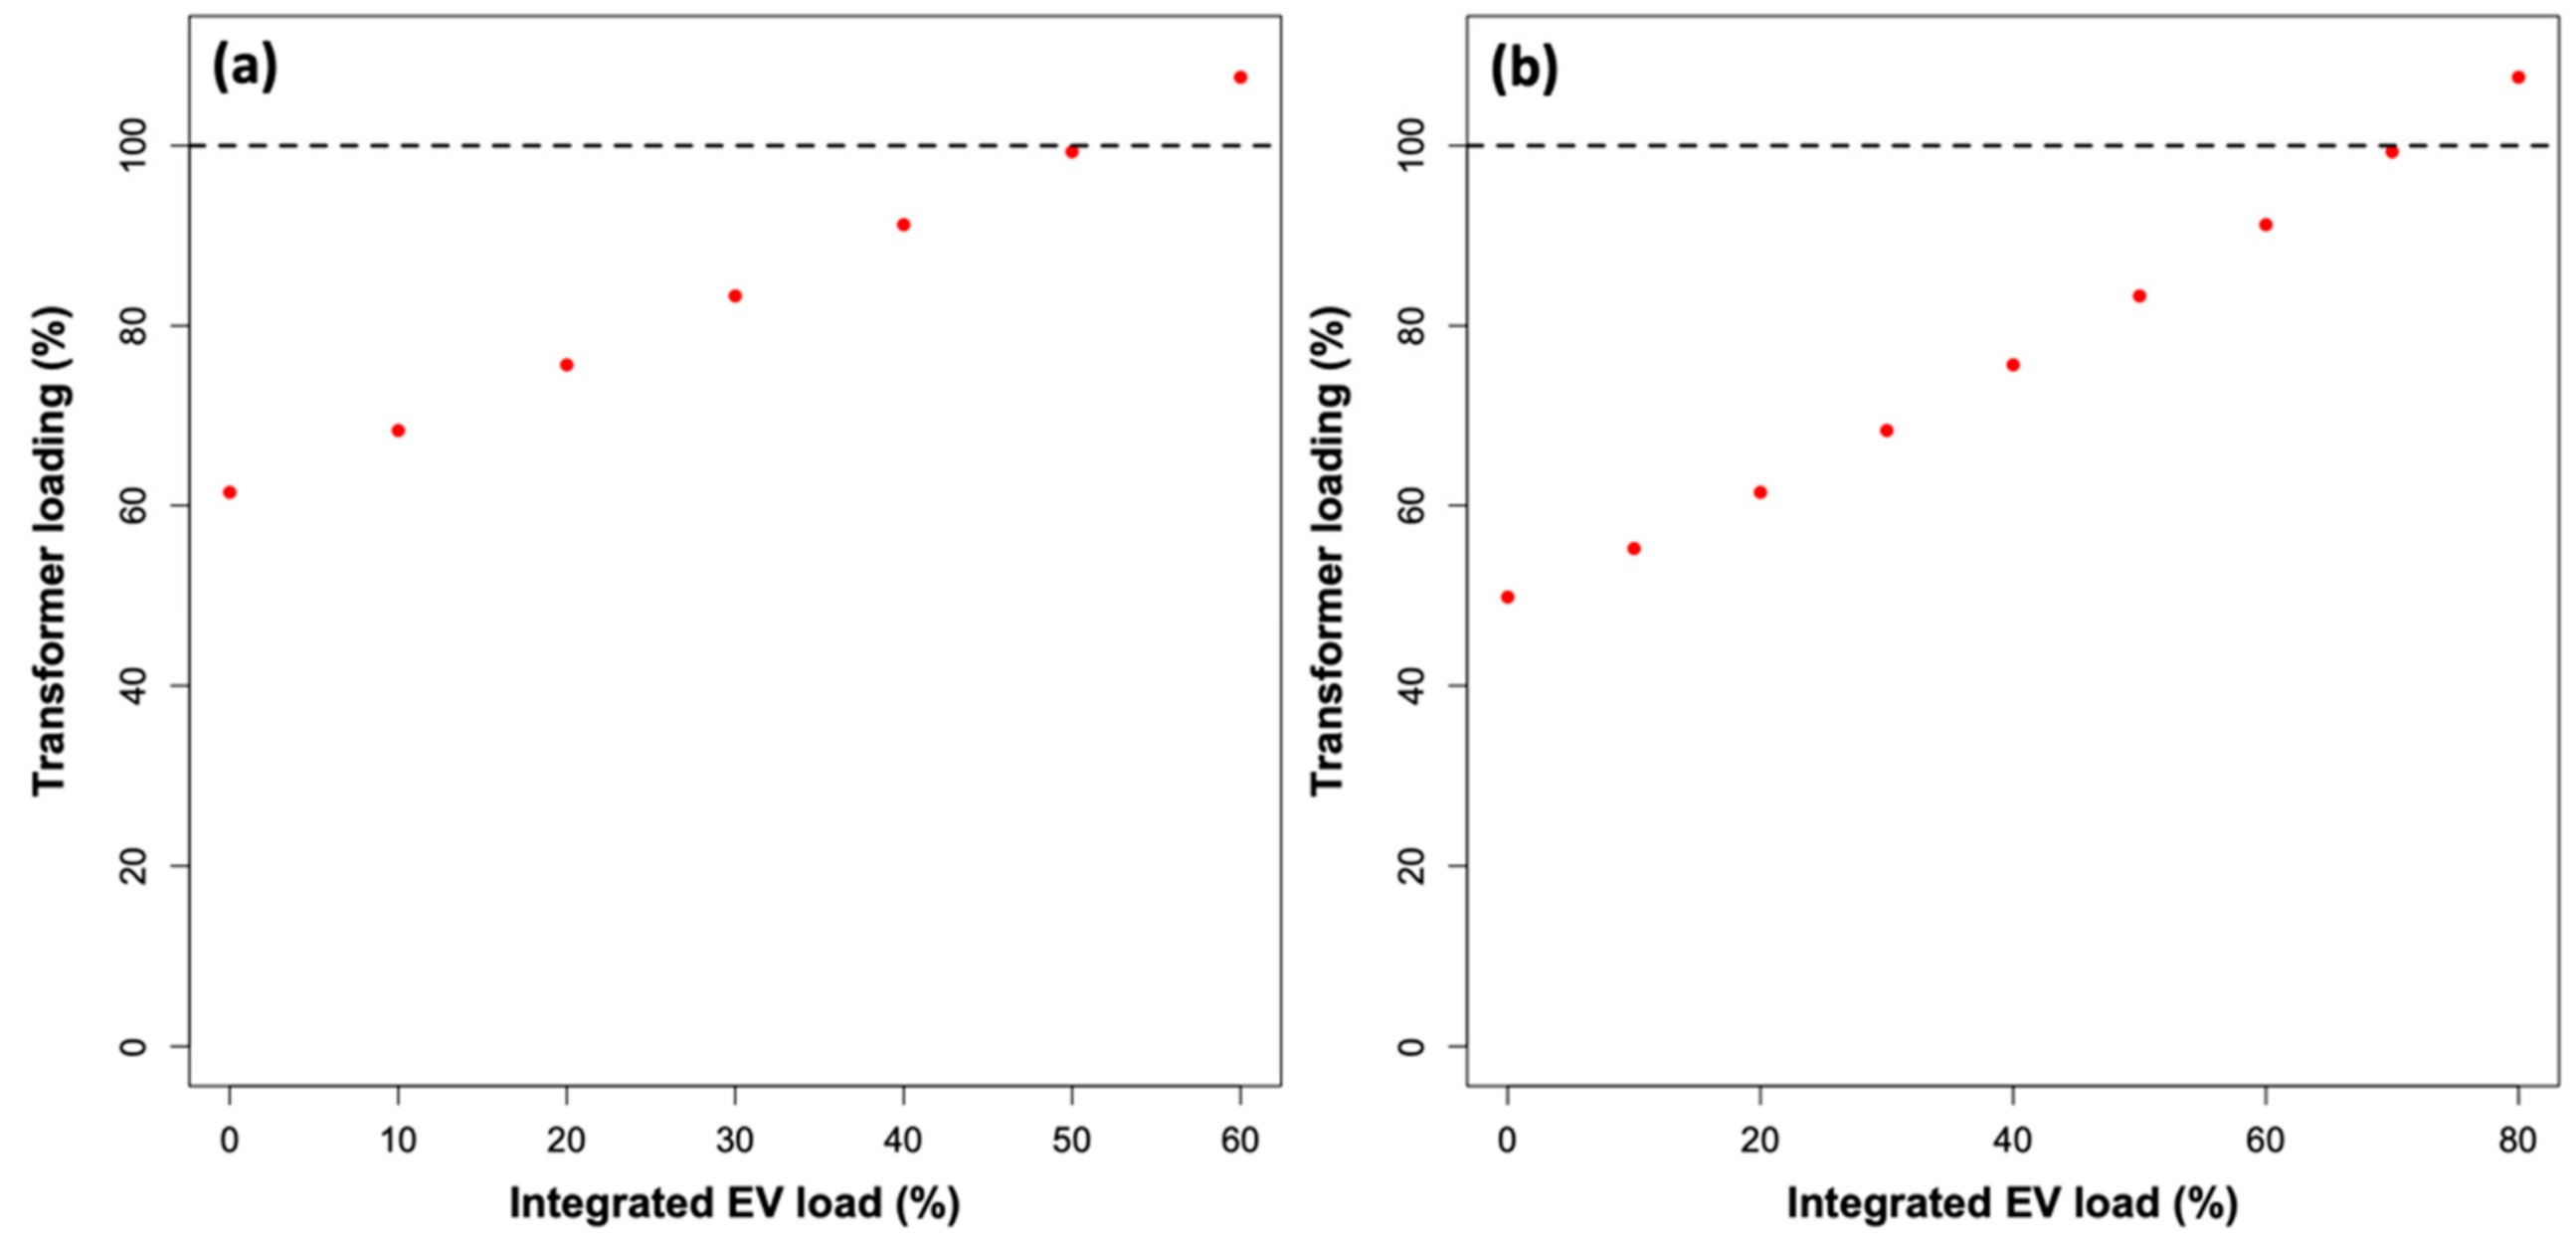
4.1. Scenario 1: Distributed EV Loading
4.2. Scenario 2: Concentrated EV Loading
4.3. Limitations and Future Research
5. Conclusions
Author Contributions
Funding
Institutional Review Board Statement
Informed Consent Statement
Data Availability Statement
Acknowledgments
Conflicts of Interest
Appendix A


Appendix B

| Load | Maximum Possible EV Loading (Maximum Number of EVs) | ||
|---|---|---|---|
| Transformer Limit | Line Limit | Voltage Limit | |
| Node 2 (0.782 MW) | - | 290% (315 EV) | 2960% (3215 EV) |
| Node 3 (1.562 MW) | - | 320% (694 EV) | 3130% (6790 EV) |
| Node 5 (0.782 MW) | - | 290% (315 EV) | 1810% (1966 EV) |
| Node 6 (0.798 MW) | - | 290% (321 EV) | 2980% (3303 EV) |
| Node 9 (0.797 MW) | - | 820% (908 EV) | 3540% (3919 EV) |
| Node 10 (0.798 MW) | - | 280% (310 EV) | 2030% (2250 EV) |
| Node 13 (0.822 MW) | - | 270% (308 EV) | 1070% (1222 EV) |
| Node 14 (0.821 MW) | - | 270% (308 EV) | 2320% (2645 EV) |
| Node 17 (0.829 MW) | - | 270% (311 EV) | 850% (979 EV) |
| Node 19 (0.832 MW) | - | 260% (300 EV) | 360% (416 EV) |
| Load | Maximum Possible EV Loading (Maximum Number of EVs) | ||
|---|---|---|---|
| Transformer Limit | Line Limit | Voltage Limit | |
| Node 2 (0.782 MW) | 580% (630 EV) | 340% (369 EV) | 3130% (3400 EV) |
| Node 3 (1.562 MW) | 290% (629 EV) | 390% (846 EV) | 3720% (8070 EV) |
| Node 5 (0.782 MW) | 580% (630 EV) | 340% (369 EV) | 1910% (2074 EV) |
| Node 6 (0.798 MW) | 560% (621 EV) | 340% (377 EV) | 3220% (3569 EV) |
| Node 9 (0.797 MW) | 570% (631 EV) | 870% (963 EV) | 3830% (4240 EV) |
| Node 10 (0.798 MW) | 560% (621 EV) | 330% (366 EV) | 2190% (2427 EV) |
| Node 13 (0.822 MW) | 540% (617 EV) | 320% (365 EV) | 1190% (1359 EV) |
| Node 14 (0.821 MW) | 550% (627 EV) | 320% (365 EV) | 2600% (2965 EV) |
| Node 17 (0.829 MW) | 530% (610 EV) | 320% (368 EV) | 1020% (1174 EV) |
| Node 19 (0.832 MW) | 520% (601 EV) | 310% (358 EV) | 450% (520 EV) |
| Load | Maximum Possible EV Loading (Maximum Number of EVs) | ||
|---|---|---|---|
| Transformer Limit | Line Limit | Voltage Limit | |
| Node 2 (0.782 MW) | 800% (869 EV) | 360% (391 EV) | 3200% (3476 EV) |
| Node 3 (1.562 MW) | 420% (911 EV) | 420% (911 EV) | 3940% (8548 EV) |
| Node 5 (0.782 MW) | 800% (869 EV) | 360% (391 EV) | 1960% (2129 EV) |
| Node 6 (0.798 MW) | 780% (865 EV) | 360% (399 EV) | 3320% (3680 EV) |
| Node 9 (0.797 MW) | 800% (886 EV) | 900% (996 EV) | 3940% (4361 EV) |
| Node 10 (0.798 MW) | 780% (865 EV) | 360% (399 EV) | 2260% (2505 EV) |
| Node 13 (0.822 MW) | 740% (845 EV) | 340% (388 EV) | 1240% (1416 EV) |
| Node 14 (0.821 MW) | 760% (867 EV) | 340% (388 EV) | 2700% (3079 EV) |
| Node 17 (0.829 MW) | 740% (852 EV) | 340% (391 EV) | 1080% (1244 EV) |
| Node 19 (0.832 MW) | 720% (832 EV) | 340% (393 EV) | 480% (555 EV) |
References
- Requia, W.J.; Mohamed, M.; Higgins, C.D.; Arain, A.; Ferguson, M. How clean are electric vehicles? Evidence-based review of the effects of electric mobility on air pollutants, greenhouse gas emissions and human health. Atmos. Environ. 2018, 185, 64–77. [Google Scholar] [CrossRef]
- Gonzalez-Barcala, F.; Pertega, S.; Garnelo, L.; Castro, T.; Sampedro, M.; Lastres, J.; Gonzalez, M.S.J.; Bamonde, L.; Valdes, L.; Carreira, J.-M.; et al. Truck traffic related air pollution associated with asthma symptoms in young boys: A cross-sectional study. Public Health 2013, 127, 275–281. [Google Scholar] [CrossRef] [PubMed]
- Moon, D.H.; Kwon, S.O.; Kim, S.-Y.; Kim, W.J. Air Pollution and Incidence of Lung Cancer by Histological Type in Korean Adults: A Korean National Health Insurance Service Health Examinee Cohort Study. Int. J. Environ. Res. Public Health 2020, 17, 915. [Google Scholar] [CrossRef] [PubMed]
- Yang, B.-Y.; Qian, Z.; Howard, S.W.; Vaughn, M.G.; Fan, S.-J.; Liu, K.-K.; Dong, G.-H. Global association between ambient air pollution and blood pressure: A systematic review and meta-analysis. Environ. Pollut. 2018, 235, 576–588. [Google Scholar] [CrossRef] [PubMed]
- World Health Organization. 7 Million Premature Deaths Annually Linked to Air Pollution. Available online: http://www.who.int/mediacentre/news/releases/2014/air-pollution/en/ (accessed on 14 March 2021).
- Mądziel, M.; Campisi, T.; Jaworski, A.; Tesoriere, G. The Development of Strategies to Reduce Exhaust Emissions from Pas-senger Cars in Rzeszow City—Poland A Preliminary Assessment of the Results Produced by the Increase of E-Fleet. Energies 2021, 14, 1046. [Google Scholar] [CrossRef]
- Hoch, N.; Bensler, H.P.; Abeywickrama, D.; Bureš, T.; Montanari, U. The E-mobility case study. In Software Engineering for Collective Autonomic Systems; Lecture Notes in Computer Science; Wirsing, M., Hölzl, M., Koch, N., Mayer, P., Eds.; Springer: Cham, Switzerland, 2015; Volume 8998. [Google Scholar]
- Pagany, R.; Camargo, L.R.; Dorner, W. A review of spatial localization methodologies for the electric vehicle charging infra-structure. Int. J. Sustain. Transp. 2019, 13, 433–449. [Google Scholar] [CrossRef]
- Clement-Nyns, K.; Haesen, E.; Driesen, J. The Impact of Charging Plug-In Hybrid Electric Vehicles on a Residential Distribution Grid. IEEE Trans. Power Syst. 2009, 25, 371–380. [Google Scholar] [CrossRef]
- Jiming, H.; LingYu, K.; Yaqi, S.; Ying, L.; Wenting, X.; Hao, W. A Review of Demand Forecast for Charging Facilities of Electric Vehicles. IOP Conf. Series Mater. Sci. Eng. 2017, 199, 12040. [Google Scholar] [CrossRef]
- Siano, P. Demand response and smart grids—A survey. Renew. Sustain. Energy Rev. 2014, 30, 461–478. [Google Scholar] [CrossRef]
- Wang, R.; Chen, T.; Liu, Y. Electric vehicle holdings prediction using elasticity and thousand Hoidings methods. Agricult. Equip. Vehicle Eng. 2011, 49, 40–48. [Google Scholar]
- Yin, J.B.; Wen, Y.B.; Li, R. Discussion on the demand forecasting method of electric vehicle charging facilities construction. J. Jiangxi Power 2010, 34, 1–5. [Google Scholar]
- Qian, K.; Zhou, C.; Allan, M.; Yuan, Y. Modeling of Load Demand Due to EV Battery Charging in Distribution Systems. IEEE Trans. Power Syst. 2010, 26, 802–810. [Google Scholar] [CrossRef]
- Khaligh, A.; Dusmez, S. Comprehensive Topological Analysis of Conductive and Inductive Charging Solutions for Plug-In Electric Vehicles. IEEE Trans. Veh. Technol. 2012, 61, 3475–3489. [Google Scholar] [CrossRef]
- Ji, D.; Lv, M.; Yang, J.; Yi, W. Optimizing the Locations and Sizes of Solar Assisted Electric Vehicle Charging Stations in an Urban Area. IEEE Access 2020, 8, 112772–112782. [Google Scholar] [CrossRef]
- Ali, F.; Imam, R. Optimal Locations of Charging Stations for Electric Vehicles in Amman, Jordan. Int. Rev. Civil. Eng. (IRECE) 2020, 11, 206–213. [Google Scholar]
- Mao, D.; Wang, J.; Tan, J.; Liu, G.; Xu, Y.; Li, J. Location planning of fast charging station considering its impact on the power grid assets. In Proceedings of the 2019 IEEE Transportation Electrification Conference and Expo (ITEC), Detroit, MI, USA, 19–21 June 2019; pp. 1–5. [Google Scholar]
- Hardman, S.; Jenn, A.; Tal, G.; Axsen, J.; Beard, G.; Daina, N.; Figenbaum, E.; Jakobsson, N.; Jochem, P.; Kinnear, N.; et al. A review of consumer preferences of and interactions with electric vehicle charging infrastructure. Transp. Res. Part D Transp. Environ. 2018, 62, 508–523. [Google Scholar] [CrossRef]
- Moradzadeh, M.; Abdelaziz, M.M.A. A New MILP Formulation for Renewables and Energy Storage Integration in Fast Charging Stations. IEEE Trans. Transp. Electrif. 2020, 6, 181–198. [Google Scholar] [CrossRef]
- Chellaswamy, C.; Ramesh, R. Future renewable energy option for recharging full electric vehicles. Renew. Sustain. Energy Rev. 2017, 76, 824–838. [Google Scholar] [CrossRef]
- Chandra Mouli, G.R.; Bauer, P.; Zeman, M. System design for a solar powered electric vehicle charging station for workplaces. Appl. Energy 2016, 168, 434–443. [Google Scholar] [CrossRef]
- Putrus, G.A.; Suwanapingkarl, P.; Johnston, D.; Bentley, E.C.; Narayana, M. Impact of electric vehicles on power distribution networks. In Proceedings of the 2009 Vehicle Power and Propulsion Conference (VPPC), Dearborn, MI, USA, 7–10 September 2009; pp. 827–831. [Google Scholar]
- Dharmakeerthi, C.; Mithulananthan, N.; Saha, T. Impact of electric vehicle fast charging on power system voltage stability. Int. J. Electr. Power Energy Syst. 2014, 57, 241–249. [Google Scholar] [CrossRef]
- Ul-Haq, A.; Cecati, C.; Strunz, K.; Abbasi, E. Impact of Electric Vehicle Charging on Voltage Unbalance in an Urban Distribution Network. Intell. Ind. Syst. 2015, 1, 51–60. [Google Scholar] [CrossRef]
- Zhang, Y.; Song, X.; Gao, F.; Li, J. Research of voltage stability analysis method in distribution power system with plug-in electric vehicle. In Proceedings of the 2016 IEEE PES Asia-Pacific Power and Energy Engineering Conference (APPEEC), Xi’an, China, 25–28 October 2016; pp. 1–6. [Google Scholar]
- Gómez, J.C.; Medhat, M.M. Impact of EV battery chargers on the power quality of distribution systems. IEEE Trans. Power Deliv. 2003, 18, 975–981. [Google Scholar] [CrossRef]
- Jiang, C.; Torquato, R.; Salles, D.; Xu, W. Method to Assess the Power-Quality Impact of Plug-in Electric Vehicles. IEEE Trans. Power Deliv. 2014, 29, 958–965. [Google Scholar] [CrossRef]
- Fan, Y.; Guo, C.; Hou, P.; Tang, Z. Impact of Electric Vehicle Charging on Power Load Based on TOU Price. Energy Power Eng. 2013, 5, 1347–1351. [Google Scholar] [CrossRef]
- Di Silvestre, M.L.; Sanseverino, E.R.; Zizzo, G.; Graditi, G. An optimization approach for efficient management of EV parking lots with batteries recharging facilities. J. Ambient. Intell. Humaniz. Comput. 2013, 4, 641–649. [Google Scholar] [CrossRef]
- Fakeha, S.; Manisa, P.; Rahman, S. Demand management to mitigate impacts of plug-in electric vehicle fast charge in buildings with renewables. Energy 2017, 120, 642–651. [Google Scholar]
- Geske, M.; Komarnicki, P.; Stötzer, M.; Styczynski, Z.A. Modeling and simulation of electric car penetration in the distribution power system—Case study. In Proceedings of the International Symposium on Modern Electric Power Systems, Wroclaw, Poland, 1 September 2011; pp. 1–6. [Google Scholar]
- Wood, L. Jordan Electric Vehicle Market Analysis & Outlook, 2019–2025: Vehicle Types, Regions, Competitive Landscape. Business Wire. 2019. Available online: https://www.businesswire.com/news/home/20190906005441/en/Jordan-Electric-Vehicle-Market-Analysis-Outlook-2019-2025 (accessed on 14 March 2021).
- Daniel, D. Jordan to Install 10,000 Charging Stations for Electric Vehicles. Construction Week. 2018. Available online: https://www.constructionweekonline.com/article-48645-jordan-to-install-10000-charging-stations-for-electric-vehicles (accessed on 14 March 2021).
- National Electric Power Company (NEPCO). Annual Reports, Amman, Jordan. Available online: http://www.nepco.com.jo/store/docs/web/2018_en.pdf (accessed on 14 March 2021).
- Electricity Distribution Company. Home Page, Amman, Jordan. Available online: https://www.edco.jo/index.php/ar/ (accessed on 14 March 2021).


| Year | 2010 | 2011 | 2012 | 2013 | 2014 | 2015 | 2016 | 2017 |
|---|---|---|---|---|---|---|---|---|
| Number of EVs | 24 | 23 | 37 | 57 | 72 | 253 | 797 | 6423 |
| Transformer | Rated Voltage (KV) | Rated Power (MVA) | Active Power (MW) | Reactive Power (MVAR) | Power Factor | Loading (%) |
|---|---|---|---|---|---|---|
| 1 | 132/11 | 5 | 4.42 | 2.1 | 0.9 | 99.3 |
| 2 | 132/11 | 5 | 4.42 | 2.1 | 0.9 | 99.3 |
| Load | Active Power (MW) | Reactive Power (MVAR) |
|---|---|---|
| Node 2 | 0.782 | 0.379 |
| Node 3 | 1.562 | 0.757 |
| Node 5 | 0.782 | 0.379 |
| Node 6 | 0.798 | 0.387 |
| Node 9 | 0.797 | 0.386 |
| Node 10 | 0.798 | 0.386 |
| Node 13 | 0.822 | 0.398 |
| Node 14 | 0.821 | 0.398 |
| Node 17 | 0.829 | 0.402 |
| Node 19 | 0.832 | 0.403 |
| Loading Condition | Maximum Possible EV Loading (Maximum Number of EVs *) | ||
|---|---|---|---|
| Transformer Limit | Line Limit | Voltage Limit | |
| Full (100%) | - | 205% (2512 EV) | 185% (2267 EV) |
| Intermediate (50%) | 60% (735 EV) | 260% (3186 EV) | 240% (2941 EV) |
| Light (30%) | 80% (980 EV) | 280% (3431 EV) | 260% (3186 EV) |
Publisher’s Note: MDPI stays neutral with regard to jurisdictional claims in published maps and institutional affiliations. |
© 2021 by the authors. Licensee MDPI, Basel, Switzerland. This article is an open access article distributed under the terms and conditions of the Creative Commons Attribution (CC BY) license (http://creativecommons.org/licenses/by/4.0/).
Share and Cite
Shalalfeh, L.; AlShalalfeh, A.; Alkaradsheh, K.; Alhamarneh, M.; Bashaireh, A. Electric Vehicles in Jordan: Challenges and Limitations. Sustainability 2021, 13, 3199. https://doi.org/10.3390/su13063199
Shalalfeh L, AlShalalfeh A, Alkaradsheh K, Alhamarneh M, Bashaireh A. Electric Vehicles in Jordan: Challenges and Limitations. Sustainability. 2021; 13(6):3199. https://doi.org/10.3390/su13063199
Chicago/Turabian StyleShalalfeh, Laith, Ashraf AlShalalfeh, Khaled Alkaradsheh, Mahmoud Alhamarneh, and Ahmad Bashaireh. 2021. "Electric Vehicles in Jordan: Challenges and Limitations" Sustainability 13, no. 6: 3199. https://doi.org/10.3390/su13063199
APA StyleShalalfeh, L., AlShalalfeh, A., Alkaradsheh, K., Alhamarneh, M., & Bashaireh, A. (2021). Electric Vehicles in Jordan: Challenges and Limitations. Sustainability, 13(6), 3199. https://doi.org/10.3390/su13063199