Perspective

Assessment on Global Urban Photovoltaic Carrying Capacity and Adjustment of Photovoltaic Spatial Planning

School of Architecture of Tianjin University, Tianjin 300000, China
*
Author to whom correspondence should be addressed.
Sustainability 2021, 13(6), 3149; https://doi.org/10.3390/su13063149
Submission received: 20 January 2021 / Revised: 2 March 2021 / Accepted: 10 March 2021 / Published: 12 March 2021
(This article belongs to the Special Issue Renewable Energies for Sustainable Development)

Abstract

:
To promote the effective combination of photovoltaic (PV) utilization and urban development, this study proposes that solar PV generation should be taken as an important resource and environmental carrying capacity factor, which is defined as “Photovoltaic Carrying Capacity (PVCC)”, to be integrated into future urban planning. According to the PVCC assessment on global cities, the sensitivity of PVCC to different influence factors is analyzed and the benefits of different optimization strategies on PVCC are also discussed. Additionally, in an equilibrium analysis of PVCC distribution in six sample countries, we discuss both the causes and impact of their distribution gap. That analysis shows that the average PVCC in global urban areas can reach 23.13%, which approaches the anticipated needs of PV development in cities by 2050.Though different optimization strategies may be feasible to promote urban PVCC, they might only make significant changes in medium or large cities. When considering the high-efficient utility of local energy, dispersed layout of cities and population is necessary to implement PV spatial planning. According to the assessment and analysis results, the adjustment suggestions of PV spatial planning in each sample country are also discussed. Finally, it is pointed out that the proactive PV spatial may be of great significance to achieve higher solar energy supply and PVCC will be an available cognition in guiding this planning in the future.

1. Introduction

With the depletion of fossil energy, countries all over the world have put forward their own energy transition plans. Renewable energy, mainly solar photovoltaic (PV) have increasingly become the mainstream development trend of global energy transition due to its more general applicability and sustainability. By the end of 2018, the world’s total installed photovoltaic capacity had reached to about 480 GW, which had contributed 2% of the world’s total energy consumption [1]. Meanwhile, the cost of PV generation per kilowatt hour has also shown a trend of rapid decline. Taking utility scale PV as an example, the average cost per kilowatt hour of the electricity has been reduced from 371 USD/MWh in 2010 to 85 USD/MWh in 2018, dropping by 77% in only eight years [2]. Although there is still a cost gap compared with the traditional energy, such as thermal power generation, solar PV is catching up with traditional energy to achieve connection to grid at an equal price and its competitive advantage constantly improves. An estimate from the International Renewable Energy Agency (IRENA) shows that, the total global installed PV capacity will reach 8519 GW by 2050, including about 60% utility scale and 40% distributed rooftop and the power output will take up 25% of the world’s total electrical energy consumption [1], becoming a significant part of the energy consumption structure.
The energy transition to PV (and many other renewable energies) is not in doubt, but compared with traditional fossil energy, solar PV has particular characteristics, such as intermittence and lower energy density, which will necessitate a significantly different planning mode. Currently, comprehensive assessments of its sustainability (including energy production, transportation and consumption) are not generally carried out [3]. To date, for the most part, spatial planning and energy planning have been treated as two separate domains. So-called “Energy Planning” is usually just some target-based guidelines which are largely concerned with the security of supply and energy demand. However, without resource distribution analysis and spatial construction planning, there will be obvious deficiencies in the guidance of local investment in the construction of renewable energy facilities. As a result, renewable energy planning is still carried out in the same way as for traditional fossil energy, becoming thereby subordinated to urban planning in the form of power distribution only. With regard to this background, many researchers have proposed the application of “Landscape: into energy planning, putting forward the concept of “Energy Landscape” [3,4,5]. According to the spatio-temporal modeling of renewable energy carriers’ distribution, a comprehensive optimized utilization strategy could be achievable through methods of planning adjustment, policy incentive and financial support, etc. In that case, the goal of future renewable energy planning will no longer be simply limited to the development expectations of a single increasing of energy consumption proportion, but will be more inclined to the deployment of both regional energy distribution and urban development in a view of comprehensive spatial planning.
Energy is of great significance in the process of urban development. It is not only an indispensable natural resource, but also a necessary condition for the transformation of other natural resources into economic output. From the economic perspective, the essence of urban development is just a process of population accumulation during which natural resources are exhausted for economic production by converting their economic mode [6]. So, like many other natural resources, energy adequacy is usually reflected as an important “Resource and Environment Carrying Capacity (RECC)”, which is initially used to assess the environmental constraints on population growth [7]. RECC has been defined by FAO and UNESCO as the maximum population that a country or region can afford by using local natural resources, energy, technology and technology [8]. However, with the development of worldwide research, its measurement has been gradually extended to include many other criteria, such as “Ecological Footprint”, “Net Primary Productivity” and “Emergy” [9,10,11]. Although there is not yet a universal definition, the connotation of RECC allows the measurement of the resource endowment and environmental capacity of a certain regional space and the population and economic scale it could afford so as to maintain a good ecosystem without doing any harm to the natural ecological environment [12].
A great quantity of researches of RECC can be found on fossil energies like coal or gas-fired power generation [13,14,15,16], but there is as yet none on solar PV. The obvious reason is that these energy forms are generally considered as non-renewable. They are also affected to the stability and security of their energy supply. Compared with fossil energy forms, solar PV has not yet had any serious impact on either urban or economic development. That said, the proportion of PV power consumption will increase significantly by 2050. Solar PV will play the same role as other power generation technologies, providing important energy guarantees in the process of urban development in the future. Furthermore, according to the goal of “Energy Landscape” planning, solar PV will also become a key part of future urban spatial planning. We therefore propose, in this study, to take solar PV as a latent but necessary resource and environment carrying capacity factor that should be integrated into the comprehensive carrying capacity index system of future urban planning. On this basis, the distribution of PVCC in cities around the world is evaluated, then the deployment and further optimization strategy of future PV energy in urban spatial planning are also discussed in this study. These will help to make a tentative discussion on how PVCC would affect the strategy determination of solar PV spatial planning in a range that from urban planning to national geospatial planning.

2. Method

2.1. Photovoltaic Carring Capacity

According to the connotation of RECC, the “Photovoltaic Carrying Capacity (PVCC)” here in this paper is defined as the capacity of a city to use solar energy resource in its region for PV power generation to meet its own demand, as is shown in Equation (1). By the differences of PV system construction forms, the evaluation objects include two parts of power output: distributed rooftop PV system in urban built-up areas and utility scale PV stations in non-built-up areas.
P V C C = E C
where P V C C is the photovoltaic carrying capacity of a city, measured in %; E is the annual power output that can be achieved by a city after PV installation, measured in kWh/year; C is the annual power consumption of a city, measured in kWh/year.

2.2. Influence Factors

According to Equation (1), the influence factors of PVCC can be generally divided into two main aspects: power generation and power consumption. On the basis of some existing researches, the generation aspect includes natural conditions such as solar irradiation, effective sunshine time, latitude, slope, geology, natural disasters, land usage, protected area, temperature, snow, dust, etc. and other spatial morphology factors like building density, spatial layout, building style, urban built up area, population density, population distribution, infrastructure (roads, transmission lines, substations) distribution, etc. [17,18,19,20]. The consumption aspect is often related to the living standard or urban development condition of a city, such as urbanization rate, industrial structure, power consumption level, national economy and spot price [21,22,23,24]. The assessment results of PVCC are closely related to the influencing factors selected. However, this does not mean that the PVCC of a city is always immutable. For instance, the change of urban spatial morphology by adjusting its planning strategy can significantly affect the city’s final PVCC. In addition, considering the convenience and feasibility of the assessment, it is also necessary to define the range of influence factors selected according to different spatial assessment scales. Since the objective discussing spatial scale of this study is set as the range from urban planning to national geospatial planning, considering the replication of these assessments on such geographical scope (worldwide), we take only six main factors into consideration in this study, each of which is supposed to make more significant impact on final PVCC result than the other detailed factors. They are solar irradiation, urban population density, urban built-up area, annual electricity consumption per capita, available land area for PV installation and transmission distance. Moreover, each of these six factors could correspond to at least one independent optimization strategy (without causing any change of other influence factors) directly or indirectly, as shown in Table 1. In addition, these strategies will be later used to underpin a theoretical discussion on the effect that it would make through different methods of planning adjustment. As for the assessment of power consumption, considering the real situation of urban economic production, built-up area will be the main part where energy is exhausted (Almost 80% of total social electricity consumption) [25], so we only take this part of consumption into account for the PVCC assessment.

2.3. Urban Geographical Division

A key quality of future energy systems is low transmission distance to realize a high-efficient utility of local energy [3]. Therefore, it is necessary to delimit the boundary of “local” region first to determine to which city the PV power output (Especially for utility scale) will be mainly supplied. On consideration of transmission line loss and infrastructure investment, PV power output is usually preferentially transmitted to its nearest urban load area to minimize extra consumption, therefore, the urban region division here in this study is determined by the geographical distance between the land location and its nearest urban center by using the cost allocation function in Arcgis, instead of a traditional administrative division. According to the quality of low transmission distance, this method can ensure that the distance between any land pixel in a certain geographical division and its subordinate urban center is shorter than that from any other urban centers. Then, by extracting the average value of each influence factor in a certain geographical division (by zonal statistics function in Arcgis), the local condition of a city could be further described in brief.

2.4. Assessment of PV Generation Potential

Different assessment methods of generation potential are adopted in two forms of PV system. As for distributed rooftop, the key point is to evaluate the PV installation area on the roof of a city. In this regard, the International Energy Agency (IEA)has given out an exponential function to describe the relationship between the installation area per capita and the urban population density [26], in order to meet the needs of PV potential assessment in a large range of geographical area, as is shown in Equation (2). Applying this, the annual power generation of distributed rooftop PV can be further calculated by Equation (3).
A a = α · p β
E d = A a · A b · p · G T I · i · K
where A a is the rooftop PV installation area per capita, measured in m2/person; p is the urban population density, measured in persons/km2; α and β are theadjustment coefficients, unless otherwise specified, α   = 172.3, β = 0.352; E d is the annual power generation of distributed rooftop PV, measured in kWh/year; A b is the urban built-up area, measured in km2; G T I is annual solar irradiation on tilted surface, measured in kWh/m2/year; i is the conversion efficiency of PV panel, measured in %; K is the total efficiency of PV system, K = 75% in general.
As for utility scale PV power stations, the key factors include two main parts, the evaluations of the available land area and the transmission distance. According to a standard regulation of China [27] and our field investigation, four kinds of land usage are selected to be available for PV installation and each these four can be further reflected as a corresponding land cover type on basis of the “Land Cover Classification System (LCCS)” [28], including bare areas (LCCS-200), sparse vegetation areas (LCCS-150), mosaic vegetation/cropland areas (LCCS-30) and closed to open herbaceous vegetation areas (LCCS-140). The annual power output can be then further estimated after considering an average 40% ratio of panels area to land occupation and the adjustment coefficient of each available land type (to avoid vegetation occupation, see appendix II in [28]). Meanwhile, considering the lack of or absence of feasibility of installing PV over steep terrains, land with an average slope larger than 5° is excluded by referring to the value in [29] and the pixel size of the DEM data used in this study (2397 × 2397 m). The assessment of transmission line loss is derived by extracting an average value of the distances between each available land pixel and its subordinate urban center. Moreover, an average line loss rate of 0.4%/km is considered in assumption that all the transmission lines are constructed in the system form of 10 kV three-phase four wires. Then, the annual PV power received by each urban built-up area from its surrounding utility scale PV stations could be further estimated as follows:
E u = 40 % · ( i n A u i · R i ) · G T I · i · K · ( 1 0.4 % · D )
where E u is the annual power received from utility scale PV, measured in kWh/year; A u i is the total area of each type of land usage (I = 30, 140, 150, 200), measured in m2; R i is the adjustment coefficient of each available land type (R30 = 50%, R140 = 70%, R150 = 90%, R200 = 100%); D is the average transmission distance, measured in km. G T I , i and K see Equation (2).

2.5. PVCC Assessment

Through methods above, it can be estimated that the global PV installed capacity could reach a level of 8.58 TW for distributed rooftop and 3704 TW for utility scale, which has far exceeded the development goal in 2050 (3470.6 GW for distributed rooftop, 40%; 5111.4 GW for utility scale, 60% [1]). This just reflects a theoretical installed capacity. While considering the feasibilities of technical condition, development cost and industry capacity, such amount of installation would be hardly achieved, therefore, a hypothetical restrict of maximum installed capacity is further needed to reflect the realistic situation. By comparing the ratio of development goal to theoretical installation, on average, merely 0.14% of available land area and 39% of roof area are needed to meet 25% proportion of PV power in 2050. Therefore, the PVCC of each urban geographical division can be further evaluated as following equation:
P V C C = 39 % · E d + 0.14 % · E u A b · p · C a
where C a is the annual electricity consumption per capita; The other symbols see Equations (1)–(4).

2.6. Data Sources

The data used in this study include global digital elevation model (DEM) [30], Globcover 2009 [31], Gridded Population of the World, Version 4 (GPWv4) [32], Global irradiation for optimally tilted surface [33] and Urban population gathering points (urban centers). The power consumption is estimated based on the statistics data of “Electricity consumption per capita” from [34,35]. Although they only reflect the electricity consumption of the overall level of a country, while taking into consideration that the citizens of the same country would have certain similarities in their electricity consumption behaviors, habits or customs, these data are still considered as valid. Meanwhile, to ensure the consistency of assessment results, the conversion efficiency of PV panel is unified as 16.54% by referring to Jkm270pp-60-dv poly-silicon PV module [36].

3. Results and Analysis

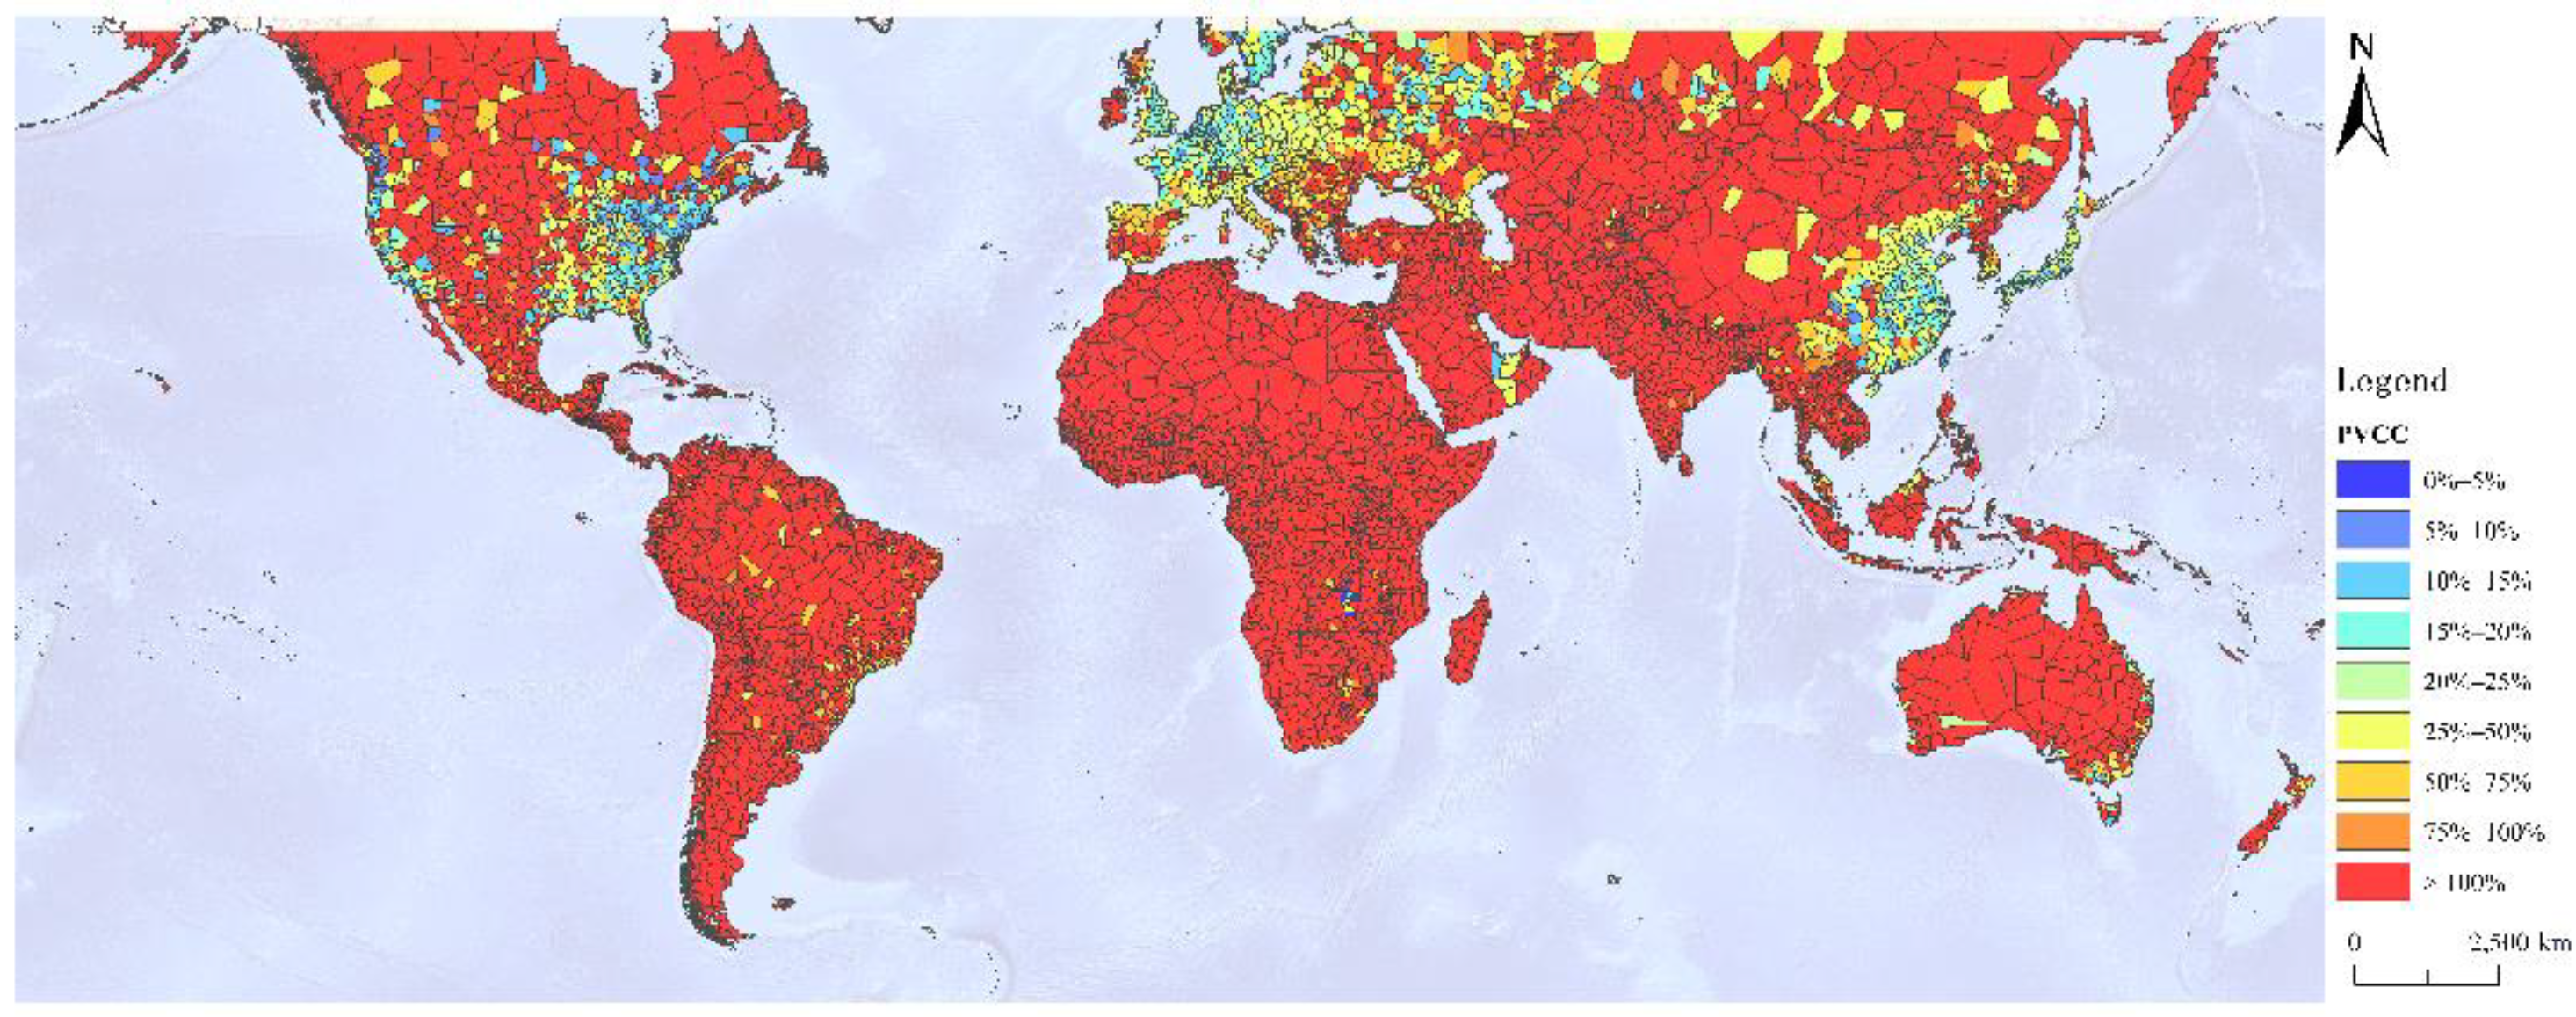
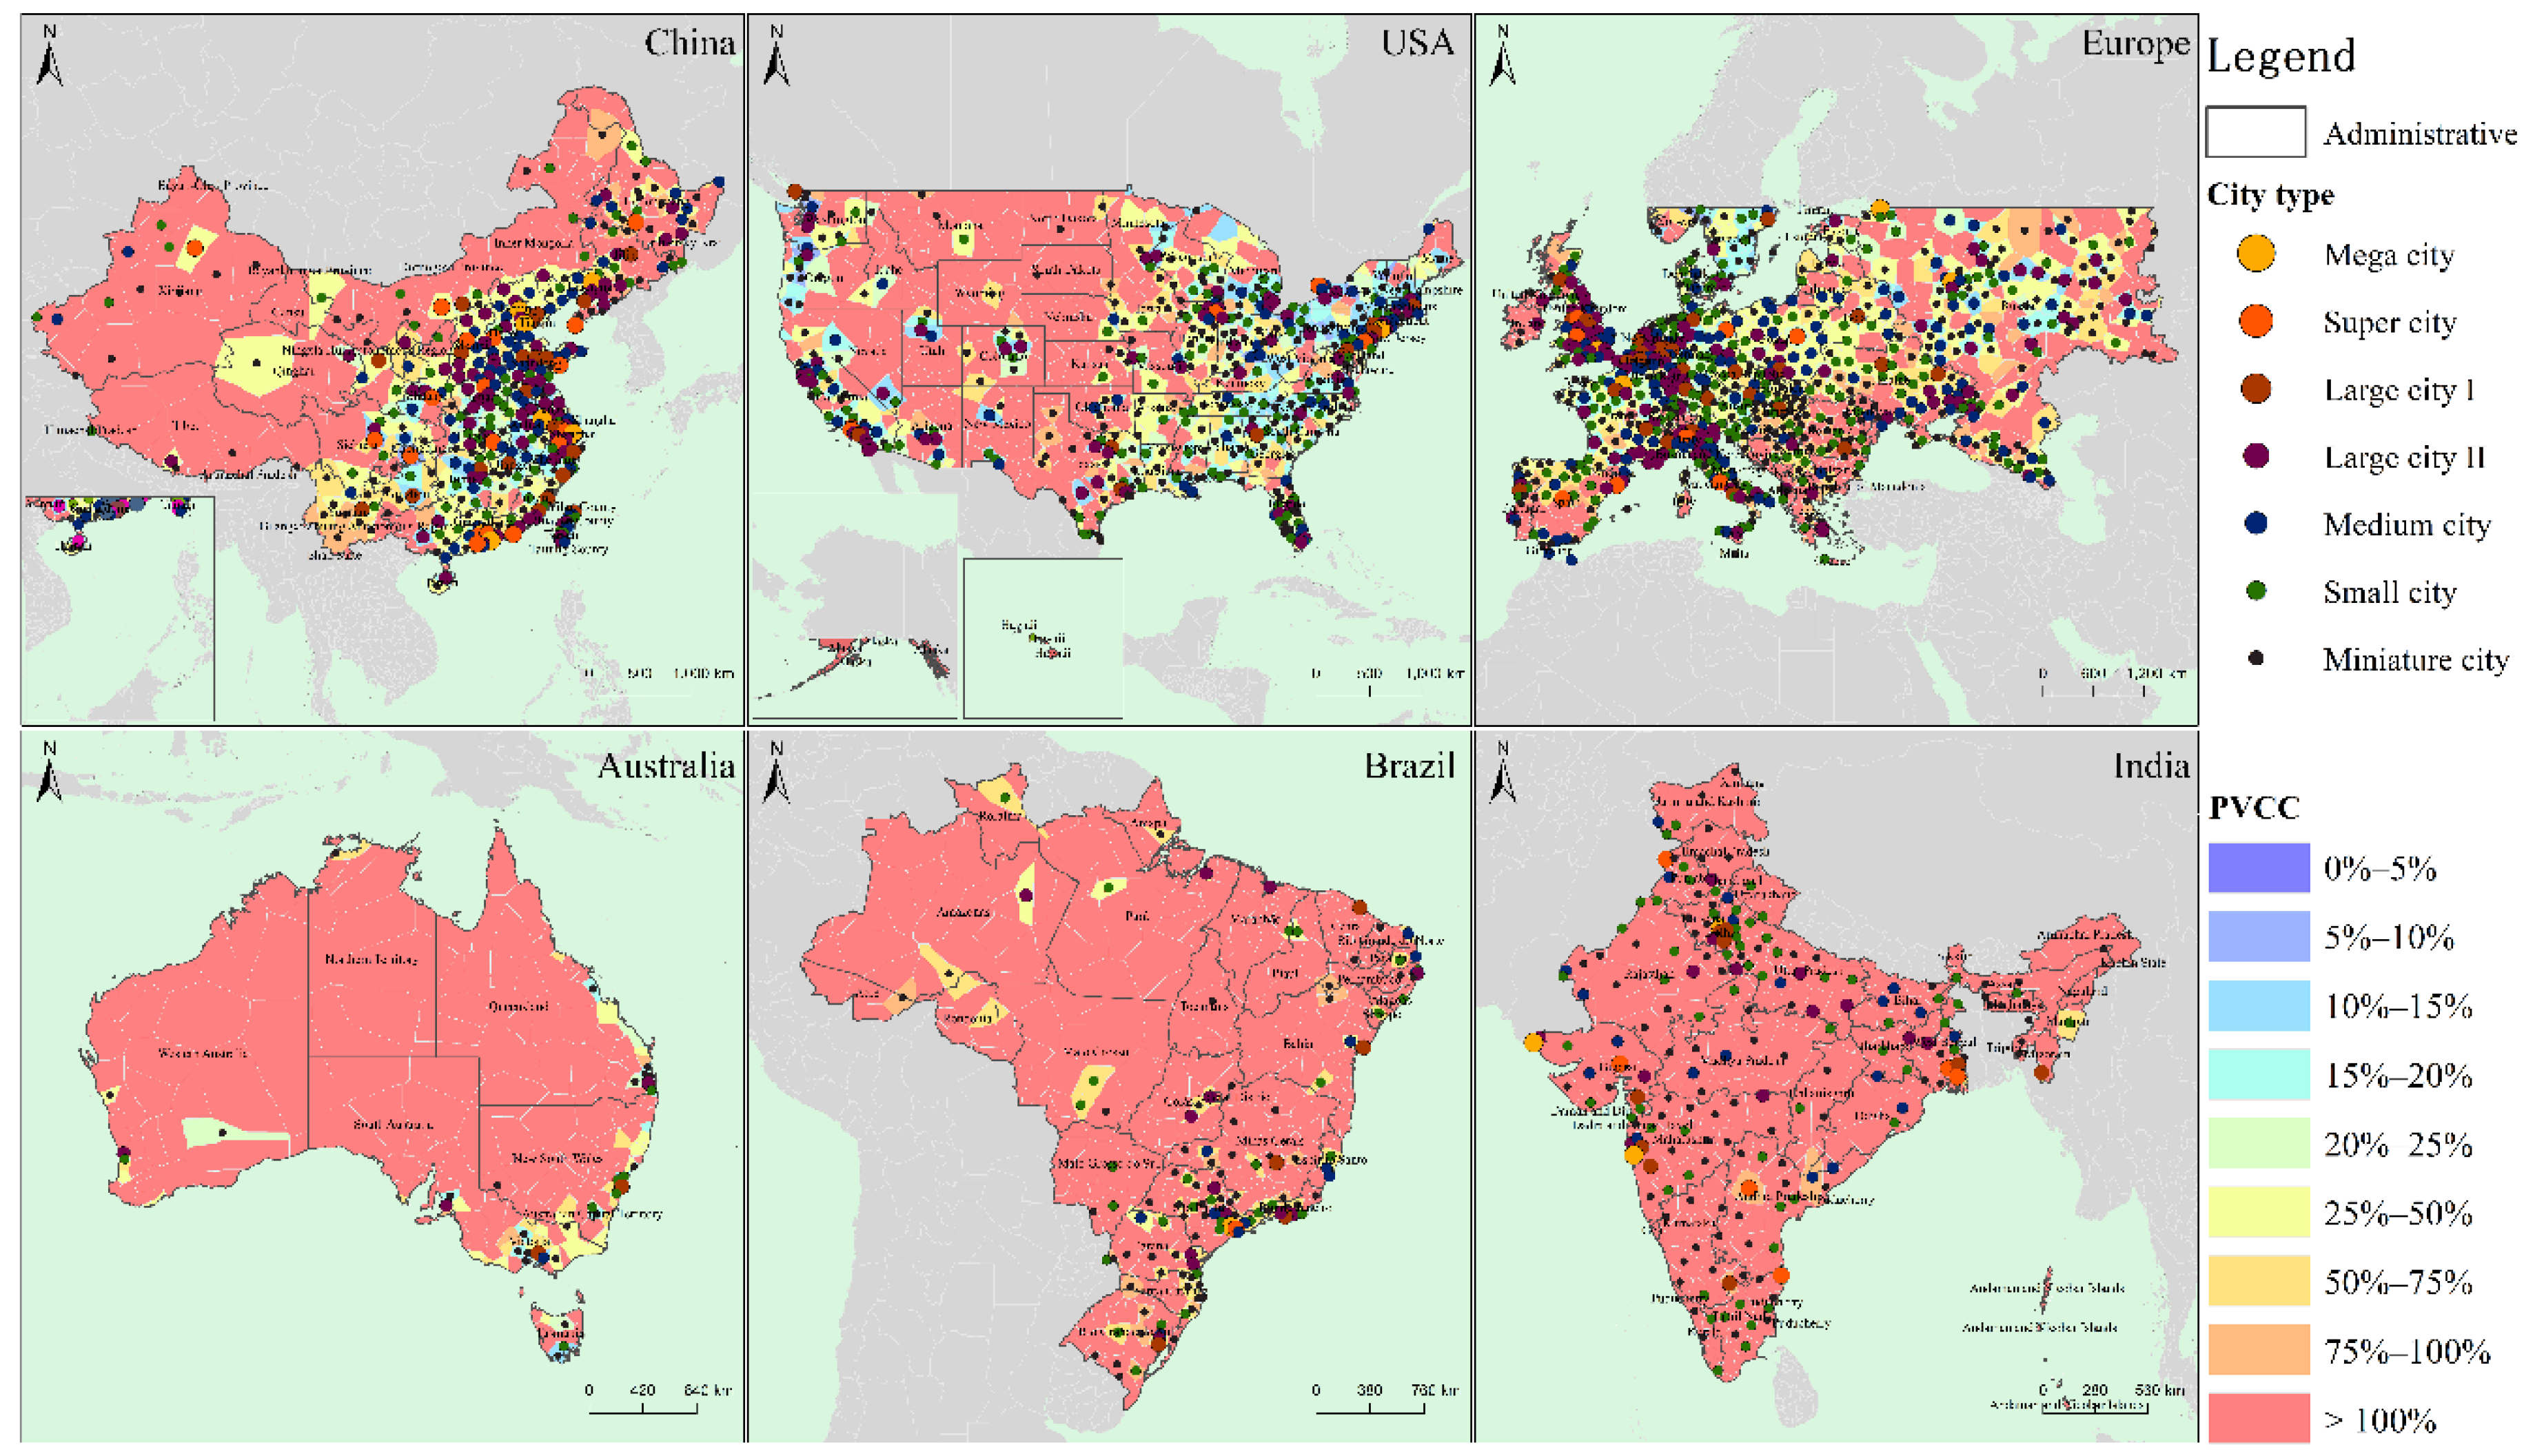
3.1. Results of PVCC Assessment

The assessment result of each urban division worldwide is shown in Figure 1. In addition, the annual PV power generation from all urban divisions would take up in a total ratio of 43.22% to the global electricity demand. Considering that over 30% of this power output might not be used directly or even wasted because of intermittence and electrical-surplus in off-peak period, this assessment result is relatively reasonable. In addition, it can be seen from Figure 1 that the vast majority of PVCC are provided by deserts, tundra and other sparsely populated areas in the form of ground utility scale PV station. Unless absolutely necessary, these sparsely populated areas are always suggested to better remain unexploited to protect their ecology and biodiversity. Generally, it is not essential to discuss the PVCC of these areas in priority. Therefore, by utilizing a regulation applicable in China [37], the standard of urban scale with a population of 50,000 is adopted in this study to distinguish urban and non-urban areas. On this basis, the average level of PVCC in urban areas worldwide could still reach up to 23.13%, nearly approaching the target of 25% by 2050. In other words, the global PV target of 2050 could be almost achieved only by PV installation in urban areas themselves together with methods such as low-priced energy storage and electric vehicles recharging (to avoid electrical-surplus), though this is just on the basis of global average level.

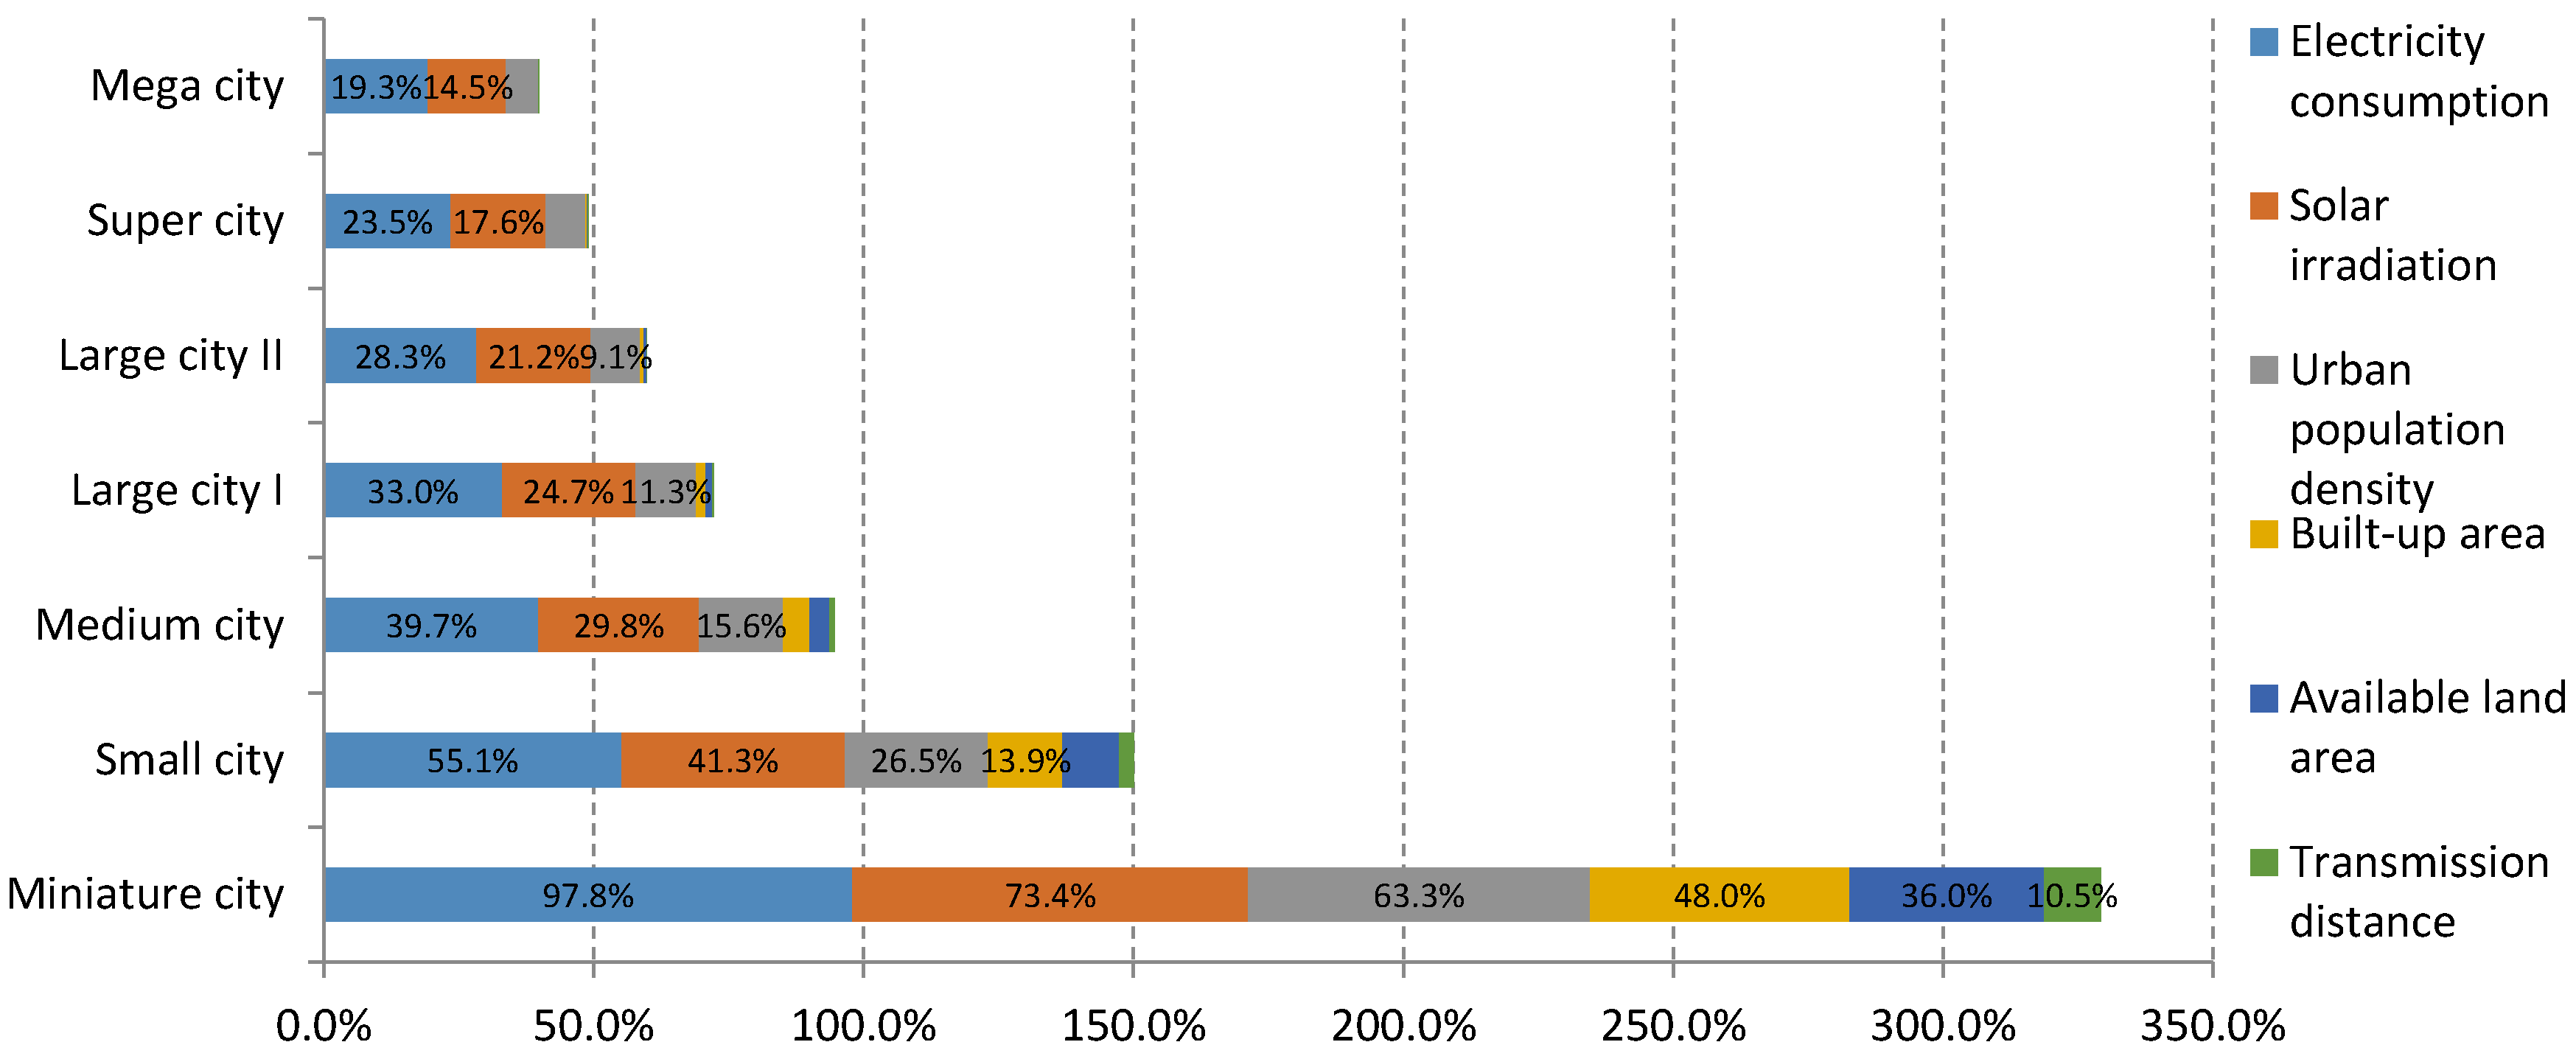
3.2. Sensitivity Analysis of PVCC

As mentioned above, the PVCC of a city will change with its influence factors. This section analyses the sensitivity of PVCC result to changes in the influence factors inputs. While considering the effects of different urban types to analysis accuracy, these analyses are conducted separately by different population scales based on a classification standard of China [37], specifically including seven scales that range from miniature city to mega city. For each type of urban scale, the median value of each influence factor is extracted as an assumed global average standard input into the PVCC equation. It is then adjusted independently of the others by ±50% (theoretical maximum and minimum) to observe its sensitivity and the results are shown in Figure 2. These analyses will further help to illustrate how different optimization strategies could make changes on the PVCC result, according to Table 1.

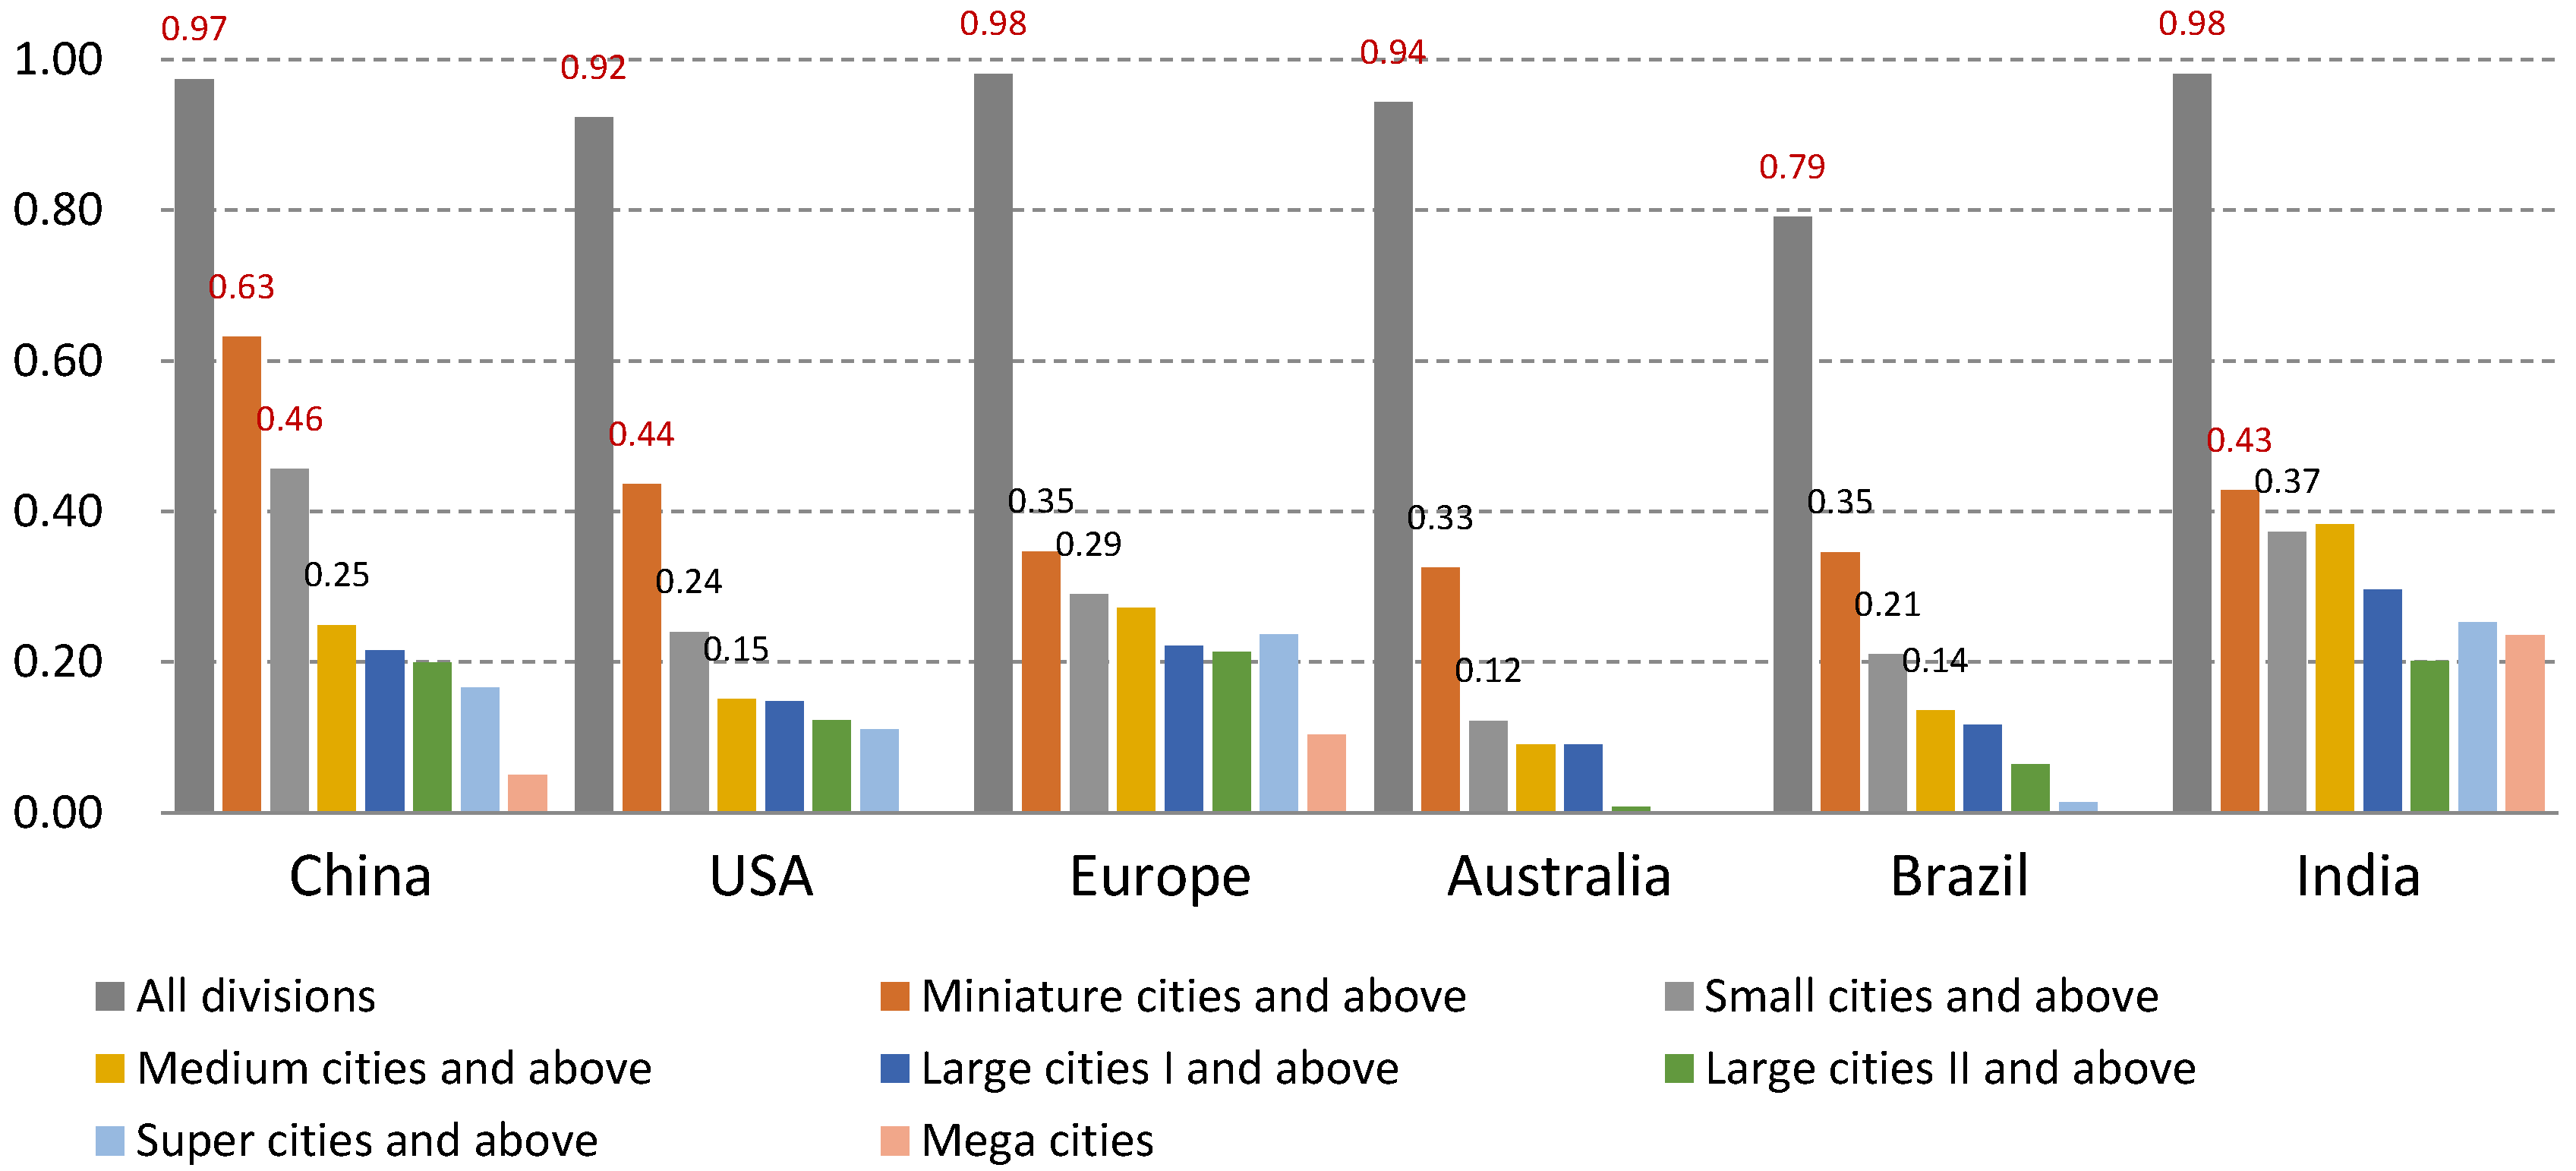
3.3. Equilibrium Analysis of PVCC Distribution

The total PVCC of 23.13% in urban areas worldwide would approximately meet the development needs in 2050, but this is just from the view of total average. As is shown in Figure 1, the PVCC of different urban divisions are actually changing in varying degrees. That is also to say, in order to achieve the appropriate proportion of PV energy consumption in each urban division, long distance energy allocations are inevitable, but this would definitely break the key quality of low transmission distance and high-efficient local utility of future energy systems. In order to describe this imbalance distribution of PVCC, six countries (or regions) are extracted as the contrasting analyses in this study, being: China, USA, Europe (partial), Australia, Brazil and India. The equilibrium of the PVCC distribution can be quantified as a “Gini index” which is commonly used as an indicator to measure the income gap of residents in a country or region. As shown in Equation (6), the Gini index is a value between 0 and 1, where 0 indicates the absolute equilibrium distribution of PVCC and 1 indicates the totally unequal distribution and 0.4 is generally used as the warning line to make a distinction between equilibrium and inequilibrium according to the definition of United Nations [38].It is worth noting, however, that the Gini index will change with the selected objects that are taken into calculation and that, according to the results of global assessment, the PVCC would usually decrease with the increase of urban population. Therefore, the equilibrium analysis of each county is conducted in the range of different urban scale sections, such as miniature cites and above and small cities and above (shown in Figure 3), and this would be used to discover in which section the largest distribution gap will occur. By combination then with the average level of PVCC and annual energy acquisition per capita in each urban scale (shown in Table 2), this would help to make further discussions on the adjustment strategies of the PV spatial planning in each country or region.
G = 1 2 n 2 · P V C C ¯ j = 1 n i = 1 n | P V C C j P V C C i |
where G is the Gini index; n is the number of cities selected; P V C C ¯ is the average value of PVCC in cities selected; P V C C j is the PVCC of the jth city; P V C C i is the PVCC of the ith city.

4. Discussions

4.1. How Could Different Optimization Strategies Make Changes on the PVCC?

Necessarily, as shown in Figure 2, the PVCC will be sensitive to each influence factor input in different degrees. Therefore, the beneficial effects from different methods of planning adjustment (Table 1) will change as well. For instance, reducing energy consumption will always be the most direct way to improve PVCC; methods of building morphology optimization and decreasing building density will also be positive in promoting irradiation acquiring; and it might not be the most efficient way to improve PVCC by building utility scale stations closer to urban load, because this merely reduces the transmission loss. Different optimization strategies will all help to improve PVCC more or less, but it is also worth noting that the beneficial effects brought by these optimization strategies will decrease with the upgrading of urban scale. In fact, their actual benefits might not always be as optimistic or even be limited. All optimization strategies show greater benefits in smaller urban scale such as miniature cites and small cities, but it can be seen from Table 2 that the original PVCC of these cities are already in a high level and that they are capable of meeting the PV consumption proportion even without any further adjustment. That said, the benefits of such optimization strategies in larger urban scales would probably become very limited. Taking the assumed global standard in this study as an example, by using all these optimization strategies, the PVCC in mega cities and super cities are likely to be improved on average, from 14.4% to 19.9% and 17.6% to 24.5%, respectively. That will, in most cases, fall short of meeting the desired 25%. Considering the difference of original PVCC in each country and the actual implementation difficulty, it could be roughly concluded that these optimization strategies might be effective only in urban scales that range from medium to large cities.

4.2. In Which Section Will the Largest PVCC Distribution Gap Occur?

As shown in Figure 3, the largest gap of PVCC distribution occurs between urban and non-urban areas. This reflects the fact that most of the PVCC are provided by sparsely populated areas and this situation is almost the same for all countries. In addition, this distribution gap will appear obviously between the medium cities and small cities in China and in miniature cities and small cities in USA and India. To illustrate the cause of these differences in PVCC distribution, we also conducted an equilibrium analysis of the distribution of influence factors in each country applying the same method as in Equation (6). If the distribution of certain influence factor tends to be even, then it cannot be the main reason to cause the gap of PVCC distribution. As shown in Table 3, the distribution of solar irradiation in each country does not show obvious imbalance sufficiently to effect the distribution of PVCC. The gap of PVCC distribution is mainly affected by the distribution differences of urban population density, built-up area and available land area. In fact, the gap of PVCC is closely related to the urban spatial layout of a country. As shown in Figure 4, the distribution of cities in the USA, Europe and India is more even, which makes the solar energy acquisition of each urban division relatively equal. Cities in Australia and Brazil are more closely around the harbors, but the only difference is that Brazil’s urban distribution is more dispersed, which leads to a higher average PVCC than that in Australia. Compared with countries above, however, the urban layout of China is gradually spreading and gathering from west to east, resulting in a huge gap in the distribution of PVCC. In order to achieve the overall PV development goal, China has to rely on long-distance power transmission, which would definitely break the key quality of high-efficient local utility. So, it can be concluded that the dispersed layout of cities and population is also of great significance for the future PV spatial planning.

4.3. What Should Be Done to Adjust the PV Spatial Planning?

The key point of PV spatial planning adjustment is the crucial means by which to determine the most effective way to improve PVCC. Optimization strategies by transformations of electricity consumption mode, urban planning or building morphology will be still feasible, but as mentioned above, these methods might only be effective in certain urban scales. Realistically, the adjustment of PV spatial planning needs to pay close attention to the actual condition of each country. In the case of Brazil and India, unless higher development target is proposed, it is unnecessary to contemplate their adjustment, because all the PVCC in each urban scale in either country has exceeded the proportion of global average PV consumption (refer to Table 2). For Australia, the average PVCC in urban areas is relatively low, because Australia has relatively few cities, which are each concentrated but mostly distributed some distance from each other, it will be able to meet the needs of future PV planning and development by just establishing a few utility scale PV stations and sufficient lengths of transmission lines. The PVCC in urban areas of USA and Europe is also at a low level, but, in fact, their energy acquisition per capita is even higher than other countries (refer to Table 2). Therefore, the method of controlling energy consumption would be more effective for these countries. As for China, the excessive urban agglomeration would serve to aggravate the gap in PVCC distribution, which might seriously impact the high-efficient utility of local energy and expand its overall transmission grid coverage. In this regard, the equilibrium development of different urban scales (especially scales below small cities and above medium cities) by adjustments of population distribution, urban layout or even industrial deployment, might become a more challenging problem currently faced by China in its overall PV planning.

4.4. What Is the Essence of Solar PV Spatial Planning?

The increasing utilization of renewable energy is essential to sustainable urban development in the future. In 2020, China put forward its guiding task for the development of renewable energy in the next five years [39]. To respond this, 30 provinces had also given out their own energy planning measures, which can be generally summarized into five aspects, including: (1) Increase the construction of renewable energy infrastructures to enhance the power generation capacity. (2) Deepen the reform of smart grid to realize the flexible allocation of power in urban area. (3) Expand the scale and capacity of trans-provincial power transmission to balance the difference of renewable energy power proportion in different regions. (4) Improve the manufacturing capacity and technology of renewable energy facilities to reduce the cost of power generation. (5) Transform the planning of energy storage facilities and energy utilization mode (electric vehicles, electric heating, etc.) to improve local renewable energy consumption. Apparently, all these measures are the continuation of previous cognition of “Power distribution and allocation”, in the working mode of which, the city (energy demand side) is still considered as the principal part of planning and the power planning has to be adjusted passively with the change of urban energy demand. An inevitable result of this is that, still we have to make large scale of investment into building thousands miles of transmission lines, merely to deliver solar energy, the ubiquitous resource on earth, from one place to another. However, as repeatedly stated before, the main obstacle to the large-scale utilization of solar PV is more likely to be the inadaptability of existing spatial planning, such as population distribution, urban layout or industrial deployment. Therefore, the PV spatial planning proposed in this study is essentially a kind of urban planning or national geographic spatial planning, which could balance the relation between energy demand and supply, coordinated with regional (or urban) economy, resources, social structure and other comprehensive planning elements. Such “PV spatial planning” requires the active adjustment of urban (and national geographic) planning to adapt the needs of large-scale PV utilization in the future. However, it is not meant that solar PV would become the dominant factor to determine the morphology or deployment of the city. Instead, it is just one factor related to many other planning elements (e.g., water resources, food, transportation capacity, natural disasters, ecological or historical protection). In addition, PV spatial planning does not deny any current attempt of optimization measures, but at least these measures need to be integrated into a hierarchical process to cope with the transformation of geographic and urban spatial planning. For instance: (1) At the very first hierarchy of national geospatial planning, it needs the reasonable deployment of urban location and population scale to reduce the gap of PVCC distribution and maximize the efficient use of local energy (2) Through the assessment of regional solar irradiation, available land conditions and other planning elements, the function target and PV development anticipate of the city (or region) should be then formulated. (3) Furthermore, at the hierarchy of urban planning, it determines the scope of urban land use, building density control standards, building function layout and the optimization strategy of building morphology, etc. Compare the adjustment strategies of each planning hierarchy, to explore the most effective way to achieve the optimal utilization of solar PV energy. Of course, such “PV spatial planning” is a kind of forward-thinking and might be regarded as a dispensable work for now, because, at least at present, the proportion of solar PV utilization is still at a low level, but with the rapid increasing utilization of renewable energy, such proactive adjustment of urban (or even geographic) spatial planning may be of great significance for achieving higher solar energy supply in the future.

5. Conclusions

Out of the demand for energy sustainability, solar PV will gradually play an important role in future energy consumption. PV utilization focuses on the improvement of power consumption proportion, meanwhile, it also needs the reasonable deployment of energy and urban development. Both of these factors are the key elements in the construction of energy systems in the future. As discussed herein, the spatial planning of PV might not only be the planning of solar PV itself, the cognition of PV spatial planning needs to be transformed into a kind of urban or even national geographic spatial planning, in the progress of which solar PV utilization should be taken as an important planning element into consideration. The concept of PVCC described in this study established a link between the PV development anticipation and its close relationship to other spatial planning on the one hand and make people think about PV utilization from a view of resource and environment carrying capacity on the other hand. Such carrying capacity may in turn become a valid intuitive concept for future PV spatial planning, providing analysis capabilities and methods, with which the spatial planners could make comparisons and decisions to plan future courses of action. At the very least, it is suggested that the framework in this study can be considered as a starting point, aiming to stimulate interdisciplinary discussions between renewable energy developers, urban planners and policy makers. The methods mentioned in this study may be still not precise or comprehensive enough to make implementable planning adjustments independently, after all, only six factors were fit into the comparison, but they do provide the logic to figure out optimal solutions in the process of PV spatial planning by analyzing PVCC distribution and comparing the beneficial effects from each optimization strategy. Therefore, we can conclude that these tentative methods are available, but still need to be connected with other planning elements (or detailed influence factors) to give both planners and policy-makers the ability to guide the feasible PV spatial planning in each hierarchy, for the time being and in the foreseeable future.

Author Contributions

Conceptualization, Y.Z. and S.C.; methodology, S.C.; software, S.C.; validation, Y.Z., J.Z. and S.C.; formal analysis, S.C.; investigation, S.C.; resources, S.C.; data curation, S.C.; writing—original draft preparation, S.C.; writing—review and editing, Y.Z., J.Z. and S.C.; visualization, S.C.; supervision, J.Z.; project administration, J.Z.; funding acquisition, Y.Z., J.Z. All authors have read and agreed to the published version of the manuscript.

Funding

This research was funded by National Natural Science Foundation of China, grant number 51978443, National Natural Science Foundation of China, grant number 52078322, National Natural Science Foundation of China, grant number 51708395 and The APC was funded by National Natural Science Foundation of China, grant number 51708395.

Institutional Review Board Statement

Not applicable.

Informed Consent Statement

Not applicable.

Data Availability Statement

Data is contained within the article or supplementary.

Acknowledgments

Not applicable.

Conflicts of Interest

The authors declare no conflict of interest. The funders had no role in the design of the study; in the collection, analyses, or interpretation of data; in the writing of the manuscript, or in the decision to publish the results.

References

  1. IRENA. Future of Solar Photovoltaic: Deployment, Investment, Technology, Grid Integration and Socio-Economic Aspects (A Global Energy Transformation: Paper); International Renewable Energy Agency: Abu Dhabi, United Arab Emirates, 2019. [Google Scholar]
  2. IRENA. Renewable Power Generation Costs in 2017; International Renewable Energy Agency: Abu Dhabi, United Arab Emirates, 2018. [Google Scholar]
  3. Blaschke, T.; Biberacher, M.; Gadocha, S.; Schardinger, I. ‘Energy landscapes’: Meeting energy demands and human aspirations. Biomass Bioenergy 2013, 55, 3–16. [Google Scholar] [CrossRef] [PubMed] [Green Version]
  4. Stremke, S.; van den Dobbelsteen, A. Sustainable Energy Landscape; CRC Press: Boca Raton, FL, USA, 2013. [Google Scholar]
  5. Nadaï, A.; Van der Horst, D. Introduction: Landscapes of Energies. Landsc. Res. 2010, 35, 143–155. [Google Scholar] [CrossRef] [Green Version]
  6. Rees, W.; Wackernagel, M. Urban ecological footprints: Why cities cannot be sustainable—And why they are a key to sustainability. Environ. Impact Assess. Rev. 1996, 16, 223–248. [Google Scholar] [CrossRef]
  7. Malthus, T.R. An Essay on the Principle of Population; St Paul’s Church-Yard: London, UK, 1798. [Google Scholar]
  8. UNESCO & FAO. Carrying Capacity Assessment with a Pilot Study of Kenya: A Resource Accounting Methodology for Exploring National Options for Sustainable Development; Food and Agriculture Organization of the United Nations: Rome, Italy, 1985. [Google Scholar]
  9. Wackernagel, M.; Rees, B. Our Ecological Footprint: Reducing Human Impact on the Earth; New Society Publishers: Philadelphia, PA, USA, 1996. [Google Scholar]
  10. Vitousek, P.M.; Ehrlich, P.R.; Ehrlich, A.H.; Matson, P.A. Human appropriation of the products of photosynthesis. BioScience 1986, 36, 368–373. [Google Scholar] [CrossRef]
  11. Odum, H.T. Environmental Accounting: Emergy and Decision Making, 1st ed.; John Wiley and Sons Inc.: New York, NY, USA, 1996. [Google Scholar]
  12. Feng, Z.M.; Yang, Y.Z.; Yan, H.M.; Pan, T.; Li, P. A review of resources and environment carrying capacity research since the 20th Century from theory to practice. Resour. Sci. 2017, 39, 379–395. [Google Scholar]
  13. Zhang, L.; Nie, Q.; Chen, B.; Chai, J.; Zhao, Z. Multi-scale evaluation and multi-scenario simulation analysis of regional energy carrying capacity-Case study: China. Sci. Total Environ. 2020, 734, 139440. [Google Scholar] [CrossRef] [PubMed]
  14. Xue, R. Research on Fuzhou Energy Ecological Footprint and Ecological Carrying Capacity Based on Net Primary Productivity Model. Anhui Agric. Sci. 2020, 48, 64–67. [Google Scholar]
  15. DeAngelis, D.L.; Zhang, B.; Ni, W.M.; Wang, Y. Carrying Capacity of a Population Diffusing in a Heterogeneous Environment. Mathematics 2020, 8, 49. [Google Scholar] [CrossRef] [Green Version]
  16. Peng, X.; Zhu, H.; Zhu, E. Evaluation and Analysis of Energy Bearing Capacity in Beijing-Tianjin-Hebei Region: Based on data from 2007–2011. J. Cap. Univ. Econ. Bus. 2015, 17, 15–22. [Google Scholar]
  17. Mentis, D.; Welsch, M.; Nerini, F.F.; Broad, O.; Howells, M.; Bazilian, M.; Rogner, H. A GIS-based approach for electrification planning-A case study on Nigeria. Energy Sustain. Dev. 2015, 29, 142–150. [Google Scholar] [CrossRef]
  18. Sabo, M.L.; Mariun, N.; Hizam, H.; MohdRadzi, M.A.; Zakaria, A. Spatial matching of large-scale grid-connected photovoltaic power generation with utility demand in Peninsular Malaysia. Appl. Energy 2017, 191, 63–88. [Google Scholar] [CrossRef]
  19. Watson, J.J.W.; Hudson, M.D. Regional Scale wind farm and solar farm suitability assessment using GIS-assisted multi-criteria evaluation. Landsc. Urban Plan 2015, 138, 20–31. [Google Scholar] [CrossRef]
  20. Lee, A.H.; Kang, H.Y.; Lin, C.Y.; Shen, K.C. An Integrated Decision-Making Model for the Location of a PV Solar Plant. Sustainability 2015, 7, 13522–13541. [Google Scholar] [CrossRef] [Green Version]
  21. Mohajeri, N.; Upadhyay, G.; Gudmundsson, A.; Assouline, D.; Kämpf, J.; Scartezzini, J.L. Effects of urban compactness on solar energy potential. Renew. Energy 2016, 93, 469–482. [Google Scholar] [CrossRef] [Green Version]
  22. Natanian, J.; Auer, T. Balancing urban density, energy performance and environmental quality in the Mediterranean: A typological evaluation based on photovoltaic potential. Energy Procedia 2018, 152, 1103–1108. [Google Scholar] [CrossRef]
  23. Sarralde, J.J.; Quinn, D.J.; Wiesmann, D.; Steemers, K. Solar energy and urban morphology: Scenarios for increasing the renewable energy potential of neighbourhoods in London. Renew. Energy 2015, 73, 10–17. [Google Scholar] [CrossRef] [Green Version]
  24. Lobaccaro, G.; Frontini, F. Solar Energy in Urban Environment: How Urban Densification Affects Existing Buildings. Energy Procedia 2014, 48, 1559–1569. [Google Scholar] [CrossRef] [Green Version]
  25. Yin, L. Annual Report on World Smart City (2016–2017); Social Sciences Academic Press: Beijing, China, 2017. [Google Scholar]
  26. IEA. Energy Technology Perspectives 2016: Towards Sustainable Urban Energy Systems; International Energy Agency: Paris, France, 2016. [Google Scholar]
  27. China Electricity Council. Code for Design of Photovoltaic Power Station (GB50797-2012); China Planning Press: Beijing, China, 2012. [Google Scholar]
  28. Sophie, B.; Pierre, D.; Van Bogaert, E.; Arino, O.; Kalogirou, V.; Perez, J.R. GLOBCOVER 2009 Products Description and Validation Report; UC Louvain: Leuven, Belgium; ESA Team: Paris, France, 2011. [Google Scholar]
  29. Hernandez, R.R.; Hoffacker, M.K.; Field, C.B. Efficient use of land to meet sustainable energy needs. Nat. Clim. Chang. 2015, 5, 353–358. [Google Scholar] [CrossRef]
  30. Available online: http://www.rivermap.cn/ (accessed on 4 November 2019).
  31. Available online: http://due.esrin.esa.int/page_globcover.php (accessed on 12 October 2019).
  32. Center for International Earth Science Information Network—CIESIN—Columbia University. Gridded Population of the World, Version 4 (GPWv4): Population Density Adjusted to Match 2015 Revision UN WPP Country Totals; NASA Socioeconomic Data and Applications Center (SEDAC): New York, NY, USA, 2016. [Google Scholar]
  33. Available online: https://solargis.com/cn/maps-and-gis-data/download (accessed on 4 November 2019).
  34. Available online: https://data.worldbank.org/ (accessed on 14 July 2020).
  35. Central Intelligence Agency. The CIA World Facebook 2018–2019; Skyhorse Publishing: New York, NY, USA, 2018.
  36. Available online: https://www.jinkosolar.com/ (accessed on 26 July 2020).
  37. The State Council of China. Notice on Adjusting the Standard of City Scale Division; The State Council of China: Beijing, China, 2014.
  38. Han, J.; Zhao, Q.; Zhang, M. China’s income inequality in the global context. Perspect. Sci. 2016, 7, 24–29. [Google Scholar] [CrossRef] [Green Version]
  39. National Energy Administration of China. Notice on the Preparation of the 14th Five Year Plan for Renewable Energy Development; Comprehensive Department of National Energy Administration: Beijing, China, 2020.
Figure 1. Assessment on PVCC of global urban divisions.
Sustainability 13 03149 g001
Figure 2. Sensitivity analysis of PVCC to influence factors in different urban scales. Note: The length of each colored bar indicates the range of percentage of PVCC change by adjusting each influence factor to ±50%. In addition, the urban types are classified by its population scale, Miniature city: 50,000–200,000, Small city: 200,000–500,000, Medium city: 500,000–1,000,000, Large city I: 1,000,000–3,000,000, Large city II: 3,000,000–5,000,000, Super city: 5,000,000–10,000,000, Mega city: >10,000,000.
Sustainability 13 03149 g002
Figure 3. Gini indices of PVCC distribution in each urban scale section of different countries. Note: The definition of Gini index value: 0.0–0.2 Absolutely average, 0.2–0.3 Comparative average, 0.3–0.4 Relatively reasonable, 0.4–0.5 Large disparity, 0.5–1.0 Great disparity. The value of 0.4 is generally considered as the warning line.
Sustainability 13 03149 g003
Figure 4. Comparison of urban spatial layout and PVCC distribution in each country or region.
Sustainability 13 03149 g004
Table 1. Influence factors of PVCC and its corresponding optimization strategies.
Influence FactorsCorresponding Optimization Strategies
Solar irradiationChoosing PV panels of higher conversion efficiency, PV installation on building facades or using inclined roof to gain more irradiation in the same land area
Urban population densityWhen the urban built-up area is constant, population density will change with the variation of building density
Built-up areaUrbanization in spatial dimension, urbanization or counter-urbanization, make more land into built-up area or in the opposite
Electricity consumption per capitaReduce building energy consumption, change people’s electricity consumption habits or develop low-carbon economy
Available land areaExploit more land to achieve more installation area (for utility scale photovoltaic stations)
Transmission distanceCloser site selection to urban load to decrease transmission line loss
Table 2. Average level of PVCC and annual energy acquisition per capita in each urban scale.
Urban ScaleAverage PVCC (%)Annual Average Energy Acquisition Per Capita (kWh)
ChinaUSAEuropeAustraliaBrazilIndiaWorldChinaUSAEuropeAustraliaBrazilIndiaWorld
Miniature cities146.8%38.8%52.9%27.1%118.7%411.7%428.6%5887.24948.72599.42603.42879.53236.74776.9
Small cities62.1%18.8%34.8%16.2%64.1%248.0%203.2%2568.32287.91678.31556.21513.21794.12132.2
Medium cities26.7%12.3%29.3%11.3%44.8%257.1%82.7%1193.71597.91302.71083.71082.31690.31389.1
Large cities I20.8%10.9%21.4%14.2%36.9%175.0%88.8%929.51376.61088.01370.6891.51209.91141.4
Large cities II18.8%9.0%17.3%10.1%32.3%99.2%40.5%820.11198.9881.6972.7780.1798.1891.8
Super cities17.0%7.3%19.7%-26.3%99.9%65.1%732.4988.9936.3-635.0694.5782.6
Mega cities13.9%5.1%8.9%-27.8%109.9%34.9%600.2670.9519.5-671.9652.7611.6
Note: The data in this table are extracted from the global PVCC assessment results of this study, by calculating the average level of each urban scale, according to the scope of each sample country.
Table 3. Gini indices of influence factors distribution in each urban division of different countries.
Influence FactorsChinaUSAEuropeAustraliaBrazilIndia
Electricity consumption per capita------
Solar irradiation0.080.070.090.060.040.04
Urban population density0.420.330.420.290.400.58
Built-up area0.740.700.610.690.740.70
Available land area0.670.500.420.750.360.87
Transmission distance0.310.220.190.420.280.28
Note: The influence factors are arranged in descending order by the sensitivity of PVCC to each. The data of electricity consumption per capita is the overall level of a country, considering the similarity of electricity consumption behavior, the specific impact of its distribution is therefore ignored in this study.
Publisher’s Note: MDPI stays neutral with regard to jurisdictional claims in published maps and institutional affiliations.

