1. Introduction
Across industries and geographies, stakeholder pressures have created an environment in which a successful corporate strategy is defined by, and dependent on, the integration of strategic objectives related to environmental and social challenges for which organizations are held accountable. In response to this overall greater awareness and concern about an organization’s activity and related positive and/or negative effects, businesses have engaged in various sustainability initiatives, e.g., sustainability reporting, to monitor and tackle the existing issues. Open communication and transparency are nowadays key aspects in the process of enhancing an organization’s accountability. Hence, “accountability involves the responsibility to undertake certain actions and the responsibility to provide an account of those actions” [
1] (p. 126). However, as stated in the research of Adams [
2], the collection of environmental data is not directly connected to the systems for collecting economic data, confirming limitations to mere financial reporting. Therefore, the field of accounting for more integrated performance has been developed, in particular that of sustainability reporting, which goes beyond financial/economic reporting, to also include the other two aspects of the Triple Bottom Line (TBL): information related to environmental and social performance. Disclosing sustainability-related information through a sustainability report (SR) can be regarded as an important strategic key element to foster the trust, loyalty and confidence of different stakeholders, as an SR can serve as proof that an organization accounts for more than just profitability [
3]. In the mainstream business literature, a significant amount of research has been conducted in terms of identifying the motivations and drivers to engage in sustainability reporting [
2,
4,
5,
6]. The organizational practice itself remains mainly voluntary [
7], leaving room for experimenting on what to disclose and which guidelines to use. The Global Reporting Initiative (GRI) is, at present, the best-known and generally accepted framework offering guidelines for the practice; it was founded in light of standardizing and improving comparability of SRs on a global level [
8]. However, in spite of these convergence efforts, comparability between SRs is still often limited because of differing external (institutional environment) and internal (organizational characteristics) factors [
5,
9], reflected in differences in content and quality of SRs. A good understanding of both internal and external determinants is necessary in order to further improve the development of sustainability reporting frameworks and diminish the variations in their global application.
Despite a rapid increase in attention to and importance of sustainability reporting in many industries, its value has not been fully recognized by the maritime industry and ports in particular. However, due to the COVID-19 pandemic, the importance to continuously monitor the economic, social and environmental situation of the port cluster has increased, including the development of a common understanding among key stakeholders on the impact of disruptive events on the TBL and the necessity to adopt strategies towards increased resilience. While ports are considered essential infrastructures during the pandemic, continuing their operations while being heavily impacted (e.g., at the level of strong traffic decreases, or cargo build-up at terminals), the future outlook is rather uncertain as value chains and trade may be structurally impacted by the increase in e-commerce, and substantial re- and nearshoring of economic activities may take place to reduce dependencies from distant manufacturers of essential goods [
10].
Further, academic research on the topic remains rather scarce and in an emergent phase [
11,
12]. Exploratory research based on a content analysis of ten SRs of leading seaport managing bodies, all based on the GRI framework, revealed that significant differences exist at the level of indicators reported (i.e., applied definitions and calculation methods for, e.g., employment, emissions), boundary levels of reporting, as well as stakeholder inclusion in the process. Differences emerge from the wide variety of governance structures influencing the scope of activities undertaken by PMBs, e.g., landlord ports versus service ports, as well as available human and financial resources (due to different organizational sizes) and organizational culture [
13]. Building upon this research, this paper contributes with new empirical insights to this emerging field through the identification of the organizational and contextual factors that positively/negatively influence the practice of sustainability reporting by PMBs on an international level.
We start by reformulating (controllable) organizational determinants identified in existing literature across industries [
6,
9,
14,
15,
16,
17,
18] and adapt those to the specific context of ports, and PMBs in particular. We also add a newly defined determinant ‘sustainability integration’ that tries to capture the extent to which sustainability, in all its aspects, is part of the ‘organizational DNA’. Furthermore, in order to explain the influence of the environment and society—to which PMBs are contingent—on the initiation of sustainability reporting, we apply Institutional Theory. This theory has already proven its validity across different domains, as it leads to a better understanding of the dynamics independent of strategic analysis in sustainability decision making [
19,
20]. With regard to seaports, the application of this theory has been very limited [
21,
22,
23]. This paper not only adds value to the literature by making use of Institutional Theory as an explanatory crux, but also by applying those theoretical insights to real empirical data in order to (in)validate existing assumptions.
The collection of data was accomplished by means of an online survey that was developed in direct collaboration with the International Association of Ports and Harbors (IAPH). Hahn and Kühnen [
9] reveal, in their literature review of 178 articles related to sustainability reporting as a practice in business, management and accounting research, that a survey technique was only used in a mere 4% of those papers. Furthermore, 58% of the analyzed papers are based on document analyses showing a general deficit in both exploratory and confirmatory approaches. By applying the survey technique, we were able to conduct an analysis with a higher level of managerial-driven psychological depth than most research based on content analysis. It is the first study to generate broader institutional insights based on the real answers of port managers and link these with the results of a regression analysis in order to maximally reveal the driving mechanisms behind sustainability reporting in the port sector. The results in this paper do not show individual cases, as responses have been processed on an anonymous basis and in strict confidence. In brief, our analysis contributes to the existing literature in several ways: (1) little is thus far known about sustainability reporting by PMBs on a global scale, (2) it incorporates many existing determinants into one large model and identifies the new determinant ‘sustainability integration’, (3) it employs a survey, (4) Institutional Theory, based on real empirical results, is applied.
This paper is structured as follows:
Section 2 provides an overview of identified determinants that have a positive/negative influence on the adoption of sustainability reporting. For each determinant, the specific context of PMBs will be discussed.
Section 3 positions Institutional Theory in the context of ports and explains the institutional forces to which PMBs respond.
Section 4 discusses the methodology. The analysis and discussion of the results are provided in
Section 5, which is further divided into two subsections, each focusing on a separate research question:
- ○
What are the determinants influencing the practice of sustainability reporting in the context of PMBs?
- ○
Which organizational characteristics and institutional pressures emerge together and play a role?
This paper concludes with some managerial implications, limitations of the research, as well as suggestions for future research.
2. Determinants Influencing Sustainability Reporting
The most well-known benefit of sustainability disclosure is that of reducing information asymmetry between the organization and its stakeholders, eliminating room for speculation, and thus diminishing the overall risk level of the organization [
14,
24,
25]. However, even with the knowledge of the advantages of sustainability reporting, many organizations still opt against initiating the development of an SR. The main identified reason relates to organizational costs linked to the disclosure of sustainability information: “the costs of measuring, verifying, collating and publishing environmental information, and the loss of strategic discretion associated with making public commitments to verifiable future actions and/or performance” [
14] (p.122).
As stated by Cormier and Magnan [
25], decisions made with regard to defining a sustainability disclosure strategy will always be the result of a cost–benefit analysis (sometimes intrinsic). Decision making in light of sustainability disclosure is therefore expected to depend upon a range of organizational and environmental aspects that influence the benefits and costs (including opportunity costs) of disclosing such information. Sustainability reporting will be more costly for some organizations than for others. Through the years, and across various industries, countries and institutional environments, several (controllable) organizational characteristics have been identified as significant explanatory variables to clarify the initiation and existence of sustainability reporting [
9,
14,
15,
16,
17,
18,
26,
27,
28]. We selected those variables that would also apply to the port industry, and adjusted them to the specific context of PMBs. Furthermore, we also added variables rarely investigated in literature, e.g., the number of social/environmental certifications, and a newly defined one, i.e., sustainability integration. In the analysis that follows, we start by reformulating the selected determinants in light of the context of the port industry and attempt to detect the extent to which they apply to PMBs.
2.1. Size and Organizational Visibility
The assumption that there is a positive relationship between the size of an organization and the level of sustainability disclosure has been analyzed and confirmed by multiple studies in recent decades [
9,
14,
16,
17,
18,
24,
28,
29,
30]. Several arguments exist in support of this positive correlation. Firstly, in general, larger organizations occupy spotlight positions, causing their activities to be more visible to the public, external agents and governments. As such, they are also exposed to a higher degree of attention from stakeholders in relation to their sustainability efforts, translated into greater pressures [
14]. Secondly, as those larger organizations are monitored by the public eye, they are expected to handle matters in a way that benefits society. In order to limit those external pressures, they are more willing to voluntarily disclose information [
16]. Thirdly, as mentioned above, the preparation and disclosure of Triple Bottom Line information is costly. Compared to small- and medium-sized organizations, larger ones possess the necessary resources (financial and human) to collect, analyze and report data [
17,
28].
Research of Ashrafi et al. [
11] shows that the same reasoning holds in the context of ports. The adoption of sustainability initiatives seems to be correlated with the size of the port, as most small- and medium-sized ports did not adopt any sustainability measure, most likely explained by the expenses associated with it. Hence, the related hypothesis is stated as follows:
Hypothesis 1 (H1). There is a positive relationship between the size of the PMB and the production of an SR, ceteris paribus.
2.2. Financial Performance
Several studies have looked at the possible association between an organization’s financial performance and the disclosure of TBL information [
9,
16,
17,
18]. A higher level of financial performance is often associated with a higher level of power, translating into a higher level of stakeholder pressure. Being in a good financial condition increases the ability and flexibility to bear costs that are linked to investments in sustainability initiatives, of which sustainability reporting is one [
9], as well as costs linked to revealing potentially damaging information [
31]. It is therefore expected that organizations with a higher financial performance will more easily disclose TBL information to differentiate themselves and minimize the possibility of adverse selection [
32].
Research conducted by Kuznetsov et al. [
33] shows that small ports are not very willing to invest in environmental management systems, as such investment causes a burden upon their net profit. Small- and medium-sized ports often mention a reduction in profits or at best make reference to a break-even situation when it comes to investments in sustainability actions [
11]. However, financial performance as a separate variable in the analysis of sustainability reporting by PMBs has not been previously researched. In our study, we will use total annual operating revenue/financial turnover as a proxy to indicate financial performance, as, currently, no commonly accepted indicator exists, due to, inter alia, different governance frameworks and/or PMB business models. The hypothesis is as follows:
Hypothesis 2 (H2). There is a positive relationship between a PMB’s financial performance and the production of an SR, ceteris paribus.
2.3. Country/Region
Countries are characterized by different legal frameworks, national culture and behavior. The question remains as to whether these variations are reflected in the practice of sustainability reporting. Some countries, e.g., Sweden, and continental groupings, e.g., the EU, have chosen to enact some ground rules as well as binding policies with regard to sustainability reporting [
34,
35]. In addition to the legal environment in which organizations operate, the national culture of a country, not only in terms of history and tradition, but also in terms of moral values, can also influence the decision making and handling of organizations. Prevailing moral values shape the ethical behavior of an organization and thus have an influence on the issues an organization selects as being worthy of resource allocation [
2,
36].
Research of Santos et al. [
23] indicates that the national context in which the PMB operates plays a role in the existing variety when it comes to sustainability communication. Additionally, previously conducted exploratory research, based on a content analysis comparison of SRs of ten different leading PMBs, shows country dependence differences [
13]. For this reason, we define the following hypothesis:
Hypothesis 3 (H3). The region of origin has an influence on the practice of sustainability reporting by PMBs, ceteris paribus.
2.4. Level of Autonomy
Only limited extant literature has analyzed the impact of different ownership structures, i.e., private vs. public, on the disclosure of environmental and social information [
18,
26,
28]. According to Santos et al. [
23], when looking at possible determinants for sustainability disclosure, the integration of information on ownership structures has not been applied for the port sector. Nevertheless, the situation of PMBs regarding their ownership structure is highly complex and thus interesting to investigate in this context. While the ownership structure of a PMB is often considered a hybrid structure, as shareholders can be a mix of the public and private sector, in most cases the ownership structure does not provide a clear representation of the actual level of autonomy of managerial decision making. This means that while many PMBs act like limited liability companies with varying executive power, they are obliged to report back to their private and/or public shareholders, i.e., local, regional and national governments [
37,
38]. In general, because of this hybrid nature, PMBs are confronted with substantial public–private interactions and interests both on a daily basis and in longer-term strategic decision making, showing the need for good and transparent communication strategies in order to continue to evolve toward the same objective [
39]. This, in extension, also applies to decisions related to the adoption of sustainability practices, as an increased level of autonomy will also increase the accountability of port managers. In light of the specific context of ports, we formulate the following hypothesis:
Hypothesis 4 (H4). There is a positive relationship between the level of autonomy of a PMB and the production of an SR, ceteris paribus.
2.5. Stakeholder Inclusion
In recent decades, a wide array of research has already highlighted the need for multidimensional information when it comes to sustainability reporting in comparison to traditional financial reporting, as the audience is not limited to shareholders alone [
40,
41]. Various salient stakeholders (clients, government, local community, etc.) demand a clear view on an organization’s business conduct, taking into account all TBL domains [
9]. As stated by Bellucci and Manetti [
40] (p. 92):
“Dialogue with stakeholder groups is essential for sustainability reporting because it enables organizations to create truly material and relevant reports about the true creation of value for all stakeholders”.
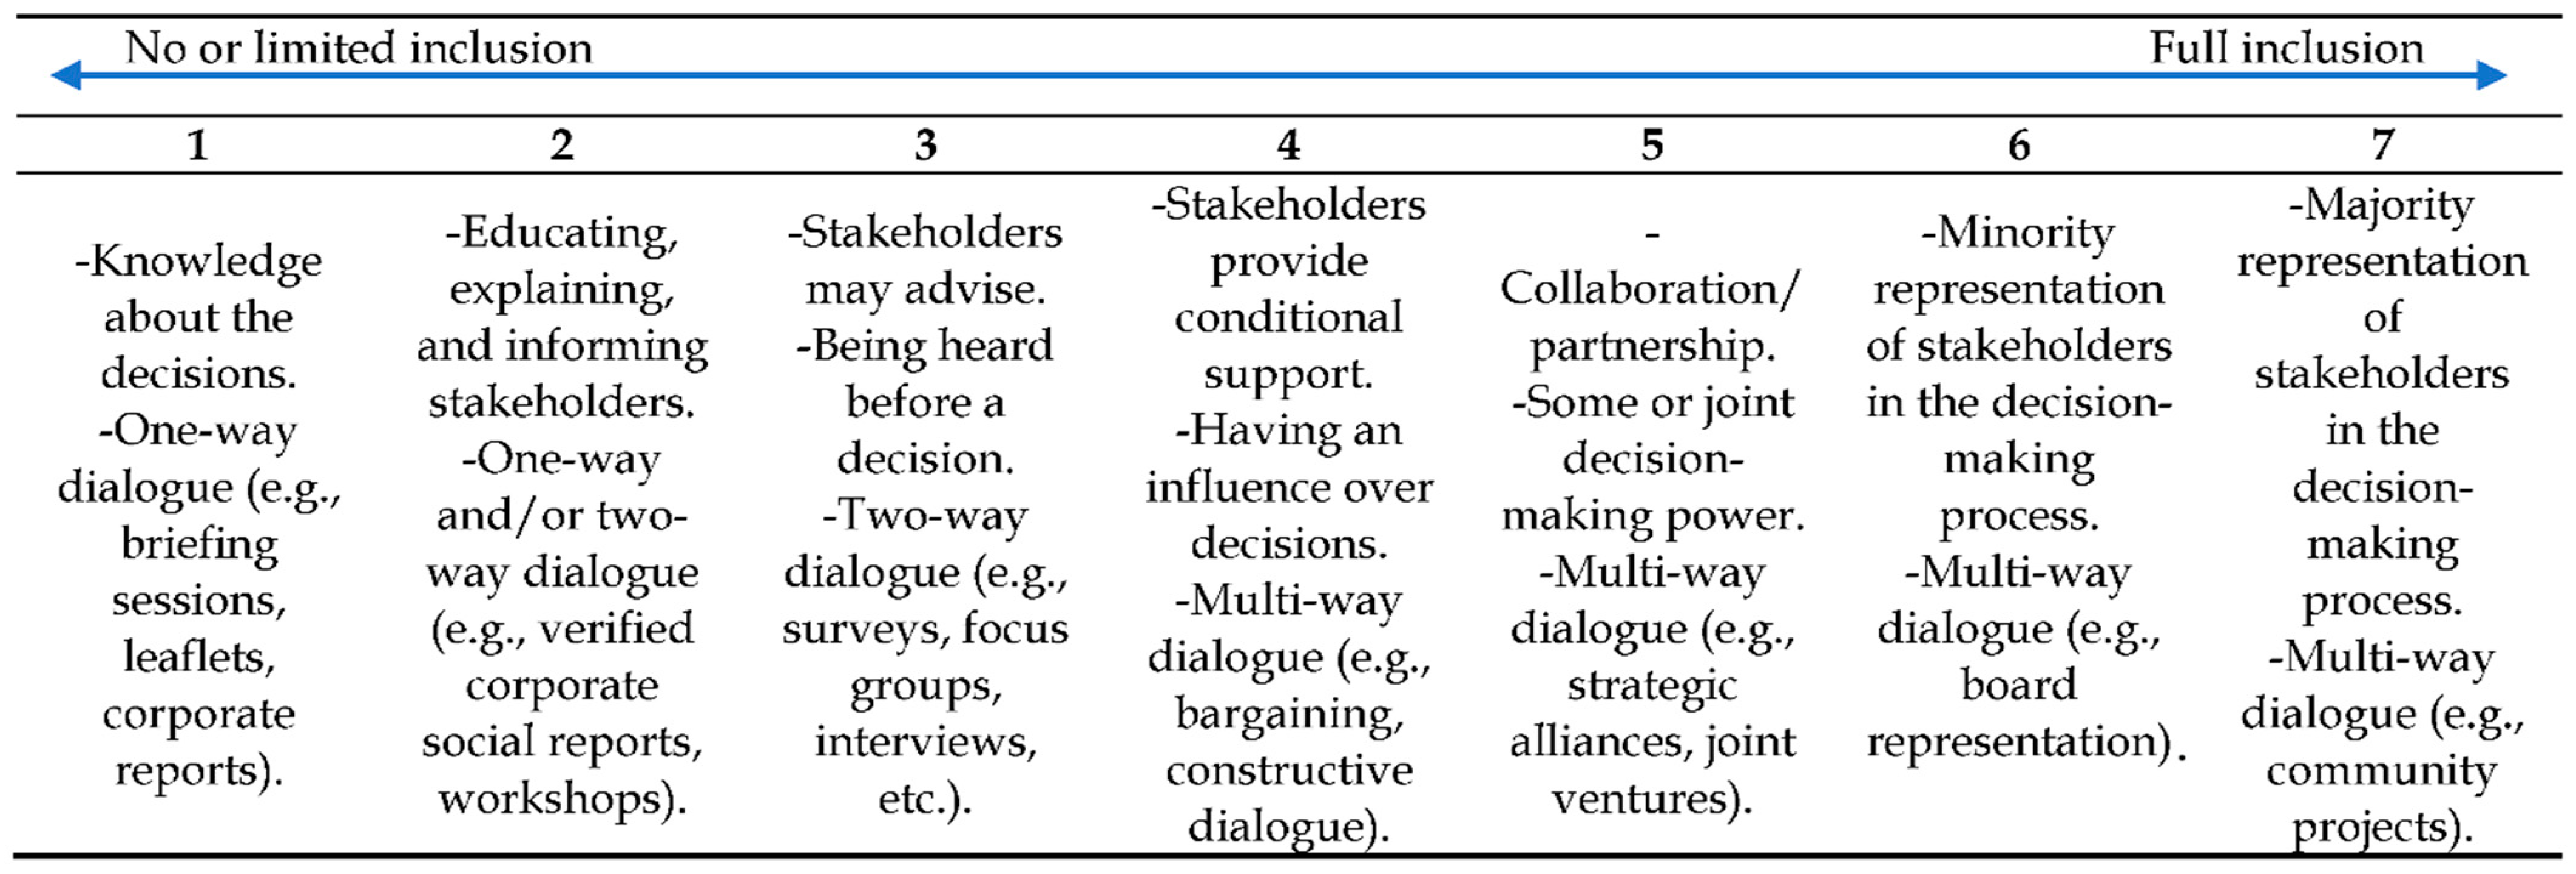
This dialogue can entail different degrees of involvement and models, in the range of no-or- limited inclusion (informing, one-way dialogue) to full inclusion (majority of stakeholder representation in the decision making). However, some authors claim [
42,
43,
44] that, to date, organizations have used stakeholder inclusion more in an opportunistic manner, essentially as a legitimation tool to change stakeholders’ expectations. Therefore, we believe that the lower the level of stakeholder inclusion, the greater the chance an SR’s purpose will be limited to that of legitimacy. The opposite reasoning holds as well: the higher the level of inclusion of stakeholders, the more the organization wishes to achieve a consensus of stakeholders’ needs and expectations, which will, in turn, be reflected in an SR. Only when stakeholders are consulted to a high degree and on an ongoing basis will the content of an SR not only show what the focal organization believes its stakeholders want to know but also those issues (positive and/or negative) that are regarded as material by the stakeholders themselves. Research of Geerts and Dooms [
45] shows the importance of good and open communication between an organization and its stakeholders, as results show that what is material for stakeholders is not always supported to the same extent by the focal organization, and this also applies to the underlying reasons as to why organizations (should) produce an SR [
27].
In the specific context of ports, the approach towards proper stakeholder inclusion is even more complicated because of the prevailing hybrid ownership structures and the variety of involved stakeholder groups, with all aiming for different (sometimes conflicting) objectives [
45,
46]. Port managers are increasingly aware of the fact that disclosure should consist of a range of diverse topics, tailored to the needs and demands of each individual stakeholder group, in order to reduce the risk of information asymmetry. Hence, we formulate the following hypothesis:
Hypothesis 5 (H5). The higher the level of stakeholder inclusion in general strategy formulation, the greater the chance that a PMB will publish an SR, ceteris paribus.
2.6. History of Performance Data Gathering
For several decades, organizations have been obliged to disclose information on their financial/economic situation, translating into a certain (minimum) need for data collection and analysis. However, with the increase in importance of social and environmental aspects linked to business activities [
47] and the associated reporting, this also calls for a more holistic and comprehensive approach regarding the data gathering efforts of organizations. Unfortunately, most data and information related to social and environmental aspects cannot be found in the public space, as it concerns tailored information. The process of data gathering and analysis requires time, resources and sometimes proprietary and tailor-made built-in measuring models. These challenges are exacerbated in the context of PMBs, as they often rely on external stakeholders for data collection in order to gain insights as to the impacts of the operations of the port cluster [
48]. We believe that when an organization is willing to invest in collecting and analyzing data beyond the necessary, this also indicates that the organization is willing to commit supplementary resources with regard to sustainability initiatives, of which sustainability reporting is an important one. The combined tangible efforts oriented toward data gathering and the associated performance reporting provide the impression of caring, as the organization tries to keep track of its progress across all the Triple Bottom Line domains. Vice versa, if an organization is not willing to invest, or maybe not able to collect extra information due to resource barriers, this will negatively influence the potential for producing an SR. In light of this reasoning, we define the following hypothesis:
Hypothesis 6 (H6). The more comprehensive the history of performance data gathering as part of the general corporate strategy, the greater the chance a PMB will publish an SR, ceteris paribus.
2.7. Proximity to the City
Research of Adams [
2] shows that organizations with on-site head offices pay greater attention to the ‘well-being’ of local communities than organizations that do not have their head offices on site. For the latter, shareholders and employees are the most important stakeholders, for whom a traditional financial report is often enough. The same logic holds for the port industry. According to Darbra et al. [
49], the space between ports and cities, i.e., the proximity of the two to one another, influences the corporate social responsibility behavior of the PMB, as it constitutes a variable in the construct of potential stakeholder conflict. Reporting practices can be regarded as a partial response to the need for intense stakeholder interaction to manage expectations of, and disagreements with, the local community [
40]. We believe that the closer a PMB is located to densely populated areas, the larger its visibility will be, the higher the importance of local communities as stakeholders will be, and thus the larger the role an SR may play in contributing to the support for port activities. For these reasons, we formulate the following hypothesis:
Hypothesis 7 (H7). There is a positive correlation between the proximity of a PMB to a city and the publication of an SR, ceteris paribus.
2.8. Environmental and Social Certifications
Organizations often strive to achieve compliance with several environmental and social standards, as this emphasizes a part of their strategic posture, i.e., adherence to standards strengthens their ‘sustainable’ image towards stakeholders. Those certifications are means of proof that the organization is willing to differentiate itself from its industry peers through an independent auditing of its adherence to and application of social and environmental management procedures. At present, various standards, codes and schemes, both on the general and industry-specific level, have been developed to certify a port’s environmental and social performance (ISO 14001, ISO 26000, PERS, GreenMarine, etc.), all promoting and contributing to the adoption of better sustainability practices [
50,
51]. Following this reasoning, we believe that the eagerness to obtain environmental/social certificates will also be translated into a larger willingness to produce a SR. To our knowledge, no other study in the domain of ports has considered this variable as a potential determinant of sustainability disclosure. The hypothesis is formulated as follows:
Hypothesis 8 (H8). There exists a positive relationship between the number of environmental/social certificates/labels a PMB has obtained and the production of an SR, ceteris paribus.
2.9. Sustainability Integration
The concept ‘sustainability’ goes beyond pure environmentalism. Not only does it refer to the safeguarding of natural systems and resources, but it also comprises the principles of social equity and economic development. Sustainability implies an acknowledgement of the fact that these different aspects do not work as stand-alone mechanisms, but are rather parts of a larger global perpetual system. Translating this into an approach on the organizational level is a complex undertaking, as it requires a proactive attitude towards sustainability at multiple levels throughout organizational structures and systems. Many individual initiatives in the context of sustainability can be undertaken by organizations, and these provide an indication as to the amount of invested effort. However, a long-term commitment to sustainability requires economic, environmental and social considerations to be regarded as part of the core business activities of the organization, while simultaneously being supported by and reflected in the organizational culture, i.e., through norms, values and beliefs [
52,
53]. If steps and actions towards sustainable development are undertaken, organizations will always make sure that these improvements will be communicated to the public, as not only the actions alone, but also the transparency pertaining to these actions have benefits such as, among others, building trust and loyalty, and improvement of stakeholder relations [
54]. One of the means of communication that is gaining in importance is an SR, as it serves as a complement to the financial report, showing longer-term commitment to sustainability.
We believe that the amount and type of sustainability initiatives an organization implements and the degree of integration of the initiatives across organizational levels and functions act as indicators of the extent to which sustainability is incorporated into the ‘organizational DNA’ and thus will also indirect influence the willingness to develop an SR [
11]. Therefore, we formulate the following hypothesis:
Hypothesis 9 (H9). There exists a positive relationship between the extent to which the concept of sustainability is incorporated into the ‘organizational DNA’ and the production of an SR, ceteris paribus.
3. Institutional Framework
In
Section 2, we identified several organizational explanatory variables, regardless of whether or not they fall under the control of the PMB, for the initiation of sustainability reporting. However, organizational activities are also subject to contextual factors, conditioned by the ‘field’ in which they operate [
55].
“Fields are best understood as the center of dialogue and interaction, through which a diverse range of institutions come to bear on field participants, and influence common organizational behaviors and their rationality”
However, the conditioning effects of the same ‘field’ or institutional environment can also only partially justify the differences that exist concerning the initiation of sustainability reporting. In contrast to existing literature that often only looks at one of the two approaches [
2,
4,
16,
56,
57], it is the combination of both corporate characteristics and contextual factors that allows an unveiling of the driving mechanisms behind the practice of sustainability reporting.
Following Institutional Theory, organizations are part of a larger, all-encompassing, complex system defined by, among others, financial, economic, political, cultural and educational institutions. These institutional conditions/pressures under which organizations operate and the ongoing interconnectedness are translated in the form of mandatory provisions (coercive isomorphism), behavioral standards (mimetic isomorphism), individual morality (normative isomorphism) and the eagerness to achieve competitive advantage (competitive isomorphism), often occurring as a combination of several of these, pushing organizational behavior to a certain homogenous objective defined by the ‘field’ at issue [
57,
58].
Coercive isomorphism—formal and informal pressures from governments and other social forces, i.e., stakeholders, with the threat of punishment when not respected. In the case of the port industry, this can be revealed through regulations, laws, and rules (e.g., IMO International Standards) or powerful stakeholder relationships (e.g., terminal operators and shipping lines).
Mimetic isomorphism—organizations tend to copy the actions of successful and more legitimate counterparts. In order to overcome bounded rationality and uncertainty, PMBs often choose similar sustainability practices to the frontrunners in their domain, e.g., the growing institutionalization of the landlord model.
Normative isomorphism—transferal of norms and values through methodologies, models, standards and practices developed and diffusion through professional networks or by formal education. The GRI and Ecoports are two examples of voluntary-based standards and codes of conduct that promote sustainable development in (maritime) organizations.
Competitive isomorphism—in order to achieve a competitive advantage, organizations will cross traditional boundaries, for example those of traditional reporting. Sustainability reporting can have a positive effect on a PMB’s stakeholder relationships, thus leading to superior performance.
As stated by Herold [
3] (p. 9), “the key message of isomorphism is that organizations with similar institutional pressures will eventually adopt similar strategies or logistics to gain legitimacy”, as is the case, for example, with sustainability reporting. However, the explanation behind Institutional Theory neglects the heterogeneity of organizational behavior within the same ‘field’ [
3]. It is when the ideas and beliefs that conform to Institutional Theory are combined with the information on organizational characteristics (
Section 2) that a more complete image of the situation can be painted. Based on this knowledge, we formulate a supplementary research question focusing on the existing heterogeneity of organizational behavior of PMBs when it comes to SR adoption: Which organizational characteristics and institutional pressures emerge together and play a role, and under which conditions? This understanding will allow academics, as well as practitioners, to develop new frameworks and guidelines better adapted to the features and needs of the port industry and its players.
4. Methodology
As the objective of this study is to establish a better understanding of the practice of sustainability reporting and how it could be promoted in the industry worldwide, we sought the views of global experts who are active in PMBs and possess knowledge on, and are involved in, the decision-making processes in the areas of sustainability, strategy and performance of the PMB. To achieve this objective, we worked in close collaboration with the International Association of Ports and Harbors (IAPH).
4.1. Research Construct
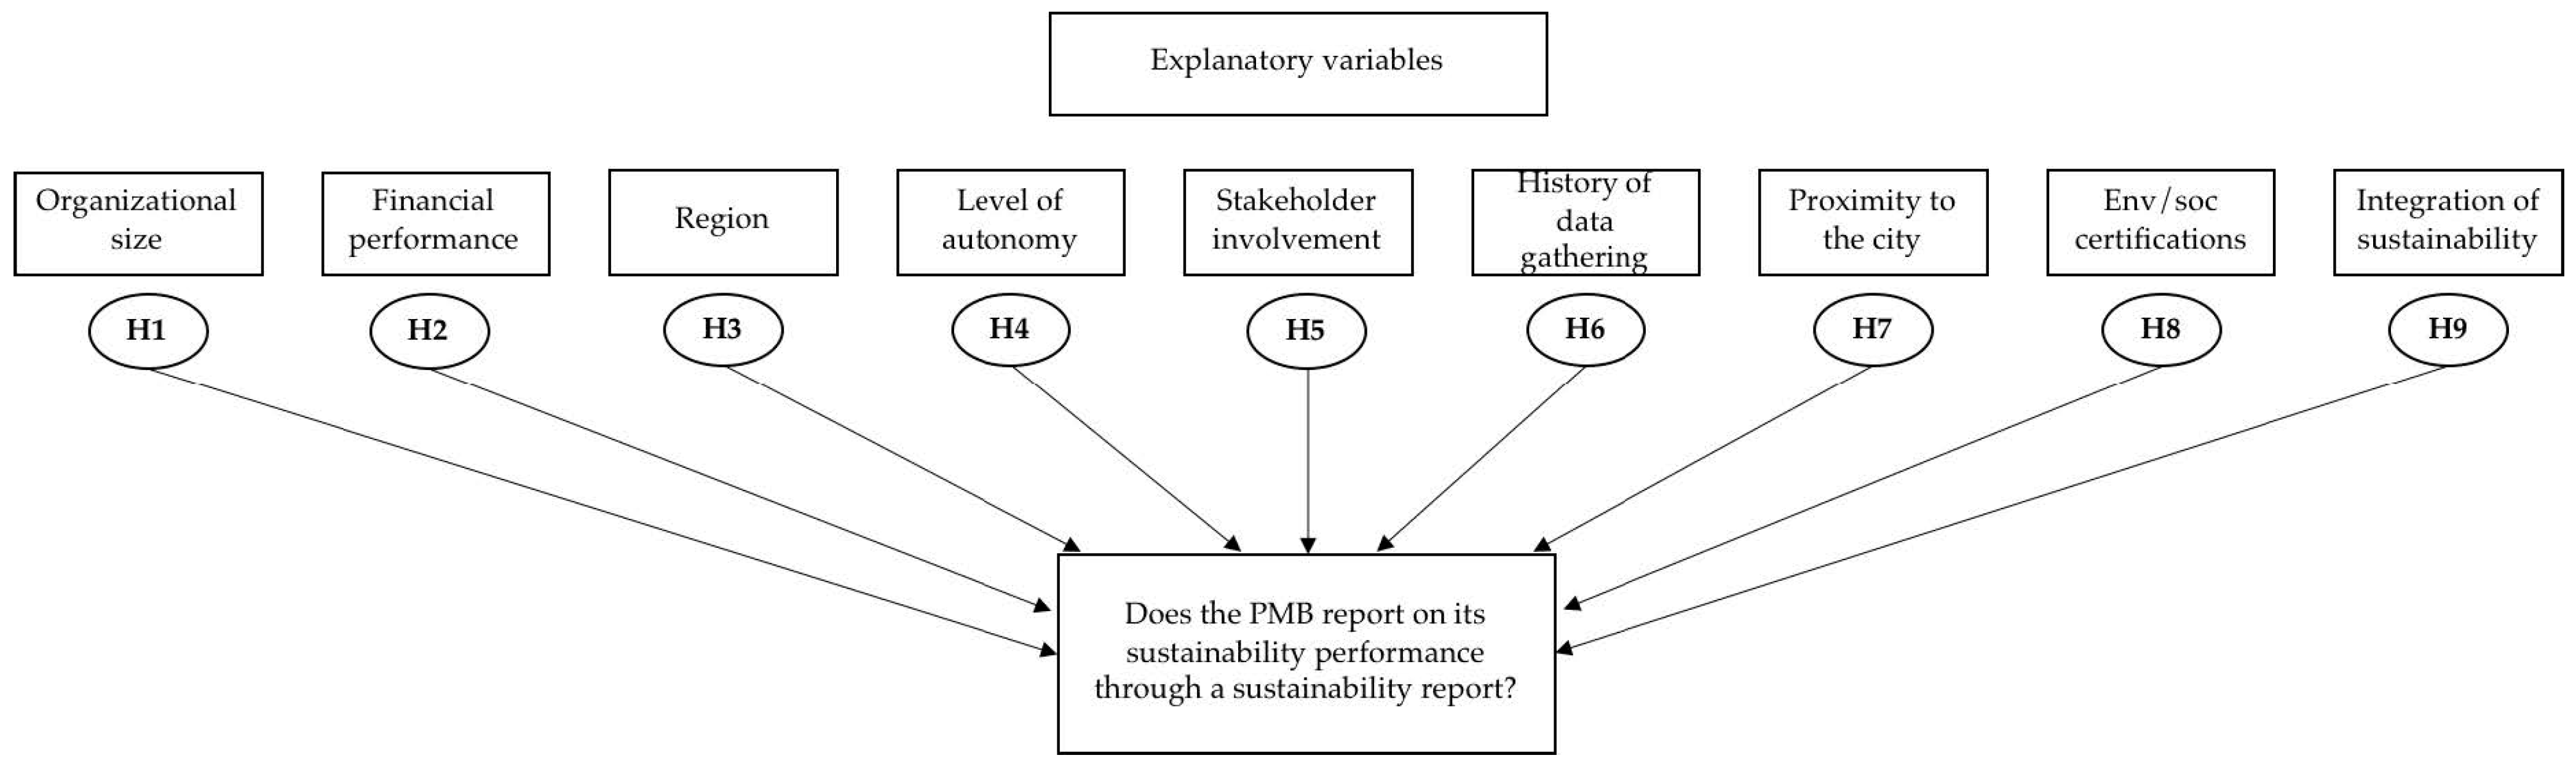
We divide the research into two large sections, each based on one of the posed research questions: (1) What are the main determinants influencing the practice of sustainability reporting in the context of PMBs? (2) Which organizational characteristics and institutional pressures emerge together and play a role, and under which conditions? The first section of the analysis is based on the research construct shown in
Figure 1.
In the literature review of this paper, we investigated and defined all variables that could possibly explain the variance of the dependent variable: Does the PMB report on its sustainability performance through an SR?
Table 1 presents an overview of all variables in play and their relevant measurement levels. The dependent variable ‘SR’ consists of five ordinal answer categories, and has been defined based on exploratory research [
13] and confirmed by the IAPH as well as representatives of the Port of Antwerp. We have opted to define the variables ‘SIZE’ and ‘FIN’ with an ordinal scale, as this helped to increase the response rate (see also
Section 2). The ordinal variable ‘DATA’ contains four answer categories, each referring to a certain period and completeness of the performance of data gathering. The construction of the variable ‘STAKEH’ is based on an adapted version of the stakeholder model of Friedman and Miles [
59] (see
Appendix A). Respondents were asked to indicate the level of stakeholder inclusion during general strategy formulation processes that best reflects the current situation of the PMB. Last, the variable ‘SUST’ tries to capture the degree of sustainability efforts of a PMB (cf. implementation of sustainability initiatives). The variable is constructed as a sum of selected answers from a list of options (nine statements referring to different sustainability initiatives). In order to differentiate among the answers, a weight was allocated to each answer separately, based on their added value to the general concept of sustainability. The allocation of a higher weight to the nine statements is based on: (1) whether voluntary willingness forms the basis of the sustainability initiative, (2) whether the sustainability initiative is linked to and/or has an effect on the core activities of the PMB, and (3) whether interactions with external stakeholders occur during the formulation and implementation of sustainability initiatives. The measurement level of all other variables is more straightforward and explained in the column ‘Description’ of
Table 1.
For the second part of the analysis (
Section 5.3), we make use of descriptive association techniques (e.g., boxplots) to find possible relationships between the organizational characteristics of PMBs (defined by the independent variables of
Table 1) and the dominance of institutional pressures in play. The latter has been captured by a specific question, for which the answer categories serve as proxies for the different well-known institutional isomorphisms, i.e., multinomial variable. We are aware that applying such an ‘ad hoc’ taxonomy can create a feeling of subjectivity. Nevertheless, using this taxonomy allows us to establish an exploratory format to test micro-level variables against macro-level phenomena.
4.2. Survey Design and Data Collection
All data used for this research has been provided by the PMBs themselves and gathered by means of an online survey, for which the questions have been developed from the literature review and exploratory interviews with experts in the port environment in order to assure the content validity. The use of a survey was a deliberate choice for three reasons [
60]. First, it allows the obtaining of more managerial-driven information on the initiation of sustainability (reporting) compared to a content analysis of reports in which only pure facts that are available for the public can be observed and analyzed. The focus of the research is upon discovering more in-depth latent forces. Second, it aids in the recruitment of respondents, as the option of anonymity offered by an anonymous online survey is believed to create an environment in which sharing of experiences and opinions is facilitated. Third, as this study intends to cover a global scale, online surveys facilitate a more widespread reach.
The structure of the questionnaire starts with two general questions concerning the uniform understanding and interpretation of the concepts of sustainability and sustainability reporting, followed by questions probing the PMB’s views on sustainability performance, strategy and reporting, and ends with some high-level PMB profile questions. All questions are posed in a way that allows us to easily allocate information to each of the hypotheses formulated in the literature review. Furthermore, questions were expressed as close-ended affirmations for two reasons: (1) to improve the anonymity of the organizations and (2) to increase the chance of achieving a high response rate [
61]. As the sector of PMBs is of limited size, in the case of open-ended constructions the possibility exists that such a formulation could lead to the identification of some respondents (e.g., only a small number of very large PMBs exists in each region), which in turn could have a significant negative influence upon the response rate. To even further increase the response rate, we translated the survey into French, Spanish and Chinese. Encoding of the survey into an online format was accomplished by making use of the software program ‘Qualtrics’. The questionnaire was verified in multiple phases by the representatives of the IAPH, with modifications added after each phase, before final validation.
The survey launch was presented during the annual conference of the IAPH in May 2019, and was thereafter promoted through several of their social media channels. We also directly approached representatives of PMBs and other experts within and outside our own network via email, professional networks such as LinkedIn, and cold calls. Furthermore, we also obtained the endorsement of several institutions and organizations in the industry that shared the survey with, or promoted it to, their members (e.g., MEDports), as well as the support of individuals reaching out to their own network. The objective was to reach and collect completed surveys from representatives of PMBs around the world, thereby also limiting selection bias. The introduction prior to the survey stated that the representatives in question should have an understanding of the concepts of sustainability (reporting) and a feeling of the present situation of the PMB on those topics. This form of data collection method and strategy allowed PMBs with a diversified port profile around the world to be reached. However, at the same time, it also gave rise to certain limitations, meaning that the response rate and related non-response bias has been difficult to capture as we had no control over the sampling frame in question. Following this reasoning, it is important to interpret the results of the research with a certain degree of caution, and primarily from an exploratory perspective. More specifically, results will be of significant value when focusing on the specific port characteristics shaping the investigated sample, but they cannot simply be extrapolated to the entire global PMB population.
The online survey remained open for six months (from May 2019 to October 2019), during which several reminders were sent out. Through the attempt of this study to examine a global sample and take into account a multitude of possible explanatory influences, we filled in the gap in earlier research that has mainly focused on sustainability reporting in single contexts or on partial explanations of the phenomenon.
4.3. Statistical Models and Data Analysis
The dependent variable, i.e., practice of sustainability reporting, measures five distinct categories, with the number of observations in each category ranging between 12 and 26. Originally, we wanted to apply a multinomial logistic regression based on the five answer categories of the dependent variable. However, a logistic model containing few numbers of events per variable can result in undesired consequences, such as convergence problems, biased regression coefficients, and misleading conclusions [
62,
63]. In order to increase the robustness and validity of the model, we rescaled the outcome variable to a binary variable consisting of the following two categories: (1) producing any format of an SR or (2) not producing anything at all. In order to present a complete and truthful picture, a stepwise forward model selection procedure was performed to find the most parsimonious logistic model for explaining the majority of variance of the data, while in the same process also checking for multicollinearity via the relevant Variance Inflation Factors (VIFs). Models with few variables have the advantage of being numerically more stable, avoid overfitting the data, generalize better (as they depend less on the observed data) and have smaller standard errors. Stability of the obtained results was checked with a backwards and stepwise variable selection method, resulting in identical conclusions. All statistical analyses were performed using R [
64]. The stepwise variable selection methods were performed with the step function of the MASS package [
65]. This function uses the Akaike Information Criterion (AIC) to estimate the quality of each model relative to the other models. Furthermore, graphs are created using the R package ggplot2 [
66].
5. Results and Discussion
Prior to the larger analysis, which focuses on the two large sections, descriptive statistics are used to showcase the distribution of the profiles of PMBs from which completed surveys were received.
5.1. Profile of Sample PMBs
In total, 97 fully completed and valid surveys were recorded. Given the nature of the applied data collection method—an online survey—and the business-to-business sector, we can state that this is a more-than-reasonable result for this specific industry. Other studies in the same domain that have relied on a survey encountered the same challenges and response rate [
11,
67]. Furthermore, comparing the amount of PMBs of this analysis developing any kind of SR (
n = 71) to the amount of PMBs involved in the World Ports Sustainability Program (WPSP) Portfolio of IAPH (
n = 71) also strengthens the reliability of the response rate [
68]. The respondents’ profiles exhibit a variety in terms of region, size and governance model.
Table 2 shows that PMBs located in the regions of Africa, Central and South America, and Asia and the Middle East were the least willing to fill out the survey. The answer categories containing only one answer were eventually deleted in light of fulfilling the condition of robustness of the further statistical analysis (see
Section 4.3), with the exception of Africa, for which we integrated all answers into a single answer category. We were aware that the continuation of the analysis and interpretation of the results was to be made with a certain degree of caution, as the underrepresentation of developing regions may have resulted in a bias towards developed countries. Furthermore, there is an equal distribution when looking at the financial turnover of the PMBs, and a more-or-less normal distribution when analyzing the number of employees. Finally, when looking at the answers regarding the format of sustainability reporting (taking into account the five original categories), we observe an equal distribution. The sample for analysis is thus a reliable reflection of most of the possible real-life scenarios, reducing the risk of self-selection bias. The fact that 26.8% of all respondents do not report anything (yet) is already an interesting finding on itself as it shows that the practice of sustainability reporting follows a similar path as the innovation adaption lifecycle with PMBs as either innovators, early adopters or laggards, and that the practice of sustainability reporting is not yet fully institutionalized [
69,
70]. In the next section of this paper, we will investigate whether there are specific (controllable) organizational characteristics that could explain the difference in adoption behavior.
5.2. Determinants of Sustainability Reporting
As the analysis was realized using different variable selection methods while simultaneously always checking for multicollinearity, we claim that we were able to identify those variables that actually have the greatest impact on the practice of sustainability reporting. The result of this analysis is presented in
Table 3, showing the three variables that create the model with the highest quality. Of interest is the fact that the well-known determinants such as size, financial turnover and level of autonomy investigated in previous studies do not seem to be significant enough when including all variables in a single analysis. This result can potentially be explained by two reasons: the first is the fact that, in general, other parameters seem to have a larger explanation power, while the second is that it is likely that the value of size and financial turnover have decreased in recent times, highlighting a tendency in which sustainability reporting is no longer only understood and embraced by the larger PMBs, but also by small- and medium-sized players. This is confirmed by anecdotal evidence such as the active participation of smaller ports in industry task forces on the harmonization of sustainability reporting for ports (e.g., the IAPH-PIANC workgroup 174 on the topic).
Looking at the results of the analysis in
Table 3, we observe two variables ‘DATA’ and ‘CERT’ that are under the direct control of the PMB in terms of strategic decision making and resource allocation, and one variable ‘PROX’ being a fixed organizational characteristic (or rather natural factor condition, as it relates to geographical location). For the latter, it can be stated that the odds of producing an SR is estimated to be almost six times (exp(1.7783) = 5.920) larger for PMBs located in proximity to a city than for those that are not, all other predictors held constant. The significance of this variable can be explained by the amount of stakeholder pressure the PMB effectively needs to deal with. Or, alternatively, as the data of the variable is based on a ‘yes/no’ question, the significance could also be explained by the PMB’s perception of being closely located to the city and thus having a sense of responsibility towards the community. In general, the closer a port is located to densely populated urban regions, the more likely it is that the PMB will need to defend the presence of the port towards several stakeholder groups, given the external effects of port activities. As previous research has already shown, producing an SR can help in the mitigation of this pressure, as such a report can serve as a formal commitment that the PMB takes the concerns and needs of the stakeholders in question seriously. The need for intense interaction with stakeholders to manage expectations can be partially covered by the development of an SR.
Next, the variable ‘DATA’ shows us that, for PMBs that have a stronger history of performance data gathering, the odds of having an SR are higher. When a PMB decides to consistently invest in measuring and monitoring processes, structures and models to keep track of the progress regarding its TBL dimensions, it acknowledges the value that this kind of longitudinal information has, not only in terms of complying with sustainability development goals but also in terms of risk management. The availability of multidimensional information can lead to a decrease in overall costs, as risks can be more easily and proactively identified, leading to better damage control management, as well as the proactive formulation of strategies to improve sustainability performance. In other words, the PMB exhibits a structured blueprint for frequently creating an SR.
Last, PMBs that have more social/environmental certifications are more likely to produce an SR, all other parameters held constant. From our results, it appears that the willingness to comply with certain social and environmental certifications can be regarded as a sort of ‘first step’ into developing an overall sustainability strategy. It counts as a proxy, an indicator of the likelihood of developing an SR. However, based on observed real-life behavior, e.g., by the Port of Antwerp, we know that interaction in the other direction does not always hold. More in particular, while the Port of Antwerp was an early adopter of certifications, over time it decided to no longer pursue several certifications, as these did not always request the same level of informational detail and scope as the information the PMB tries to pursue on a daily basis and through its SR. In other words, the implementation of an SR substitutes the certifications as a means to show the tangible commitments of the PMB to its community of stakeholders when it comes to sustainability.
These results suggest that developing an SR is not just a stand-alone practice with the sole objective of ‘aiming to please’, but that it is part of a longer-term, larger strategy of doing business, as shown by the significance of the variables ‘DATA’ and ‘CERT’.
5.3. Associations between Port Characteristics (Organizational Factors) and Institutional Environment (Contextual Factors)
Through this analysis we aim to discover whether certain organizational characteristics are associated with one or more institutional isomorphisms. In other words, which combinations of organizational characteristics and institutional pressures occur together more often than others? The most interesting and value-adding results are shown and discussed in the following paragraphs.
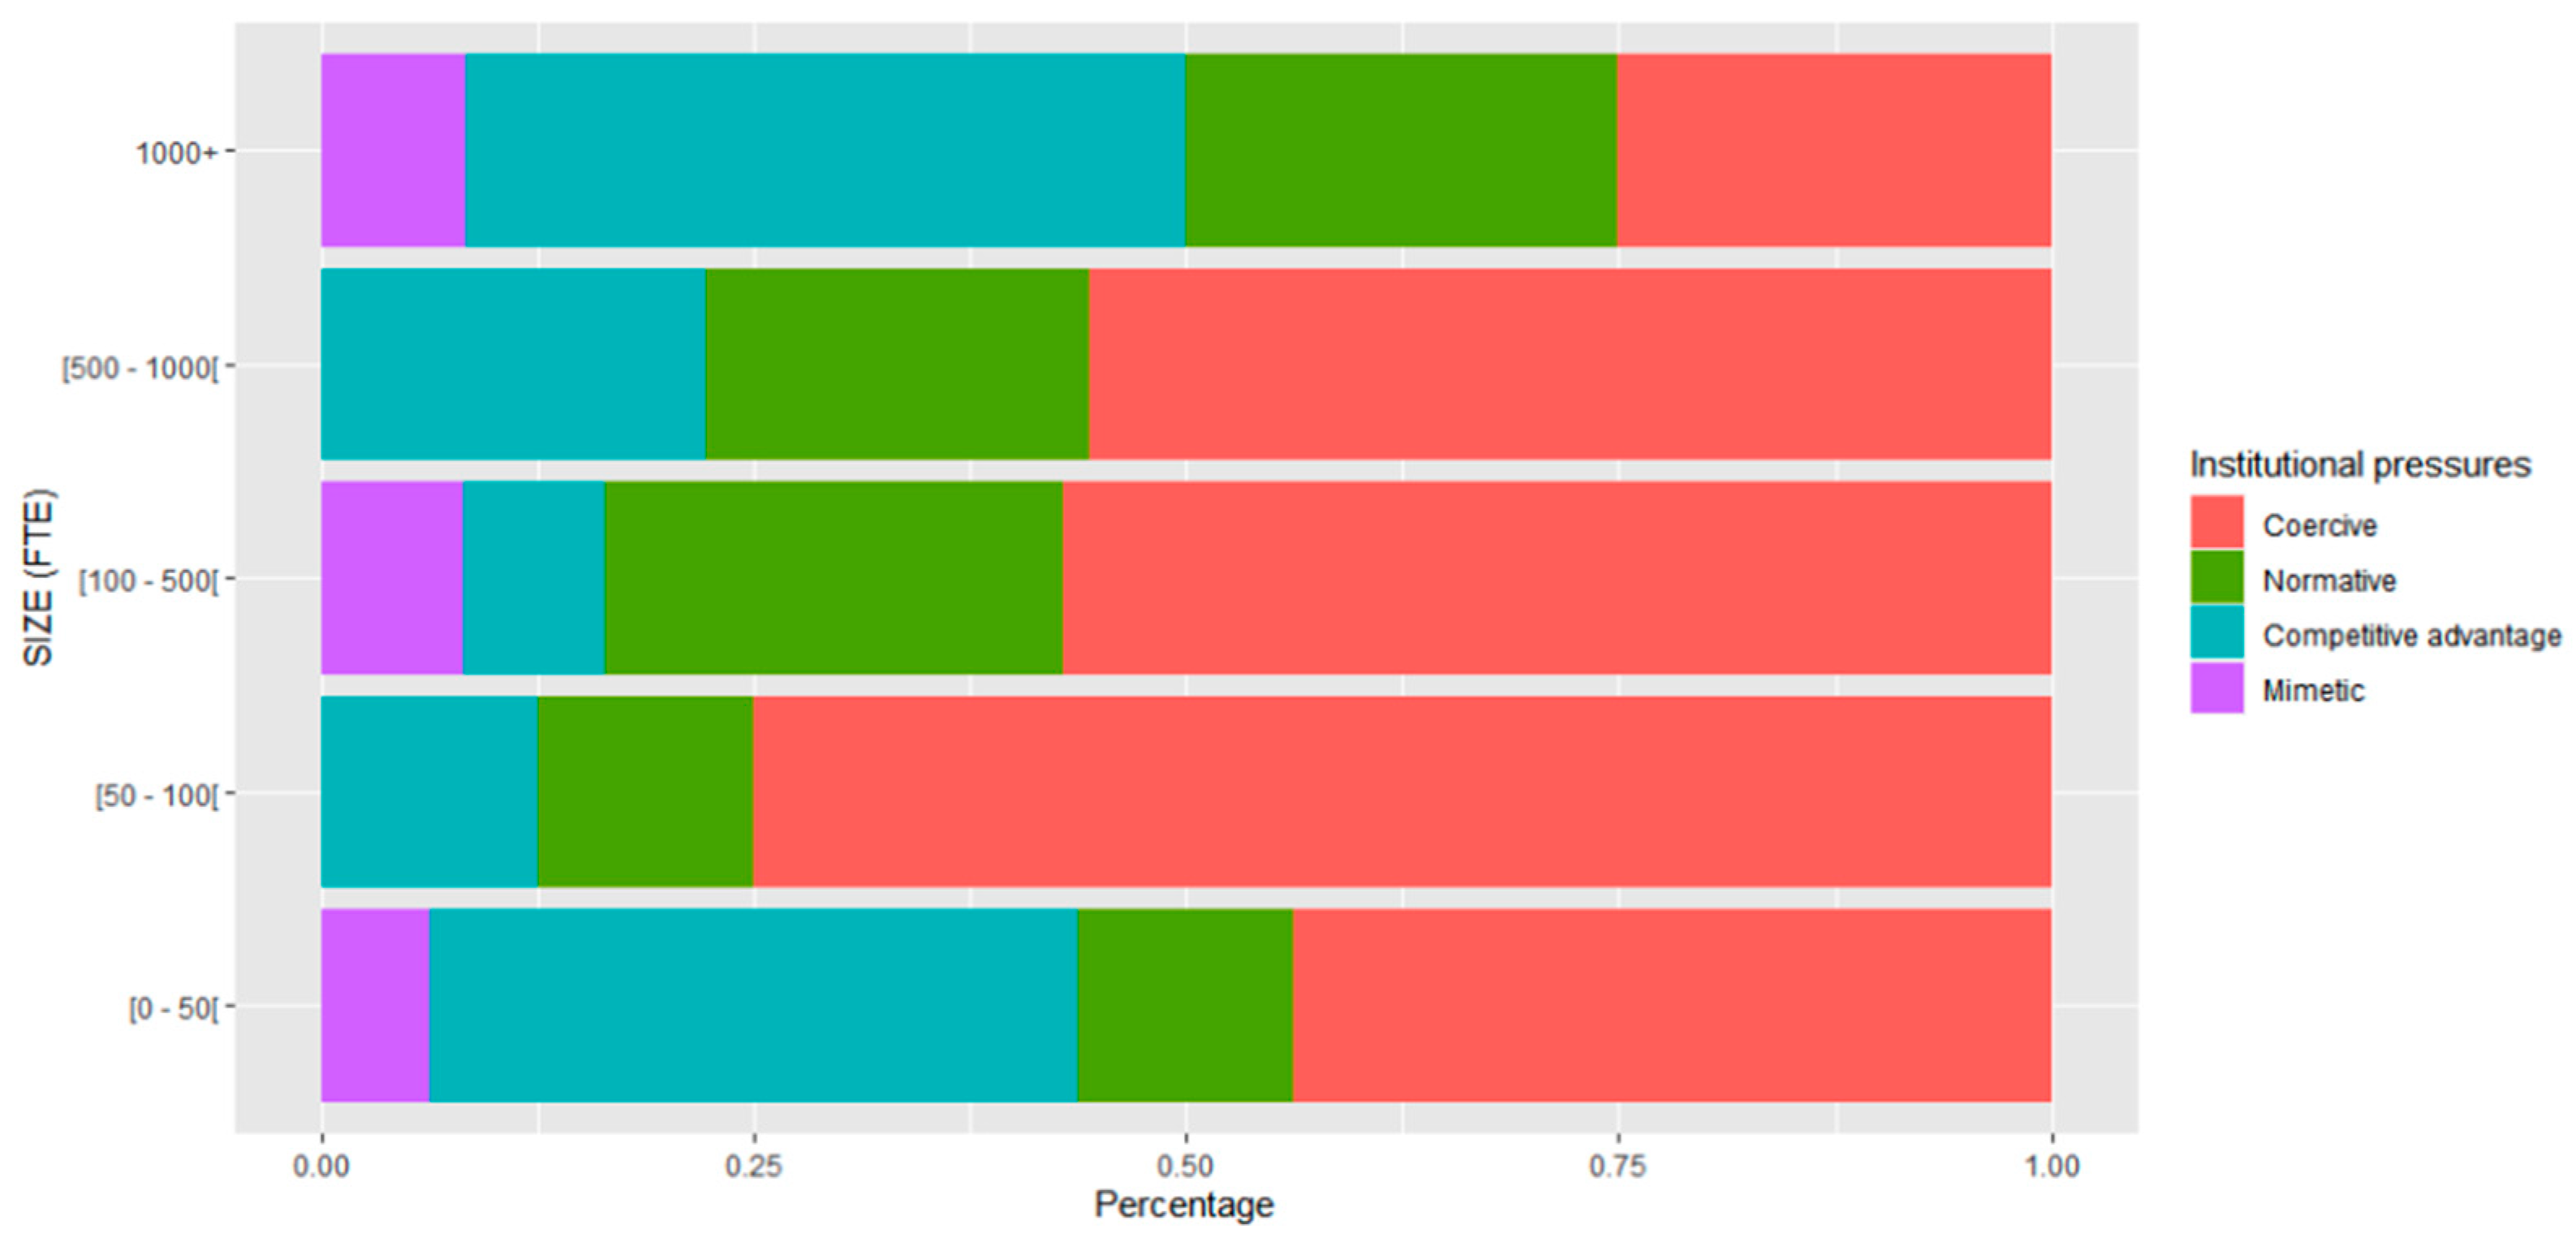
Looking at the first variable ‘SIZE’ (
Figure 2), we notice a very high presence of the isomorphisms ‘competitive advantage’ and ‘normative’ for the largest PMBs, i.e., more than 1000 FTEs. This means that the largest PMBs acted proactively, and began to report either from the perspective of a strong belief in the competitive benefits of reporting or out of moral norms and values towards reaching a sustainable future. Additionally, the category of smaller ports deserves our attention. Compared to what intuitively would be thought of as being exhibited, i.e., ‘mimetic’ isomorphism, this category also shows a high presence of the ‘competitive advantage’ isomorphism. Even more, this category consists of 20% of the total respondents. This outcome can be explained by the fact that small PMBs do not have the same bargaining power towards the external environment as larger ones (often these are dominant economic actors in a region), meaning that, in their actions, they are more dependent upon how society perceives the presence and sustainable added value of the port. Following this reasoning, those PMBs are highly aware of the power (competitive advantage) of an SR. According to the results, medium-sized PMBs are more likely to be driven by the ‘coercive’ isomorphism, i.e., feel compelled to develop an SR as a result of pressure to conform to legal requirements or of reputational objectives. Similar results can be observed for the variables ‘FIN’ and ‘DATA’, possibly explained by the fact that all three variables are indirectly linked with the same underlying factor; ‘availability of resources’.
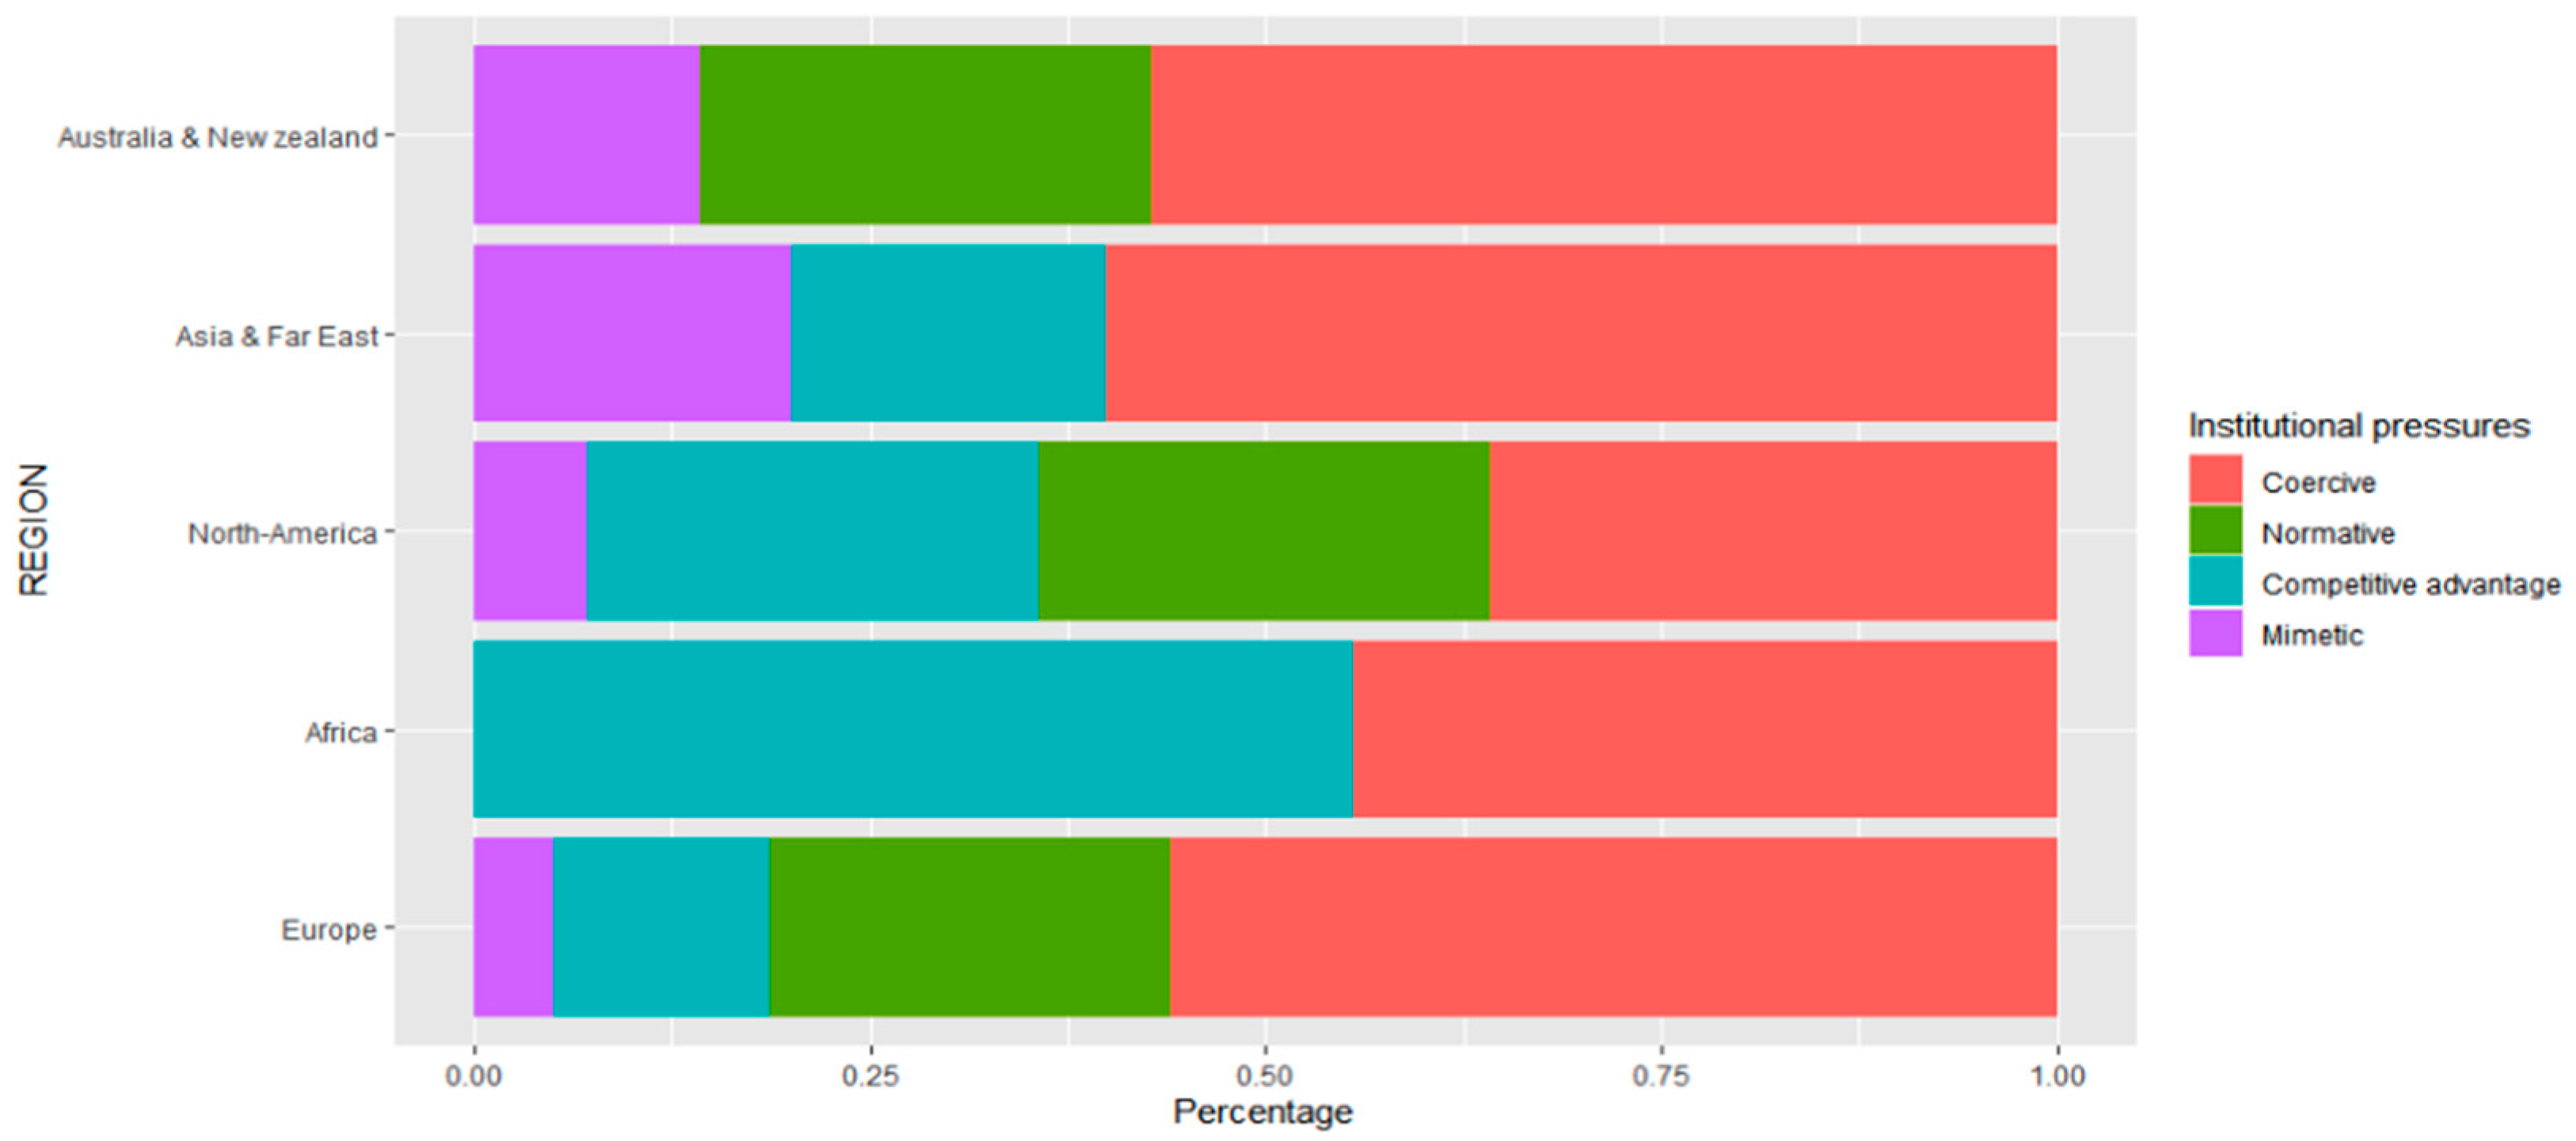
A second result, shown in
Figure 3, is that the ‘normative’ isomorphism is not present in more developing/emerging countries/regions such as Africa and Asia. In those regions, sustainability reporting is still often a question of availability of resources. The total cost–benefit balance of certain sustainability actions will outweigh the moral balance.
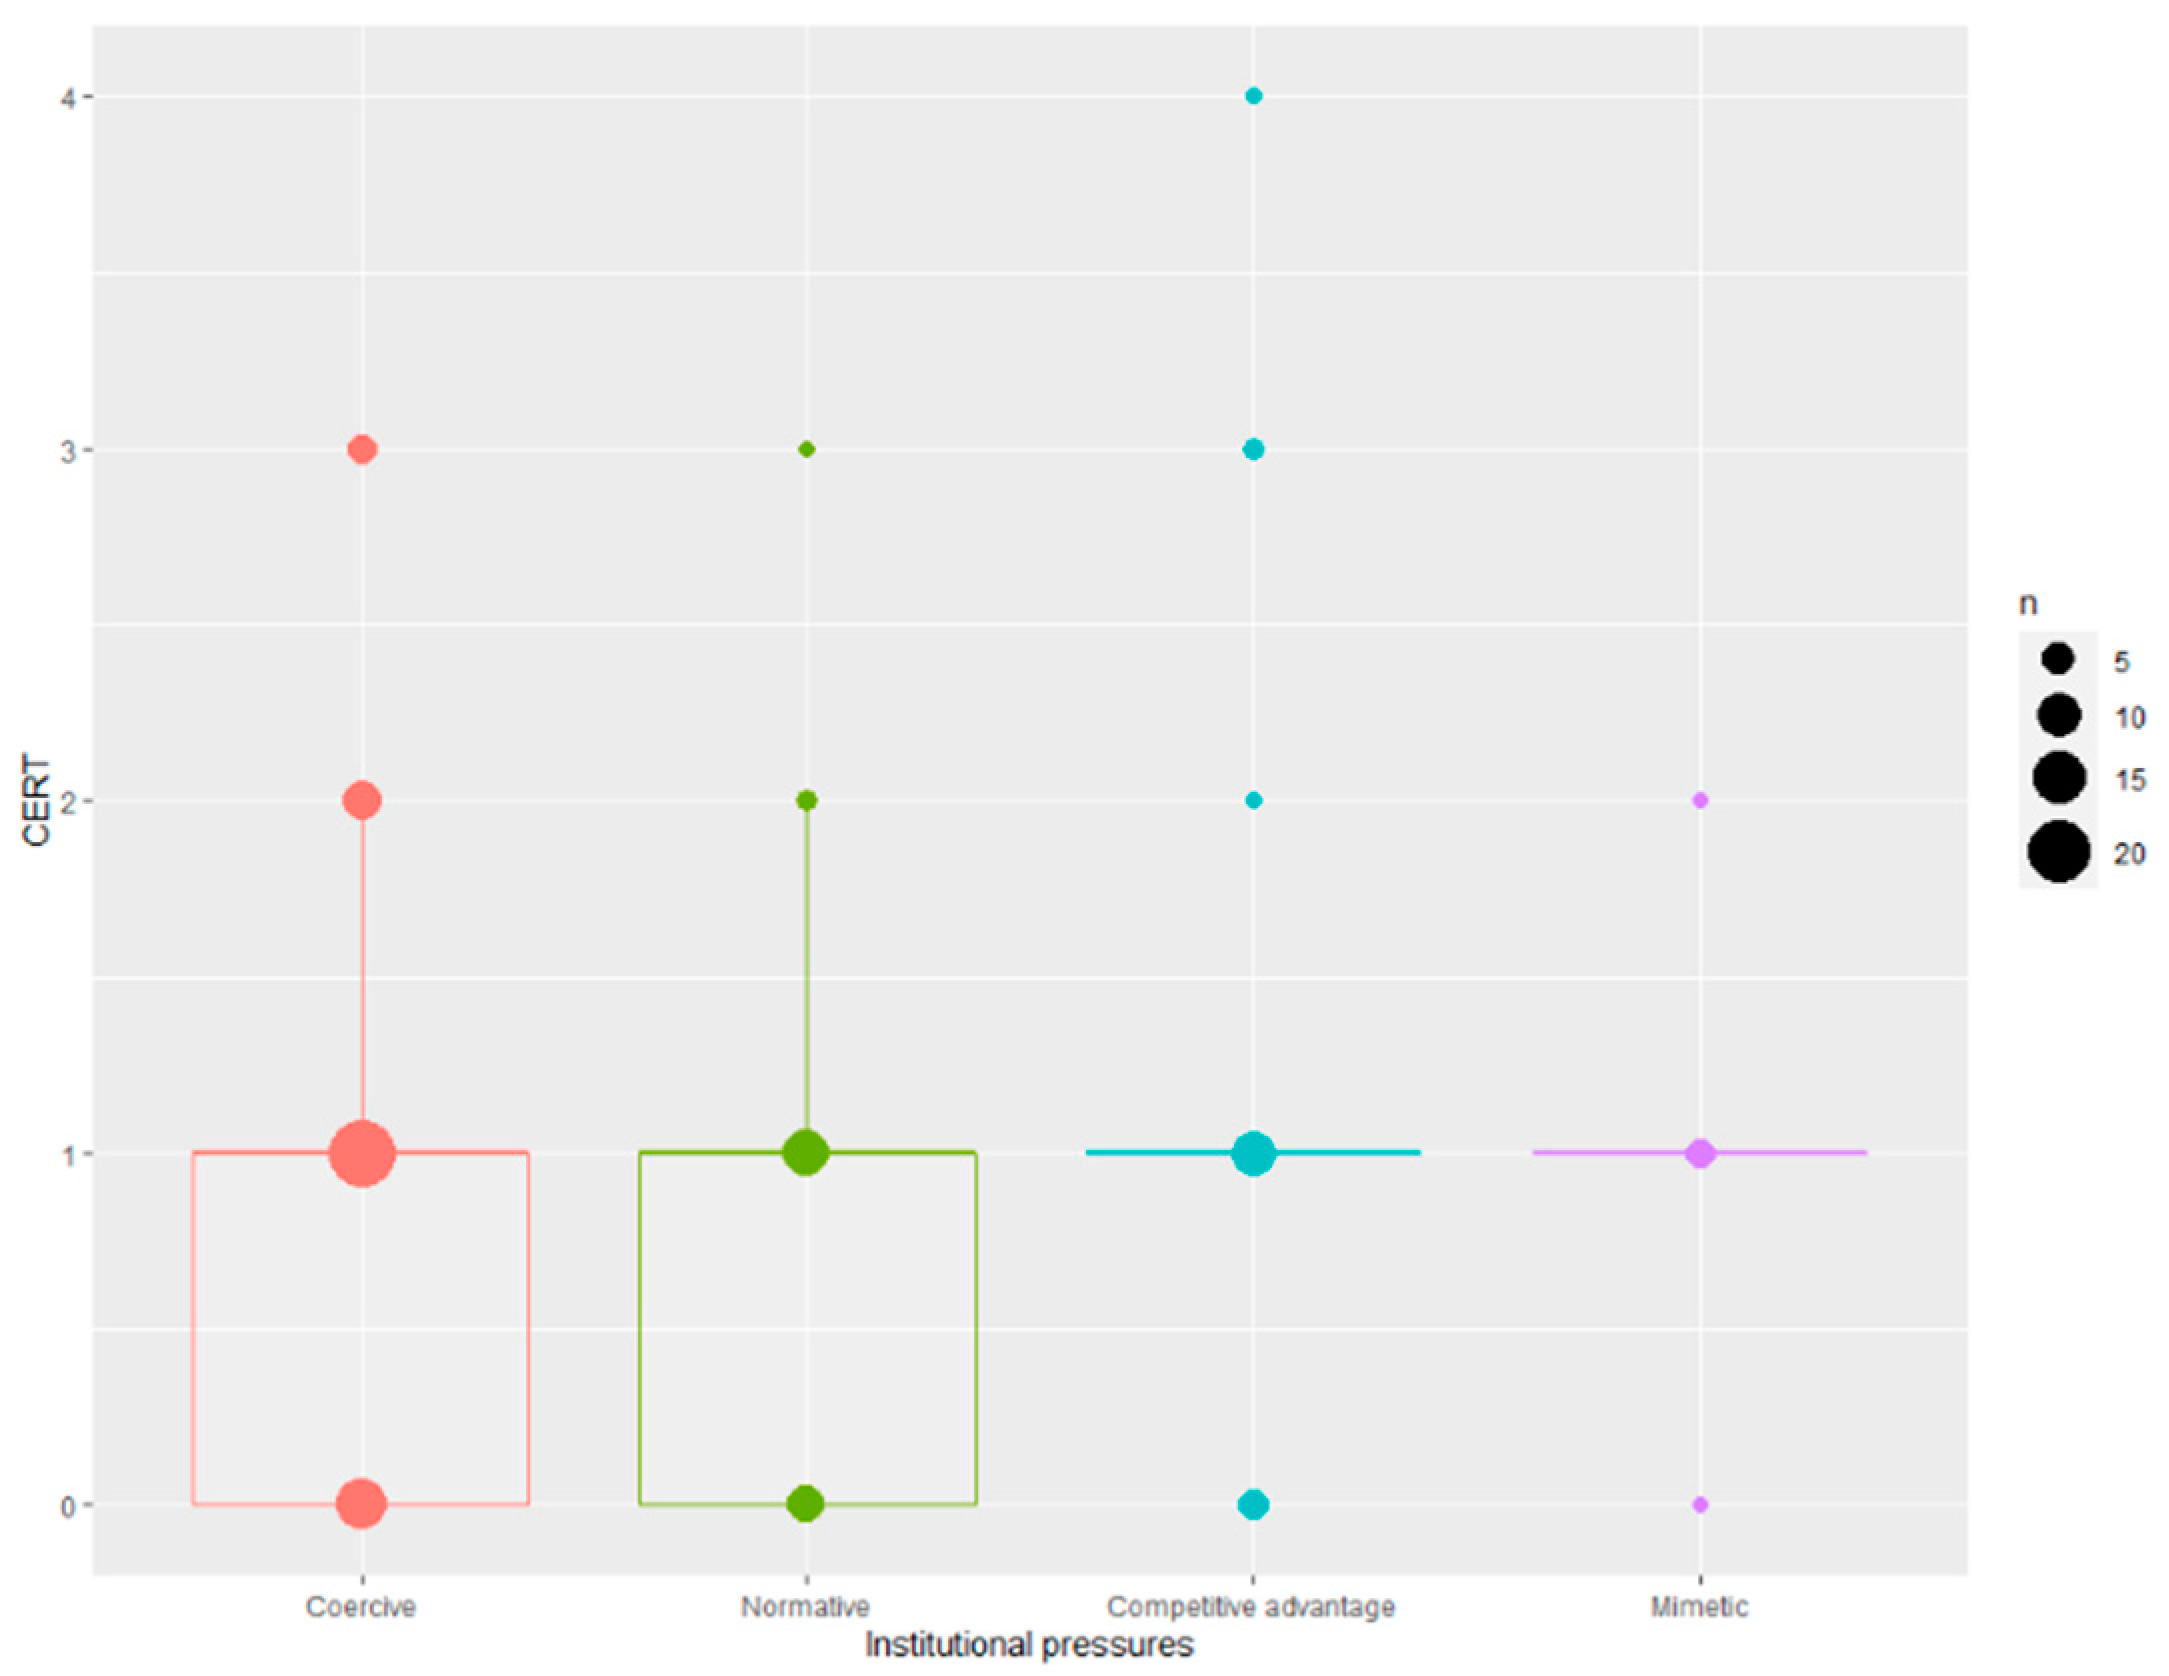
Third, there does not seem to be evidence of a strong association between the number of social/environmental certifications achieved by the PMB and the ‘normative’ isomorphism, when comparing the medians of the different box plots (
Figure 4). In other words, pursuing these certifications appears to be a conscious strategic decision at an organizational level, independent of the kind of underlying pressure.
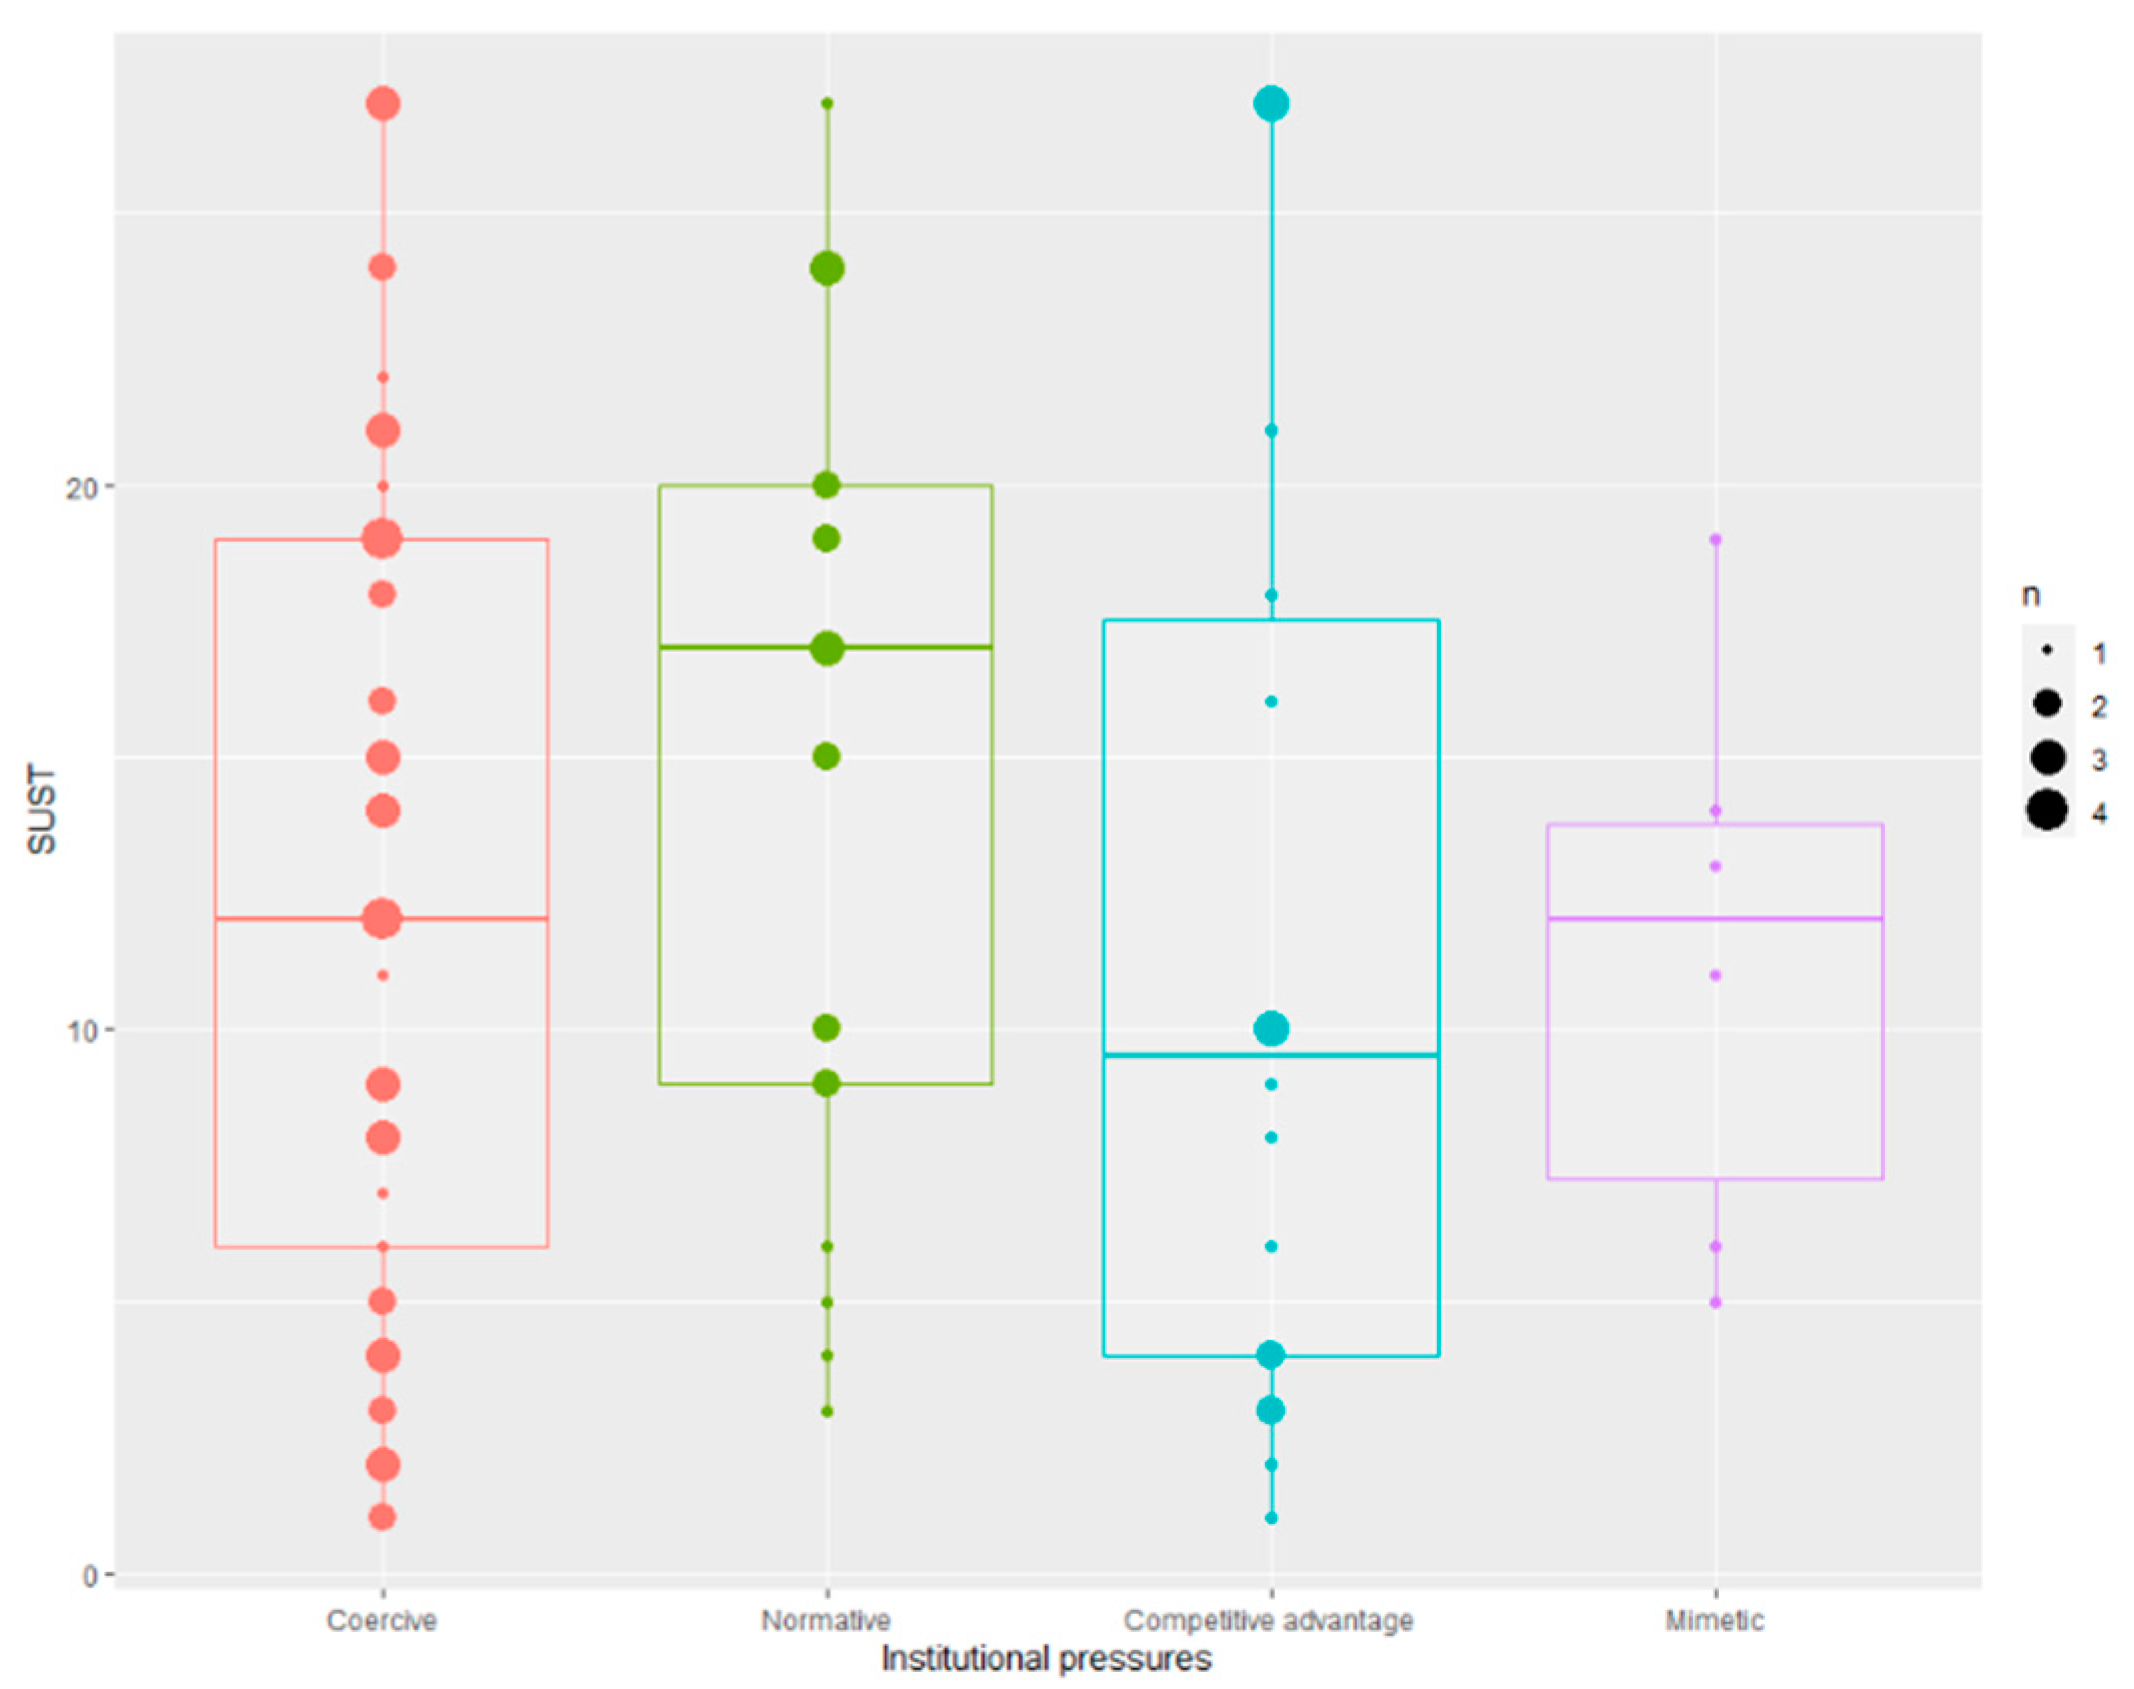
Figure 5, displaying the variable ‘SUST’ against the different isomorphisms, clearly shows that PMBs that put effort into developing organization-wide sustainability initiatives and that try to make the concept of sustainability a part of the larger organizational structure and thinking, regard the initiation of sustainability reporting as an obligatory step in pursuing a normative differentiation strategy. The latent ‘normative’ pressure will play a role for PMBs that, in general, already have a high degree of awareness for sustainable development (higher position of the median and the interquartile ranges of the box plot). The number of sustainability initiatives undertaken and the organizational levels to which they are implemented is a reflection of the extent to which the concept of sustainability is incorporated into the ‘DNA of a company’.
Furthermore,
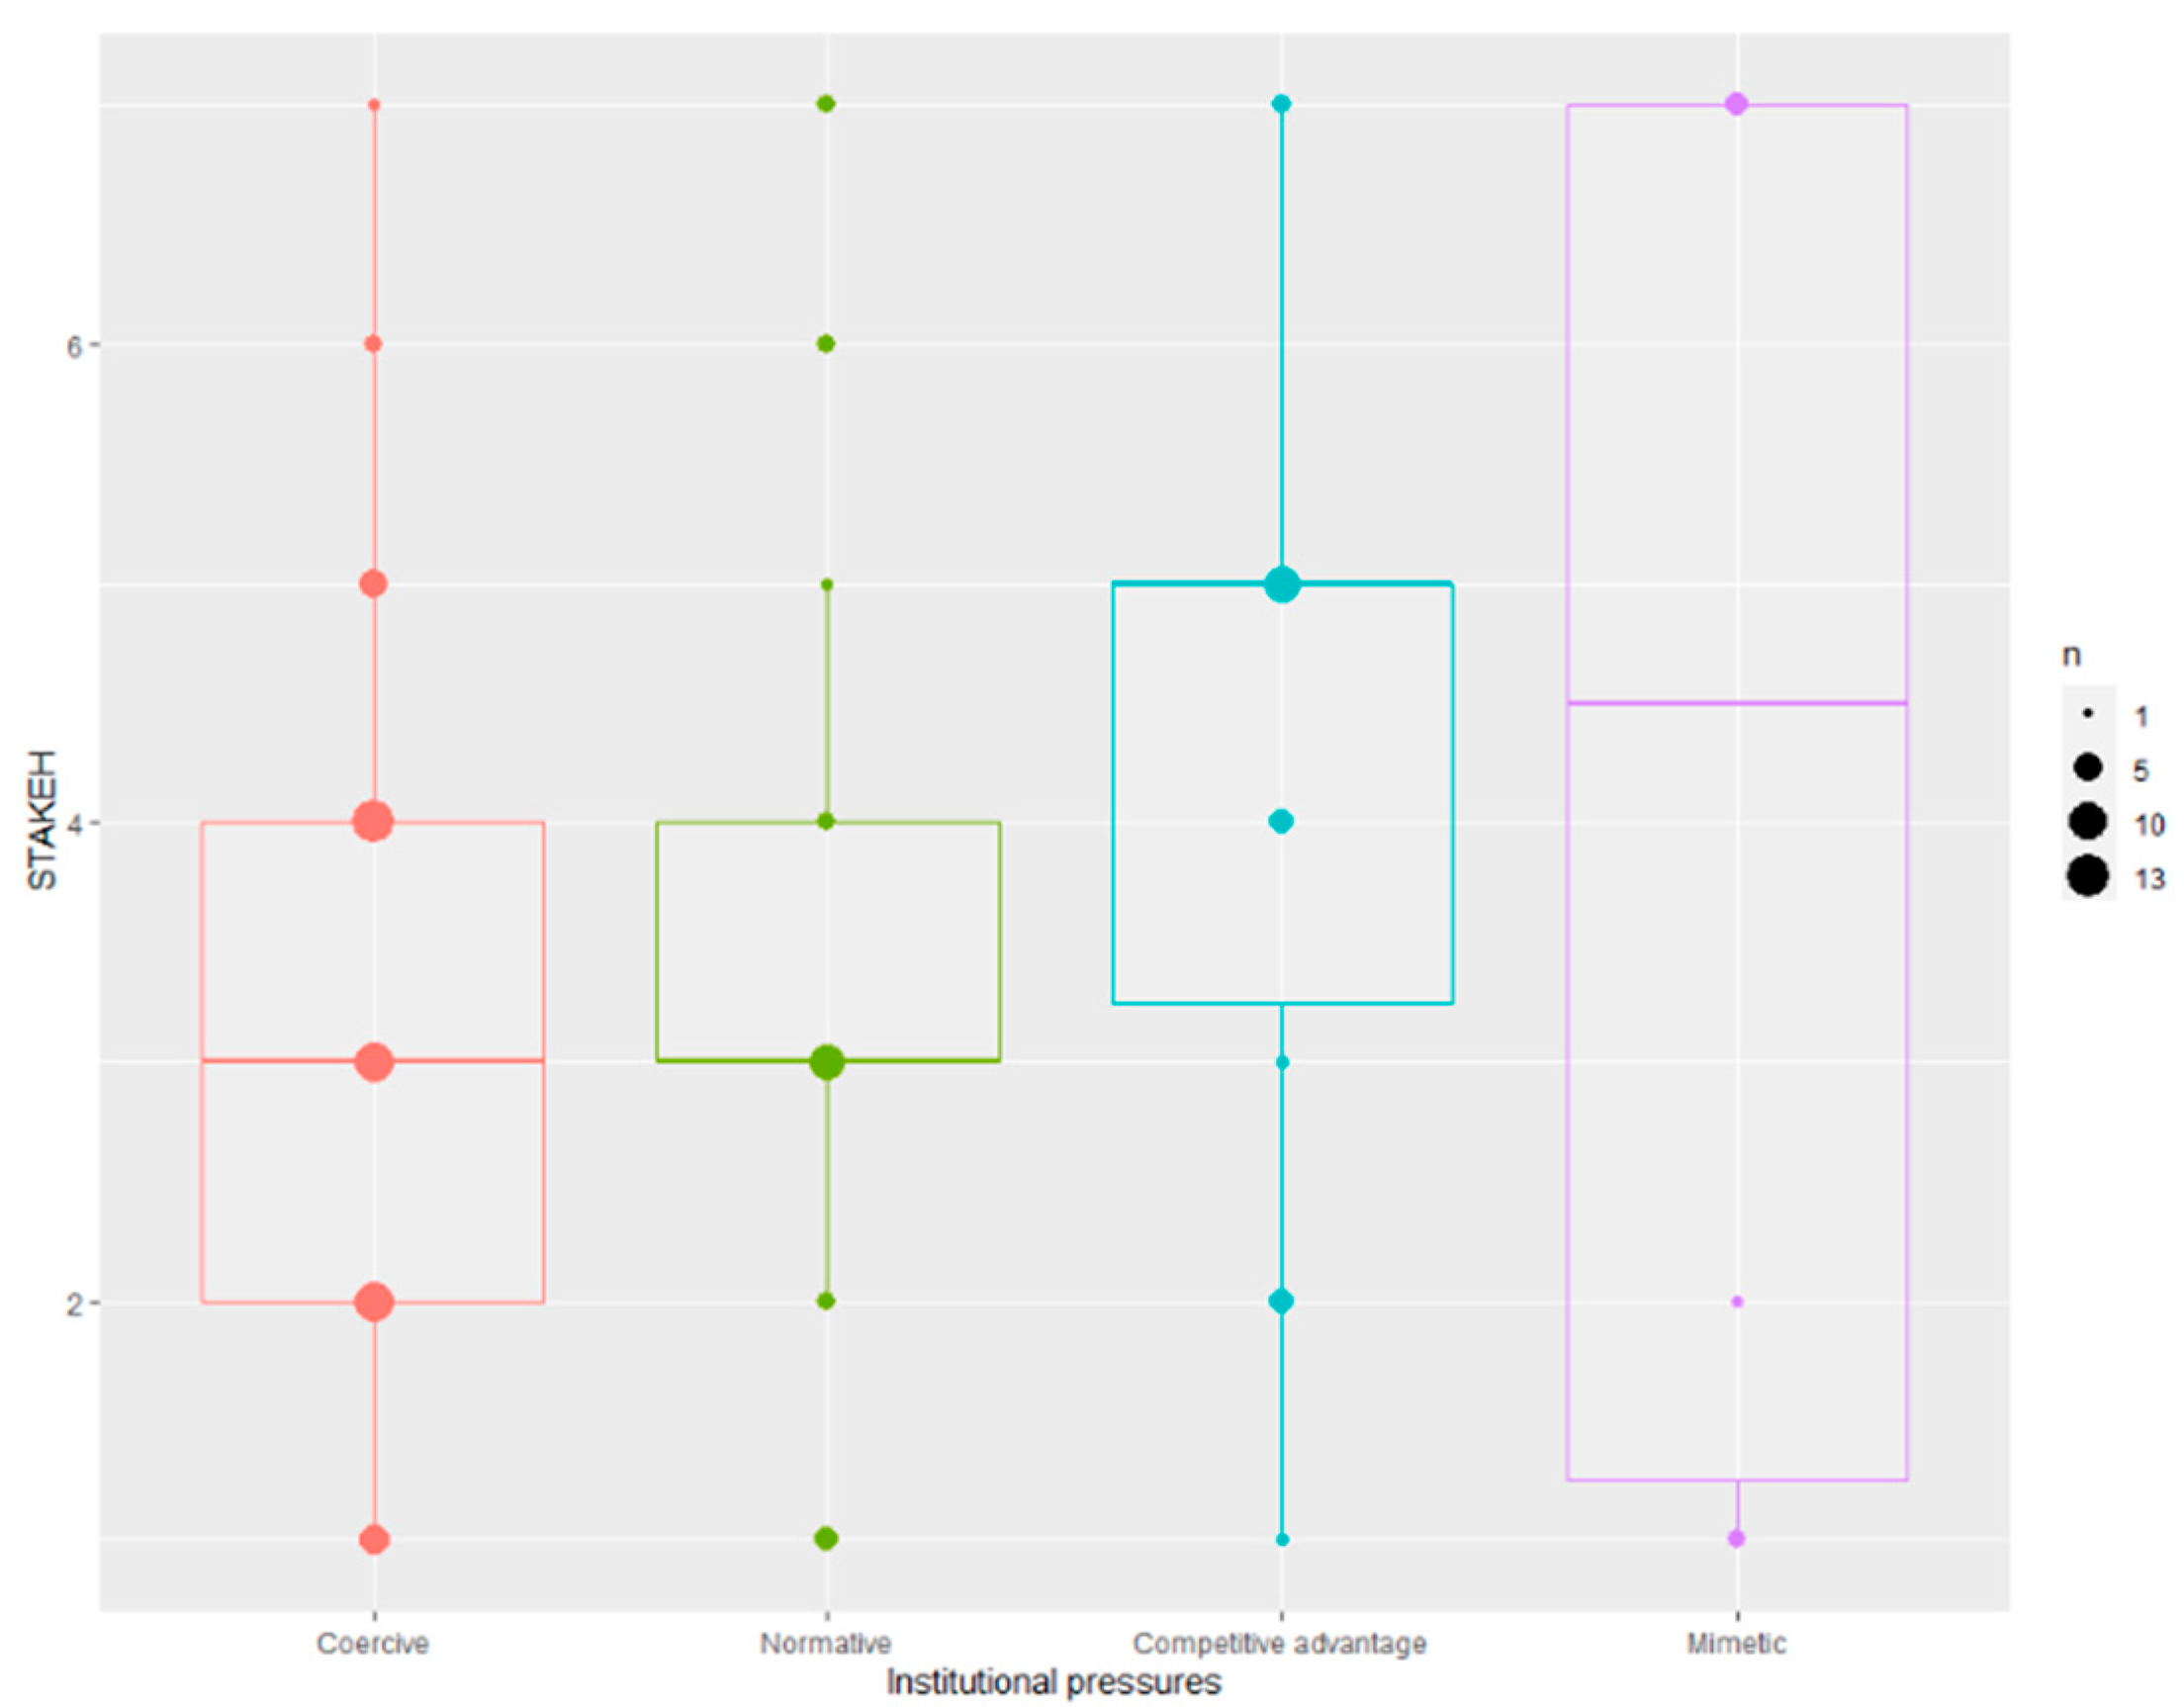
Figure 6 displays the clear association between a high level of stakeholder inclusion during the general strategy planning of PMBs and the force ‘competitive advantage’ as a decisive factor in starting to report, based on a comparison of the medians of the different box plots. An increasing amount of PMBs acknowledge the importance of substantive and high-quality stakeholder inclusion, as aligning the organization with the stakeholders’ expectations can help in safeguarding their ‘license to operate’. The development of an SR can contribute to this longer-term strategic objective. Only when stakeholders are consulted to a high degree and on an ongoing basis does the content of a report not only show what the PMB believes people want to know, but also those issues (positive and/or negative) that are regarded as material by the stakeholders themselves, leading to high societal acceptance of the PMB.
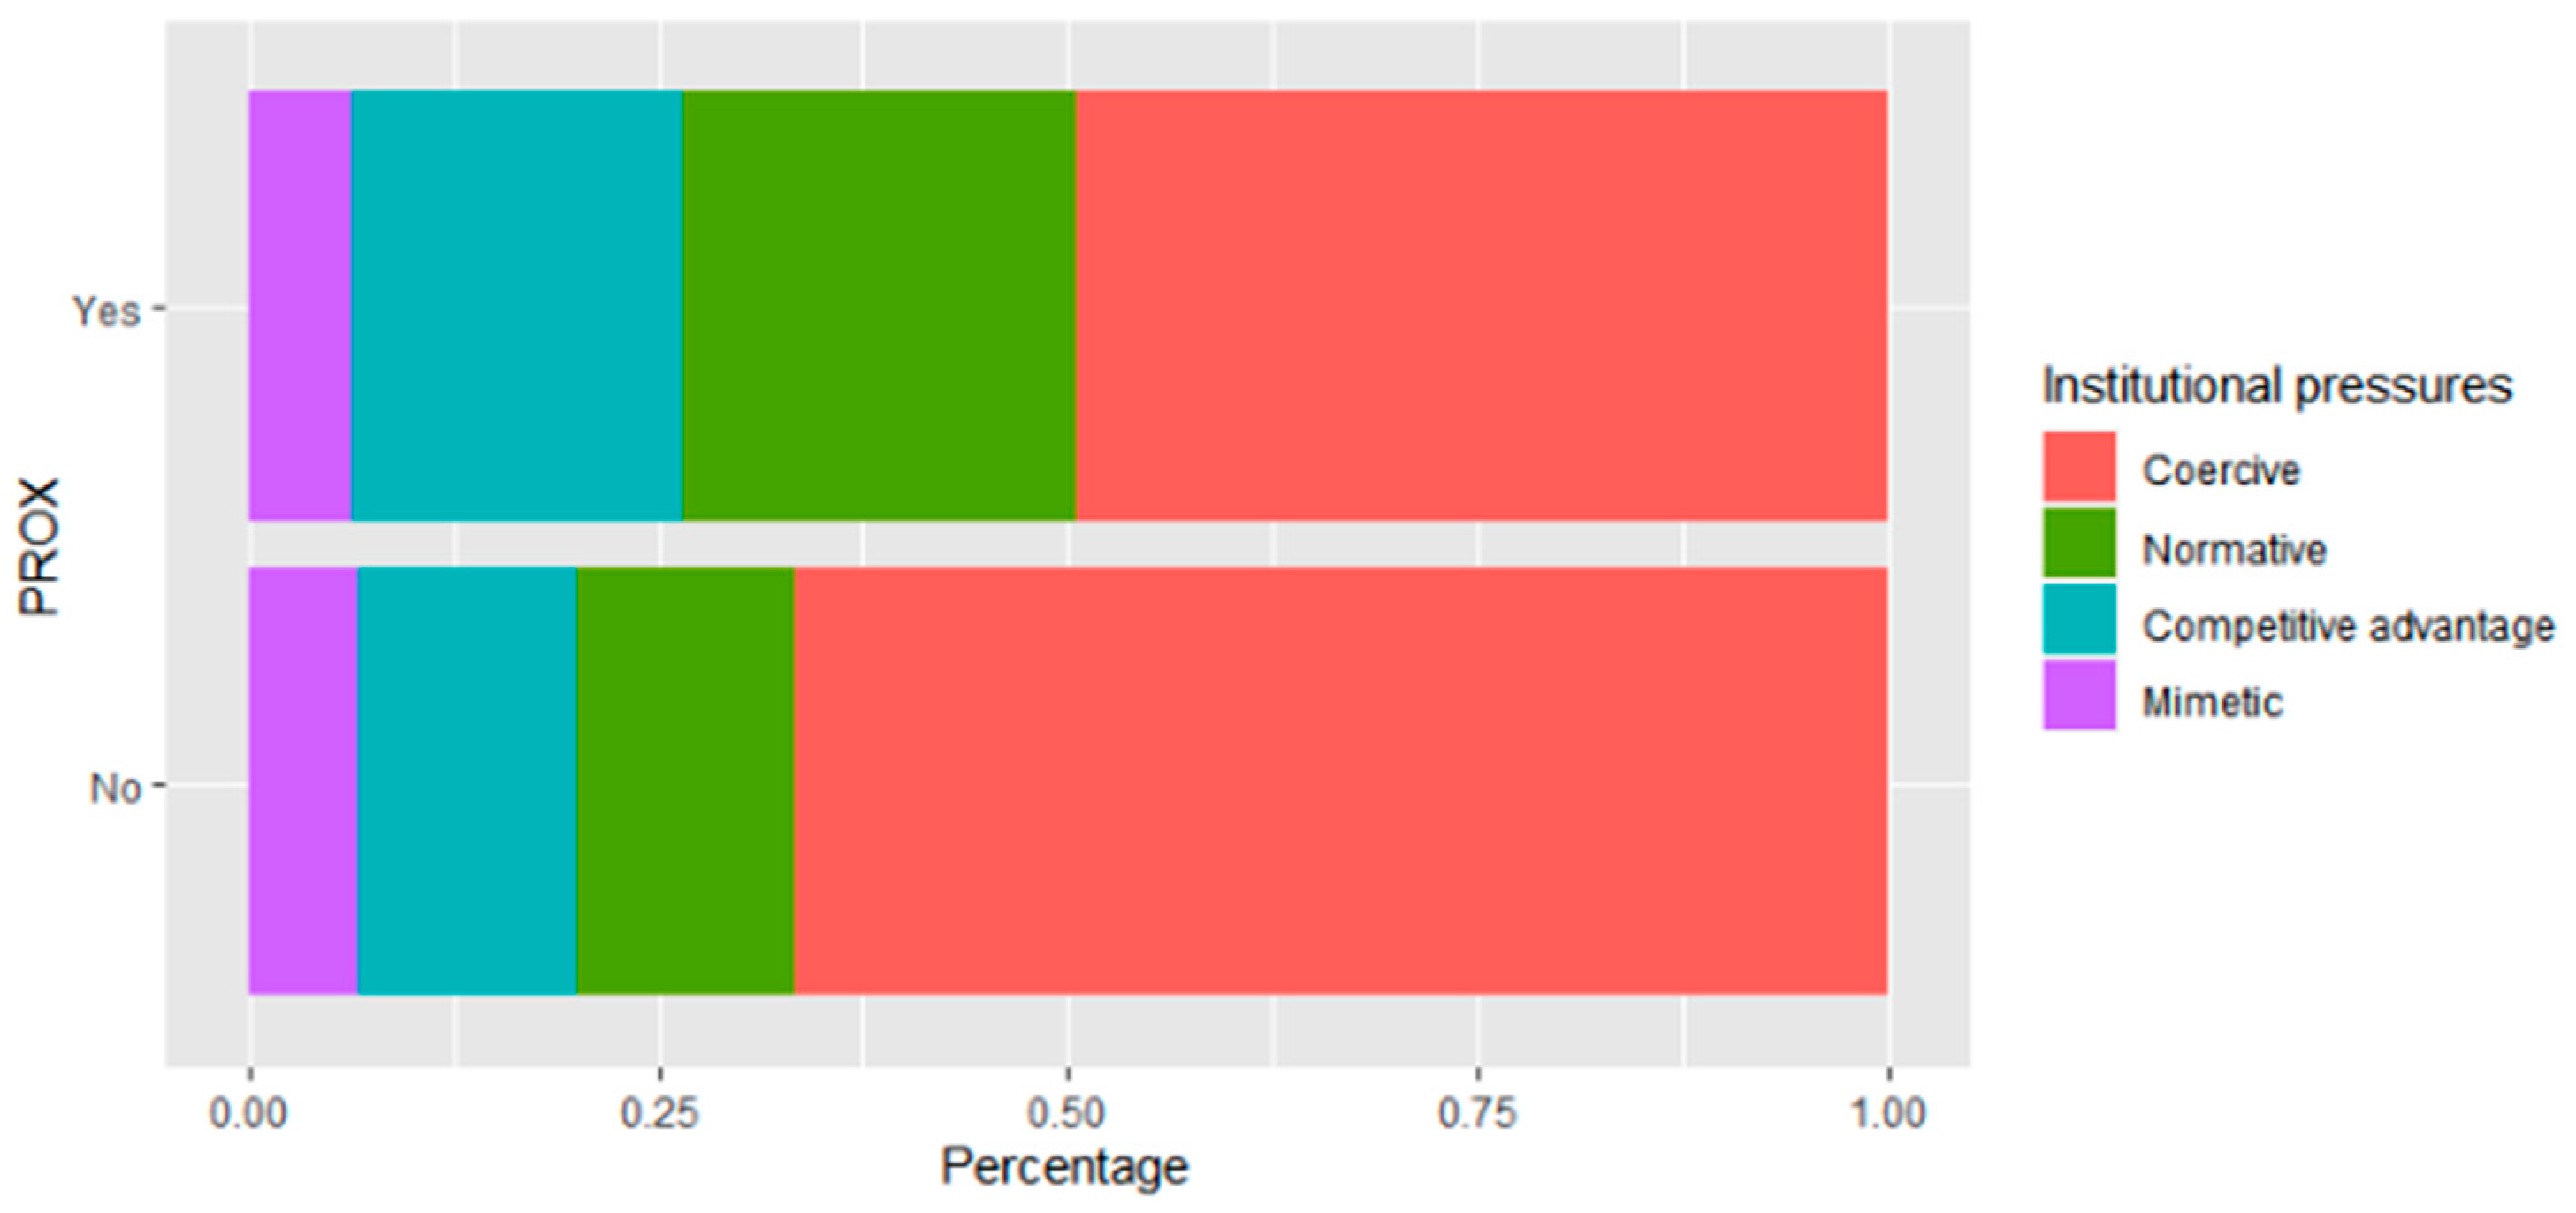
Following the same reasoning, we observe that for PMBs located in proximity to cities and thus confronted with higher levels of stakeholder pressure, the ‘normative’ and ‘competitive advantage’ isomorphisms are more present, compared to those PMBs not located in proximity to cities (
Figure 7).
Finally, the last figure (
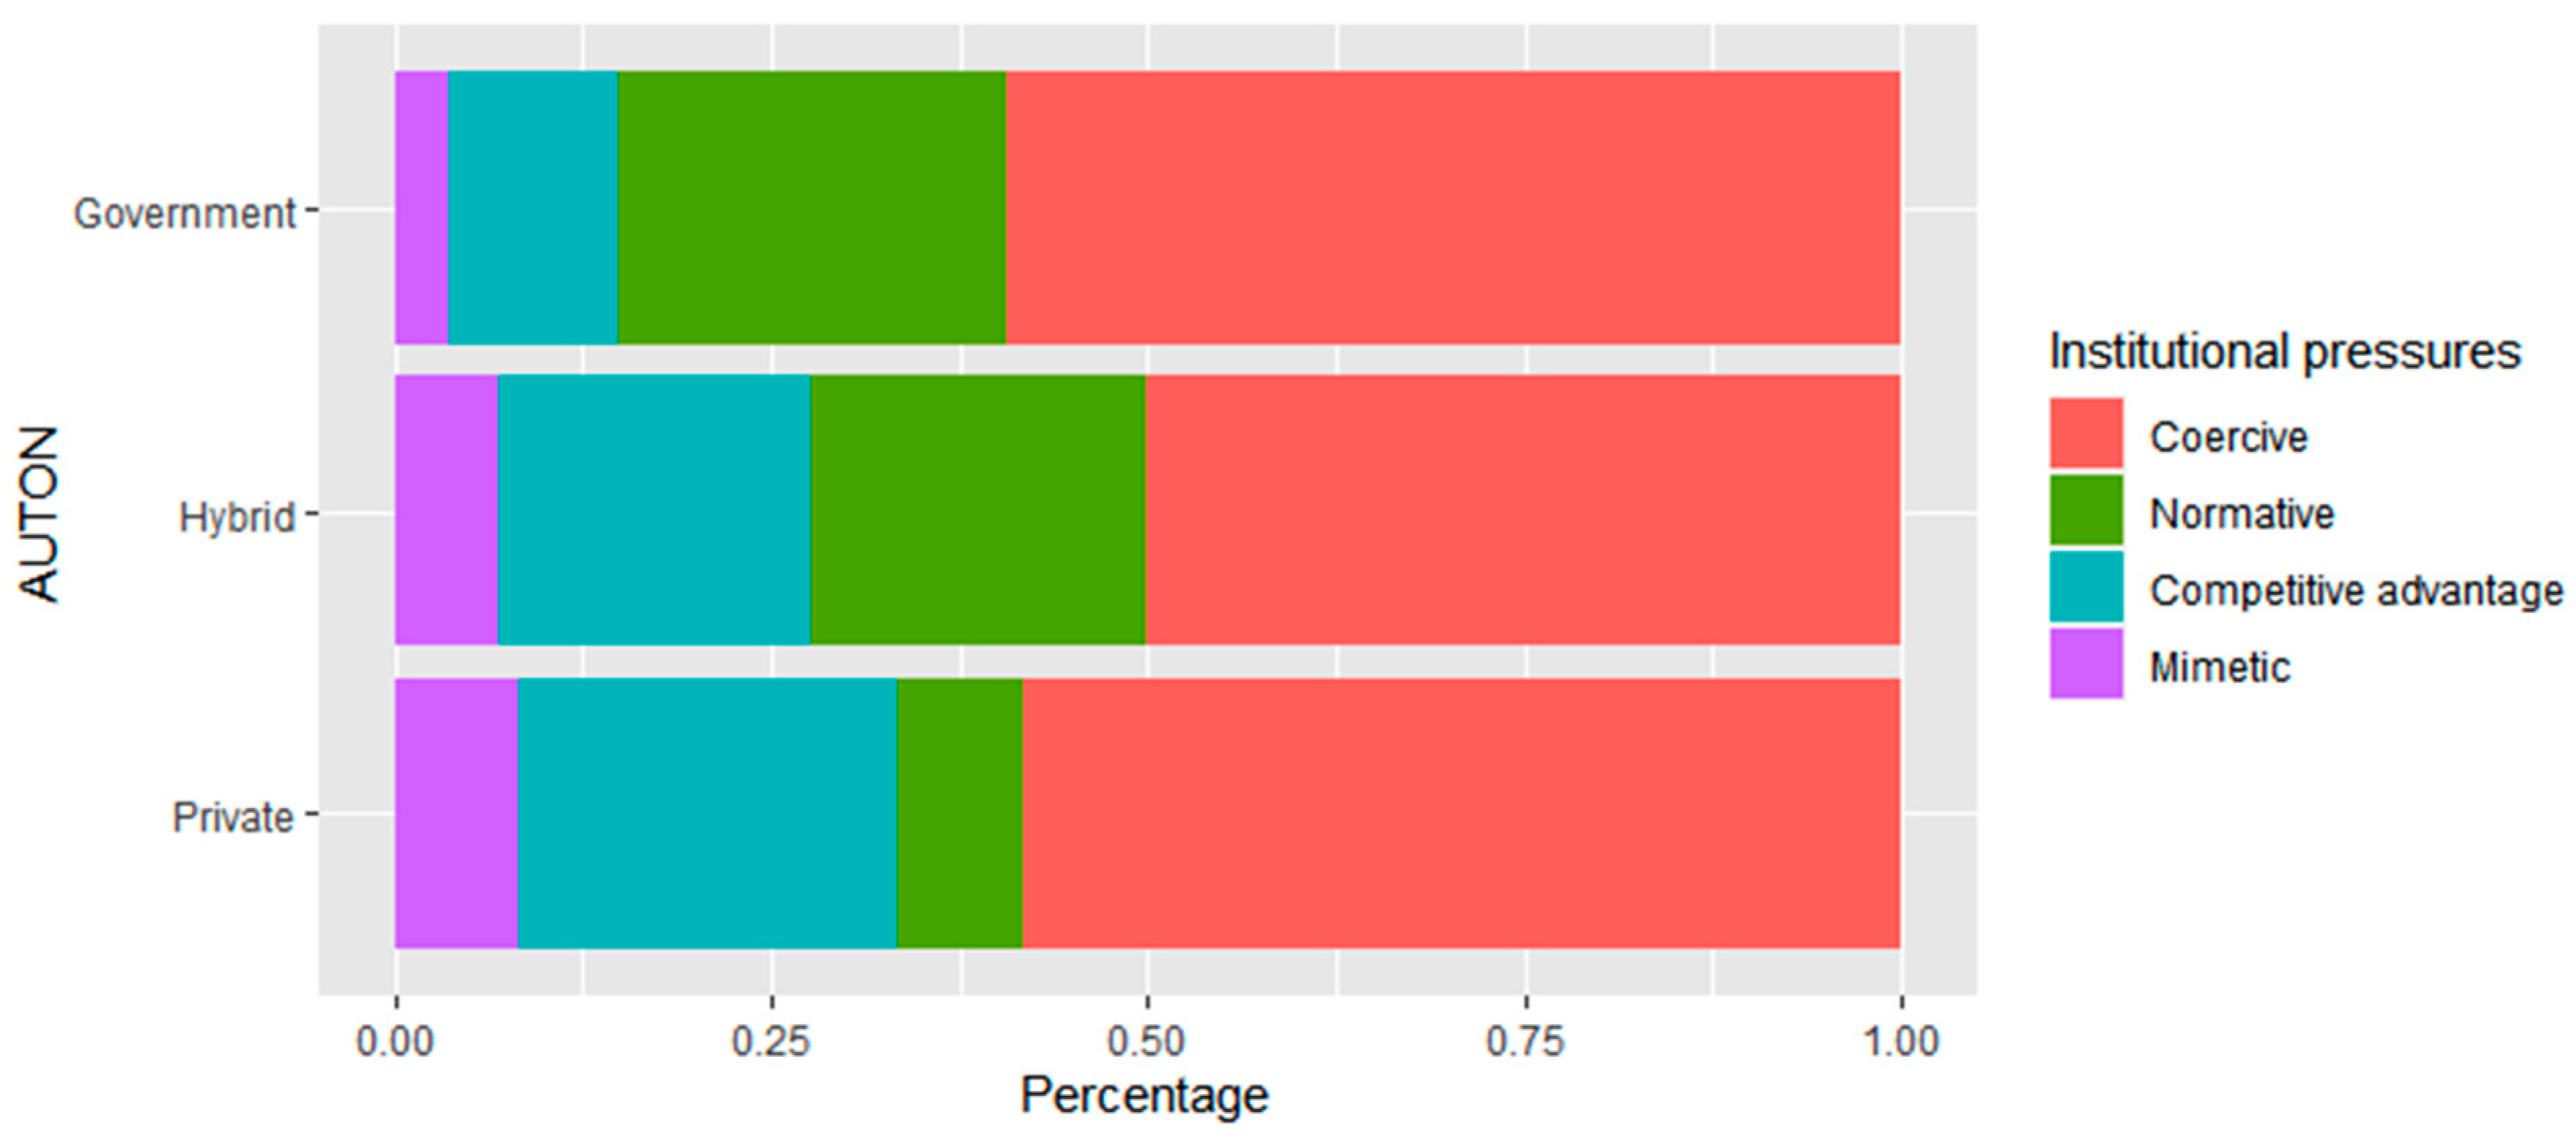
Figure 8) shows that government-controlled PMBs with a lesser degree of managerial autonomy have begun to report on sustainability from a ‘normative’ point of view, i.e., from the need to pursue what is desirable and right for society, compared to more privately owned structures that were led by the ‘competitive advantage’ of the practice, i.e., sustainability reporting as added value from a ‘cost–benefit analysis’ perspective. The outcomes for more hybrid structures, being a mix of both autonomy governance models, interestingly show the exact average results of the two extremes, confirming the relevance of the ‘public–hybrid–private’ continuum in terms of ownership and autonomy for PMB-related research.
5.4. Policy and Managerial Recommendations
Based on our research, we identify two major policy and managerial implications/recommendations, the first with a focus on PMBs and the second on environmental certification bodies such as ECOPORTS and GreenMarine.
- (1)
Given that PMBs are part of a larger port cluster, one can question what the boundary setting of indicators of an SR should be, in particular knowing that the history of performance data gathering is identified as both a significant explanatory variable, as well as, more implicitly, a barrier to engaging in sustainability reporting. Should reporting be limited to the exclusive organizational characteristics and responsibilities of the PMB itself, or should this also include the overall cluster and supply chain performance, and to what extent? An important concept underlying this question is the need for knowledge and data transfer with a specific focus on sustainability practices and reporting, which does not appear to be common practice (as yet) within the port industry [
48]. In order to achieve industry-level sensitivity as to the opportunities and benefits linked to industry-wide sustainability reporting, it is important that each individual PMB acknowledges the importance of investments in proper data collection and monitoring, as well as in the building of strong trust relationships among the different stakeholders of the port cluster. This requires a set of capabilities in terms of trust building with stakeholders (to obtain data), investment in IT systems (for efficient and trustworthy management of data) and human resources (data analysts). However, the research presented in this paper shows that it is not specifically a matter of mobilizing those ports with a smaller resource base, as several already exhibit promising first steps. It appears to be more a matter of adapting the existing organizational culture, norms and beliefs within the port industry in general.
- (2)
In order for voluntary self-evaluation-based certification schemes to continue to exist, it is important that they continue to position themselves as one of the ‘best practices’ in the domain of sustainability strategies. The more PMBs adopt the practice of sustainability reporting and report on outcomes rather than compliance with social and environmental management standards, the higher the chance an SR will be considered a general standard in sustainability strategy thinking. In respect to stakeholders, an SR often covers the same aspects as these certifications, albeit in greater detail and thus in a more convincing way, therefore significantly lowering the added value of the certification. Specifically, when the SR is developed in collaboration with the PMB’s relevant stakeholders, it pays attention to their social and environmental demands and needs. In sum, the practice of certification might lose relevance when the time and investment required to obtain the certification are not outweighed by both economic and strategic benefits to as great an extent as with sustainability reporting.
6. Conclusions
This study investigates, on a global scale, the dynamics of organizational characteristics and contextual factors (institutional environment) that would positively/negatively influence the practice of sustainability reporting by port managing bodies. It is the first study of this size in the domain of PMBs that incorporates a majority of previously investigated organizational determinants into a single regression analysis in order to discover those that are most important, compared to other studies where often only national contexts or a limited set of variables have been analyzed. Furthermore, it is also the first study concerning sustainability reporting that analyzes the institutional environment in which PMBs operate and, in turn, links these insights with the outcome of the regression analysis in order to maximally reveal the driving mechanisms behind sustainability reporting in the port sector.
Based on the obtained results of a global survey with port managers being the target audience, a set of conclusions can be drawn. First, the most significant organizational determinants to begin reporting on sustainability are: (i) proximity to a city, (ii) history of performance data gathering, and (iii) amount of obtained social/environmental certifications. The latter two are elements over which the PMB has a large degree of control in terms of strategic decision making and resource allocation. This strengthens the idea that engaging in sustainability reporting is the manifestation of an initial shift in mindset towards a more socially and environmentally responsible plan of action and not just the result of pure economic rationale. Organizations such as IAPH could play an important role in raising the profile of the industry at the level of sustainability reporting by fostering dialogue among all relevant stakeholders and provide support in terms of the sharing of best practices, defining a set of common indicators and calculation methodologies, and providing implementation guidance towards sustainability reporting.
Second, the institutional context in which the PMB operates is as important as its organizational characteristics. Institutional pressures appear to have large and diverse influences over the decision making of PMBs with regard to SR adoption. However, as the results show, there is no significant unambiguous interaction between certain organizational characteristics and institutional pressures. This relationship appears to be much more complex, and as a result we are only able to identify more common combinations of organizational characteristics and institutional pressures, highlighting the fact that full convergence in sustainability reporting at a global level has not yet been achieved. Stated differently, at present, the practice of sustainability reporting is not yet fully institutionalized, while recognizing the existence of multiple ‘fields’. The results of our research confirm the presence of a great diversity and undermine the idea of ‘one approach fits all’ for PMBs.
Third, at present, institutionalization of sustainability reporting applies to the activity rather than the content of it, given the wide variety of approaches, whether subject to certification or not. Reaching full consensus on the process and content of an SR, and thus the option of benchmarking, is still in its infancy phase.
The primary limitation of our research arises from the relatively small sample size, partially explained by the nature of the applied data collection method, an online survey, and the focal organization type of our analysis, PMBs. The ratio of the number of respondents and variables included in the analysis was relatively low, limiting the applicability of more sophisticated regression analyses. It is therefore difficult to establish whether or not the other tested variables are significant, because of the limited amount of observations or because of the small explanation power of the variable. Further research, enlarging the sample, could clarify this doubt. Furthermore, the respondents largely stem from developed countries. Unfortunately, no answers were received from Central and South America, and limited responses were received from Asia and Africa. Nevertheless, the answers received are equally distributed over the different answer categories concerning the adopted format of reporting, ranging from ‘no SR’ to ‘fully integrated or GRI certified SR’. The sample analyzed can be regarded as a reliable reflection of most of the possible real-life scenarios. However, further research should include more ports from the other developing regions, as these will have different institutional environments and organizational characteristics, potentially leading to different outcomes. This broader inclusion could also help in strengthening the possibility of extrapolating the results obtained to the entire PMB population. Another point that requires critical caution is that of applied definitions and indicators as proxies for the analyzed determinants: for example, in this study, we use the indicator ‘financial turnover’ as a proxy for the variable ‘financial performance’, as there is currently no other commonly accepted indicator under the form of, for example, profitability for PMBs. We argue that more rigorous theoretical and empirical research is needed to yield more precise insights on the use of more harmonized financial figures, and, by extension, key financial indicators for PMBs. Finally, supplementary interviews could further enrich the results of the research.


