Article

Techno-Economic Assessment of On-Farm Anaerobic Digestion System Using Attached-Biofilm Reactor in the Dairy Industry

1
Department of Chemical and Environmental Engineering, Faculty of Engineering, Universiti Putra Malaysia, Serdang 43400, Malaysia
2
Department of Biological and Agricultural Engineering, Faculty of Engineering, Universiti Putra Malaysia, Serdang 43400, Malaysia
*
Author to whom correspondence should be addressed.
Sustainability 2021, 13(4), 2063; https://doi.org/10.3390/su13042063
Submission received: 25 November 2020 / Revised: 19 January 2021 / Accepted: 25 January 2021 / Published: 14 February 2021
(This article belongs to the Special Issue Biofuels Production and Sustainability)

Abstract

:
In this study, a techno-economic assessment of an on-farm biogas system using an anaerobic biofilm reactor utilizing cow manure as a fermentation substrate was evaluated. A projection model was developed using Microsoft Excel software with three outputs, the size and dimension of a bioreactor, experimental microbial kinetic studies, and the economic studies based on the experimental results. Characterization analysis of cow manure wastewater showed the total solid (TS), total volatile solid (TVS), total carbohydrate (TC), chemical oxygen demand (COD), and pH values which were 10.95 g/L, 8.65 g/L, 6.65 g/L, 57.80 g/L, and 7, respectively. Using the modified Gompertz equation for the microbial studies, it was found that, at 37 °C and 20 days hydraulic retention time (HRT), the biogas yield was 934.54 mL/gVS, the volume of biogas produced was 11.28 m3/d, and 22.56 kWh of electricity was generated. The Gompertz prediction helps to determine the optimal HRT for the system so that the microorganisms are at their optimum stage to produce biogas. The economic analysis was done, and the results illustrated that, when the rate of cow manure produced was at 55 L/day.cow, the net present value (NPV) was RM 611,936.09, with a 13% internal rate of return (IRR), 0.14 return on investment (ROI), and 7.02 years of payback period (PP). By developing a techno-economic assessment that included all the necessary parameters such as sizing of the bioreactor, microbial kinetic studies, and economics of the plant, farmers could easily implement the system into their farms. This model showed that the anaerobic digestion system utilizing an attached biofilm with cow manure as a fermentation inoculum and substrate was applicable on an industrial scale to generate electricity and reutilize to the farm, at the same time generating additional income from the production of fertilizer.

1. Introduction

Over the past few decades, the high reliance on fossil fuels has negatively affected the community, the people, and the environment in terms of climate change and environmental degradation. Malaysia has a high demand in the agricultural sector and urbanization as a developing country, resulting in poor management of the environment [1]. Therefore, the quest to find renewable and sustainable energy as an alternative energy source is growing more urgently than ever as time passes. The need to integrate cleaner energy is clear to be seen [2]. Multiple researchers have researched producing biogas from biomass as an alternative energy source [3]. The composition of biogas contains a large percentage of methane (CH4) (60%) and carbon dioxide (CO2) (35–40%). Biogas also consists of other gasses such as ammonia (NH3), hydrogen sulfide (H2S), hydrogen (H2), oxygen (O2), nitrogen (N2), and carbon monoxide (CO) in small quantity [4].
Besides that, biomass is usually collected from agriculture, including municipal food waste from restaurants, households, and markets, while livestock waste such as animal manure is considered biomass too. Livestock production in Malaysia shows a trend of increment, which indicates that there is also an increment in biomass waste (“Jabatan Perkhidmatan Veterinary,” n.d.). Animal manure, such as cow manure, contains a high percentage of fibers due to their herbivore diet. The high fiber content in cow manure increases its potential to be used as a feedstock in the fermentation of biogas production [5]. Using animal manure as feedstock not only helps in reducing the emission of greenhouse gases (GHGs) in the environment but promotes sustainable manure management in intensive livestock production areas, especially to close nutrient cycles [6]. Lack of land for manure disposal and increasingly stringent requirements demand more effective manure management strategies and alternatives. Hence, this could be a solution to the problems mentioned.
The dairy farm’s biomass waste was given a new life as biogas and other valuable byproducts such as electricity and crop fertilizer. Electricity is generated by using the methane gas produced from the anaerobic digestion system [7]. In this system, an attached biofilm is formed on a suitable support carrier in which granular activated carbon (GAC) is used. It is common to use biochar which undergoes pyrolysis as an attachment carrier for immobilizing the microorganisms [8]. It is known that a higher concentration of the microbes helps in producing higher biogas yield [9] which means that more electricity can be produced in this case. GAC is selected as the carrier for attachment because GAC has a high surface area which mainly consists of porous structure enabling a high density of colonization for the microorganisms [10]. In this study, the GAC used was made of a coconut shell which is widely available in a tropical country such as Malaysia. The coconut shell is part of the abundant biomass which can be easily found. The shells then undergo the pyrolysis process, hence resulting in a type of biochar as well. It is mentioned as GAC due to its size which is in granulated form. The granulated form of biochar provides better adsorption compared to powder form. On the other hand, biomass waste is often used as crop fertilizers. The wastewater from the process can then be used as fertilizer for the plantation of grass which then is fed to the cows on the farm [11]. From there, an infinity loop of resources can be created when waste is turned into energy and reusable product, as the saying goes “waste to wealth” [12].
However, there is less literature that involves the design parameters of an anaerobic digester by using biomass such as cow manure. A techno-economic assessment by using Microsoft Excel software for biogas production using cow manure wastewater was outlined as one of the easy approach modeling systems for the industry. This assessment focused on assessing the feasibility of the anaerobic system on a dairy farm through the aspects of technology and economy. In terms of technology, the sizing of the reactor was evaluated based on calculations using information obtained from a small-scale dairy farm in Malaysia, such as the number of cows, operating hours, volume of cow manure effluent, hydraulic retention time, and organic loading rate. Hence, a complete dimension of the reactor can be calculated based on the design suggested. On the other hand, this project used an attached biofilm which is an innovative technology to be introduced in the anaerobic system. Different from the common digester found in the market, attached biofilm is suggested to be employed in the system because by using the attachment method for immobilization, biogas yield is found to be higher and more stable [13]. Therefore, a lab-scale bioreactor was used for 50 days to determine the suitability of using this technology in the system. Furthermore, the microbial kinetic studies are vital in predicting the electricity produced in this project. Experimental work was carried out to comprehend the biogas system’s designs, such as fermentation temperature, hydraulic retention time, and volume of inlet effluent. These critical issues need to be addressed and analyzed when designing an anaerobic bio-digester, producing optimum results.
The economic analysis began with calculating fixed capital cost, total investment cost and operational cost, the value of profit, and cash flow. Even though there is no detailed explanation on how the conversion of biogas to electricity is presented in this article, important aspects were taken into consideration when it comes to the economy part, such as the total purchase cost of major equipment including the water pump, gas scrubber, Genset facilities, and other building materials. This study also evaluated several economic parameters, including net present value (NPV), internal return rate (IRR), profitability index (PI), and payback period (PP) [14].
The purpose of this research project was to assess the on-farm anaerobic digestion system mobilized on the attached-biofilm reactor by utilizing cow manure wastewater in the dairy industry. The techno-economic model was developed using Microsoft Excel based on the microbial kinetic studies obtained from the experimental analysis. The first objective was to analyze the characteristics of cow manure, including total carbohydrate (TC), chemical oxygen demand (COD), total solids (TSs), and total volatile solids (TVSs). These characteristics were then used as a basis for the bioreactor’s calculation and designs in the model. Secondly, a lab-scale anaerobic digestion system was used to investigate the microbial kinetic studies using the modified Gompertz equation. From the microbial studies, researchers can predict the suitable retention time for the system as the modified Gompertz equation shows the activation and stationery phases of the microorganisms. The highest biogas yield can also be evaluated based on the experimental analysis. Lastly, the economic parameters were evaluated by using the method developed using Microsoft Excel software. The parameters involved will be reviewed in output where the payoff is proportional or higher than the investment, which is highly favorable in the industry. In conclusion, the target of this project was to provide a modeling system for farmers to apply this technology in their farms with a detailed design of the reactors and to predict the biogas production which then can be used as an alternative source of energy as well as managing the cost of building this system.

2. Materials and Methods

2.1. Collection of Cow Manure

The cow manure used in this study was obtained from a dairy farm at Ladang 16, University Putra Malaysia. The farm was estimated to have 200 milking cows where the flow rate of cow manure produced was between 45 and 55 L/day.cow. Raw samples were collected at the manhole and stored in the refrigerator at 4 °C to keep the sample’s quality at an optimum. Key physicochemical characteristics of cow manure, including TS, TVS, COD, TC, and pH, were determined.

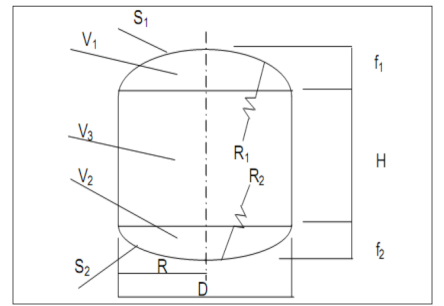
2.2. Bioreactor Design Dimensions

According to the design considerations of an anaerobic digester for producing biogas loaded with cow manure written by M. Edwin and S. Joseph, the designs were built on several volumes.
The volume of the bio-digester was calculated by a series of formulas. The various dimensions were the volume of gas collecting chamber (Vc), volume of gas storage chamber (Vgs), volume of fermentation chamber (Vf), and volume of sludge layer (Vs). The total volume of the biodigester is the summation of all volume stated, V = Vc + Vgs + Vf + Vs. Geometrical dimensions of the biogas digester are given in Table 1. The shape of the bioreactor was a cylinder with rounded edges, as shown in Figure 1.
The cylinder body of the bioreactor was separated into a few parts representing different volumes which were V1, V2, and V3. R was the radius of the bioreactor while H was the height of the bioreactor. R1, R2, f1, f2, S1, and S2 each represented the rounded radius, the height, and the curved surface radius of the top and bottom parts of the bioreactor, respectively.

2.3. Microbial Kinetic Studies

A lab-scale anaerobic digestion system was developed to analyze the microbial kinetic studies. The modified Gompertz equation using Microsoft Excel Solver was used to determine the cumulative biogas production. Theoretically, the modified Gompertz equation is as follows:
P = A.exp {−exp [Ue/A (λt) + 1]},
P = cumulative of the specific biogas production (mL/gVS),
A = biogas production potential (mL/gVS),
U = maximum biogas production rate (mL/gVS.day),
λ = lag phase period or minimum time required to produce biogas (day),
e = mathematical constant having value 2.718282,
t = period of biogas production (day).
The cow manure wastewater collected was cultured overnight then acclimatized using a sequencing batch system in a mesophilic condition (37 °C), pH 7, and later used as the inoculum source for fermentation. The optimum temperature of fermentation is often reported to be 30–38 °C [15].
The percentage of the attached biofilm added into the medium was chosen at 25% (v/v), equivalent to 200 mL at 1:1 inoculum to GAC as a microbial support carrier in 800 mL working volume of a 1 L bioreactor. The concept of using attached biofilm is where the microorganisms are already attached to the carrier, and therefore they are more concentrated and well-adsorbed on the surface of the carrier, which in this study was GAC. Therefore, 25% of attached biofilm meant that 25% of the total working volume was occupied with the biofilm that was the GAC that consisted of microorganisms that had been attached to it and formed a layer of biofilm. The biofilm acted as the inoculum of the reactor in the anaerobic digestion system. Twenty-five percent inoculum was chosen in this study because, based on Bo Hu’s findings, 30% inoculum increased the biogas productivity over 50% when compared to the production with only 15% inoculum [16]. The system was run at a hydraulic retention time (HRT) of 14 days with an initial pH7. The gas produced was monitored using the water displacement method, where the measuring cylinder was set up inverted in the hydrochloric acid solution (pH 2) to avoid leaking gases. The volume of biogas was recorded daily [13].

2.4. Economic Analysis

An economic analysis was conducted for the biogas system. The life span of this biogas system was estimated to be 20 years. The selling price of electricity is RM 0.35/kWh, according to TNB Malaysia [17].
Working capital is the capital needed to operate the production process from when the raw material is bought until the realization of cash. Working capital was calculated as 5% of fixed capital to cover the cost of initial solvent change. The fixed capital was calculated using the factorial estimation method, where the factors were listed in Table 2.
The factors mentioned in Table 2 were the typical factors for the estimation of a project fixed capital cost. These factors were based on Coulson Richardson’s Chemical Engineering Vol. 6, Chemical Engineering Design 4th edition, under chapter 6, page 269. In the book, the table lists the items that are related to estimating the cost of a project. Values for major equipment such as piping and storage were reduced because the farm that was being assessed in this study has developed an existing site with some of the basic facilities including a storage tank and an anaerobic pond. Therefore, for site development and ancillary buildings, these 2 factors were not included in this assessment either.
Total investment value includes the component of working capital and fixed capital as shown in Equation (2):
Investment value = Σ (Fixed capital, working capital)
The operational cost can be divided into two groups, which are fixed operating and variable costs. Hence, to calculate operation cost we summed up these two groups of costs as shown in Equation (3) below:
Operational cost = Σ (Fixed cost, variable cost)
NPV value is the deduction result of the present value of proceeds with the current value of investment cost, as shown in Equation (4).
NPV =   t = 0 n CF n 1 + k n
where n is the year when the expense or revenue takes place, CF is cash flow at period n, and k is the discount rate (7.398%). This discount rate was taken into account for both opportunity costs and risk premiums. IRR was calculated as the discount rate at which NPV equals zero, where k is the interest rate. The subsidies were not taken into account in the calculation. The formulas of other parameters were as shown in Equations (5) and (6) below:
PI =   Present   value   of   proceeds Present   value   of   initial   investment
PP = A +   B C
where A = the last year when the cash accumulation positive, B = the last positive cash accumulation value, and C = the proceeds in the first year when cash accumulation negative.
The biogas feeds a combined heat and power (CHP) unit of 38% net electric efficiency and 48% thermal efficiency. Power was assumed to sell directly to the grid with no additional losses [18].
According to Tenaga Nasional Berhad, a dairy farm is considered under medium voltage general specific agriculture; Air Selangor believes a dairy farm falls under commercial. Therefore, the price of purchased utilities presumed is listed in Table 3.

2.5. Computer Software

The software used in this study was Microsoft Excel 2016. The parameters monitored were bioreactor dimension, microbial kinetic studies, and various economic studies listed in Table 4.
The Microsoft Excel techno-economic assessment aimed to create a biogas production model. The parameters listed in Table 4 above can be generated automatically when the user keys in several required inputs. It gives users the convenience to come up with a biogas production model and economics studies that users may find helpful in their initial stage of project development.

3. Results and Discussion

3.1. Characteristics of Cow Manure

The TS and TVS values for cow manure were 10.95 g/L and 8.65 g/L, which was considered high. Dairy cows were commonly being fed with grass, and thus they already processed the food with the microorganisms in cow’s rumen, leaving cow manure with high lignocellulosic contents, including cellulose, hemicellulose, and lignin [19]. The TC reading in cow manure was relatively low, with 6.65 g/L. The low total carbohydrate content in cow manure was also related to its lignocellulosic content, causing the cow manure to be hardly hydrolyzed by acid [15]. Other than that, cow manure had a high COD value, which was 57.80 g/L. The high reading of COD was a result of the cow’s high fiber diet. A dairy cow’s daily food consisted of fiber, including grass and high protein soybean meal [18]. The pH of cow manure was 7, which was neutral.

3.2. Bioreactor Design

3.2.1. Relationship between the Flow Rate of Cow Manure and Volume of Bioreactor

The volume of cow manure effluent in the unit of L/day.cow produced from the factory ranged from 45 to 60 L per day per cow, with 200 cows in the factory. Working volume (WV) was first calculated using Equation (7):
WV   m 3 = 0.6 Vol   of   cow   manure   effluent × num   of   cow × COD OLR   × 1000 ,
where COD is chemical oxygen demand (g/L), and OLR is the organic loading rate (kg COD/m3.day).
The manure collected from the farm was kept in a 10 L bottle and left to settle down for a few days. The manure was separated by gravity into two distinct layers. Heavy particles in the manure were settled to form a bottom layer. The 4 L sediment mainly consisted of digested grass and grain that were fed to the cows on the farm. The upper layer, termed the manure slurry supernatant, was siphoned from the bottle and was collected as the feed for the bioreactor without further filtering. The 6 L slurry supernatant was stored in the refrigerator at 4 °C until use [20]. Therefore, 60% was considered as the supernatant of the total cow manure wastewater produced by the farm. Hence, the volume of the bioreactor was calculated based on the manure slurry supernatant.
It was fixed that the bioreactor had a 20% headspace of the total volume of the bioreactor, which made the remaining 80% to be the working volume.
From Table 5, it was shown that with the minimum rate of cow manure produced at 40 L/day.cow, the working volume of the bioreactor was 96 m3. Along with the rate increment, from 45 to 55 L/day.cow, the working volume increased from 108 m3 to 132 m3. The maximum working volume in this study was 144 m3 with a rate of 60 L/day.cow.
Based on this study, when the rate of cow manure produced was too low, the biogas plant could not function efficiently as the biogas production could be very low and it might not be able to generate a sufficient amount of electricity to be used on the farm. On the other hand, when the rate of cow manure produced was too high, more biogas could be produced, but more funds and space would be needed to construct the large size of the biogas plant [21]. Hence, 55 L/day.cow was selected in this assessment as the plant size was sufficient in terms of electricity generation and also wise in terms of capital. The working volume of the bioreactor was evaluated at 132 m3, and the total bioreactor volume was 165 m3.

3.2.2. Relationship between Rate of Cow Manure and HRT

The HRT of the biogas system is related to the flow rate of cow manure as shorter HRT would require more cow manure to be supplied to the system. The flow rate was calculated as WV divided by HRT. The feeding frequency of the system was based on the changing of HRT while keeping the initial sugar concentration at constant [22]. Sugar played an important role in dark fermentation as sugar was the provider of energy for the microbes. Total carbohydrate is known as one of the important characteristics influencing the production of biogas. A sufficient concentration of sugar content could help to boost the anaerobic system. On the other hand, if the sugar supply is low, microbes undergo deficiency of energy supply, thus causing low production of biogas [12]. The calculated results are illustrated and tabulated in Table 5.
When the HRT of the biogas system was set to be 20 days, the flow rate of cow manure per day was the highest, with the value ranging from 4.8 to 7.2 m3/day. However, when the HRT was set to be 60 days, the inlet flow rate was only between 1.6 and 2.4 m3/day, which did not vary much even when the rate of cow manure produced increased from 40 to 60 L/day.cow. The results in Table 5 further suggest that the higher the HRT, the lower the inlet flow rate of the bioreactor [23]. From the previous discussion, the rate of cow manure produced was selected at 55 L/day.cow; hence the optimum HRT in this study was 20 days where the flow rate of cow manure was the highest at 6.6 m3/day. A higher inlet flow rate results in higher biogas yield too [24].

3.2.3. Bioreactor Design

With known working volume, the detailed geometrical dimension could be calculated as stated in Table 1. The dimensions of the bioreactor were then calculated and tabulated in Table 6 below.
As the rate of cow manure produced increased, the bioreactor’s overall volume would increase too. The headspace of an anaerobic digester plays an important role in fermentation [25]. A sufficient volume of headspace was required for the reactor to perform optimum anaerobic digestion [26]. High pressure inside the reactor negatively impacted the fermentation as the environment was not conducive for the anaerobic reaction to work [27].

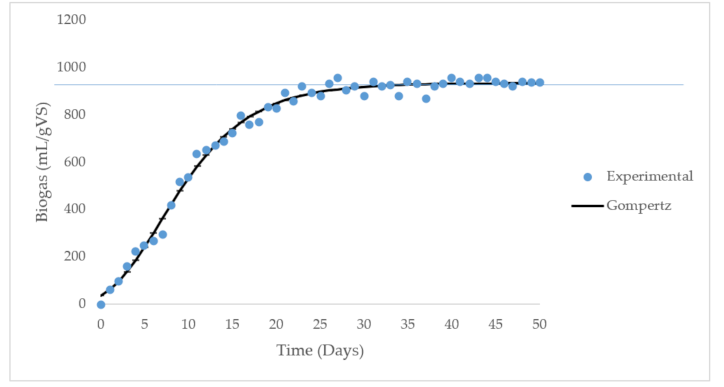
3.3. Microbial Kinetic Studies

Anaerobic fermentation was carried out to find biogas yield (P), which was considered as a crucial index to evaluate the biogas production process. The biogas produced using cow manure as a medium was plotted against time and then fitted using the modified Gompertz equation [8]. From the fitting, biogas production potential, A (mL/gVS), maximum biogas production rate, U (mL/gVS.day), and lag phase, λ (days), were determined.
From the graph of the modified Gompertz equation, it was shown in Figure 2 that the process achieved a steady-state, which required a long period of HRT [8]—in this study the experiment was carried out for 50 days. Through the Gompertz graph, it was shown that the activity of the microorganisms started after one to two days of anaerobic fermentation. Throughout the experiment, the process was still under the activation phase which was clearly shown in the graph where the biogas production was increasing exponentially [10]. After Day 20, Gompertz predicted that the process slowed down and inclined toward the stationary phase. A constant volume of biogas produced was achieved on Day 40 when the volume of biogas produced only had a very slight fluctuation. Hence, from the Gompertz prediction, it was shown that the most suitable HRT for cow manure anaerobic digestion system was 20 days as the microorganisms are still active to produce gases. If the HRT was to be prolonged, the biogas production would slow down. Furthermore, it was also shown that GAC is a suitable support carrier for the cultivation of microorganisms in biogas production. Biofilms formed on the surface of GAC were stable, and they provided an environment that was rich in nutrients that favored the microbes [28].
When fitted into the modified Gompertz equation, it was found that the highest biogas production A = 934.54 mL/gVS, maximum biogas production rate U = 60.55 mL/gVS.day, and lastly lag phase λ =1.04 days. A similar experiment was done by another researcher who found that the optimum daily methane yield was 102 mL/gVS within 50 days. When the experiment was prolonged for another 50 days, the daily methane yield was 146 mL/gVS [22]. Another research also showed that by using cow manure alone as the substrate in anaerobic digestion, 144 mL/gVS of methane was obtained daily [29].
Using the results shown in Table 7, they were then substituted back into the equation with a different HRT to determine the biogas yield. As mentioned earlier, an HRT of 20 days was used in this assessment due to its suitability with the Gompertz prediction, and the biogas yield (P) was obtained at 848.66 mL/gVS. Previous studies stated that a longer HRT provided a more extended period for the cellulose of cow manure to be degraded, hence producing higher biogas yield [30], but the experimental data showed that, in this case, it was not necessary to have a long-overdue HRT since the maximum gas that could be produced was only 934.54 mL/gVS. Hence, 20 days HRT produced about 850 mL/gVS, and it was sufficient for the system to generate electricity. Therefore, the volume of biogas produced in this study was estimated to be 11.28 m3/day, and the volume of biogas produced per HRT was 225.6 m3. By using the equation, however, different HRTs could be applied and resulted in a different production of biogas. Hence, the volume of biogas produced per HRT is more appropriate as 225.6 m3 of biogas was predicted to produce within 20 days, the optimum HRT that was applied in the equation for this study.
Other researchers have also found that co-digestion of cow dung resulted in higher biogas yield which directly affected the energy yield obtained from the anaerobic digestion system [31]. Wheat straw was one of the typical substrates used in the anaerobic digestion system. When 5% of cow manure was replaced with wheat straw, an average of 30% enhancement in methane yield was obtained compared with fermenting cow manure alone. However, another researcher also deduced that there was no apparent improvement in either way [32]. Utilizing cheese whey in co-digestion with cow dung also showed good economic performance and positive returns. Co-digestion with 30% of cheese whey substrate increased the biogas production, resulting in a higher electricity selling price which was the key parameter to determine the accountability of the system [33]. Another researcher evaluated the technical and economic feasibility of anaerobic digestion implementation at a dairy farm in Italy. It was shown that good methane yield was obtained at 437.3 NmLCH4/gVS. Inoculum-to-substrate was applied at a ratio of 6 [34]. However, cheese production is not widely introduced in dairy farms in Malaysia. Since the assessment was done based on a dairy farm in Malaysia, it was difficult to include co-digestion in this article as this should be a modeling system that is easily adaptable for local farmers on a small-scale farm.

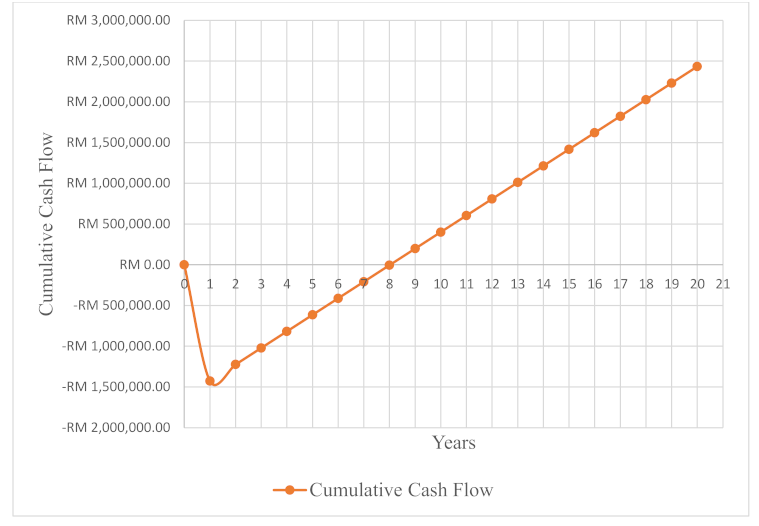
3.4. Economic Studies

3.4.1. Electricity

One of the primary products of this anaerobic digestion system was the production of electricity using the biogas produced. Based on Swedish Gas Technology Centre essential data on biogas in 2012, 1 m3 of biogas could produce up to 6 kWh of energy. After considering all the energy losses throughout the process, only approximately 2 kWh was the power yield [35]. Hence, based on the microbial studies that have been carried out previously, with 11.28 m3 of biogas produced, 22.56 kWh of electricity could be produced in a day, while 676.8 kWh of electricity could be produced in a month.
According to TNB, the selling price of electricity is RM 0.35/kWh. Within a month, the revenue from selling electricity using biogas was estimated to be RM 236.88 and RM 2842.56 in a year. This amount of electricity could then be reused for operating the farm itself. Every month the owner could save about RM 250 on electricity bills. Utilizing electricity that was generated by biogas produced on-farm is a sustainable way to run the farm where waste is turned into something valuable, and the owners can benefit from it [36].

3.4.2. Economic on Biogas Production

Other economic parameters such as total purchase cost of equipment (PCE), fixed capital, investment, revenue, and profit were evaluated and shown in Table 8 below:
Total PCE included the cost of a bioreactor, water pump, gas scrubber, and Genset facilities as well as activated carbon. A bioreactor was desirable to be located near the source of the feedstock medium to avoid excessive handling and transportation. The amount of gas piping required was also minimized by having the authority near. Variable cost consisted of any miscellaneous materials and utilities (given rate of RM 2.07/m3 water used) that were calculated as well. Since various materials were not considered in this research, variable cost only involved utilities. Fixed costs consisted of maintenance charges, capital charges, insurance, and local taxes. However, in this study, only maintenance cost was taken into account.
Based on the production of biogas only, the revenue of this assessment was not adequate to cover the operational cost of this system. Hence, fertilizer was also introduced to the system where the revenue of this biogas plant could be expanded. The value of revenue showed in Table 8 included both electricity produced by biogas and also fertilizer from the solid waste of cow manure. The annual revenue was RM 274,855.68 where electricity only contributed approximately RM 3000. Therefore, it was suggested that this electricity produced from biogas mainly was supplied back to the farm so the farmers could save about RM 236.68 monthly on the electricity bill.
Figure 3 illustrates the cash flow of the biogas plant. It was clear to see that at the beginning when the biogas plant was implemented, it would not generate much income for the farm and face a negative cash flow, especially the first one to two years when the cumulative cash flow was – RM 1,500,000. Then, slowly from year 3 to 7, the biogas plant started to show increment. The production plant was in a debt period when the profit was mainly used to pay off the debt for the construction and maintenance of the plant. In this study, the payback period was evaluated to be 7.02 years. Therefore, starting from year 8 and later, the production started to earn better and eventually pay back as a good investment at a steady rate.

4. Conclusions

In this study, the relationships between HRT, temperature, cow manure wastewater effluent, and economics were successfully evaluated. In addition, a Microsoft Excel modeling system, which assessed the outcome of a techno-economic assessment on biogas production from cow manure wastewater, was successfully built.
The experiment conducted showed that at 37 °C, HRT 14 days, the biogas production potential was 934.54 mL/gVS, the maximum biogas production rate was 60.55 mL/gVS.day, and the lag phase was 1.04 days. The highest yield of biogas was also predicted to be at HRT 20 days by using the modified Gompertz equation. At HRT 20 days, 11.28 m3 of biogas was estimated to produce daily which was then converted to electricity at 22.56 kWh. This could help farmers to save up to RM 236.68 in their monthly electricity bill and RM 2842.56 annually.
A design technique for sizing the bioreactor was presented in this study. The volume of cow manure effluent affected the WV of the bioreactor, hence influencing the feasibility of investment. The bioreactor’s working volume was found to be most suitable at the size of 132 m3 when the effluent was 55 L/cow.day. With the bioreactor size fixed, the economic part of the assessment can be evaluated as well. The sizing of the reactor directly affected the PCE of the biogas plant with an estimation of RM 755,000. Other related economic values were evaluated in this study too, such as NPV which was estimated to be RM 63,000, ROI 14%, IRR 13%, and 7.02 years of PP.

Author Contributions

Conceptualization, J.B.T. and N.S.J.; methodology, J.B.T.; software, J.B.T. and W.E.T.; validation, J.B.T., N.S.J., H.C.M., and Z.Z.A.; formal analysis, J.B.T., W.E.T., H.C.M., and Z.Z.A.; investigation, J.B.T.; resources, J.B.T., H.C.M., and Z.Z.A.; data curation, J.B.T. and N.S.J.; writing—original draft preparation, J.B.T.; writing—review and editing, N.S.J.; visualization, J.B.T.; supervision, N.S.J.; project administration, J.B.T.; funding acquisition, N.S.J. All authors have read and agreed to the published version of the manuscript.

Funding

This research was funded by the Ministry of Education Malaysia (MOE) under the Fundamental Research Grant Scheme (FRGS) 2019 through the VOT code of 5540208 (Ref: FRGS/1/201/STG05/UPM/02/28) toward the success of this study.

Acknowledgments

These authors would like to express their gratitude to all the laboratory staff at the Department of Chemical and Environmental Engineering, Universiti Putra Malaysia, for assisting this research.

Conflicts of Interest

The authors declare no conflict of interest.

References

  1. Akbulut, A. Techno-economic analysis of electricity and heat generation from the farm-scale biogas plant: Çiçekdaĝı case study. Energy 2012, 44, 381–390. [Google Scholar]
  2. Argun, H.; Gokfi, P.; Karapinar, I. Biohydrogen Production: Sustainability of Current Technology and Future Perspective; Springer: New Delhi, India, 2016. [Google Scholar]
  3. Bharathiraja, B.; Sudharsanaa, T.; Bharghavi, A.; Jayamuthunagai, J.; Praveenkumar, R. Biohydrogen and Biogas—An overview on feedstocks and enhancement process. Fuel 2016, 185, 810–828. [Google Scholar] [CrossRef]
  4. Chasnyk, O.; Sołowski, G.; Shkarupa, O. Historical, technical and economic aspects of biogas development: Case of Poland and Ukraine. Renew. Sustain. Energy Rev. 2015, 52, 227–239. [Google Scholar] [CrossRef]
  5. Cuéllar, A.D.; Webber, M.E. Cow power: The energy and emissions benefits of converting manure to biogas. Environ. Res. Lett. 2008, 3. [Google Scholar] [CrossRef]
  6. Gadhamshetty, V.; Arudchelvam, Y.; Nirmalakhandan, N.; Johnson, D.C. Modelling dark fermentation for biohydrogen production: ADM1-based model vs. Gompertz model. Int. J. Hydrog. Energy 2010, 35, 479–490. [Google Scholar]
  7. Das Ghatak, M.; Mahanta, P. Kinetic model development for biogas production from cattle dung. AIP Conf. Proc. 2017, 1859, 020010. [Google Scholar] [CrossRef]
  8. Jamali, N.S.; Jamaliah, J.M. Optimization of Thermophilic Biohydrogen Production by Microflora of Palm Oil Mill Effluent: Cell Attachment on Granular Activated Carbon as Support. Malays. J. Anal. Sci. 2016, 20, 1437–1446. [Google Scholar]
  9. Mainardis, M.; Flaibani, S.; Mazzolini, F.; Peressotti, A.; Goi, D. Techno-economic analysis of anaerobic digestion implementation in small Italian breweries and evaluation of biochar and granular activated carbon addition effect on methane yield. J. Environ. Chem. Eng. 2019, 7, 103184. [Google Scholar] [CrossRef]
  10. Jamali, N.S.; Jahim, J.M.; Isahak, W.N.R.W.; Abdul, P.M. Particle size variations of activated carbon on biofilm formation in thermophilic biohydrogen production from palm oil mill effluent. Energy Convers. Manag. 2017, 141, 354–366. [Google Scholar] [CrossRef]
  11. Urbaniec, K.; Bakker, R.R. Biomass residues as raw material for dark hydrogen fermentation—A review. Int. J. Hydrog. Energy 2015, 40, 3648–3658. [Google Scholar] [CrossRef]
  12. Li, Y.; Zhao, J.; Achinas, S.; Zhang, Z.; Krooneman, J.; Euverink, G.J.W. The biomethanation of cow manure in a continuous anaerobic digester can be boosted via a bioaugmentation culture containing Bathyarchaeota. Sci. Total Environ. 2020, 745, 141042. [Google Scholar] [CrossRef]
  13. Syakina, N.; Farahana, N.; Rashidi, D.; Jahim, J.; O-thong, S.; Jehlee, A.; Sakinah, N. Food and Bioproducts Processing Thermophilic biohydrogen production from palm oil mill effluent: Effect of immobilized cells on granular activated carbon in fluidized bed reactor. Food Bioprod. Process. 2019, 117, 231–240. [Google Scholar]
  14. Ruiz, D.; Miguel, G.S.; Corona, B.; Gaitero, A.; Domínguez, A. Environmental and economic analysis of power generation in a thermophilic biogas plant. Sci. Total Environ. 2018, 633, 1418–1428. [Google Scholar] [CrossRef]
  15. Xing, B.S.; Han, Y.; Wang, X.C.; Cao, S.; Wen, J.; Zhang, K. Acclimatization of anaerobic sludge with cow manure and realization of high-rate food waste digestion for biogas production. Bioresour. Technol. 2020, 315, 123830. [Google Scholar]
  16. Bergland, W.; Dinamarca, C.; Toradzadegan, M.; Nordgård, A.S.R.; Bakke, I.; Bakke, R. High rate manure supernatant digestion. Water Res. 2015, 76, 1–9. [Google Scholar] [CrossRef] [Green Version]
  17. Li, Y.; Zhao, J.; Krooneman, J.; Euverink, G.J.W. Strategies to boost anaerobic digestion performance of cow manure: Laboratory achievements and their full-scale application potential. Sci. Total Environ. 2021, 755, 142940. [Google Scholar] [CrossRef]
  18. Nazari, L.; Sarathy, S.; Santoro, D.; Ho, D.; Ray, M.; Xu, C.C. 3—Recent advances in energy recovery from wastewater sludge. In Direct Thermochemical Liquefaction for Energy Applications; Woodhead Publishing: London, UK, 2018. [Google Scholar]
  19. Bo, H. Biological Hydrogen Production via Self-Immobilized Bacteria. Ph.D. Thesis, Department of Biological Systems Engineering, Washington State University, Pullman, WA, USA, 2007. [Google Scholar]
  20. Jamali, N.S.; Jahim, J.M.; Isahak, W.N.R.B.W. Biofilm formation on granular activated carbon in xylose and glucose mixture for thermophilic biohydrogen production. Int. J. Hydrog. Energy 2016, 41, 21617–21627. [Google Scholar] [CrossRef]
  21. Krupp, M.; Widmann, R. Biohydrogen production by dark fermentation: Experiences of continuous operation in large lab scale. Int. J. Hydrog. Energy 2009, 34, 4509–4516. [Google Scholar] [CrossRef]
  22. Li, Y.; Achinas, S.; Zhao, J.; Geurkink, B.; Krooneman, J.; Euverink, G.J.W. Co-digestion of cow and sheep manure: Performance evaluation and relative microbial activity. Renew. Energy 2020, 153, 553–563. [Google Scholar] [CrossRef]
  23. Jamali, N.S.; Jahim, J.M.; O-Thong, S.; Jehlee, A. Hydrodynamic characteristics and model of fluidized bed reactor with immobilised cells on activated carbon for biohydrogen production. Int. J. Hydrog. Energy 2019, 44, 9256–9271. [Google Scholar] [CrossRef]
  24. Linke, B.; Muha, I.; Wittum, G.; Plogsties, V. Mesophilic anaerobic co-digestion of cow manure and biogas crops in full scale German biogas plants: A model for calculating the effect of hydraulic retention time and VS crop proportion in the mixture on methane yield from digester and from digestate storage at different temperatures. Bioresour. Technol. 2013, 130, 689–695. [Google Scholar] [CrossRef]
  25. Liu, Y.; Wang, Y. Directional enhancement of fermentative coproduction of hydrogen and acetic acid from glucose via control of headspace pressure. Int. J. Hydrog. Energy 2017, 42, 4095–4101. [Google Scholar] [CrossRef]
  26. Mainardis, M.; Flaibani, S.; Trigatti, M.; Goi, D. Techno-economic feasibility of anaerobic digestion of cheese whey in small Italian dairies and effect of ultrasound pre-treatment on methane yield. J. Environ. Manag. 2019, 246, 557–563. [Google Scholar] [CrossRef]
  27. Mohammadi, P.; Ibrahim, S.; Annuar, M.S.M.; Khashij, M.; Mousavi, S.A.; Zinatizadeh, A. Optimization of fermentative hydrogen production from palm oil mill effluent in an up-flow anaerobic sludge blanket fixed film bioreactor. Sustain. Environ. Res. 2017, 27, 238–244. [Google Scholar] [CrossRef] [Green Version]
  28. Mohammed, N.; Danapalasingam, K.A.; Majed, A. Design, Control and Monitoring of an Offline Mobile Battery Energy Storage System for a Typical Malaysian Household Load Using PLC. Int. J. Power Electron. Drive Syst. 2018, 9, 180–188. [Google Scholar] [CrossRef]
  29. Sun, Q.; Li, H.; Yan, J.; Liu, L.; Yu, Z.; Yu, X. Selection of appropriate biogas upgrading technology-a review of biogas cleaning, upgrading and utilisation. Renew. Sustain. Energy Rev. 2015, 51, 521–532. [Google Scholar] [CrossRef]
  30. Imeni, S.M.; Pelaz, L.; Corchado-Lopo, C.; Busquets, A.M.; Ponsá, S.; Colon, J. Techno-economic assessment of anaerobic co-digestion of livestock manure and cheese whey (Cow, Goat & Sheep) at small to medium dairy farms. Bioresour. Technol. 2019, 291, 121872. [Google Scholar] [CrossRef]
  31. Qiao, W.; Yan, X.; Ye, J.; Sun, Y.; Wang, W.; Zhang, Z. Evaluation of biogas production from different biomass wastes with/without hydrothermal pretreatment. Renew. Energy 2011, 36, 3313–3318. [Google Scholar] [CrossRef]
  32. Rajendran, K.; Aslanzadeh, S.; Taherzadeh, M.J. Household biogas digesters—A review. Energies 2012, 5, 2911–2942. [Google Scholar] [CrossRef]
  33. Rashidi, N.F.D.; Jamali, N.S.; Mahamad, S.S.; Ibrahim, M.F.; Abdullah, N.; Ismail, S.F.; Izhar, S. Effects of Alginate and Chitosan on Activated Carbon as Immobilisation Beads in Biohydrogen Production. Processes 2020, 8, 1254. [Google Scholar] [CrossRef]
  34. Tambone, F.; Scaglia, B.; D’Imporzano, G.; Schievano, A.; Orzi, V.; Salati, S.; Adani, F. Assessing amendment and fertilizing properties of digestates from anaerobic digestion through a comparative study with digested sludge and compost. Chemosphere 2010, 81, 577–583. [Google Scholar] [CrossRef]
  35. Wresta, A.; Andriani, D.; Saepudin, A.; Sudibyo, H. Economic Analysis of Cow Manure Biogas as Energy Source for Electricity Power Generation in Small Scale Ranch. Energy Procedia 2015, 68, 122–131. [Google Scholar] [CrossRef] [Green Version]
  36. Xing, B.S.; Han, Y.; Cao, S.; Wang, X.C. Effects of long-term acclimatization on the optimum substrate mixture ratio and substrate to inoculum ratio in anaerobic co-digestion of food waste and cow manure. Bioresoure. Technol. 2020, 317, 123994. [Google Scholar]
Figure 1. Configuration of the bioreactor.
Sustainability 13 02063 g001
Figure 2. Biogas production (mL/gVS) in an 800 mL of a 1 L modified lab-scale bioreactor in batch fermentation.
Sustainability 13 02063 g002
Figure 3. Cash flow diagram of biogas production in 20 years.
Sustainability 13 02063 g003
Table 1. Dimensions of the biogas reactor.
For VolumeFor Geometrical Dimensions
V c   5% V D = 1.3078 × V 1 / 3
V s   15% VV1 = 0.0827 D3V2 = 0.05011 D3
Vgs + Vf = 80% VV3 = 0.3142 D3
R1 = 0.725 DR2 = 1.0625 D
Vgs = 0.5 (Vgs + Vf + vs.) Kf1 = D/5f2 = D/8
Where K = gas production rate per digester volume per day. For K = 0.4 m3/m3.dayS1 = 0.911 D2S2 = 0.8345 D2
Table 2. Typical factors for the estimation of project fixed capital cost.
ItemProcess Type: Fluids-Solid
Major equipment cost, total purchase costpuchase cost of equipment (PCE)
F1Piping0.30
F2Instrumentation0.15
F3Electrical0.10
F4Buildings, process0.10
F5Storages0.10
F6Site developmentNot applicable
F7Ancillary buildingsNot applicable
Total physical plant cost (PPC)
PPC = PCE (1 + F1 + … +F8)
PPC = PCE × 1.75
F8Contractor’s Fee0.05 or none (for small plant project)
F9Contingency0.05
Fixed capitol = PPC (1 + F8 + F9)Fixed capitol = PPC × 1.1
Table 3. Presumed price of utilities purchased.
UtilitiesTariff (RM)
Electricity (TNB) a30.30/kW
0.35/kWh
Minimum payment = 600/month
Water (Air Selangor) b2.07/m3 (for first 35 m3)
2.25/m3 (for >35 m3)
a Pricing & Tariffs—Tenaga Nasional Berhad. b Water Tariff Information—Pengurusan Air Selangor.
Table 4. Parameters to be monitored.
Output
Output 1—Bioreactor Dimension
-
Working volume of the bioreactor
-
Inlet flowrate of bioreactor
-
Volume (Vc, Vgs, Vf, Vs)
-
Height (f1, H, f2)
-
Diameter (D, R1, R2)
Output 2—Microbial Kinetic
-
Biogas yield
-
The volume of biogas produced
Output 3—Economics
-
The electricity that can be generated
-
Revenue
-
Total capital investment
-
Annual operating cost
-
Annual profit
-
NPV
-
IRR
-
Payback period
-
PI
-
ROI
-
Cash flow diagram
Table 5. The flow rate of cow manure with its respective bioreactor volume and hydraulic retention time (HRT).
Rate of Cow Manure Produced (L/day.cow)60% Supernatant of The Rate of Cow Manure Produced (L/day.cow)Working Volume of Bioreactor (m3)The Volume of Bioreactor (m3)HRT (Days)/Cow Manure Flow Rate (m3/Day)
204060
402496.00120.004.802.401.60
4527108.00135.005.402.701.80
5030120.00150.006.003.002.00
5533132.00165.006.603.302.20
6036144.00180.007.203.602.40
Table 6. Dimensions of the bioreactor.
ParameterUnitValue
The total volume of the digester (V)m3165.00
Diameter (D)m7.17
The sectional volume of digester
V1m330.52
V2m318.49
V3m3115.96
Radius of digester
R1m5.20
R2m7.62
Rm3.59
Height of digester
f1m1.43
Hm28.71
f2m0.90
Curved surface
S1m46.87
S2m42.94
Heat transfer aream2646.98
Table 7. Microbial kinetic studies of biogas production.
Parameters
Biogas production potential, A (mL/gVS)934.54
Maximum biogas production rate, U (mL/gVS.day)60.55
Lag phase (days)1.04
Biogas yield, P (mL biogas/gVS)848.66
The volume of biogas produced (m3/day)11.28
The volume of biogas produced/HRT cycle (m3)225.6
Table 8. Output 3 economics on biogas production in a Microsoft Excel modeling system.
ParametersUnitValue
Electricity producedkWh/day22.56
kWh/month676.80
Electricity selling price RM/month236.68
RM/year2842.56
Total equipment purchase cost, PCERM755,000.00
Fixed capitalRM1,426,950.00
Total capital investmentRM1,426,950.00
Revenue (electricity and fertilizer)RM/year274,855.68
Annual operating costRM/year71,660.59
Annual profitRM/year203,195.09
Payback periodyear7.02
Return on investment, ROI 0.14
Net present value, NPVRM611,936.09
Internal rate of return, IRR 13%
Publisher’s Note: MDPI stays neutral with regard to jurisdictional claims in published maps and institutional affiliations.

