Article

Sensory Characteristics of Dairy By-Products as Potential Milk Replacers in Ice Cream

by
Roberta Barbosa de Meneses
1,2,
Maria Lúcia Guerra Monteiro
2,3,
Fabiane Ferreira dos Santos
2,
Maria Helena Miguez da Rocha Leão
4 and
Carlos Adam Conte-Junior
2,3,*
1
Departamento de Alimentos, Instituto Federal de Educação, Ciência e Tecnologia de Alagoas (IFAL), Satuba, Maceió 57120-000, Brazil
2
Instituto de Química, Universidade Federal do Rio de Janeiro (UFRJ), Rio de Janeiro 21949-900, Brazil
3
Núcleo de Análise de Alimentos (NAL), Laboratório de Apoio ao Desenvolvimento Tecnológico (LADETEC), Universidade Federal do Rio de Janeiro (UFRJ), Rio de Janeiro 21941-598, Brazil
4
Escola de Química, Universidade Federal do Rio de Janeiro (UFRJ), Rio de Janeiro 21949-900, Brazil
*
Author to whom correspondence should be addressed.
Sustainability 2021, 13(3), 1531; https://doi.org/10.3390/su13031531
Submission received: 15 December 2020 / Revised: 25 January 2021 / Accepted: 26 January 2021 / Published: 1 February 2021
(This article belongs to the Special Issue Sustainable Food Processing)

Abstract

:
Novel strategies for wheys application, decreasing its negative environmental impact, represent a challenge for dairy industries. The use of wheys as replacers may lead to adverse sensory quality changes in conventional dairy products. This study aimed to investigate the sensory effects of the use of ricotta whey (RW), cheese whey (CW), and butter whey (BW) in replacement to whole milk (WM) at different ratios (0:100%, 25:75%, 50:50%, 75:25%, and 100:0%, w/w) in chocolate ice creams. All formulations, including a commercial sample used as a reference, were analyzed for overall liking, purchase intention, just-about-right (JAR), and survival analysis. RW, CW, and BW up to 75%, 100%, and 25% did not affect (p > 0.05) the overall liking, respectively. Purchase intention was only decreased (p < 0.05) by BW at 50%, 75%, and 100% compared to a commercial sample. Considering data from PCA and PLSR associated with hedonic scores and penalty analysis, the main adverse sensory effects on overall liking were: increased perception (p < 0.05) of chocolate flavor by RW, CW, and BW, melting velocity by RW, sweetness by CW and BW, and chocolate aroma by BW. Survival analysis indicated that BW could be added up to a maximum of 84.15%, while no rejection was detected for RW and CW. Based on results, RW, CW, and BW represent potential milk replacers to be used by the dairy industry, decreasing the environmental impact of these dairy by-products.

1. Introduction

Ice cream is one of the most popular desserts worldwide, and its global consumption is about 2 L per person per year [1]. This dairy dessert is a physicochemical complex containing air bubbles, which are dispersed in the continuous phase and have a structure and a texture generated and affected by freezing, usually linked to the type and quantity of ingredients [2]. Furthermore, cow milk is the main ingredient used for the production of commonly consumed ice cream and, therefore, it has a large number of high-quality nutrients (e.g., protein, vitamins and minerals) to human health; however, milk lipids have been associated to increased cholesterol levels in the blood [1,3].
On the other hand, dairy by-products like whey from cheese, ricotta, and butter productions, represent about 80% of the whole milk used in the dairy industry’s manufacturing process [3,4]. The effective treatments to properly discard these wheys without a negative environmental impact represent high costs for dairy industries, and their use in animal feed has several inherent limitations [5,6]. Moreover, these dairy wheys are low-cost raw materials, have low fat, and excellent technological and functional properties, including bioactive compounds that are beneficial to human health [7,8,9,10,11]. Therefore, the dairy industry has been interested in novel strategies for application of these valuable ingredients to produce healthier, lower cost, and sustainable dairy products, and ice cream could be a potential vehicle for dairy by-products reuse. Nevertheless, the use of whey may lead to adverse sensory quality changes in conventional dairy products depending mainly on the type of dairy whey, ingredient ratios, and processing conditions, including the product flavor, which represents the main limitation to the current industrial application of dairy by-products in ice creams [1,7,8,9,11,12]. Many studies have been evaluated the effect of whole milk replacement by ricotta whey [9,13,14], butter whey [15], and whole cheese whey [16,17] in different dairy products. Nevertheless, this ice cream approach is scarce, and the consumer perception about chocolate ice cream manufactured with ricotta whey, cheese whey, and butter whey is still unknown, which is vital to encourage the healthy and sustainable market of dairy products attending the current economic and consumer demands.
In this context, this study aimed to investigate the effect of the total and partial substitution of whole milk by different dairy by-products (ricotta whey, cheese whey, and butter whey) at different ratios on sensory characteristics of chocolate ice cream toward three aspects: (i) To evaluate the sensory liking attributes of chocolate ice cream; (ii) to provide insights related to product improvement through JAR and penalty analysis; and (iii) to determine the maximum level of milk replacement by each dairy by-product without adverse sensory effects using survival analysis by a Weibull model.

2. Materials and Methods

2.1. Dairy By-Product Samples

Five liters of each ricotta whey (RW), cheese whey (CW), and butter whey (BW) were obtained from ricotta, rennet cheese, and butter production, respectively, of an agro-industry located at Instituto Federal de Alagoas, Brazil. The samples were placed into 1 L plastic bottles, frozen (−18 °C) into single thermal styrofoam boxes with ice and transported to the laboratory within 12 h.

2.2. Ice Cream Production

Table 1 summarizes all ice cream formulations developed in this study. Each dairy by-product (RW, CW, and BW) was combined with whole milk (WM) at different ratios (0:100%, 25:75%, 50:50%, 75:25%, and 100:0%, w/w). The other ingredients used in the ice cream production (Table 1) and commercial ice cream (Kibon®, Rio de Janeiro, RJ, Brazil) were purchased from a local market in Rio de Janeiro, Brazil. All ingredients were homogenized, pasteurized (80 °C for 30 s), matured (kept on 4 °C for 12 h), and placed in the ice cream maker (Cuisinart® ICE-100, Stamford, CT, USA) from 30 to 40 min to reach consistency [18]. After that, samples were placed in plastic cups (30 mL) and stored at −18 °C until further analysis.

2.3. Bacteriological Analysis

Staphylococcus aureus, thermotolerant coliforms at 45 °C, and Salmonella spp. were determined as described by APHA [19] to verify sanitary conditions during ice cream manufacturing and ensure safe products for sensory evaluation following limits established by national and international agencies [20,21]. Triplicate results were obtained from each treatment.

2.4. Sensory Analysis

This study was approved by the Research Ethics Committee of Clementino Fraga Filho University Hospital at Federal University of Rio de Janeiro (UFRJ), Brazil (protocol number 77418117.7.0000.5257). Besides, participants signed an informed consent form before sensory analysis, and a small gift for their participation was given.

2.4.1. Participants

According to their interest and availability in participating in the study, consumers (n = 300) were randomly recruited in person among workers, visitors, and students at the Universidade Federal do Rio de Janeiro (Rio de Janeiro, Brazil) in May 2019. Together with each ice cream sample, provided as described in Section 2.4.2, consumers received a questionnaire to rate their acceptance degree and the intensity of specific attributes and to answer (“yes” or “no”) if they would consume the ice cream conforming detailed in Section 2.4.3, Section 2.4.4, Section 2.4.5, respectively. In the end, participants were asked to answer a socio-demographic questionnaire. Based on socio-demographic questions, 54% of the consumers were women, 45% men, and 1% of another gender. Concerning age, 79% of the participants were between 18 and 25 years old, 17% between 26 to 35 years old, and only 4% 36 years old or older. The majority of the consumers had incomplete graduation (72%) followed by post-graduate (18%), complete undergraduate (5%), complete graduate (4%), and incomplete high school (1%). Based on Brazilian monthly minimum wage (BMW; $ 205 in 2020), 37% of the participants had a household income between 1 and 5 BMW, 35% between 5 and 10 BMW, 20% between 10 and 20 BMW, and 8% between 20 and 30 or more than 30 BMW. Regarding ice cream consumption frequency, most consumers (70%) frequently consumed ice cream, while 30% rarely consumed ice cream.

2.4.2. Experimental Procedure

The sensory evaluation was divided into three different trials according to dairy by-product evaluation (1—formulations at different RW/WM ratios, 2—formulations at different CW/WM ratios, and 3—formulations at different BW/WM ratios). In each trial, ice cream formulations were labeled randomly with a 3-digit code and were presented individually to each participant (n = 100) in isolated booths following a balanced presentation order. The samples were served in 30 mL plastic cups removed from the freezer at the moment of presentation to consumers. A commercial brand sample with a high market share was also presented for comparison purposes with the ice cream developed in this study in all trials. Additionally, unsalted crackers and water at room temperature were provided for panelists to clean and rinse their palate between samples.

2.4.3. Consumer Acceptance Testing

Participants rated the acceptance degree for appearance, aroma, flavor, texture, and overall liking of the ice creams in a 7-point category hedonic scale (7—like very much; 4—neither like nor dislike; 1—dislike very much) [22,23]. Moreover, they indicated their purchase intention through a 5-point category hedonic scale (5—certainly would buy; 3—I might buy it/I might not buy it; 1—certainly would not buy) [24]. These analyses were carried out to verify the degree of acceptability and purchase intention of each ice cream formulation.

2.4.4. Just-about-Right (JAR) Analysis

JAR scale was used to verify the intensity of the sensory attributes (color, aroma, flavor, sweetness, texture, and melting) after adding different proportions of RW, CW, and BW in chocolate ice creams. Participants scored the JAR attributes on a 7-point JAR scale (1—extremely little; 5—just about right; 7—extremely much) according to Cervantes et al. [25] and Palazzo and Bolini [26].

2.4.5. Survival-Analysis

Participants were asked to try the sample and to answer “yes” or “no” to the following question: “Suppose that you bought this product to eat or that it was served to you in your home. Would you consume it?” This analysis was used to identify the acceptability limit through a mathematical function of product rejection generated by consumer responses concerning different substitution levels of each dairy whey by whole milk in chocolate ice creams. In other words, the survival-analysis method was used to estimate the maximum replacement level of each RW, CW, and BW by WM without detrimental effects on the overall liking of the ice creams toward the consumer perspective [27].

2.5. Statistical Analyses

One-way ANOVA at 95% of confidence level was used to compare the mean values of the hedonic and JAR scores between the ice cream formulations within the same dairy by-product (RW, CW, or BW). Data were further analyzed using the Tukey test when means were considered different (p < 0.05). The answer was categorized as 0 (no), and 1 (yes), and survival-analysis statistics were applied to determine the maximum replacement of different wheys in chocolate ice cream. The best data fit was obtained by applying a parametric survival regression model based on the Weibull distribution, using a 50% rejection level [28]. The frequency of each response was used to evaluate the socio-demographic data. Principal components analysis (PCA) was performed to characterize each ice cream formulation and to identify which attributes were influenced by different whey ratios, while partial least square regression (PLSR) was carried out to indicate which of these attributes contributed positively or negatively to the overall liking of the ice cream formulations within the same dairy by-product (RW, CW, or BW). Parameters with variable important in projection (VIP) score greater than 1.0 were considered relevant to overall liking [29]. Moreover, penalty analysis was applied to JAR data to verify the penalized attributes in each formulation and propose alternatives to improve the sensory quality of chocolate ice creams incremented with RW, CW, and BW. The penalized attributes were those with >0.5 penalty score and >20% occurrence. All statistical analyses were carried out using XLSTAT software, version 2018.6 (Boston, MA, USA).

3. Results and Discussion

3.1. Bacteriological Analysis

All formulations complied with the limits recommended by national and international agencies [20,21], indicating an adequate bacteriological quality of the chocolate ice creams for consumption. Similar findings were found for ice creams produced with whey in replacement to milk [30,31].

3.2. Consumer Acceptance

Most of the ice cream formulations, including the commercial sample and the developed formulation without the presence of dairy by-products (100WM), received scores between 4 (neither like/nor dislike) and 5 (slightly like) for overall liking, which corresponds to acceptance region, while purchase intention was scored in around 3 (might buy it/might not buy it) indicating an indifferent region (Table 2).
All ice cream formulations showed similar scores (p > 0.05) of aroma, flavor, texture, overall liking, and purchase intention for cheese whey. In the appearance attribute, the commercial sample showed a higher score (p < 0.05) compared to 100WM, 25CW, and 50CW, however, no difference (p < 0.05) was observed between the commercial sample and ice creams developed with high CW ratios (75CW and 100CW). Regarding butter whey, the commercial sample, 100WM, 25BW, and 50BW received higher scores (p < 0.05) for aroma and flavor than the 100BW sample. No difference (p > 0.05) in the aroma was found between 75BW and the other ice cream formulations. Moreover, 75BW, 50BW, and 100BW demonstrated similar (p < 0.05) flavor. The lowest appearance and texture scores (p < 0.05) were for 50BW, which showed a difference (p < 0.05) only for 100BW and the commercial sample. For the overall liking, the commercial sample, 100WM and 25BW presented similar scores (p < 0.05), while 75BW and 100BW showed lower (p < 0.05) overall liking than 25BW, 100WM, and the commercial sample. No difference (p > 0.05) in the purchase intention was found between ice cream formulations at different BW ratios (25BW, 50BW, 75BW, and 100BW), while the commercial sample 100WM and 25BW had similar (p > 0.05) purchase intention score, which were higher (p < 0.05) than 100BW.
The adverse sensory perceptions and consumer rejection represent the main limitation of using wheys in food [10,32]. These adverse effects on sensory proprieties depend mainly on the type of dairy whey, ingredient ratios, and processing conditions, including the product flavor [1,7,8,9,11,12] and, therefore, the results from the literature are highly variable. Additionally, there is a lack of sensory studies evaluating the acceptance of ice creams with different RW, CW, and BW levels and, therefore, our findings were also compared with results in dairy products. In agreement with our results, Cortellino and Rizzolo [9] observed that the addition of 30% ricotta cheese whey did not affect the aroma and overall liking of apple juice. Meneses et al. [33] concluded that ricotta and cheese wheys ranging from 25% to 75% did not affect the ice creams’ overall liking. On the other hand, Sakhale et al. [16] evaluated dairy beverages developed with cheese whey and mango juice at different ratios (70:30, 75:25, and 80:20) and reported a decrease in flavor and overall liking by the increase of cheese whey. Prindiville et al. [34] observed that flavor was not influenced, while creaminess and hardness were decreased in ice cream made of 100% protein-based whey (Simplesse®, Atlanta, GA, USA) in replacement to milk. Castro et al. [17] observed that the addition of 35% cheese whey did not affect the overall liking of strawberry probiotic dairy drinks. However, overall liking was decreased with cheese whey equally or above 50%.

3.3. Just-About-Right (JAR) and Penalty Analysis

JAR data (Table 3) were submitted to penalty analysis (Table 4) to identify the sensory parameters that can be improved to increase consumer acceptability. Attributes with >0.5 penalty score and >20% occurrence were considered detrimental to overall liking.
For ice creams developed with RW, 50RW, and 75RW exhibited lower penalties than other ice creams formulations. Both 50RW and 75RW were penalized as too little creaminess and too little melting velocity, respectively. However, 75RW demonstrated similar JAR (p > 0.05) for melting velocity compared to the commercial sample and 100WM. Consumers penalized 100WM, 25RW, and 100RW for too little chocolate color and too much sweetness. The 100RW was also penalized for too much chocolate flavor and too little creaminess. Although these penalties, no difference (p > 0.05) was observed between the creaminess and sweetness among all ice cream formulations. Regarding chocolate color, 25RW showed lower JAR (p < 0.05) while 100RW had similar JAR (p > 0.05) compared to the commercial sample. Moreover, consumers penalized the commercial sample and 100WM for too little chocolate flavor, while 100RW was penalized for too much chocolate flavor. Therefore, it is suggested that the addition of RW can increase chocolate flavor perception.
The 100CW was penalized for too little chocolate aroma, too little creaminess, too little melting velocity, too much chocolate flavor, and too much sweetness. Despite some penalties, no difference (p < 0.05) in JAR was observed for chocolate aroma among all ice cream formulations. For the chocolate flavor, sweetness and creaminess, 100CW presented similar JAR (p > 0.05), while a lower JAR (p < 0.05) for melting velocity than 100WM. On the other hand, 100CW presented higher JAR (p < 0.05) for chocolate flavor and sweetness and lower JAR (p < 0.05) for creaminess and melting velocity compared to the commercial sample. Furthermore, consumers penalized 100WM and 100CW for too little chocolate aroma and too little creaminess. However, 50CW and 75CW were not penalized for these attributes. Moreover, too little chocolate color was only attributed to 100WM. Therefore, our findings indicate that the addition of 50CW and 75CW can increase chocolate aroma and creaminess perception, while the chocolate color perception may be increased by the inclusion of 25CW, 50CW, and 75CW.
Ice creams developed with BW, 75BW exhibited lower penalties compared to other ice cream formulations. 75BW was penalized for too much chocolate flavor and had higher JAR (p < 0.05) for this attribute than the commercial and 100WM samples. Consumers penalized 100WM, 25BW, 50BW, and 100BW for too little creaminess and too much sweetness. The 100WM was penalized for too little chocolate flavor, while 25BW, 50BW, and 100BW for too much chocolate flavor. 50BW, 75BW, and 100BW presented higher (p < 0.05) JAR for chocolate flavor than 100WM, suggesting that the addition of BW may increase chocolate flavor perception. For creaminess, 100BW had higher JAR (p < 0.05) than 100WM, 25BW, and 50BW. No difference (p > 0.05) was observed in sweetness between 100WM, 25BW, 50BW, and 100BW. 100WM, 25BW, and 50BW were penalized for too little chocolate aroma, and 100WM and 25BW were also penalized for too little chocolate color. However, 75BW and 100BW were not penalized for chocolate aroma and chocolate color, indicating that these BW ratios may increase these attributes’ perception. In the JAR analysis, no difference (p > 0.05) was observed in chocolate aroma between 100WM and other ice cream formulations containing BW, 25BW, 50BW, 75BW, and 100BW demonstrated higher JAR (p < 0.05) for color than 100WM. Slow melting velocity was only attributed to the commercial and 100BW samples; however, all ice cream formulations showed similar JAR (p > 0.05) for this attribute.
Only one study applied JAR analysis in ice cream manufactured with partial or total milk replacement by RW, CW, and BW in the literature. Therefore, our results were also compared to other dairy products. Meneses et al. [33] observed that the replacement of ricotta whey (25–100%) by whole milk did not influence the JAR attributes regarding cream color, cream aroma, cream flavor, sweetness, and creaminess of cream ice creams; however, at 75% and 100% it decreased the melting velocity perception. Moreover, these same authors reported that 100% of whole milk’s replacement by 100% cheese whey only resulted in higher JAR for cream color and sweetness, while butter whey ranging from 25% to 100% led to higher JAR for cream aroma and cream flavor. El-Zeini et al. [35] observed that 4% whey protein isolate in replacement to skimmed milk decreased ice cream’s melting velocity. Silveira et al. [36] found an increased perception of chocolate flavor by adding 15% and 45% cheese whey in the dairy beverage. Crippen and Jeon [37] reported that athletic drinks manufactured with cottage cheese whey at 66.67% had higher JAR for sweetness and orange flavor than their control counterparts.

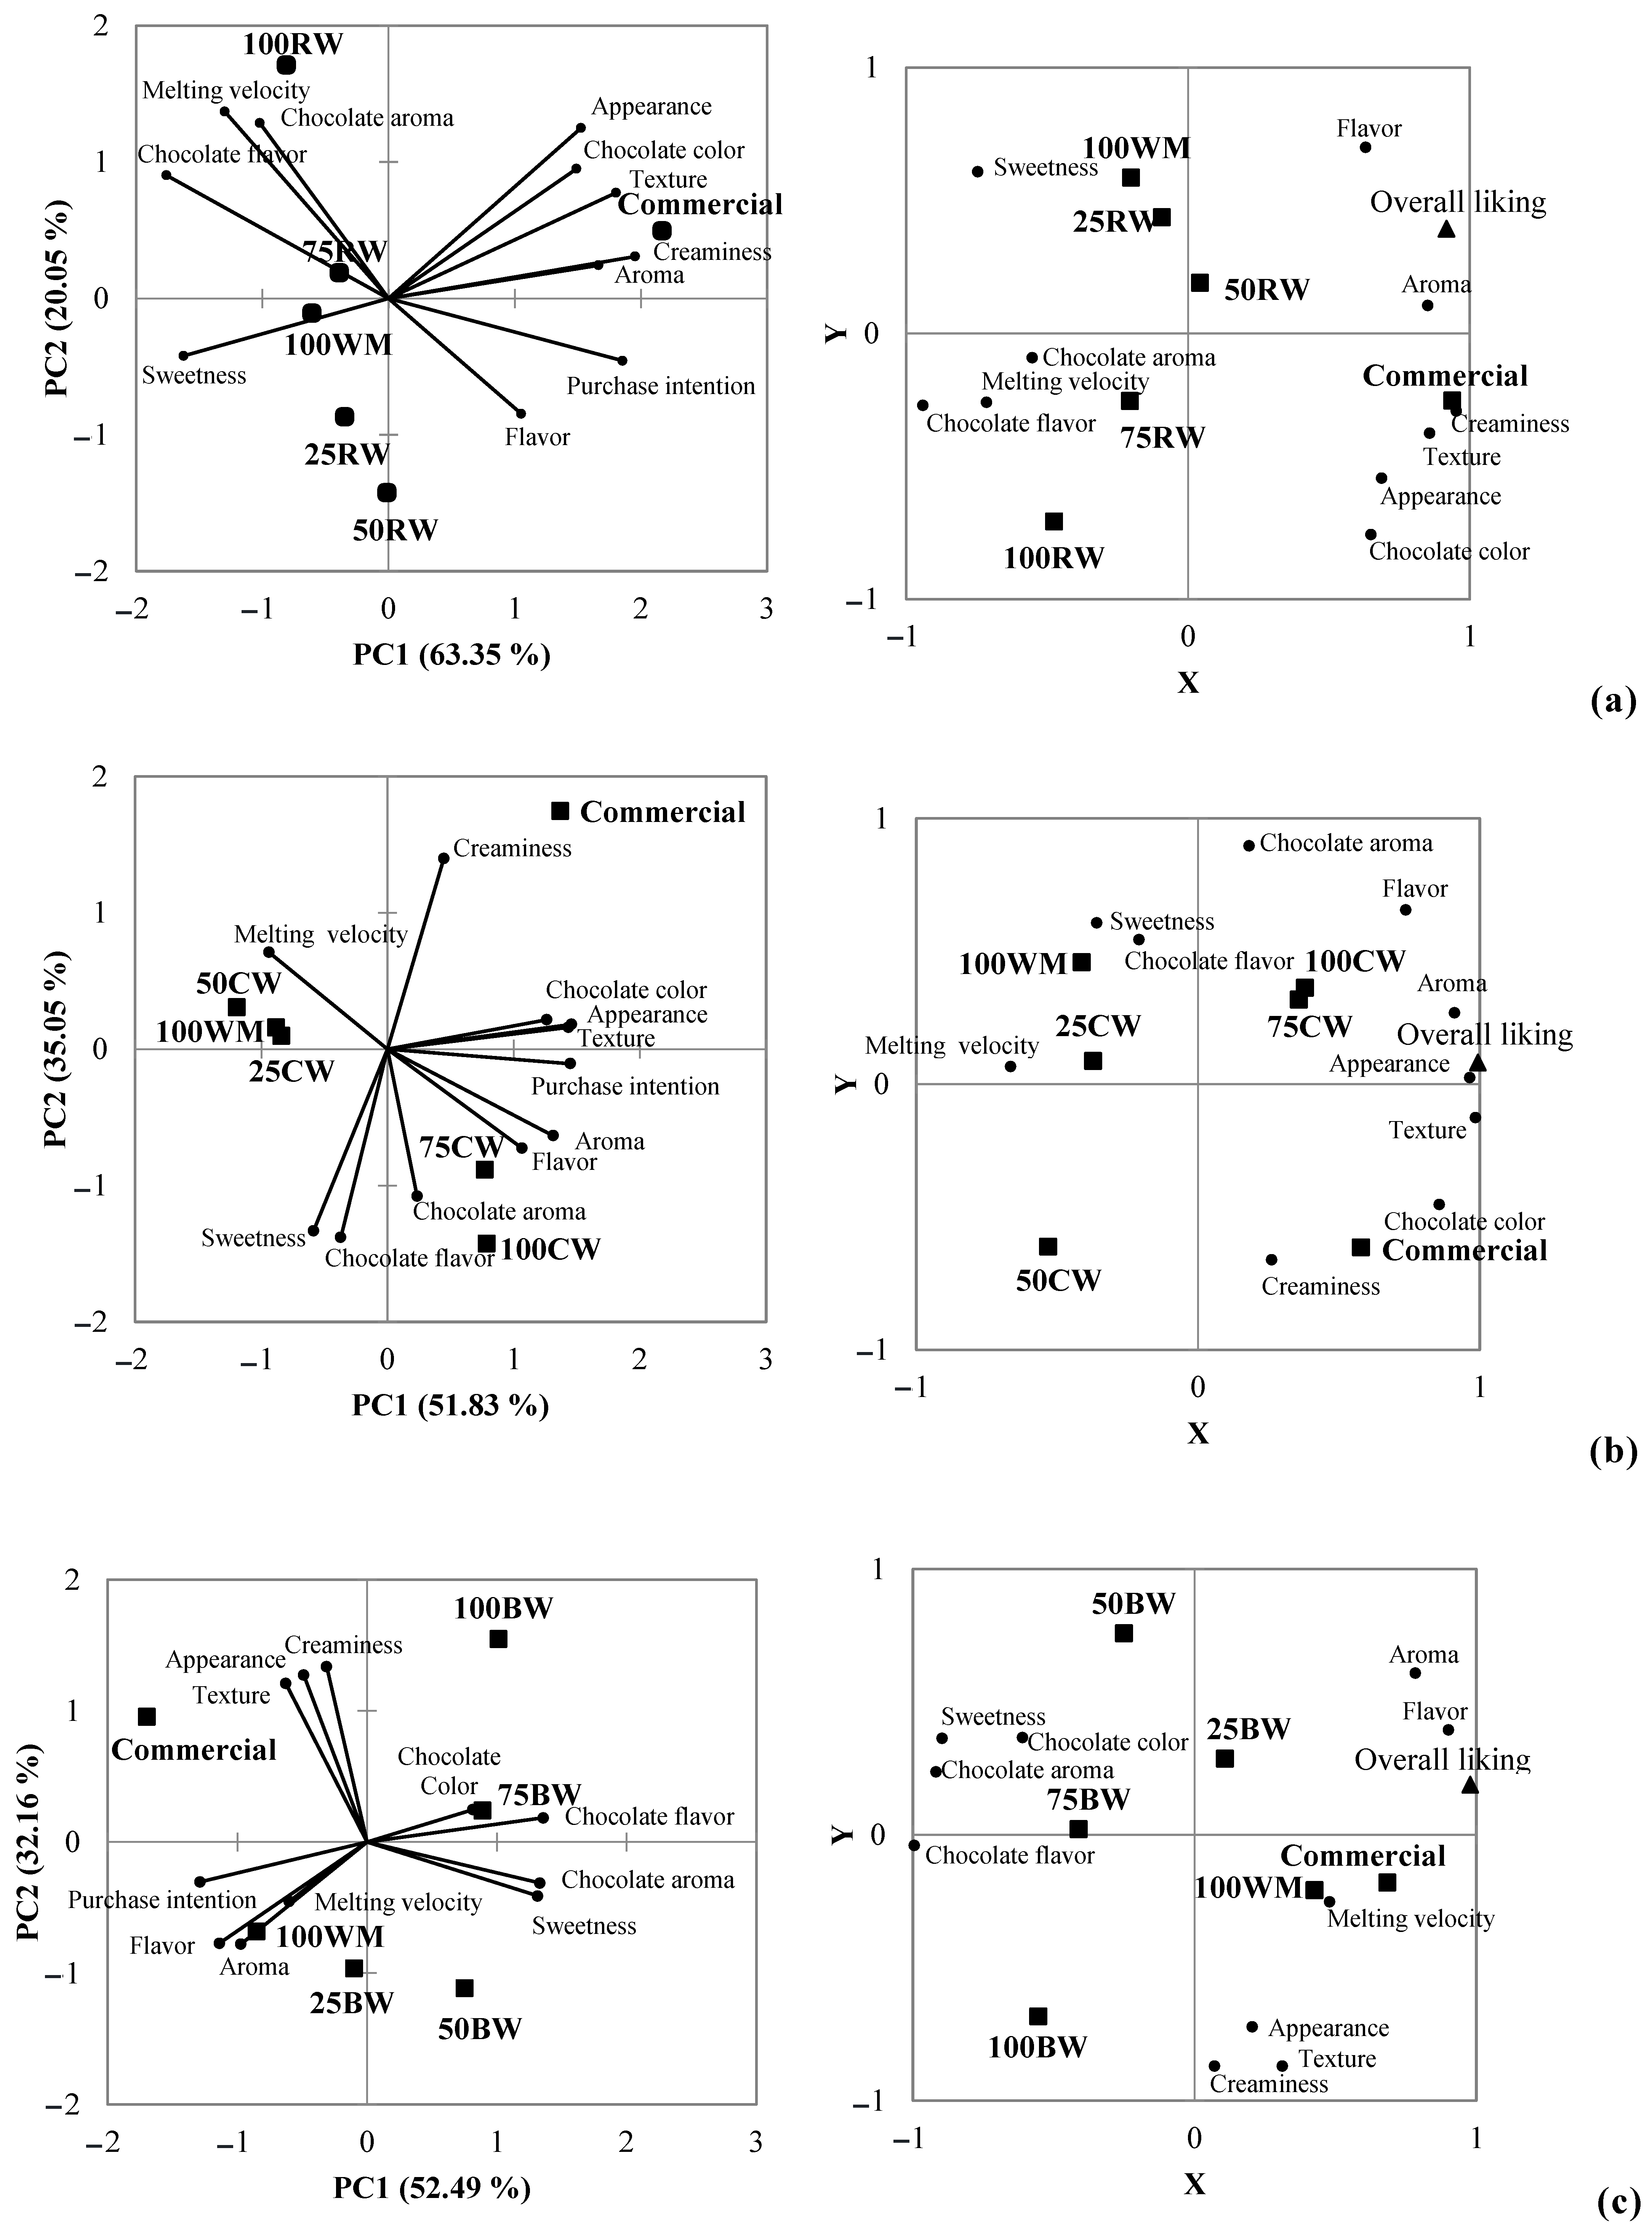
3.4. Principal Component Analysis and Partial Least Square Regression (PLSR)

The principal component analysis (PCA) separated all the different ice creams based on the sensory parameters of acceptance (appearance, aroma, flavor, and texture), purchase intention, and JAR attributes. Partial least square regression (PLSR) indicated which of these attributes influenced positively or negatively the overall liking (VIP score greater than 1.0) [29].
PCA explained 83.40% of total data variance for RW ice creams (Figure 1a—left). Chocolate ice cream formulations were divided into three groups (commercial; 100WM, 25RW, and 50RW; 75RW and 100RW) by principal component 1 (PC1) and principal component 2 (PC2). A higher melting velocity, chocolate flavor, and chocolate aroma characterized 75RW and 100RW ice creams. 100WM, 25RW, and 50RW were identified mainly by higher sweetness, and the commercial sample by aroma, appearance, and texture with higher chocolate color and creaminess. Concerning PLSR, it explained 99.70% of overall consumer liking (Y-axis) and 80.30% of the consumers’ sensory scores (acceptance and JAR) (X-axis), yielding an accumulated Q2 of 0.916 for ice creams developed with RW. Flavor, aroma, and creaminess contributed positively to the overall liking, whereas chocolate flavor and melting velocity were detrimental to the overall liking (Figure 1a—right). Based on the classification from PCA and PLSR associated with hedonic scores and penalty analysis, the main adverse effects of RW’s addition in the overall liking of ice cream was the increase of chocolate flavor and melting velocity, which were related to 75RW and 100RW formulations. The faster melting velocity at the higher RW levels may be associated with the lower fat content of this dairy by-product (0.02%) compared to whole milk (3.15%) [9,38]. The fat plays a significant role in determining the melting rate of the ice cream. It is also responsible for increasing the resistance to this phenomenon, considering that part of the globules surrounding the air bubbles stabilizes the system [39,40].
For the CW ice creams (Figure 1b—left), PCA explained 86.88% of the data’s total variance. PC1 and PC2 divided the chocolate ice cream formulations into three groups (commercial; 100WM, 25CW, and 50CW; 75CW and 100CW). Ice creams with 75CW and 100CW were identified by a higher aroma (chocolate aroma) and flavor (sweetness and chocolate flavor). 100WM, 25CW, and 50CW were characterized by a higher melting velocity, and commercial by a higher creaminess, appearance, texture, and chocolate color. Considering the samples with CW, the PLSR model explained 99.50% of overall consumer liking (Y-axis) and 73.60% of the consumers’ sensory scores (acceptance and JAR) (X-axis), yielding an accumulated Q2 of 0.843. Texture, appearance, aroma, chocolate color, and flavor were determinants to increase the overall liking, and no sensory attributes contributed negatively to the overall liking of CW ice cream formulations (Figure 1b—right).
Moreover, there was no difference in the overall liking between the formulations. Therefore, the use of CW in chocolate ice cream seems to be a feasible alternative to dairy industries. However, it is worth highlighting that ice cream formation at 100% CW was penalized by too much chocolate flavor and too much sweetness, which could represent limiting factors for their use.
Concerning the BW ice creams, PCA explained 84.65% of the total data variance (Figure 1c—left). PC1 and PC2 divided the chocolate ice cream formulations in four groups (commercial; 50BW; 100WM and 25BW; 75BW and 100BW). 75BW and 100BW were identified by a stronger chocolate flavor and chocolate color, while 50BW by greater chocolate aroma and sweetness. The commercial sample was characterized by a greater appearance, texture, and creaminess. 25BW and 100WM were identified by a greater purchase intention, flavor, aroma, and melting velocity.
Regarding ice creams developed with BW, the PLSR model explained 99.40% of overall consumer liking (Y-axis) and 77.60% of the consumers’ sensory scores (acceptance and JAR) (X-axis), yielding an accumulated Q2 of 0.905. Flavor and aroma contributed positively to the overall liking; however, chocolate flavor, chocolate aroma, and sweetness were detrimental to the overall liking (Figure 1c—right). The hedonic scores and penalty analysis correlated with PCA and PLSR data indicated that the main adverse effects on the overall liking by BW addition of ice cream were the chocolate flavor, chocolate aroma, and sweetness. It was related to 50BW, 75BW, and 100BW formulations.
The increase of chocolate flavor, sweetness, and/or chocolate aroma by the addition of high levels of RW (75% and 100%), CW (100%) and BW (50%, 75%, and 100%) may be attributed to a higher moisture content of these dairy by-products compared to whole milk. While whole milk has 84.80% of moisture, RW, CW, and BW contain 94.47%, 93.53%, and 91.36%, respectively [38]. Higher moisture content results in more solubilization of the ice cream ingredients, consequently increasing the perception of flavor, aroma, and sweetness depending on the level and type of each dairy by-product, which determine the specific interactions with the other food ingredients [7,8,9].
Similarly, Silveira et al. [36] reported an increased perception of flavor in chocolate dairy beverages by adding 15% and 45% cheese whey. Janiaski et al. [41] observed a higher consumer perception of artificial strawberry flavor in yogurts made with whey protein concentrate than those without whey protein concentrate. Meneses et al. [33] reported an increase in the perception of sweetness and cream flavor by adding high levels of CW (100%) and BW (50%, 75% and 100%), respectively, in replacement to whole milk in cream ice cream formulations.

3.5. Survival-Analysis

A consumer rejection probability of 50% at a 5% significance level [28] was chosen to determine the maximum milk replacement by each dairy by-product without adverse sensory effects (Figure 2). Weibull model revealed that BW could be added up to a maximum of 84.15% without compromising the chocolate ice cream’s overall liking. No rejection was detected for RW and CW at different ratios, considering the consumer rejection probability used in this study. Thus, the survival analysis indicates that these three dairy by-products are potential ingredients for chocolate ice cream formulations. Survival analysis is more often used to estimate the shelf life of products, and their application to identify the optimal ingredient level to be added in dairy products is scarce. As no studies have evaluated different levels of RW, CW, and BW in ice cream by survival analysis, our findings were compared to other dairy products. Considering 50% consumer rejection probability, Castro et al. [17] reported a maximum level of 49% cheese whey into probiotic dairy beverages.

4. Conclusions

Based on the different sensory methodologies and statistical tools used in this study, the addition of certain RW, CW, and BW levels decreased some quality attributes of chocolate ice creams, which could represent limiting factors for using these dairy by-products. RW at 75% and 100% in replacement to WM compromised the overall liking by increasing the chocolate flavor and melting velocity. Otherwise, the overall liking was not affected by any CW level; however, chocolate ice cream formulations containing 100% CW were penalized for their strongest chocolate flavor and sweetness. Concerning BW, the replacement of WM by BW from 50% to 100% enhanced chocolate flavor, chocolate aroma, and sweetness, which contributed to the lowest overall liking. Considering no impact on overall liking, RW, CW, and BW may replace milk in chocolate ice cream up to 50%, 75%, and 25%, respectively, and at these levels could be used at an industrial scale representing an attractive alternative in health, economic, and sustainable terms for dairy industries. Nevertheless, further studies should focus on technological alternatives (e.g., inulin) to minimize the adverse effects on flavor, aroma, and sweetness in chocolate ice cream promoted mainly by BW addition, which would allow their use in a more generous amount.

Author Contributions

Conceptualization, R.B.d.M. and M.H.M.d.R.-L.; methodology, R.B.d.M., M.L.G.M. and C.A.C.-J.; formal analysis, R.B.d.M. and F.F.d.S.; investigation, R.B.d.M., M.L.G.M., F.F.d.S., and C.A.C.-J.; writing—original draft preparation, R.B.d.M.; writing—review and editing R.B.d.M., M.L.G.M., C.A.C.-J., and M.H.M.d.R.-L. All authors have read and agreed to the published version of the manuscript.

Funding

The authors are thankful for the financial support provided by the Fundação Carlos Chagas Filho de Amparo à Pesquisa do Estado do Rio de Janeiro (FAPERJ), grant number E‐ 26/010.001911/2015 and 313119/2020-1, and the Conselho Nacional de Desenvolvimento Científico e Tecnológico (CNPq), grant numbers 311422/2016-0 and 406777/2018-7.

Institutional Review Board Statement

The study was conducted according to the guidelines of the Declaration of Helsinki, and approved by the Institutional Ethics Committee Clementino Fraga Filho University Hospital (protocol number 77418117.7.0000.5257, 9 December 2017).

Informed Consent Statement

Informed consent was obtained from all subjects involved in the study.

Data Availability Statement

Not applicable.

Acknowledgments

The authors are grateful to the Federal Institute of Alagoas (IFAL), campus Satuba, which donated the dairy by-products and the Federal University of Bahia (UFBA) and Federal University of Rio de Janeiro (UFRJ) that provided the ideal infrastructure for the analyses.

Conflicts of Interest

The author declares no conflict of interest.

References

  1. Agrawal, A.K. Effect of variation of ginger juice on some physical and sensory properties of ice cream. Indian J. Dairy Sci. 2016, 69, 17–23. [Google Scholar] [CrossRef]
  2. Euroglaces—European Ice Cream Association. Available online: http://www.euroglaces.eu/en/ (accessed on 15 November 2020).
  3. FAO. Milk and Dairy Products in Human Nutrition; Food and Agriculture Organization of the United Nations: Rome, Italy, 2013. [Google Scholar]
  4. Panesar, P.S.; Kennedy, J.F. Biotechnological approaches for the value addition of whey. Crit. Rev. Biotechnol. 2012, 32, 327–348. [Google Scholar] [CrossRef]
  5. Parashar, A.; Jin, Y.; Mason, B.; Chae, M.; Bressler, D.C. Incorporation of whey permeate, a dairy effluent, in ethanol fermentation to provide a zero waste solution for the dairy industry. J. Dairy Sci. 2016, 99, 1859–1867. [Google Scholar] [CrossRef] [Green Version]
  6. Kushwaha, J.P.; Srivastava, V.C.; Mall, I.D. An overview of various technologies for the treatment of dairy wastewaters. Crit. Rev. Food. Sci. Nutr. 2011, 51, 442–452. [Google Scholar] [CrossRef]
  7. Morin, P.; Pouliot, Y.; Jiménez-Flores, R. A comparative study of the fractionation of regular buttermilk and whey buttermilk by microfiltration. J. Food Eng. 2006, 77, 521–528. [Google Scholar] [CrossRef] [Green Version]
  8. Bald, J.A.; Vincenzi, A.; Gennari, A.; Lehn, D.N.; de Souza, C.F.V. Características físico-químicas de soros de queijo e ricota produzidos no Vale do Taquari, RS. Rev. Jovens Pesq. 2014, 4, 90–99. [Google Scholar] [CrossRef] [Green Version]
  9. Cortellino, G.; Rizzolo, A. Storage stability of novel functional drinks based on ricotta cheese whey and fruit juices. Beverages 2018, 4, 67. [Google Scholar] [CrossRef] [Green Version]
  10. Martins, Z.E.; Pinho, O.; Ferreira, I.M.P.L.V.O. Food industry by-products used as functional ingredients of bakery products. Trends Food Sci. Technol. 2017, 67, 106–128. [Google Scholar] [CrossRef]
  11. Parrón, J.A.; Ripollés, D.; Navarro, F.; Ramos, S.J.; Pérez, M.D.; Calvo, M.; Sánchez, L. Effect of high pressure treatment on the antirotaviral activity of bovine and ovine dairy by-products and bioactive milk proteins. Innov. Food Sci. Emerg. Technol. 2018, 48, 265–273. [Google Scholar] [CrossRef]
  12. Haque, Z.U.; Ji, T. Cheddar whey processing and source: II. Effect on non-fat ice cream and yoghurt. Int. J. Food Sci. Technol. 2003, 38, 463–473. [Google Scholar] [CrossRef]
  13. Rodríguez, T.; M’Boumba, A. Utilización del suero de queso en helado. RVCTA 2011, 21, 9–12. [Google Scholar]
  14. Gerhardt, Â.; Monteiro, B.W.; Gennari, A.; Lehn, D.N.; de Souza, C.F.V. Características físico-químicas e sensoriais de bebidas lácteas fermentadas utilizando soro de ricota e colágeno hidrolisado. Rev. Ilct. 2013, 68, 41–50. [Google Scholar] [CrossRef]
  15. Hickey, C.D.; O’Sullivan, M.G.; Davis, J.; Scholz, D.; Kilcawley, K.N.; Wilkinson, M.G.; Sheehan, J.J. The effect of buttermilk or buttermilk powder addition on functionality, textural, sensory and volatile characteristics of Cheddar-style cheese. Food Res. Int. 2018, 103, 468–477. [Google Scholar] [CrossRef] [PubMed] [Green Version]
  16. Sakhale, B.K.; Pawar, V.N.; Ranveer, R.C. Studies on the development and storage of whey based RTS beverage from mango cv. Kesar. J. Food Process. Technol. 2012, 3, 1–4. [Google Scholar] [CrossRef] [Green Version]
  17. Castro, W.F.; Cruz, A.G.; Bisinotto, M.S.; Guerreiro, L.M.R.; Faria, J.A.F.; Bolini, H.M.A.; Cunha, R.L.; Deliza, R. Development of probiotic dairy beverages: Rheological properties and application of mathematical models in sensory evaluation. J. Dairy Sci. 2013, 96, 16–25. [Google Scholar] [CrossRef] [Green Version]
  18. Ozdemir, C.; Arslaner, A.; Ozdemir, S.; Allahyari, M. The production of ice cream using stevia as a sweetener. J. Food Sci. Technol. 2015, 52, 7545–7548. [Google Scholar] [CrossRef]
  19. American Public Health Association (APHA). Compendium of Methods for the Microbiological Examination of Foods, 4th ed.; APHA: Washington, DC, USA, 2001. [Google Scholar]
  20. ANVISA—Agência Nacional de Vigilância Sanitária. Regulamento Técnico Sobre os Padrões Microbiológicos para Alimentos (Resolução nº 12, de 02 de Janeiro de 2001). Available online: http://portal.anvisa.gov.br/documents/33880/2568070/RDC_12_2001.pdf/15ffddf6-3767-4527-bfac-740a0400829b (accessed on 5 November 2020).
  21. World Health Organization (WHO). Microbiological Criteria for Foods: Summary of Recommendations of FAO/OMS; WHO: Geneva, Switzerland, 1983. [Google Scholar]
  22. Dornelles, A.S.; Rodrigues, S.; Garruti, D.S. Acceptance and sensory profile of cachaça produced using Kefir and Saccharomyces cerevisae. J. Food Sci. Technol. 2009, 29, 518–522. [Google Scholar] [CrossRef] [Green Version]
  23. Stone, H.; Sidel, J.L. Quantitative descriptive analysis: Developments, applications, and the future. Food Technol. 1998, 52, 48–52. [Google Scholar]
  24. Lawless, H.T.; Heymann, H. Sensory Evaluation of Food: Principles and Practices, 2nd ed.; Springer: New York, NY, USA, 2010; pp. 1–56. [Google Scholar]
  25. Cervantes, B.G.; Aoki, N.A.; Almeida, C.P.M. Sensory acceptance of fermented cassava starch biscuit prepared with flour okara and data analysis with penalty analysis methodology. Braz. J. Food Technol. 2010, 19, 3–10. [Google Scholar] [CrossRef]
  26. Palazzo, A.B.; Bolini, H.M.A. Sweeteners in diet chocolate ice cream: Penalty analysis and acceptance evaluation. J. Food Stud. 2017, 6, 1–13. [Google Scholar] [CrossRef] [Green Version]
  27. Hough, G.; Garitta, L. Methodology for sensory shelf-life estimation: A review. J. Sens. Stud. 2012, 27, 137–147. [Google Scholar] [CrossRef]
  28. Hough, G. Sensory Shelf Life Estimation of Food Products, 1st ed.; CRC Press: Boca Raton, FL, USA, 2010; pp. 83–111. [Google Scholar]
  29. Wold, S.; Sjostrom, M.; Eriksson, L. PLS-regression: A basic tool of chemometrics. Chemom. Intell. Lab. Syst. 2001, 58, 109–130. [Google Scholar] [CrossRef]
  30. Pereira, C.; Andrejewski, A.; Mattana, A.; Schmidt, C.A.P.; Barreto, P.L.M.; Sant Ánna, E.S. Processing and microbiological characterization of diet strawberry ice cream with addition of whey protein concentrate, whole milk powder and sweeteners. Int. J. Nutr. Food Sci. 2014, 3, 97–103. [Google Scholar] [CrossRef] [Green Version]
  31. Tsuchiya, A.C.; Silva, A.G.M.; Brandt, D.; Kalschne, D.L.; Drunkler, D.A.; Colla, E. Lactose-reduced ice cream enriched with whey powder. Semin. Ciências Agrárias 2017, 38, 749–758. [Google Scholar] [CrossRef]
  32. Foegeding, E.A.; Çakır, E.; Koç, H. Using dairy ingredients to alter texture of foods: Implications based on oral processing considerations. Int. Dairy J. 2010, 20, 562–570. [Google Scholar] [CrossRef]
  33. Meneses, R.B.; Silva, M.S.; Monteiro, M.L.G.; Rocha-Leão, M.H.M.; Conte-Junior, C.A. Effect of dairy by-products as milk replacers on quality attributes of ice cream. J. Dairy Sci. 2020, 103, 10022–10035. [Google Scholar] [CrossRef]
  34. Prindiville, E.A.; Marshall, R.T.; Heymann, H. Effect of milk fat, cocoa butter, and whey protein fat replacers on the sensory properties of low fat and nonfat chocolate ice cream. J. Dairy Sci. 2000, 83, 2216–2223. [Google Scholar] [CrossRef]
  35. El-Zeini, H.M.; El-Abd, M.M.; Metwaly, F.A.; Zeidan, M.A.; Hassan, Y.F. Using whey protein isolate as a substitute of milk solid not fat on chemical and physico-chemical properties of ice cream. J. Food Dairy Sci. 2016, 7, 133–137. [Google Scholar] [CrossRef] [Green Version]
  36. Silveira, E.O.; Lopes Neto, J.H.; Silva, L.A.; Raposo, A.E.S.; Magnani, M.; Cardarelli, H.R. The effects of inulin combined with oligofructose and goat cheese whey on the physicochemical properties and sensory acceptance of a probiotic chocolate goat dairy beverage. LWT Food Sci. Technol. 2015, 62, 445–451. [Google Scholar] [CrossRef] [Green Version]
  37. Crippen, K.L.; Jeon, I.J. Direct-acid-set cottage cheese whey as a base for a shelf-stable athletic-type drink. J. Food Prot. 1984, 47, 53–57. [Google Scholar] [CrossRef]
  38. Meneses, R.B.; Maciel, L.F.; Rocha-Leão, M.H.M.; Conte-Junior, C.A. Physicochemical characteristics of milk by-products. Chem. Eng. Trans. 2020, 79, 37–42. [Google Scholar] [CrossRef]
  39. Tharp, B.W.; Forrest, B.; Swan, C.; Dunning, L.; Hilmoe, M. Basic factors affecting ice cream meltdown. In Ice Cream, 1st ed.; Buchheim, W., Ed.; International Dairy Federation: Brussels, Belgium, 1998; pp. 54–64. [Google Scholar]
  40. Granger, C.; Leger, A.; Bareyb, P.; Langendorff, V.; Cansella, M. Influence of formulation on the structural networks in ice cream. Int. Dairy J. 2005, 15, 255–262. [Google Scholar] [CrossRef]
  41. Janiaski, D.R.; Pimentel, T.C.; Cruz, A.G.; Prudencio, S.H. Strawberry-flavored yogurts and whey beverages: What is the sensory profile of the ideal product? J. Dairy Sci. 2016, 99, 5273–5283. [Google Scholar] [CrossRef] [PubMed]
Figure 1. Characterization of chocolate ice cream formulations made with different ratios of ricotta whey (RW) (a), cheese whey (CW) (b), and butter whey (BW) (c) in replacement to whole milk (WM) by principal component analysis (PCA) defined by two principal components (PC1 and PC2) (left) and identification of relevant sensory attributes contributing to the overall liking by partial least square regression (PLSR) where X-axis = sensory attributes, and Y-axis = overall liking/acceptability (right). 100WM, 25(RW, CW, and BW), 50(RW, CW, and BW), 75(RW, CW, and BW), and 100(RW, CW, and BW) means chocolate ice creams with 0% (100% of whole milk), 25%, 50%, 75%, and 100% of ricotta whey, cheese whey, and butter whey, respectively.
Sustainability 13 01531 g001
Figure 2. Maximum replacement level of ricotta whey (RW—), cheese whey (CW—●), and butter whey (BW—) by whole milk (WM) in chocolate ice creams considering 50% consumer’s rejection (dashed line) through parametric survival regression model based on the Weibull distribution. The function of product rejection was generated by categorizing the consumer responses to the question (“Suppose that you bought this product to eat or that it was served to you in your home. Would you consume it?”) as 0 (no) and 1 (yes).
Sustainability 13 01531 g002
Table 1. Chocolate ice cream formulations made with whole milk (WM) and ricotta whey (RW), cheese whey (CW), and butter whey (BW) at different ratios.
Ingredients
(%) ¥
Formulations
0%
(100WM)
25%
(25RW or 25CW or 25BW)
50%
(50RW or 50CW or 50BW)
75%
(75RW or 75CW or 75BW)
100%
(100RW or 100CW or 100BW)
Whole Milk58.1443.6129.0714.53-
Ricotta whey or
Cheese whey or
Butter whey
- *14.5329.0743.6158.14
¥ All formulated with 17.44% refined sugar (DA BARRA®, Barra Bonita, SP, Brazil), 11.63% cream milk (Nestlé®, Rio de Janeiro, RJ, Brazil), 0.58% thickener and stabilizer (Selecta®, Jaraguá do Sul, SC, Brazil), 0.58% emulsifier (Select®, Jaraguá do Sul, SC, Brazil) and 11.63% 100% chocolate powdered (Nestlé®, Rio de Janeiro, RJ, Brazil). *—Absence.
Table 2. Degree of acceptability for appearance, aroma, flavor, texture, overall liking, and purchase intention of chocolate ice cream formulations made with different ratios of ricotta whey (RW), cheese whey (CW), and butter whey (BW) in replacement to whole milk (WM).
FormulationAppearance xAroma xFlavor xTexture xOverall Liking xPurchase Intention y
Ricotta Whey
Commercial (Kibon®)5.80 ± 1.63 a5.34 ± 1.27 a5.61 ± 1.68 a5.47 ± 1.79 a5.71 ± 1.58 a3.53 ± 1.25 a
100WM r5.12 ± 1.20 b5.13 ± 1.28 a5.60 ± 1.21 a5.09 ± 1.30 a5.37 ± 1.24 ab3.25 ± 1.18 a
25RW r5.00 ± 1.10 b5.04 ± 1.01 a5.50 ± 1.11 a5.02 ± 1.18 a5.35 ± 1.11 ab3.26 ± 0.85 a
50RW r4.93 ± 1.60 b4.96 ± 1.34 a5.33 ± 1.50 a5.04 ± 1.73 a5.37 ± 1.60 ab3.26 ± 1.21 a
75RW r5.14 ± 1.29 b4.96 ± 0.99 a5.21 ± 1.26 a5.10 ± 1.29 a5.18 ± 1.23 ab3.17 ± 0.93 a
100RW r5.34 ± 1.54 ab4.96 ± 1.11 a5.06 ± 1.65 a5.11 ± 1.53 a4.97 ± 1.54 b3.08 ± 1.24 a
Cheese Whey
Commercial (Kibon®)5.76 ± 1.70 a5.31 ± 1.33 a5.56 ± 1.74 a5.42 ± 1.84 a5.67 ± 1.65 a3.53 ± 1.25 a
100WM s5.06 ± 1.25 bc5.07 ± 1.33 a5.54 ± 1.28 a5.03 ± 1.34 a5.31 ± 1.30 a3.21 ± 1.19 a
25CW s4.91 ± 1.16 bc5.11 ± 1.04 a5.52 ± 1.10 a5.05 ± 1.10 a5.30 ± 1.10 a3.16 ± 0.87 a
50CW s4.72 ± 1.65 c5.05 ± 1.34 a5.34 ± 1.48 a5.00 ± 1.39 a5.21 ± 1.48 a3.06 ± 1.22 a
75CW s5.45 ± 1.32 ab5.45 ± 1.34 a5.70 ± 1.15 a5.29 ± 1.13 a5.62 ± 1.11 a3.47 ± 1.19 a
100CW s5.43 ± 1.37 ab5.43 ± 1.39 a5.66 ± 1.24 a5.26 ± 1.20 a5.59 ± 1.19 a3.46 ± 1.21 a
Butter Whey
Commercial (Kibon®)5.73 ± 1.76 a5.28 ± 1.39 a5.52 ± 1.79 a5.39 ± 1.89 a5.62 ± 1.72 a3.51 ± 1.28 a
100WM t5.03 ± 1.31 bc5.04 ± 1.38 a5.51 ± 1.35 a5.00 ± 1.40 abc5.28 ± 1.36 ab3.19 ± 1.21 ab
25BW t4.96 ± 1.12 bc5.15 ± 0.99 a5.37 ± 1.19 a4.77 ± 1.13 bc5.12 ± 1.07 abc3.15 ± 0.88 abc
50BW t4.86 ± 1.53 c5.14 ± 1.36 a5.08 ± 1.53 ab4.55 ± 1.59 c4.91 ± 1.52 bcd3.04 ± 1.21 bc
75BW t5.20 ± 1.20 abc4.79 ± 1.05 ab4.64 ± 1.25 bc4.92 ± 1.15 abc4.65 ± 1.15 cd2.87 ± 0.88 bc
100BW t5.52 ± 1.49 ab4.49 ± 1.42 b4.17 ± 1.76 c5.27 ± 1.72 ab4.39 ± 1.53 d2.69 ± 1.22 c
Results are expressed as mean ± standard deviation (n = 100 consumers by each whey type). a,b,c,d Means with different letters in the same column (by whey type) represent a statistical difference between the ice cream formulations using the Tukey test (p < 0.05). x Sensory attributes evaluated in a 7-point category scale (7—like very much; 4—neither like nor dislike; 1—dislike very much). y Sensory attributes evaluated in a 5-point category scale (5—certainly would buy; 3—I might buy it/I might not buy it; 1—certainly would not buy). r 100WM, 25RW, 50RW, 75RW, and 100RW means chocolate ice creams with 0%, 25%, 50%, 75%, and 100% of ricotta whey, respectively. s 100WM, 25CW, 50CW, 75CW, and 100CW means chocolate ice creams with 0%, 25%, 50%, 75%, and 100% of cheese whey, respectively. t 100WM, 25BW, 50BW, 75BW, and 100BW means chocolate ice creams with 0%, 25%, 50%, 75%, and 100% of butter whey, respectively. Similar scores (p > 0.05) of aroma, flavor, texture, and purchase intention were observed among all ice cream formulations regarding ricotta whey. The 100WM, 25RW, 50RW, and 75RW received lower scores (p < 0.05) for appearance than the commercial sample, while no difference (p > 0.05) in the appearance was found between 100RW and the other ice cream formulations. The only difference observed was that 100RW had a lower score (p < 0.05) compared to the commercial sample for overall liking.
Table 3. Intensity of sensory attributes by just-about-right (JAR) scale of chocolate ice cream formulations made with different ratios of ricotta whey (RW), cheese whey (CW), and butter whey (BW) in replacement to whole milk (WM).
FormulationChocolate Color xChocolate Aroma xChocolate Flavor xSweetness xCreaminess xMelting Velocity x
Ricotta Whey
Commercial (Kibon®)3.88 ± 0.69 a3.08 ± 0.97 a3.61 ± 1.02 b3.86 ± 0.86 a4.00 ± 1.50 a3.10 ± 1.33 bc
100WM r3.16 ± 0.94 c3.30 ± 1.01 a3.99 ± 1.18 ab4.24 ± 1.05 a3.50 ± 1.29 a3.50 ± 1.24 ab
25RW r3.30 ± 0.64 bc3.14 ± 0.72 a3.91 ± 0.76 ab4.14 ± 0.74 a3.55 ± 0.97 a3.27 ± 0.90 abc
50RW r3.43 ± 0.79 bc2.98 ± 1.12 a3.82 ± 1.07 ab4.03 ± 1.08 a3.59 ± 1.38 a3.03 ± 1.23 c
75RW r3.51 ± 0.60 b3.14 ± 0.93 a4.02 ± 0.78 ab4.05 ± 0.88 a3.57 ± 1.03 a3.34 ± 0.92 abc
100RW r3.59 ± 0.74 ab3.29 ± 1.14 a4.21 ± 1.17 a4.06 ± 1.16 a3.54 ± 1.27 a3.64 ± 1.07 a
Cheese Whey
Commercial (Kibon®)3.86 ± 0.74 a3.06 ± 0.99 a3.60 ± 1.04 b3.83 ± 0.91 b3.97 ± 1.53 a3.08 ± 1.35 abc
100WM s3.15 ± 0.96 d3.29 ± 1.03 a3.97 ± 1.22 ab4.21 ± 1.09 ab3.48 ± 1.31 ab3.47 ± 1.26 a
25CW s3.32 ± 0.55 cd3.16 ± 0.74 a4.07 ± 0.76 a4.26 ± 0.78 a3.47 ± 0.99 ab3.29 ± 0.97 ab
50CW s3.47 ± 0.80 bc3.02 ± 0.99 a4.14 ± 1.21 a4.28 ± 1.17 a3.44 ± 1.39 b3.07 ± 1.38 abc
75CW s3.58 ± 0.59 abc3.20 ± 0.81 a4.22 ± 0.79 a4.33 ± 0.91 a3.34 ± 1.04 b2.92 ± 0.91 bc
100CW s3.69 ± 0.77 ab3.38 ± 1.25 a4.30 ± 1.00 a4.37 ± 1.06 a3.23 ± 1.34 b2.77 ± 1.17 c
Butter Whey
Commercial (Kibon®)3.84 ± 0.79 bc3.04 ± 1.01 b3.58 ± 1.07 d3.81 ± 0.95 b3.96 ± 1.55 a3.09 ± 1.33 a
100WM t3.13 ± 0.98 d3.28 ± 1.05 ab3.95 ± 1.25 cd4.18 ± 1.14 ab3.44 ± 1.33 b3.44 ± 1.28 a
25BW t3.71 ± 0.65 c3.39 ± 0.70 ab4.24 ± 0.85 bc4.45 ± 0.84 a3.31 ± 0.88 b3.26 ± 0.83 a
50BW t4.25 ± 0.94 a3.48 ± 1.14 a4.48 ± 1.13 ab4.66 ± 1.30 a3.12 ± 1.27 b3.01 ± 1.37 a
75BW t4.10 ± 0.60 ab3.48 ± 1.00 ab4.67 ± 0.96 ab4.59 ± 1.13 a3.56 ± 0.98 ab3.06 ± 0.92 a
100BW t3.95 ± 0.61 abc3.47 ± 1.45 ab4.85 ± 1.45 a4.52 ± 1.71 a4.00 ± 1.45 a3.11 ± 1.29 a
Results are expressed as mean ± standard deviation (n = 100 consumers by each whey type). a,b,c,d Means with different letters in the same column (by whey type) represent a statistical difference between the ice cream formulations using the Tukey test (p < 0.05). x Sensory attributes evaluated in a 7-point category scale (1—extremely little; 5—just about right; 7—extremely much). r 100WM, 25RW, 50RW, 75RW, and 100RW means chocolate ice creams with 0%, 25%, 50%, 75%, and 100% of ricotta whey, respectively. s 100WM, 25CW, 50CW, 75CW, and 100CW means chocolate ice creams with 0%, 25%, 50%, 75%, and 100% of cheese whey, respectively. t 100WM, 25BW, 50BW, 75BW, and 100BW means chocolate ice creams with 0%, 25%, 50%, 75%, and 100% of butter whey, respectively.
Table 4. Penalty analysis of the just-about-right (JAR) scores to verify penalized sensory attributes of each chocolate ice cream formulations made with different ratios of ricotta whey (RW), cheese whey (CW), and butter whey (BW) in replacement to whole milk (WM).
FormulationChocolate Color xChocolate Aroma xChocolate Flavor xSweetness xCreaminess xMelting Velocity x
Too LittleToo MuchToo LittleToo MuchToo LittleToo MuchToo LittleToo MuchToo LittleToo MuchToo LittleToo Much
Ricotta Whey
Commercial (Kibon®)--60 y (0.50) z-41 (0.81)-25 (0.61)-35 (0.66)-60 (1.47)-
100WM r64 (1.25)-54 (0.86)-37 (1.28)--30 (1.67)64 (1.34)---
25RW r44 (0.64)------42 (0.56)----
50RW r--------51 (0.63)---
75RW r----------51 (0.61)-
100RW r41 (0.56)----39 (1.46)-30 (1.69)52 (1.38)---
Cheese Whey
Commercial (Kibon®)--60 (0.52)-41 (0.83)-25 (0.65)-35 (0.69)-60 (1.38)-
100WM s64 (1.28)-54 (0.89)-38 (1.390--29 (1.62)64 (1.37)---
25CW s--------48 (0.43)---
50CW s----32 (0.70)-------
75CW s-------51 (0.70)----
100CW s--44 (0.68)--37 (1.21)-36 (1.02)59 (1.35)-73 (1.08)-
Butter Whey
Commercial (Kibon®)--60 (0.50)-41 (0.81)-26 (0.78)-35 (0.66)-60 (1.37)-
100WM t63 (1.33)-55 (1.02)-38 (1.47)--29 (1.62)64 (1.42)---
25BW t23 (0.73)-45 (0.54)--41 (0.70)-54 (0.60)53 (0.50---
50BW t--49 (0.51)--45 (1.51)-50 (0.89)71 (0.74)---
75BW t-----70 (0.69)------
100BW t-----62 (1.19)-56 (1.12)35 (0.58)-63 (0.68)-
x JAR scores were evaluated in a 7-point category scale (1—extremely little; 5—just about right; 7—extremely much); n = 100 consumers by each whey type. The penalized attributes were those with >0.5 penalty score and >20% occurrence by consumers. y The percentage of consumers who found the sensory attribute from JAR score to be too little or too much. z The number in parentheses is the change in the mean of the sensory attribute from JAR score compared to the consumer response score to overall liking. - It indicates that less than 20% of consumers found the sensory attribute from JAR score to be too little or too much. r 100WM, 25RW, 50RW, 75RW, and 100RW means chocolate ice creams with 0%, 25%, 50%, 75%, and 100% of ricotta whey, respectively. s 100WM, 25CW, 50CW, 75CW, and 100CW means chocolate ice creams with 0%, 25%, 50%, 75%, and 100% of cheese whey, respectively. t 100WM, 25BW, 50BW, 75BW, and 100BW means chocolate ice creams with 0%, 25%, 50%, 75%, and 100% of butter whey, respectively. Considering the samples with CW, 25CW, 50CW, and 75CW exhibited lower penalties than other ice cream formulations. 25CW was penalized for too little creaminess, 50CW for too little chocolate flavor, and 75CW for too much sweetness. However, 25CW demonstrated similar JAR (p > 0.05) for creaminess than other ice cream formulations, including the commercial sample and 100WM. On the other hand, 50CW and 75CW exhibited higher JAR (p < 0.05) for chocolate flavor and sweetness compared to commercial sample, respectively, and similar JAR (p > 0.05) for these parameters in comparison with 100WM. Besides, consumers penalized commercial sample and 100WM for too little chocolate aroma, too little chocolate flavor, too little creaminess, too little sweetness (commercial sample), and too much sweetness (100WM). The commercial sample was also penalized for having high melting velocity, while 100WM for too little chocolate color.
Publisher’s Note: MDPI stays neutral with regard to jurisdictional claims in published maps and institutional affiliations.

