Article

Effect of Grouser Height on the Tractive Performance of Single Grouser Shoe under Different Soil Moisture Contents in Clay Loam Terrain

1
School of Agricultural Equipment Engineering, Jiangsu University, Zhenjiang 212013, China
2
Faculty of Agricultural Engineering, Sindh Agriculture University, Tando Jam 70060, Pakistan
3
Department of Agricultural Engineering, Bahauddin Zakariya University, Multan 60800, Pakistan
*
Author to whom correspondence should be addressed.
Sustainability 2021, 13(3), 1156; https://doi.org/10.3390/su13031156
Submission received: 20 November 2020 / Revised: 27 December 2020 / Accepted: 29 December 2020 / Published: 22 January 2021

Abstract

:
The grouser height and soil conditions have a considerable influence on the tractive performance of single-track shoe. A soil bin-based research was conducted to assess the influence of grouser height on the tractive performance of single-track shoe at different moisture contents of clay loam soil. Eight moisture contents (7.5, 12, 16.7, 21.5, 26.2, 30.7, 35.8, and 38%) and three grouser heights (45, 55, and 60 mm) were comprised during this study. The tractive performance parameters of (thrust, running resistance, and traction) were determined by penetration test. A sensor-based soil bin was designed for penetration tests, which was included penetration system (AC motor, loadcell, and displacement sensor). The test results revealed that soil cohesion was decreased, and adhesion was increased after 16.7% moisture content. Soil thrust at lateral sides and bottom of grouser were increased before 16.7%, and then decreased for all the three heights but the major decrease was observed at 45 mm height. The motion resistance was linearly decreased, the more reduction was on 45 mm at 38% moisture content. The traction of the single-track shoe was decreased with a rise in moisture content, the maximum decrease was on 45 mm grouser height at 38% moisture content. It could be concluded that an off-road tracked vehicle (crawler combine harvester) with 45 mm grouser height of single-track shoe could be operated towards a moderate moisture content range (16.7–21.5%) under paddy soil for better traction.

1. Introduction

Tracked vehicles have been popularized because of more contact area with the ground, which leads to better float and traction than wheeled vehicles, making them suitable for rough and relatively saturated terrain. Tracked vehicles are used in various fields, such as mining, forestry, agriculture, planetary exploration, army, and construction [1]. Tractive performance of tracked vehicles including propulsion and resistance is very important for terrain trafficability and is influenced by vehicle and soil factors [2]. Grousers are devices intended to increase the traction of the continuously tracked vehicle on soil or snow; this is done by increasing contact with the ground with teeth equipped on crawler tracks, similar to conventional tire treads; usually, grousers are made up of hardened forged steel. The soil-track interaction tool includes two aspects: forces arising at the interface between the soil and the tool, such as thrust, lateral force, and vertical force and displacement of soil particles also known as soil disturbance [3,4]. The proper design and selection of soil-track interaction tools depends largely on the mechanical behavior of the soils [5].
Soil conditions greatly affect the traction performance of off-road or tracked/wheeled vehicles. Soil properties are important to generate traction for the soil track system [2]. The key to off-road vehicle performance prediction lies in the proper evaluation of the mechanical properties of the field [6]. Traction performance of the vehicle significantly influenced by the mechanical properties of the soil and it has been reported that the variation of soil water contents (MC) also affects the traction ability of a tracked vehicle [7,8].
The tractive performance of off-road vehicle prediction depends upon the appropriate assessment of mechanical properties (soil cohesion, soil adhesion, and angle of internal and external friction, etc.) of the soil. Mobility states a relationship between soil and the vehicle. To assess the mobility and traction of vehicles, it is important to determine the mechanical properties of soil, which are believed to be related to the mobility of vehicles. Terrain topology and soil parameters also influence vehicle performance, besides to the intrinsic vehicle characteristics. To correctly determine the mechanical properties in terms of mobility of off-road vehicles, it is necessary to carry out measurements under load conditions similar to those imposed by vehicles. The vertical load applied by the off-road vehicle to a soil causes sinkage, while the horizontal load created by the track/wheels on the soil surface causes the development of shear strength and the associated slip [2,9,10]. Determining the mobility and traction of off-road vehicles requires a thorough understanding of soil mechanics since it is necessary to use a track/wheel to determine power transfer between the vehicle and the soil. Traction as a force derived from the interaction between track and soil. It could be affected by two types of factors: soil conditions and shoe dimensions [11]. The effects of the soil on tractive performance were obtained on soft conditions over 50% [12].
The methods developed for the study of the traction of a track–soil interaction is empirical, semi-empirical, and computer methods [13]. The empirical model was originally developed by the U.S. Army Waterway Experimental Station (WES) to meet military needs in predicting the performance of land-based off-road vehicles, including concepts of “go/no go”, mobility index, etc. Robert G applied a pilot model of traction performance for rubber tracks on agricultural soils [14]. A semi-empirical approach named bevameter technique for the prediction of traction of a tracked vehicle was developed by Bekker [2]. The tractive performance of the single-track shoe (grouser) could be predicted by knowing the normal stress distribution and shear at the front of the soil path and 3D geometry of the contact surface. Hiroshi made a computer approach by using “The Discrete Element Method (DEM)” for the specific ability to assess total traction potential based on interaction studies of computing reactions and soil behaviors, regardless of the type of method chosen for predicting traction, as soil parameters should be known at first [15].
The sinkage of soil occurs when a known load is applied on the surface of the soil, the area under the load sinks in the soil at a certain depth until the resistance of the soil is balanced with the applied force. Soil pressure resistance uses two parameters for characterization: soil cohesion, internal friction angle [16]. In the past several decades, a set of studies has been conducted to estimate traction performance for a variety of tracked components [17,18,19,20] but still, the interaction study among grouse height, moisture contents, and soil mechanical properties on the traction performance of the single-track shoe is needed.
The present research was based on the semi-empirical method developed by Bekker to assess the impacts of grouser height on the traction performance of a grouser of the single-track shoe in certain soil conditions under sensor-based soil bin.

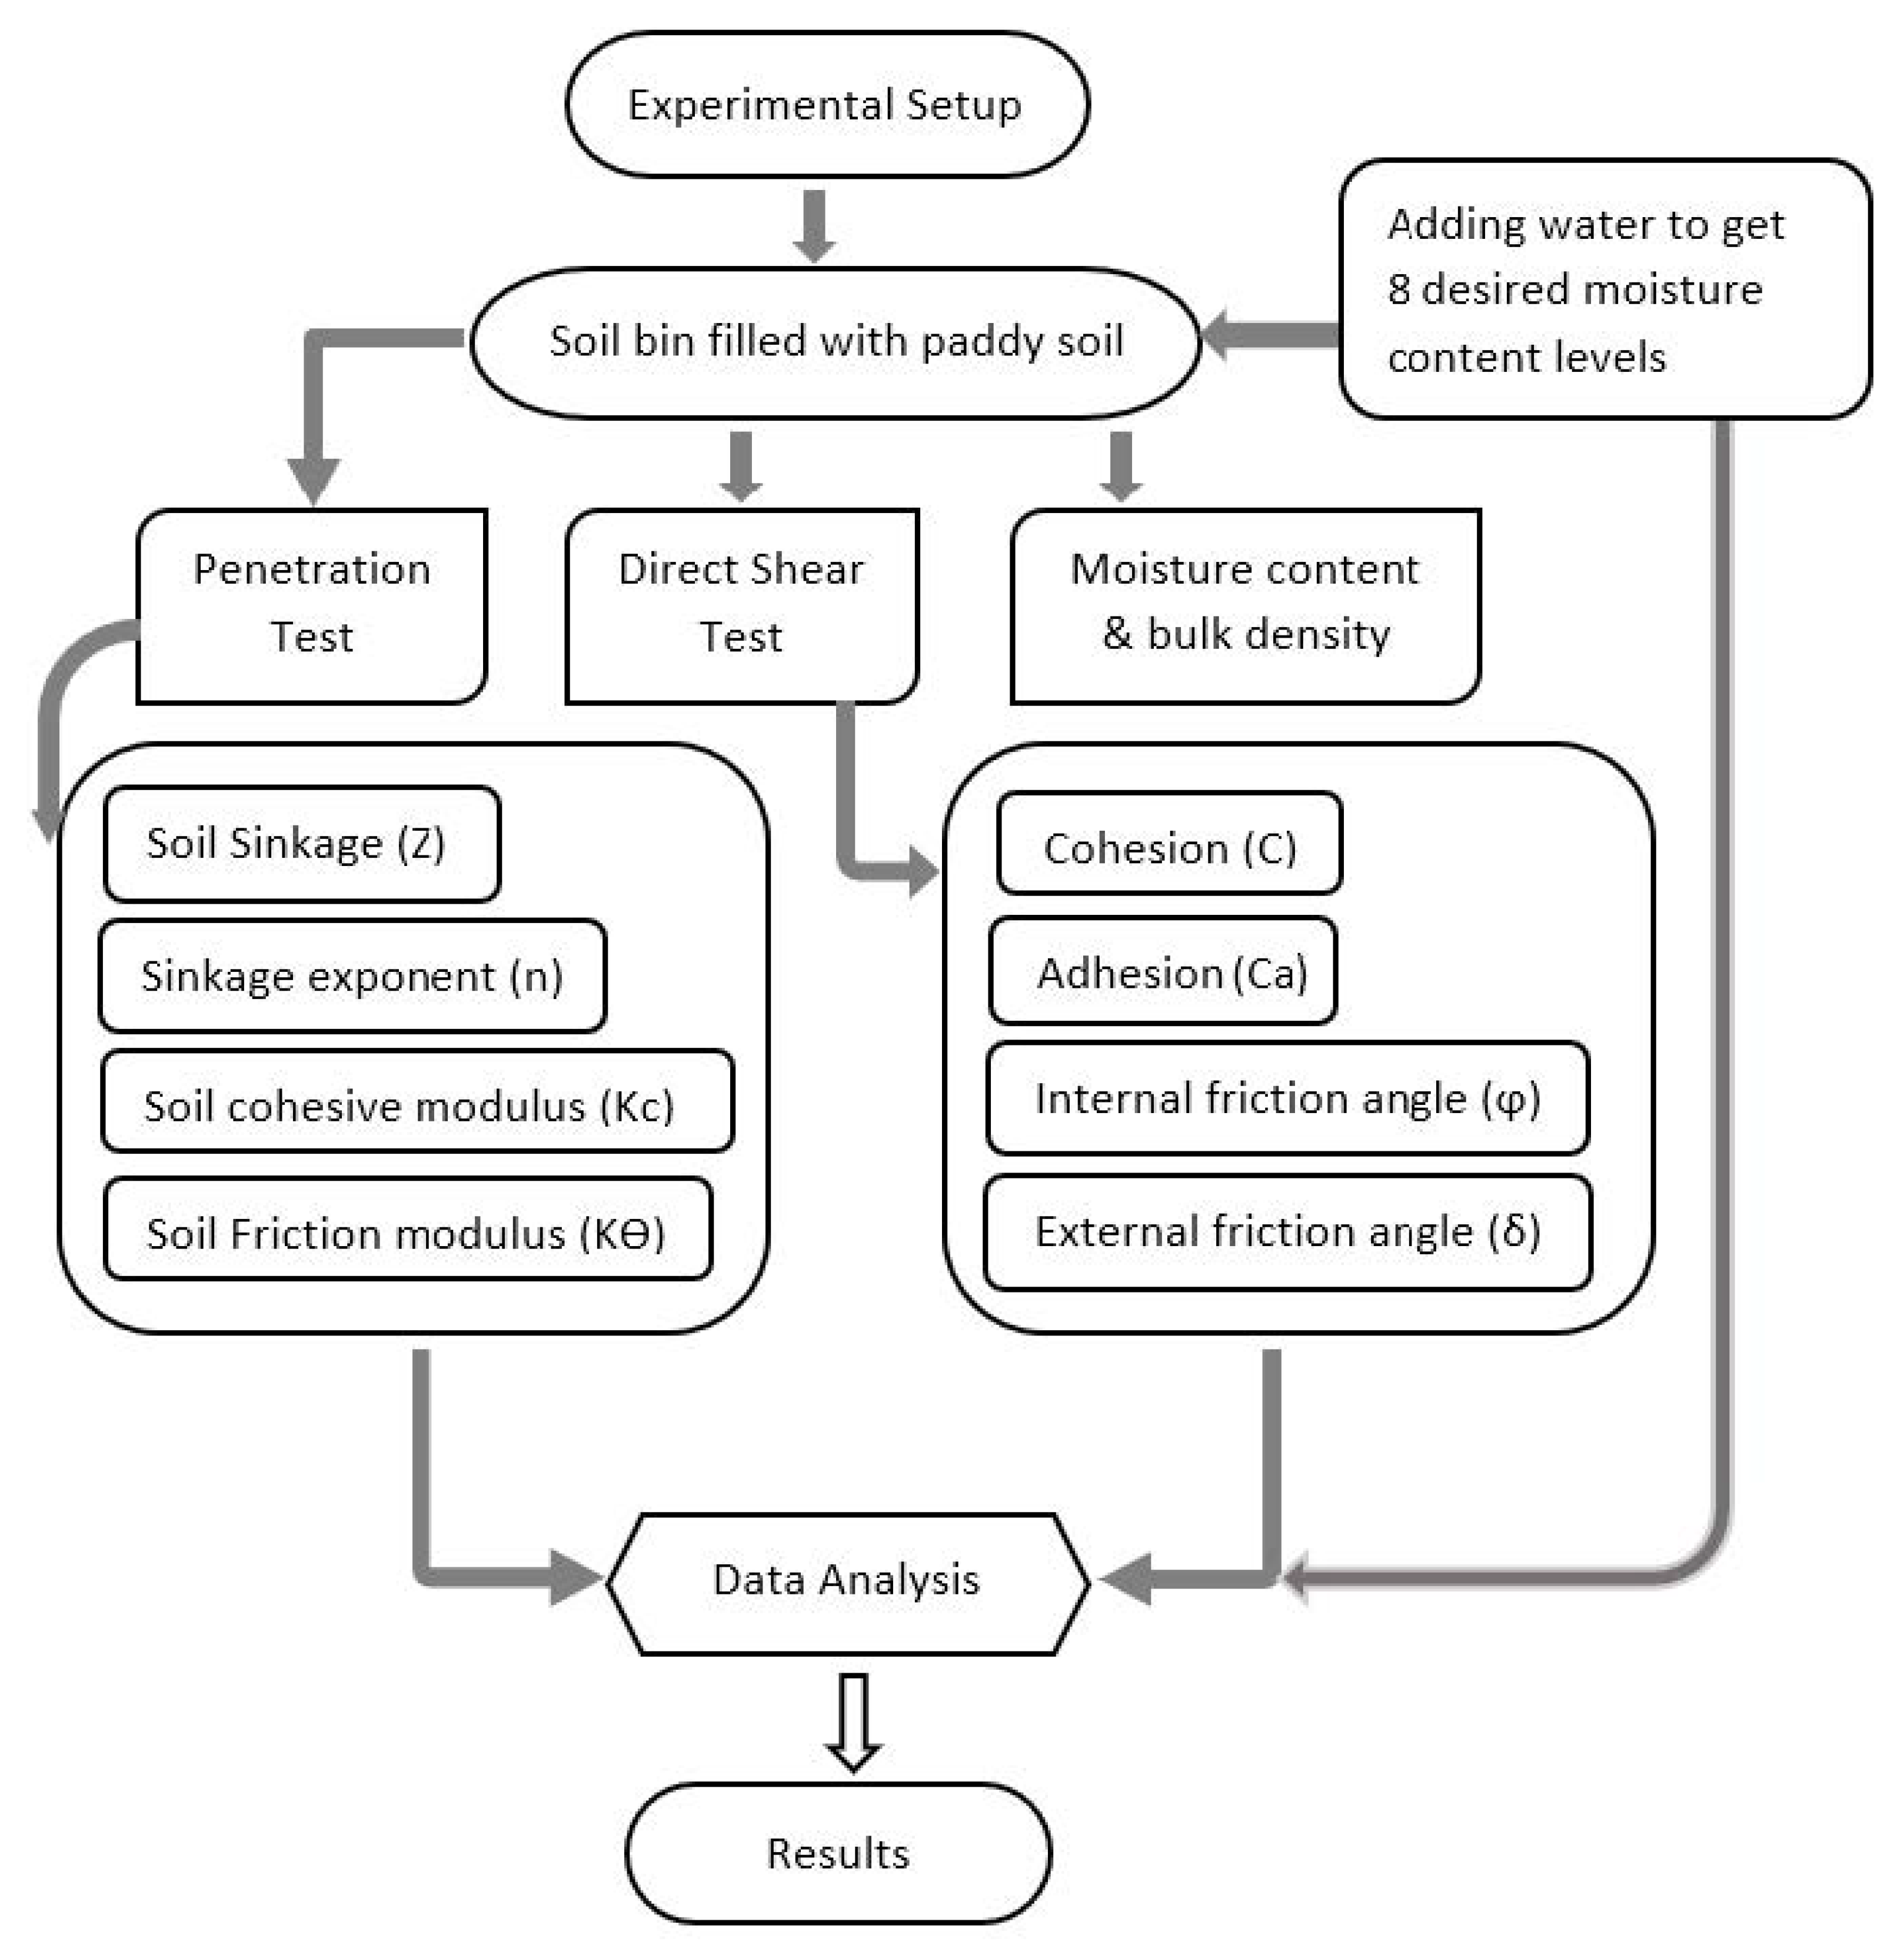
2. Materials and Methods

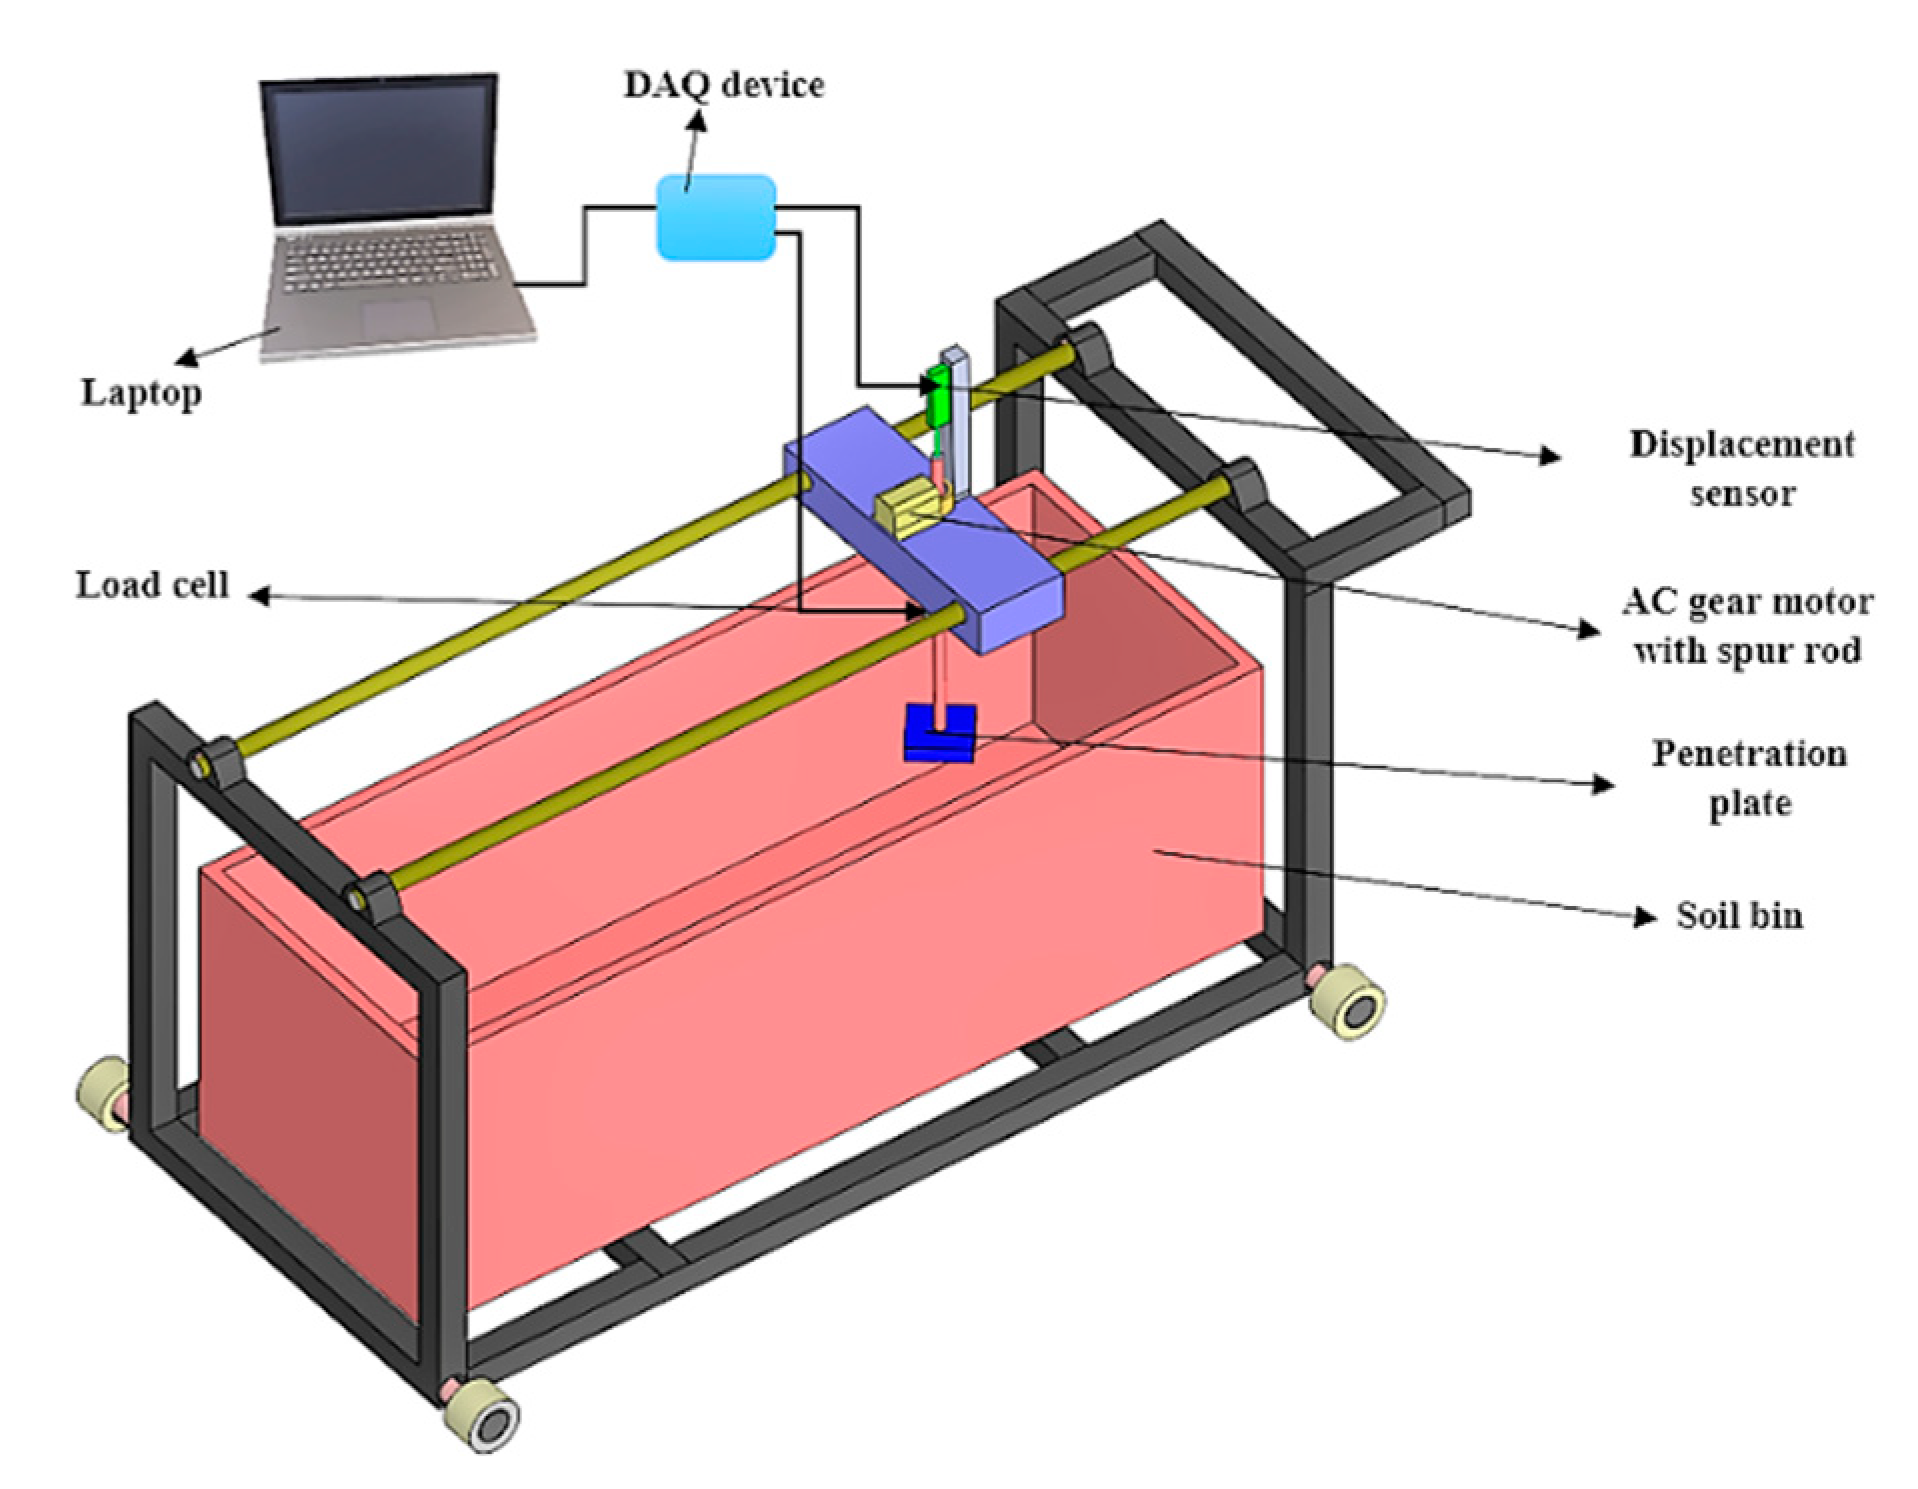
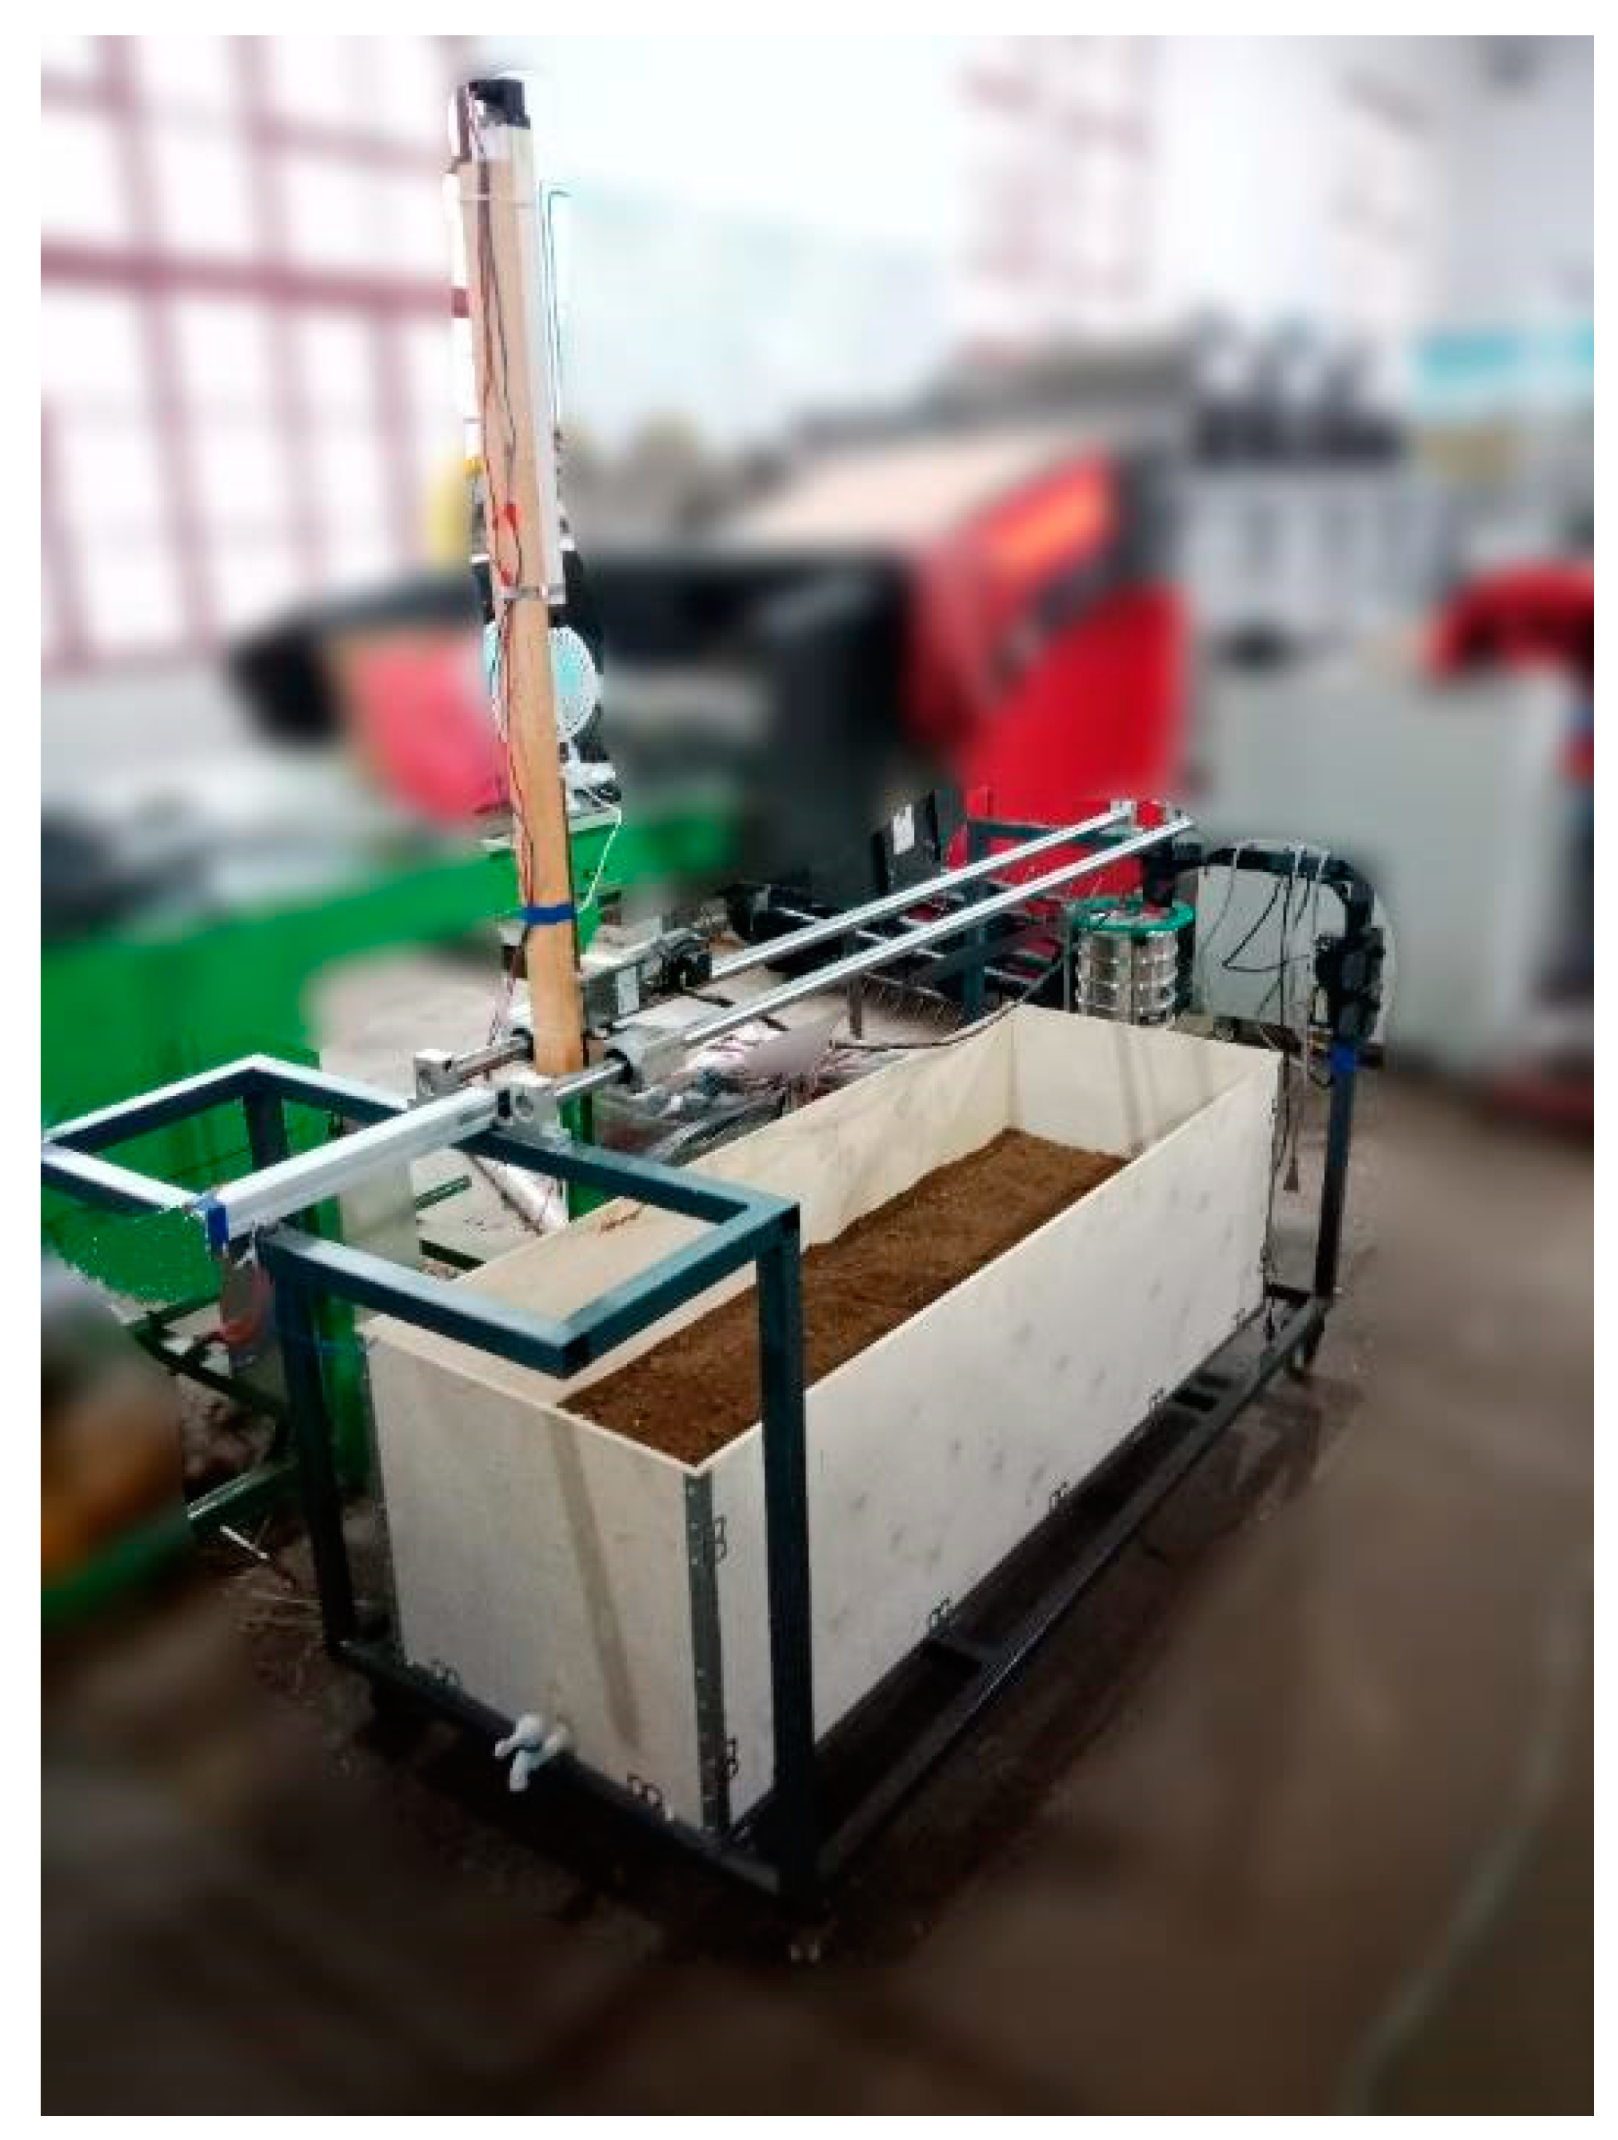
2.1. Expeerimental Setup

The experimental setup was consisted of penetration test and direct shear test (Figure 1).
The tractive performance parameters were determined by deriving the Equations (1)–(16), the amounts of sinkage were less than the height of the grouser when the vertical load on the single grouser shoe was applied, and the entire track shoe in the field had been shown to have more sinkage. Between the grouse and the plate, the vertical load is shared. The proposed model and schematic depiction of forces acting on a single-track shoe are shown in Figure 2.
The vertical load was measured by the following Equation:
W = q 1 λ L B + q 2 ( 1 λ ) L B
where W is vertical load, L is track shoe pitch, B is the width of single track shoe, and λ is the ratio of grouser plate thickness to the length of single track shoe. Whereas q1 is the contact pressure of the top surface of the grouser and q2 is the pressure at the bottom surface of single track shoe, was expressed as follows:
q 1 = K ( h + Z 0 ) n
q 2 = K Z 0 n
where K is the modulus of soil deformation, n is soil deformation index or sinkage exponent, h is grouser height and Z is soil sinkage. Furthermore, K was determined by Equation (4) as:
K = k c B + k
where kc is soil cohesion within the deformation modulus, friction modulus of soil, and B is the width of the single-track shoe. So, the load Equation could make the following relationship:
W = ( k c B + k ) L B { ( h + Z 0 ) n λ + Z 0 n ( 1 λ ) }
The pressure and soil sinkage were computed according to Bekker’s pressure-sinkage relationship as:
p = ( k c B + k θ ) z n
Soil sinkage is accountable for the increase in running resistance. The running resistance of a single-track shoe was found by Equation (7):
R = k c + B k n + 1   { ( h + Z 0 ) ( n + 1 ) λ + Z 0 ( n + 1 ) ( 1 λ ) }
Soil thrust is the utmost vital parameter of traction of the single-track shoe. the thrust is the resultant of the shearing force on the tip surface of grouser (F1), the shearing force of the grouser shoe’s lateral sides (F2), and the shearing force on the bottom surface of soil beneath the spacing surface (F3). The F1 was measured by Equation (8):
F 1 = λ L B ( C a + q 1 t a n δ )
where Ca is soil adhesion, δ is the external friction angle of the soil. Furthermore, the shearing force of grouser’s lateral sides is divided into 3 parts as Fsg1, Fsg2, and Fss. Moreover, they could be shown by the following relationships:
F 2 = 2 ( F s g 1 + F s g 2 + F s s )
F s g 1 = λ h L [ C a + q 1 t a n δ t a n φ ( 45 φ 2 ) { γ t ( 2 Z 0 + h ) 2   t a n ( 45 φ 2 ) 2 C } ]
where Fsg1 is the shearing force at grouser’s lateral side, φ is the internal friction angle of soil, γ t is the soil density and C is the soil cohesion. Whereas the shearing force of spacing’s lateral side (Fsg2) was measured by Equation (11).
If Z < t then:
F s g 2 = Z 0 L [ C a + q 1 t a n δ t a n φ ( 45 φ 2 ) { γ t Z 0 2   t a n ( 45 φ 2 ) 2 C } ]
If Z > t then:
F s g 2 = t L [ C a + q 1 t a n δ t a n φ ( 45 φ 2 ) { γ t ( 2 Z 0 t ) 2   t a n ( 45 φ 2 ) 2 C } ]
where t is the thickness of shoe spacing. Finally, the shearing force of the lateral side of the soil below the spacing surface (Fss) was measured by the following Equation (13):
F s s = ( 1 λ ) h L [ C + { q 2 + γ t ( h + 2 Z 0 ) 2 }   t a n 2 ( 45 φ 2 )   t a n φ 2 C t a n ( 45 φ 2 ) t a n φ ]
Furthermore, the shearing force on the bottom surface of soil beneath the spacing surface (F3) was calculated as:
F 3 = ( 1 λ ) L B ( C + q 3 t a n φ )
The total soil thrust is the addition of all thrusts including F1, F2 and F3 as following:
F = F 1 + F 2 + F 3
The subtraction of total soil thrust from running resistance is the traction (T), it can be expressed as Equation (16):
T = F R

2.2. Experimental Work

The experiment was performed at the key laboratory of modern agricultural equipment and technology, school of agricultural equipment engineering, Jiangsu University, Zhenjiang, P.R China. A 500 mm wide, 1500 mm long, and 500 mm deep soil bin was used for the mechanical properties of soil. A factorial design experiment was conducted considering soil moisture content as first factor with eight number of levels (7.5, 12, 16.7, 21.5, 26.2, 30.7, 35.8, and 38%) and grouse height with three number of levels (60, 55, 45 mm). Figure 2 shown the flow diagram of the experimental work.

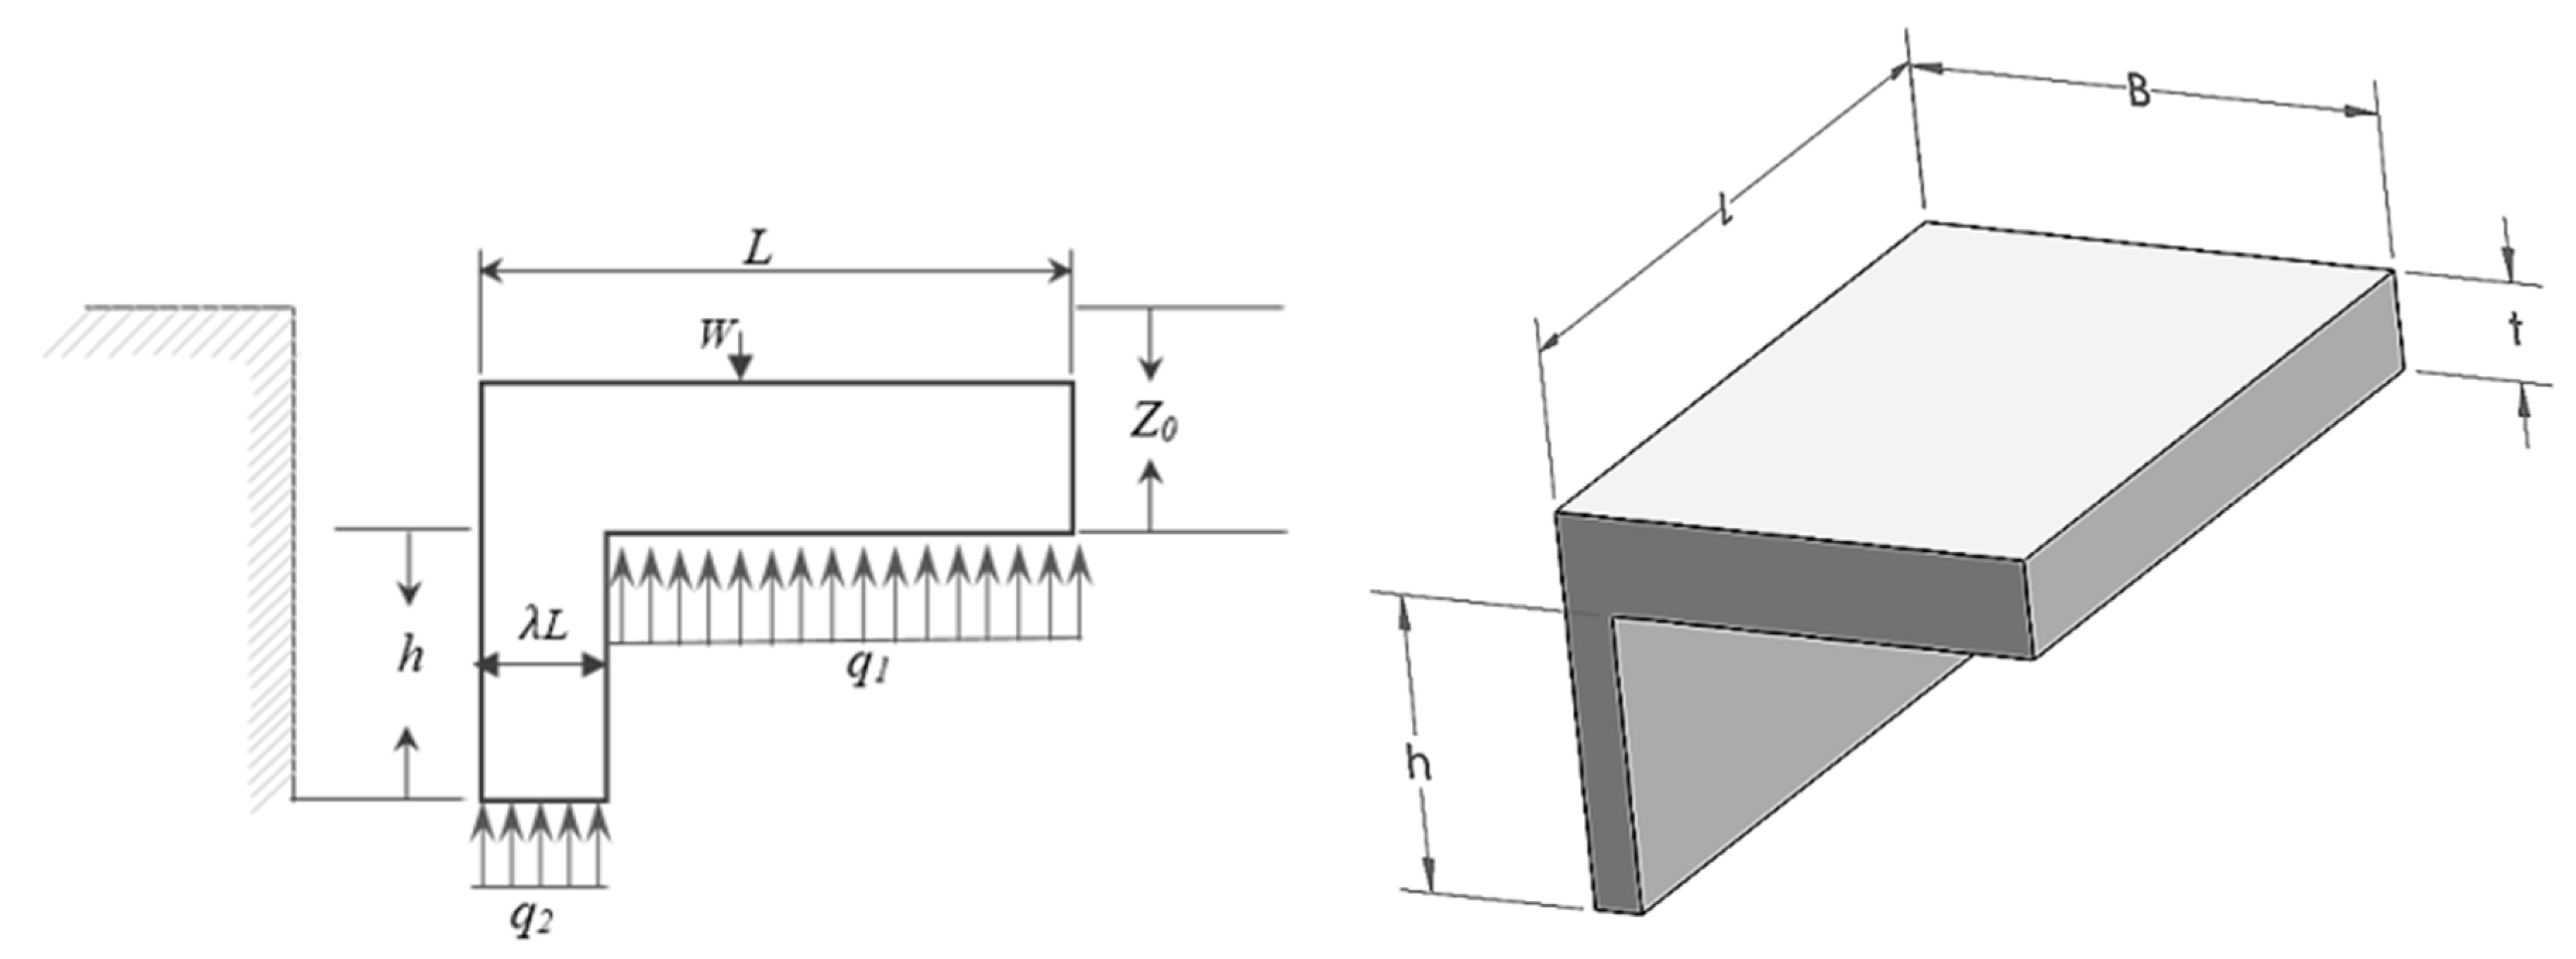
2.3. Dimensions of Single-Track Shoe

The details of the dimension of the single track-shoe model used for the research-based study are shown in Table 1.

2.4. Soil Preparation

The soil was taken from the experimental site of the school of agricultural equipment engineering and sun-dried. The dried soil was crushed, and a sieve analysis test was performed [1]. The soil was filled in the soil bin layer by layer, and at the 100 mm height, a little wooden roller was utilized to move it to and fro twice. The way toward putting the soil was rehashed until the elevation of the soil bin arrived at 400 mm. To get uniformity and higher moisture content, the calculated amount of water was added, mixed thoroughly, and left for 24 h [16]. To minimize moisture loss by evaporation, the soil bin was lined with a plastic sheet (polyethylene). Soil samples have been taken from the soil bin at three different random places. Averaging the moisture content of the three samples reported for each test. Besides which, an oven-dried method was used to measure soil moisture content [21]. The experimental work was divided into two parts, soil physical properties (soil texture and dry bulk density), direct shear test, and penetration test.

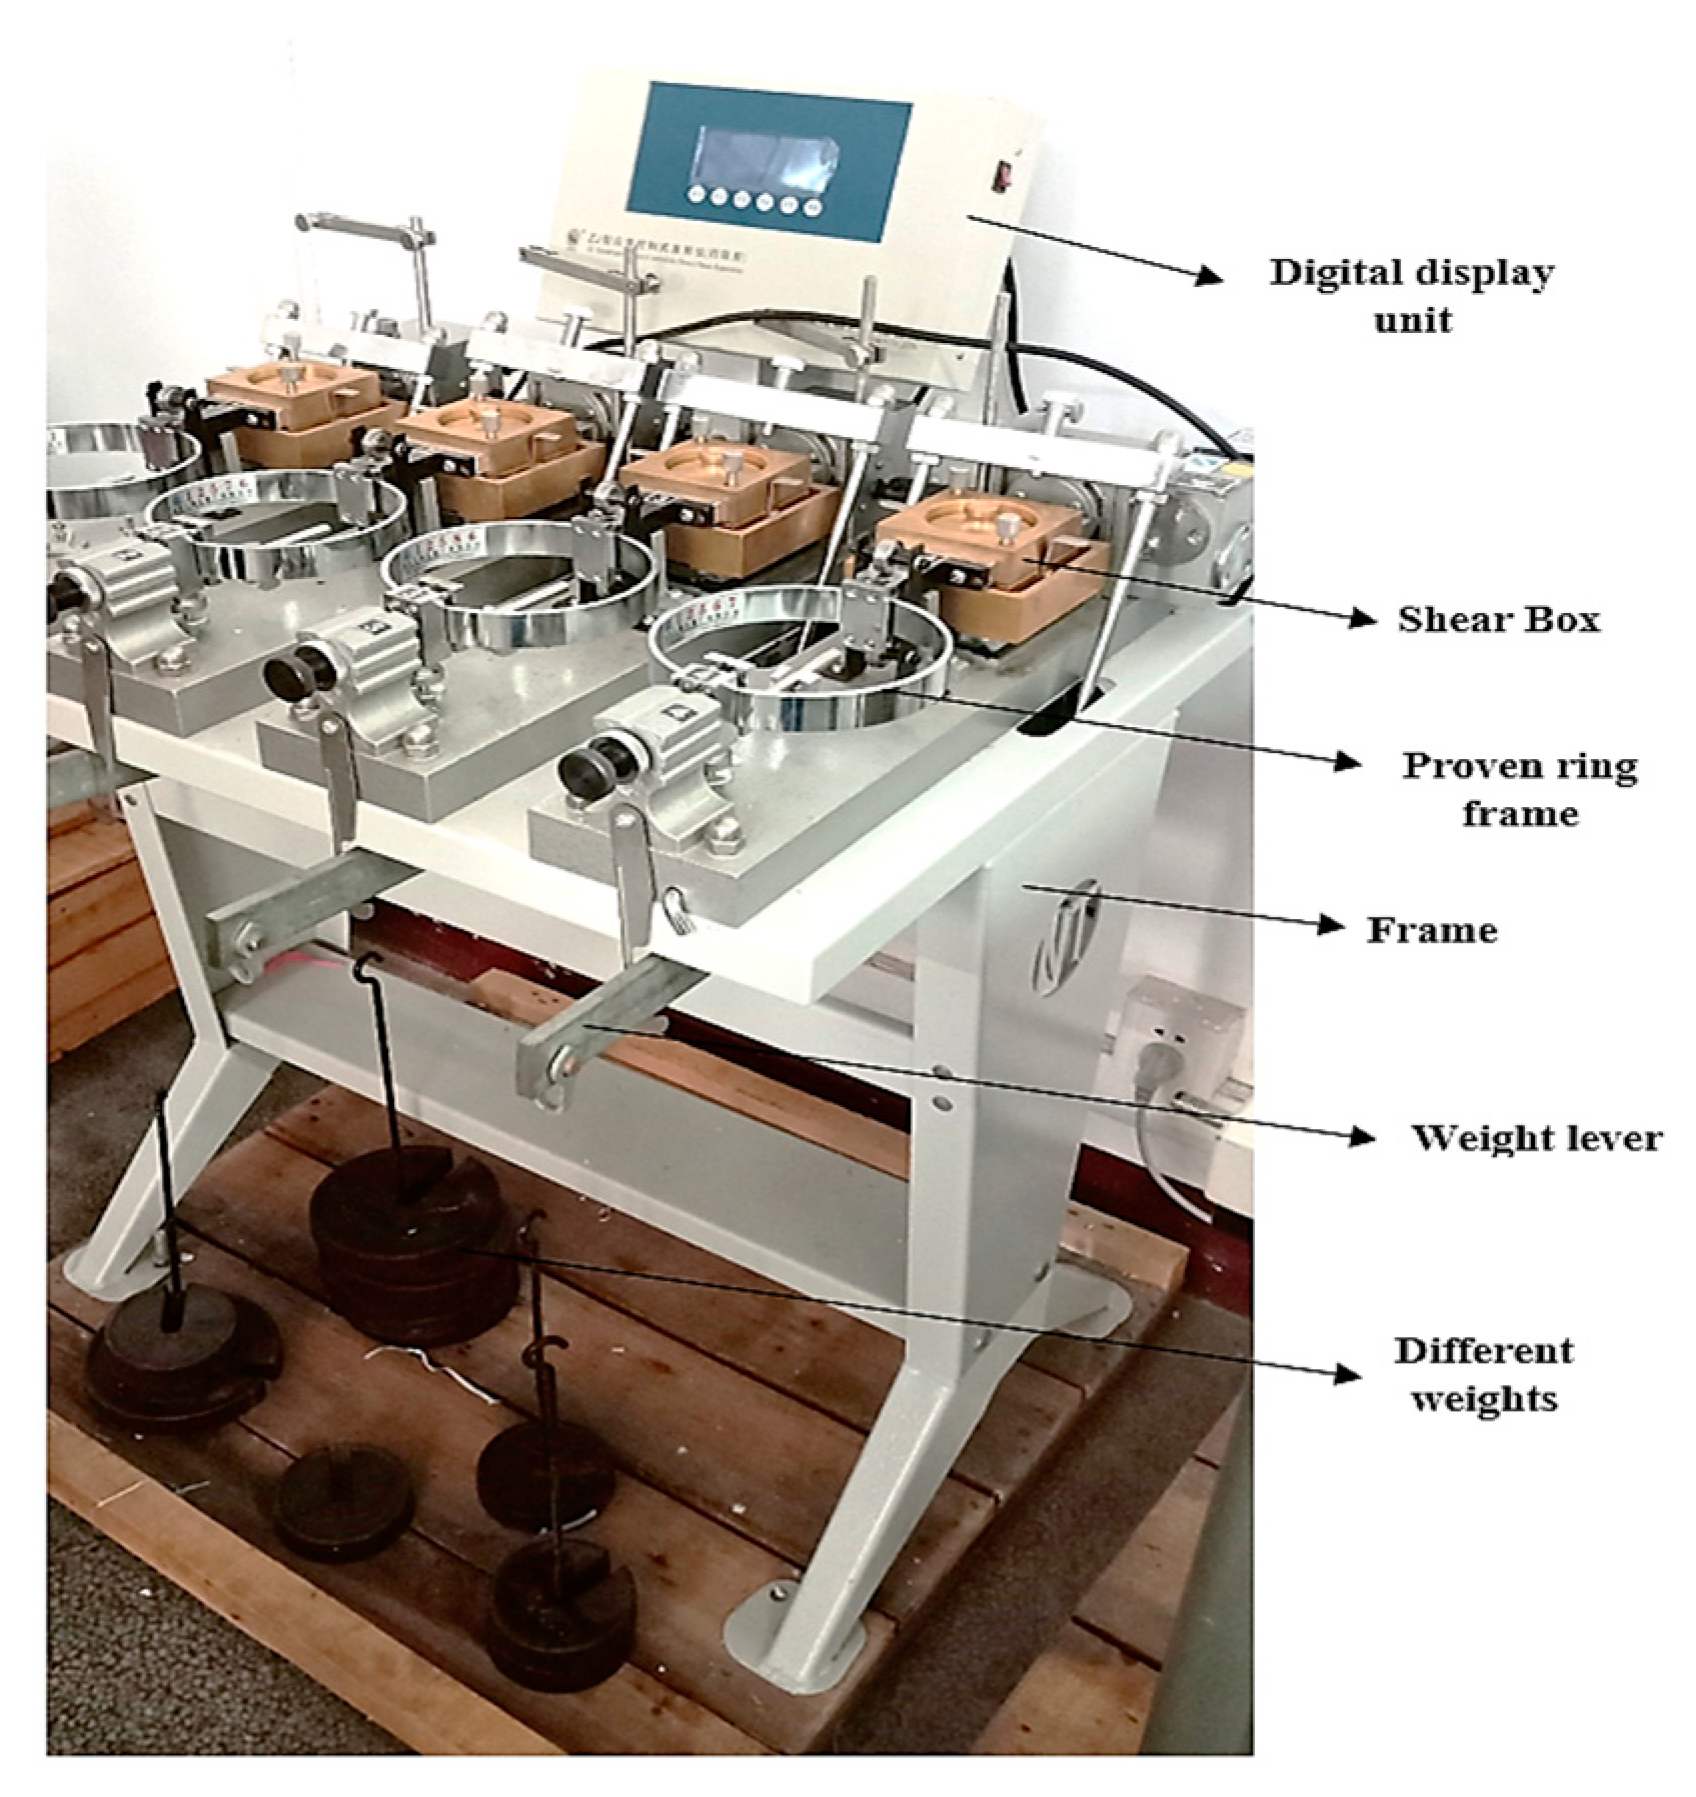
2.5. Direct Shear Test

The strength characteristics of soil were tested with a strain-controlled direct shear test equipment (ZJ Nanjing Soil Instrument Factory Co., Ltd. Nanjing, China Figure 3). The most important part of this device is the lower and upper blocks. The sample of soil is always put into the upper box; the lower box includes a circular soil or steel plate to check cohesion/adhesion and friction angle. A horizontal shear force is applied to the shear, and the shear stress during the failure of the soil sample was obtained under pressure. Furthermore, the shear strength (τ), internal friction angle (ϕ), and cohesion (C) of the soil were determined by Coulomb’s law (Equation 17).
τ = C + σ t a n ϕ

2.6. Penetration Test

The penetration test of soil was determined by the newly designed device (Figure 4 and Figure 5). The penetration test device consisted of a steel frame, wheels, soil bin (500 × 500 × 1500 mm), and penetration system. An AC gear motor with spur rack and speed control system (ASLONG-5F4, 120 W) was used to push the penetration plates into the soil. Penetration plates used for the experiment were 10 × 30 × 40 and 10 × 25 × 40 mm. The penetration test was repeated thrice for each moisture content. The design concept was in line with Tiwari et al. [22] in which a testing facility was designed and developed to determine the traction of the tire.

2.7. Data Acquisition and Analysis

The data acquisition system comprised the load cell (ATO-LCS-DYLY-106), linear displacement transducer (ATO-LDSR, 400 mm), DAQ device (Ni-6009), and LabVIEW software. The penetration force and sinkage were measured by a load cell and linear displacement transducer, respectively. Data acquisition was made by the DAQ device with help of LabVIEW. The Origin (version 2018) software was used for data analysis and the gauss-newton method was used for non-linear curve fitting.

3. Results and Discussion

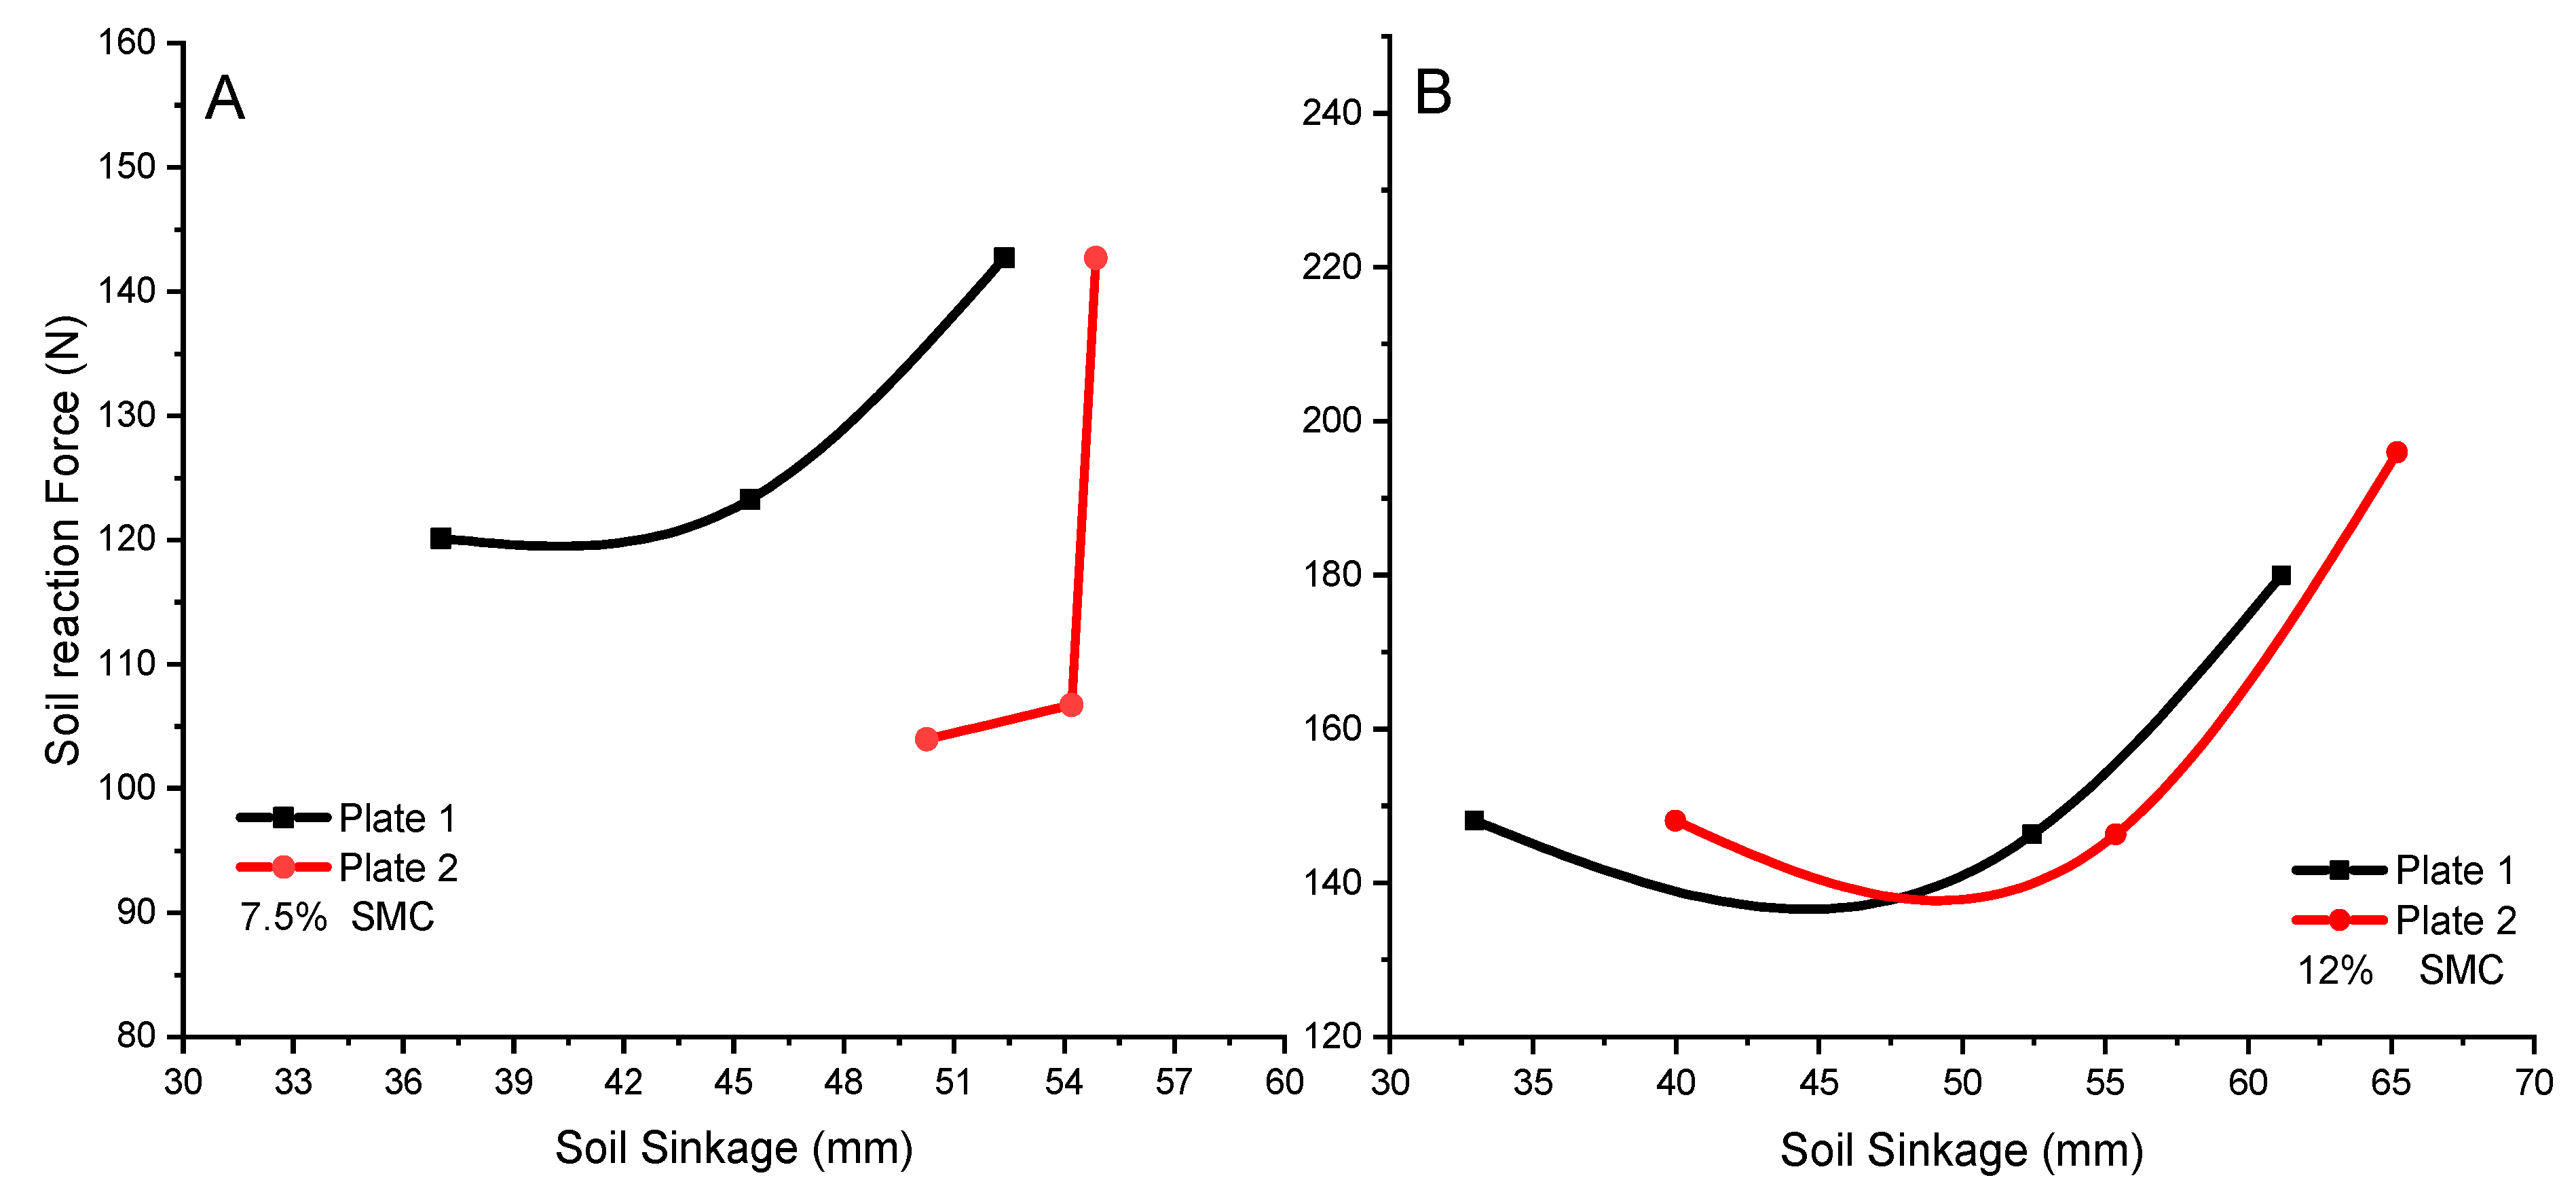
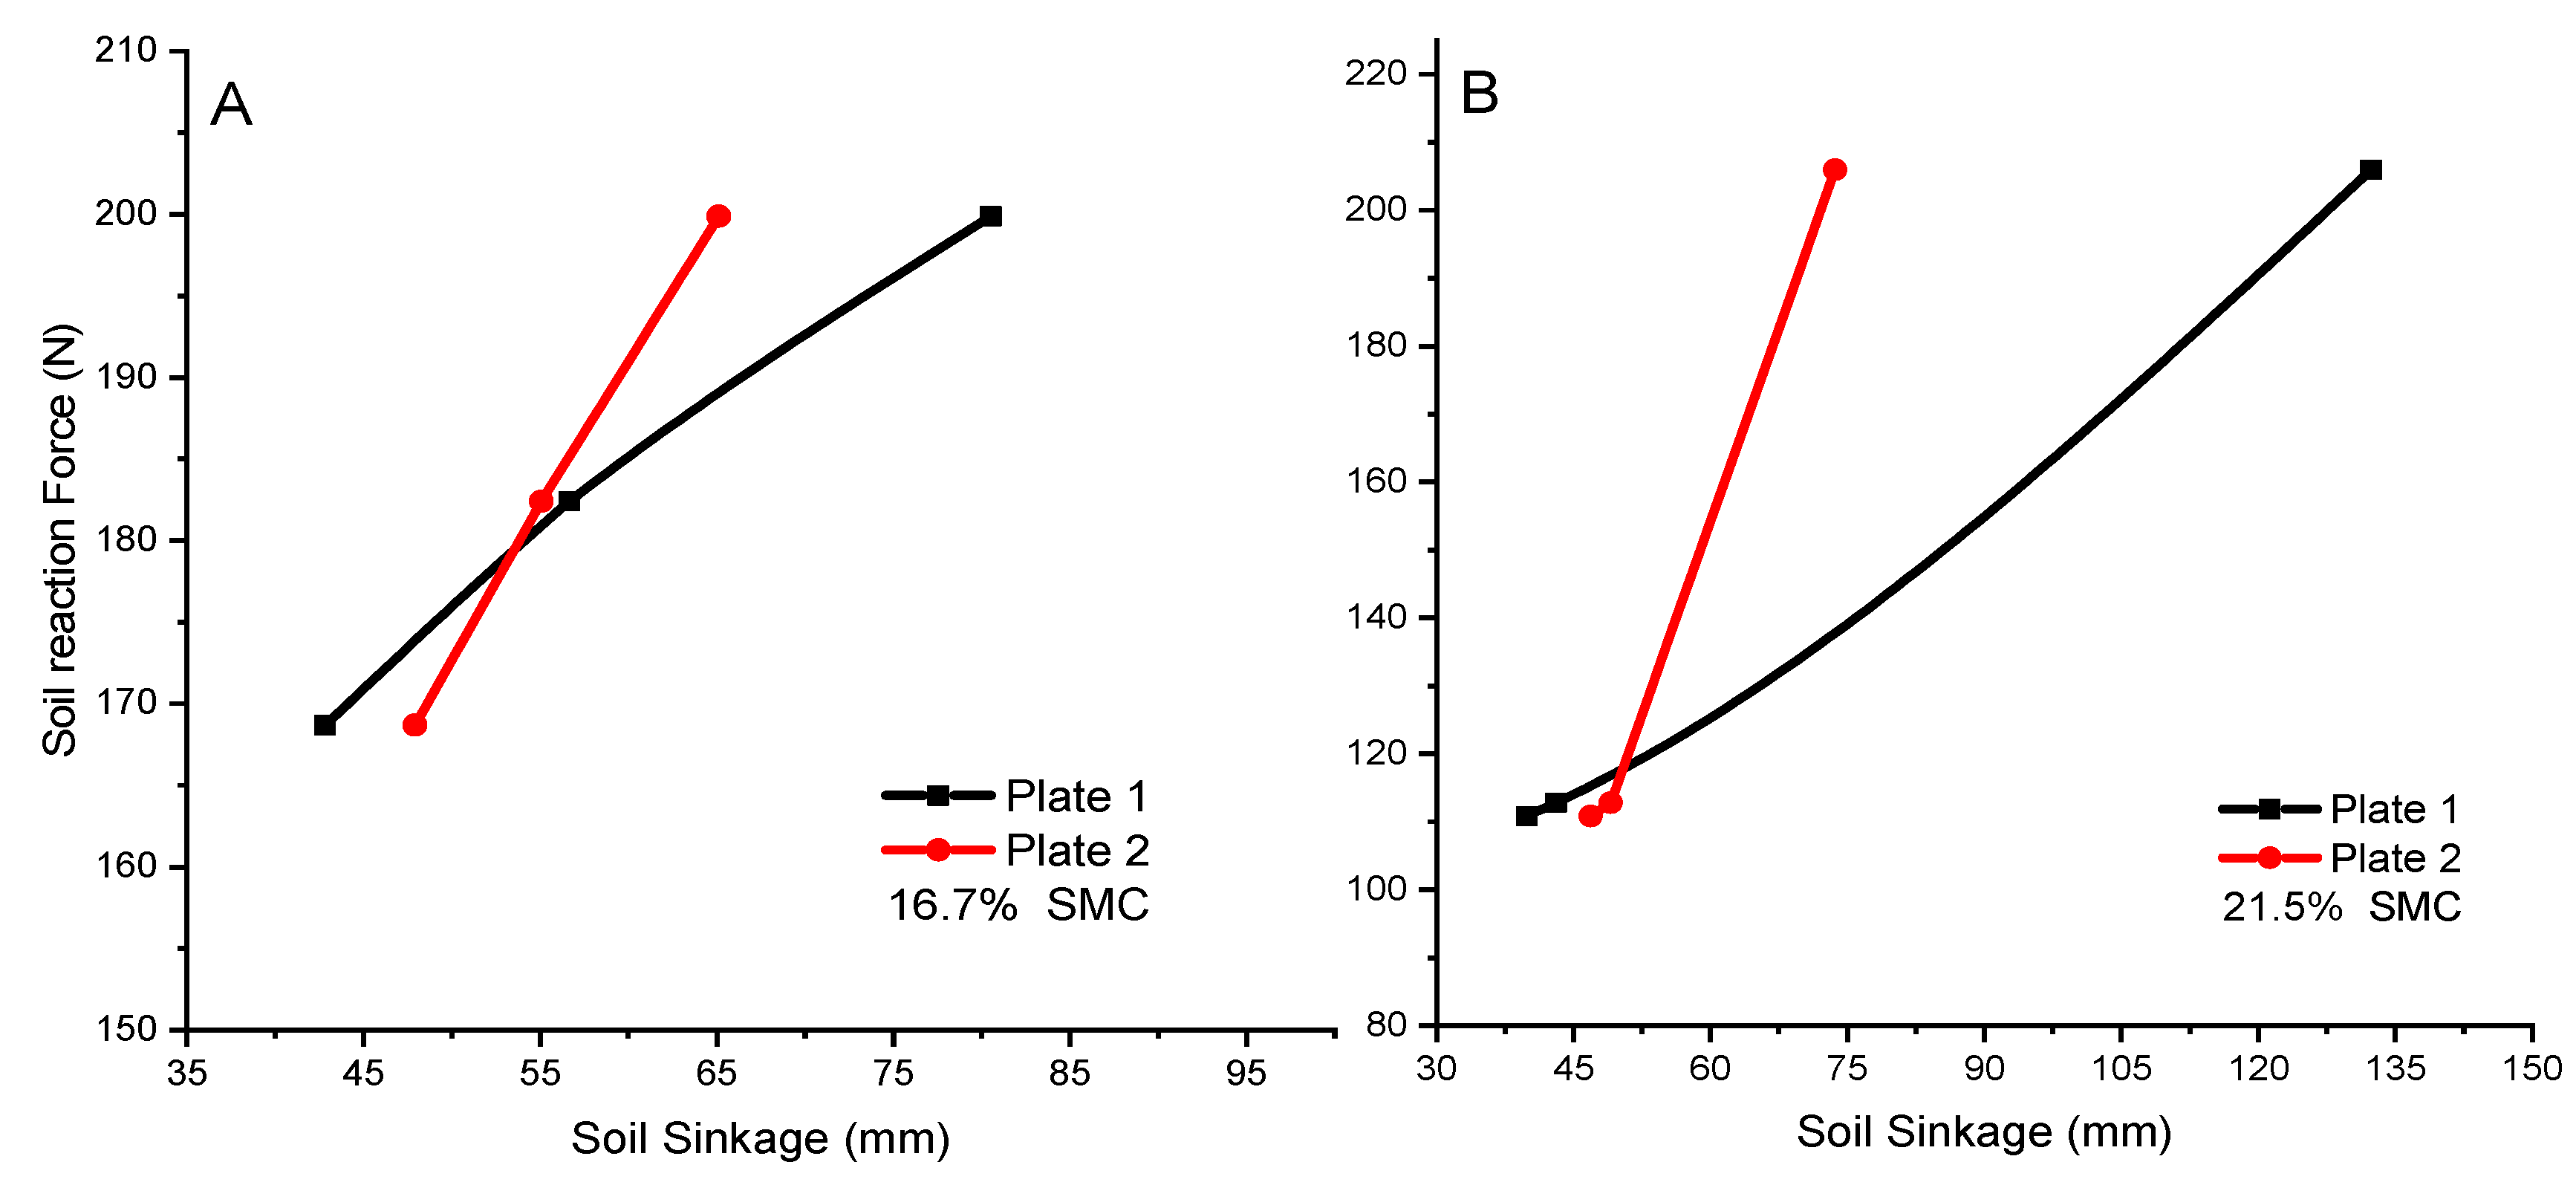
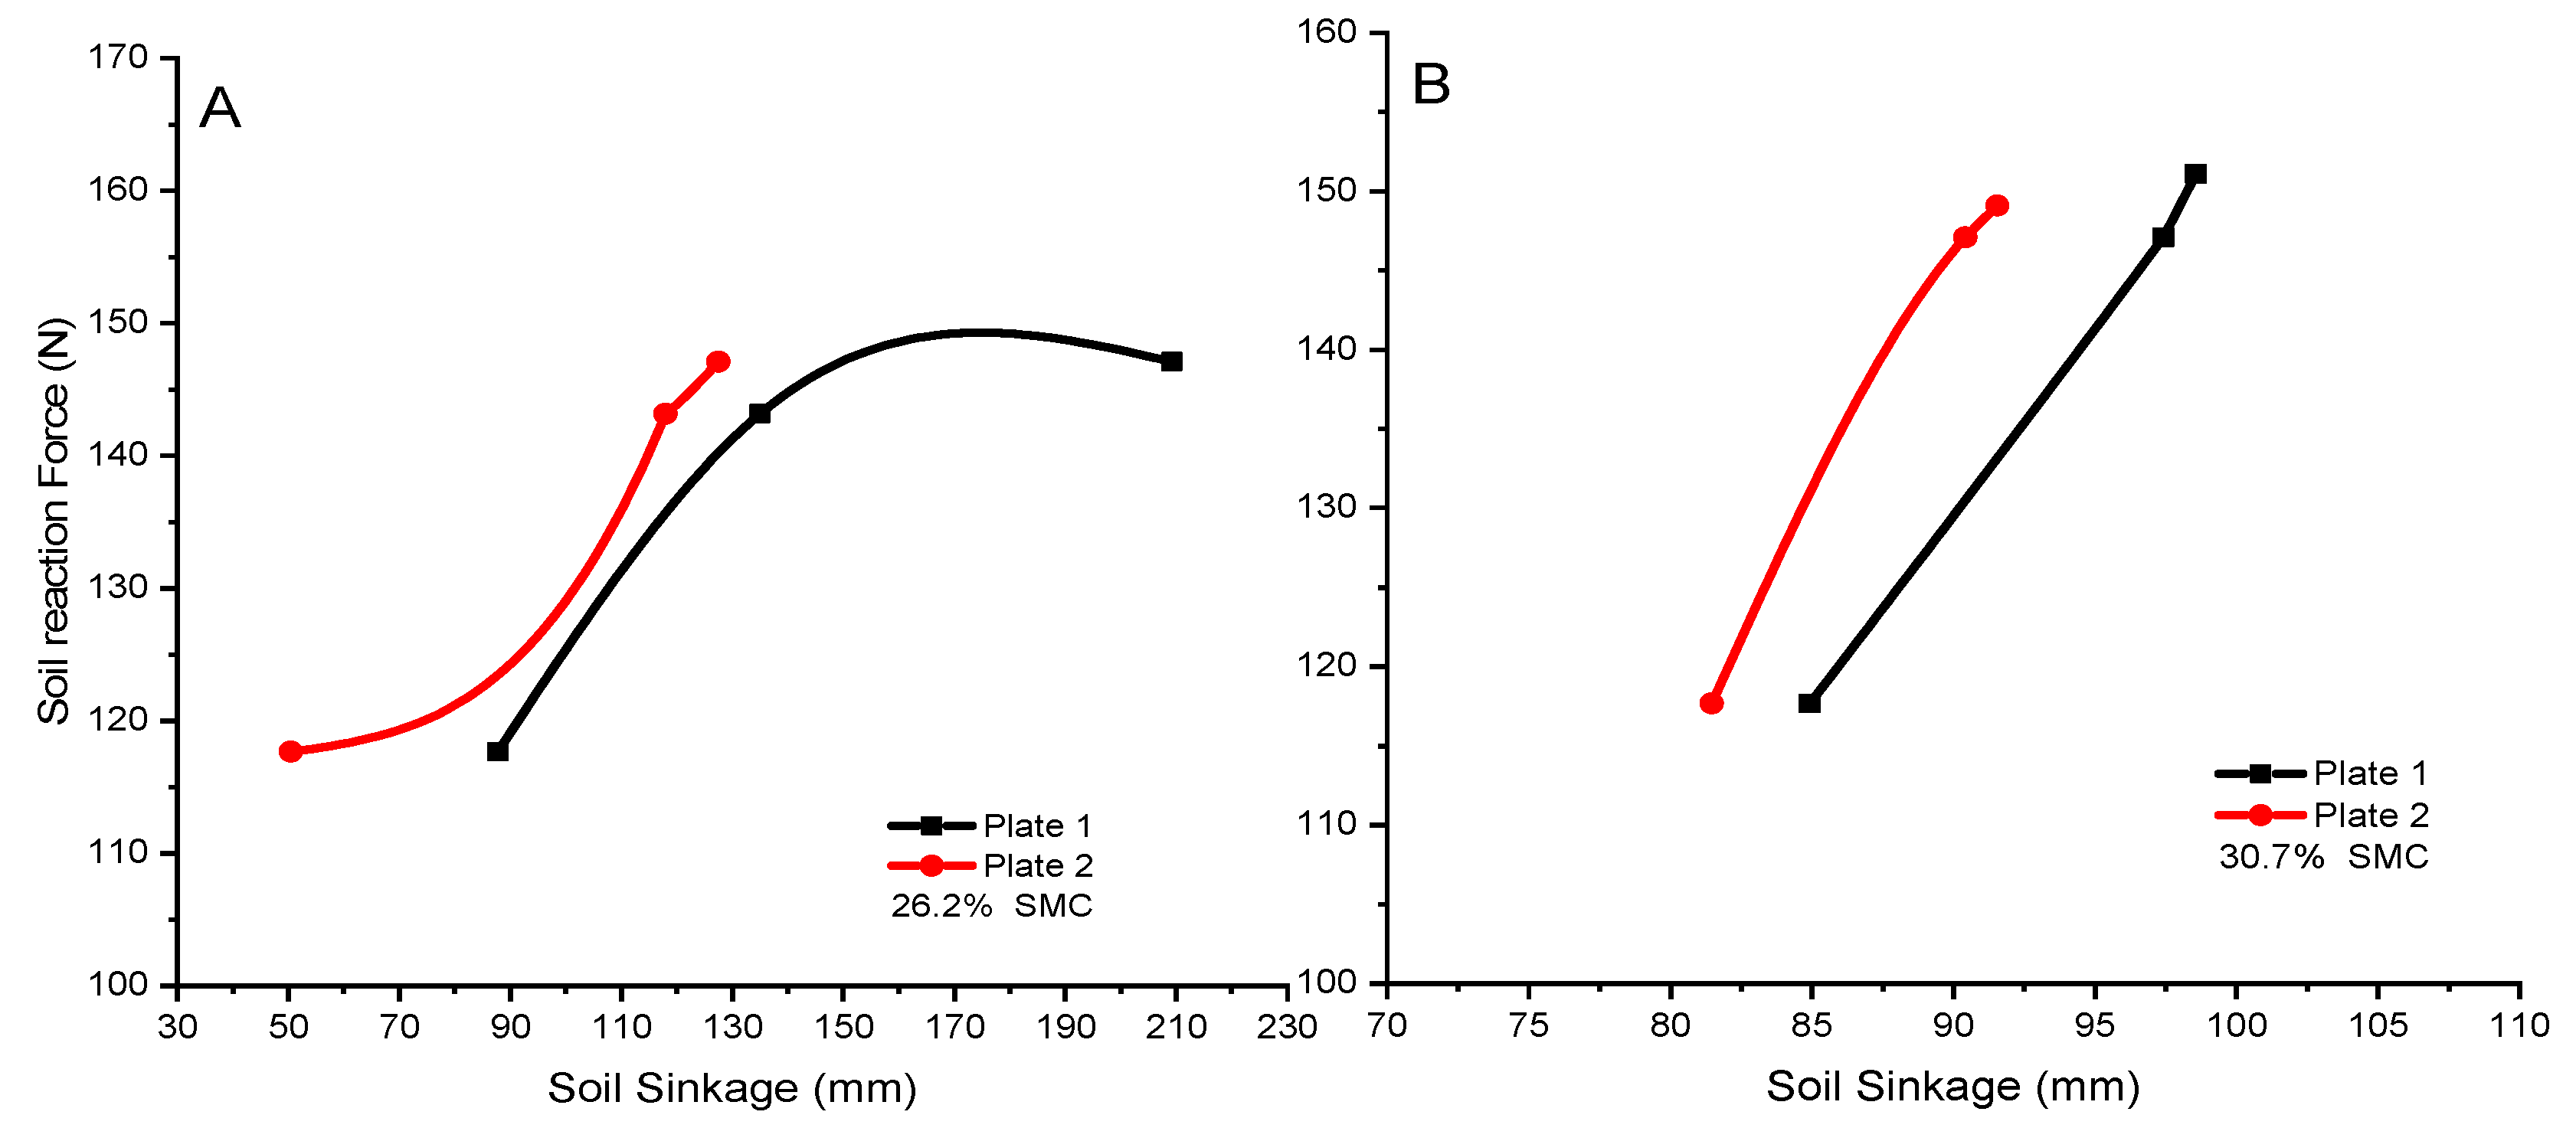
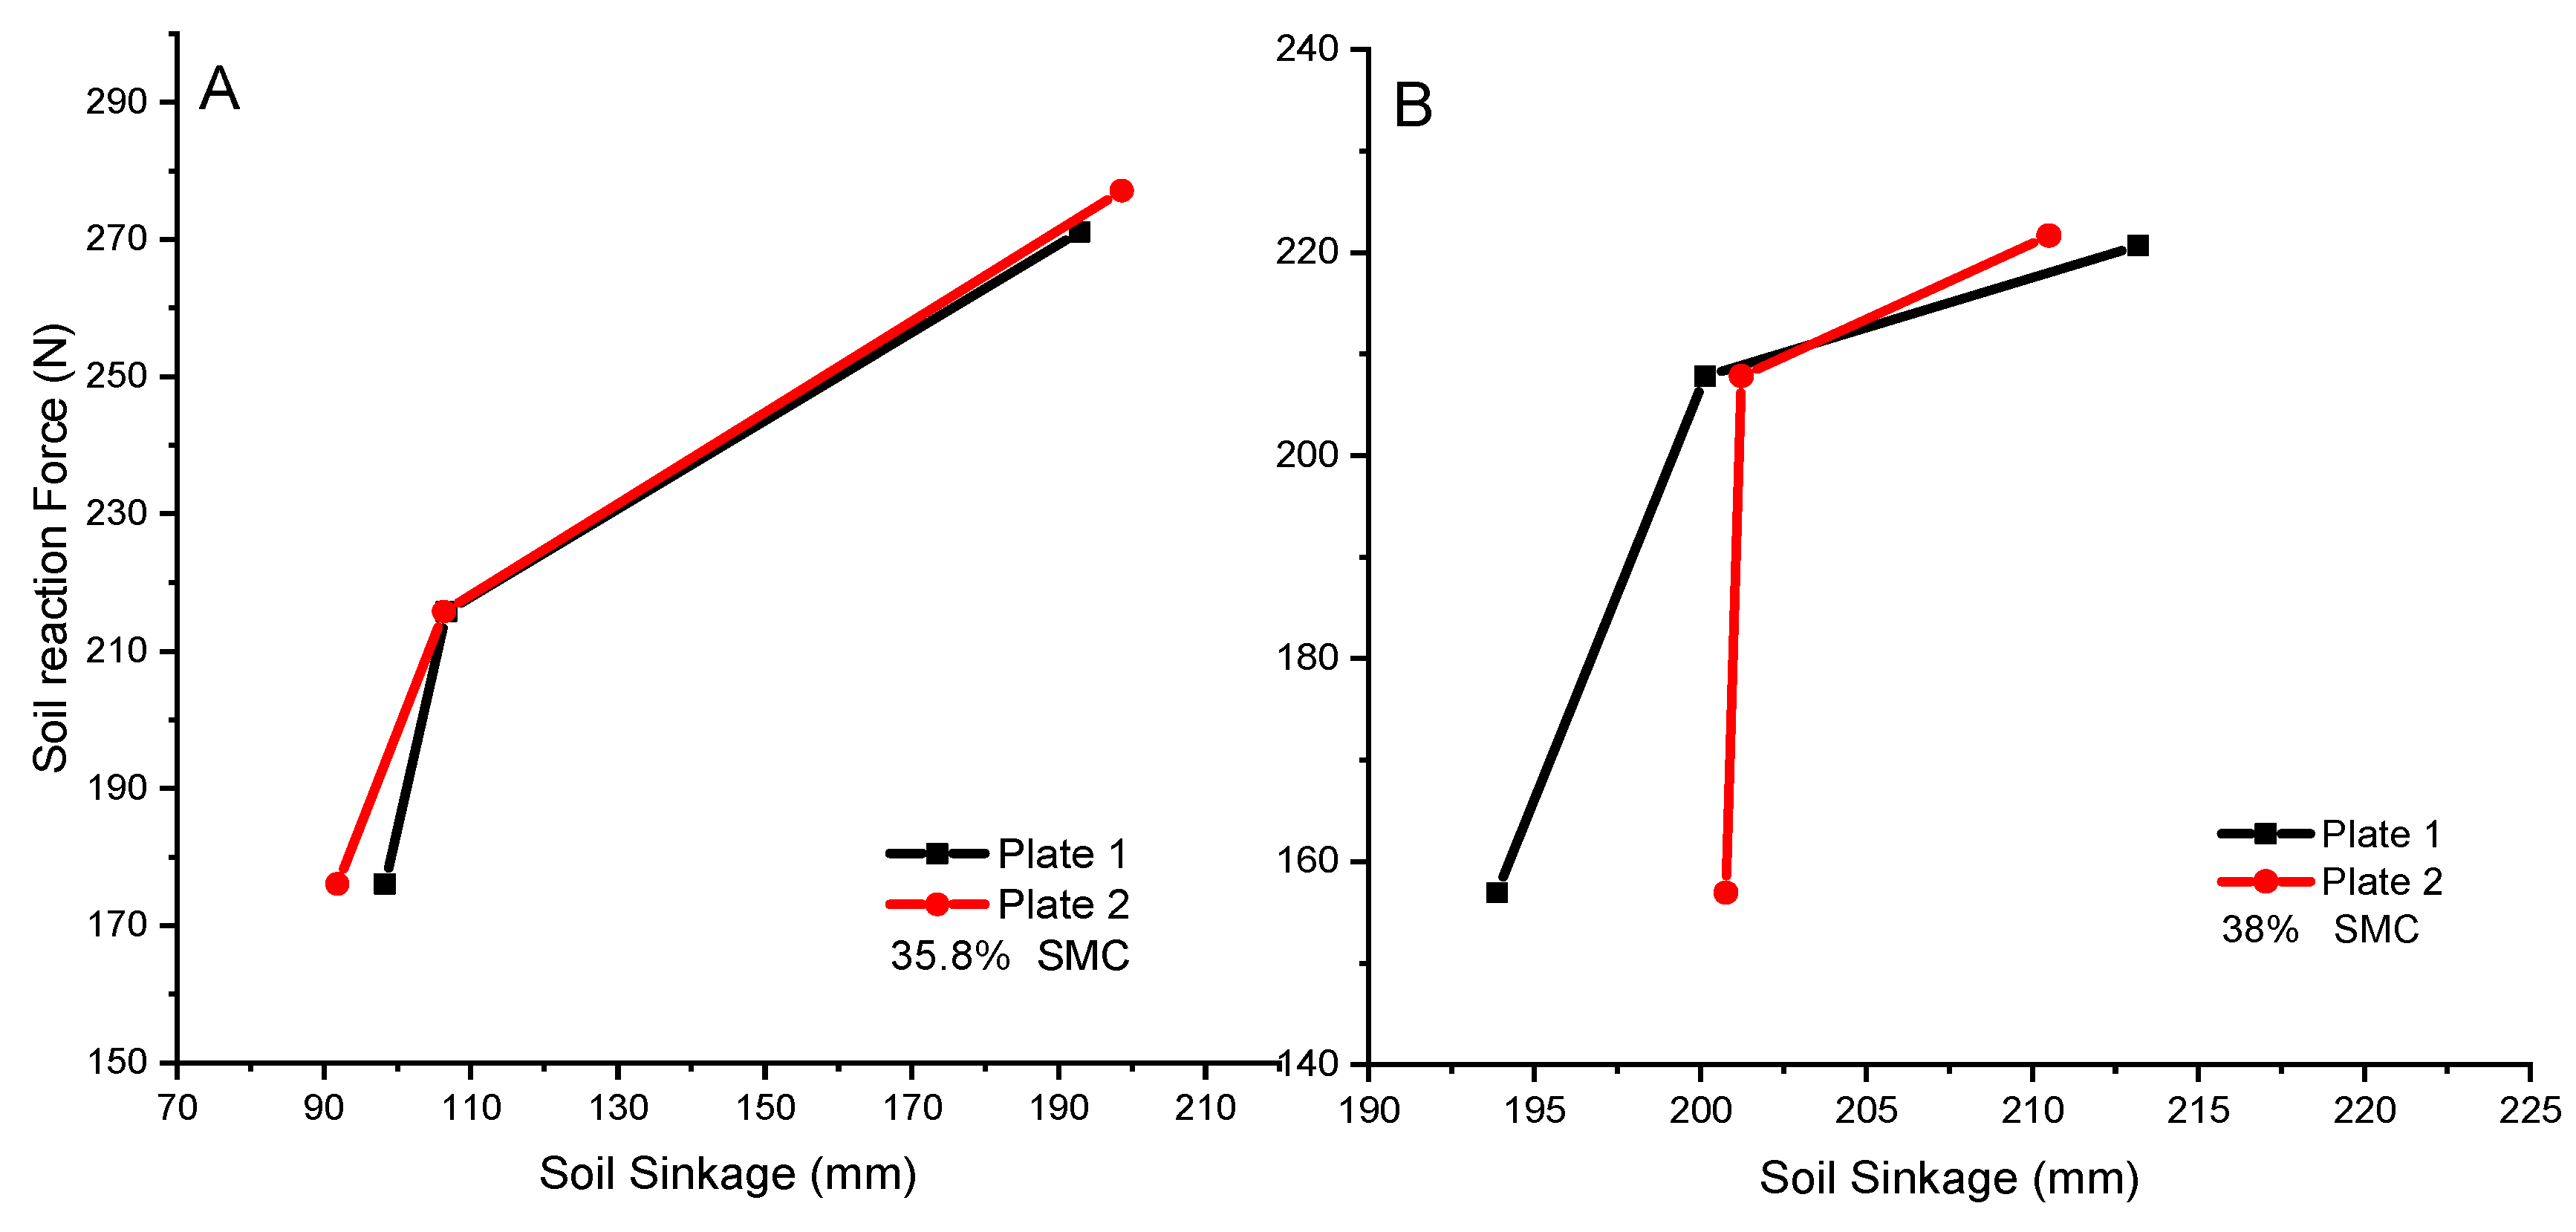
3.1. Soil Reaction Force and Soil Sinkage

The assumption for the soil reaction force/pressure sinkage test was similar to traditional bevameter. The test results of soil reaction force and sinkage were obtained by penetration test with two different sized plates for eight levels of moisture contents (7.5, 12, 16.7, 21.5, 26.2, 30.7, 35.8, and 38%, respectively) (Figure 6, Figure 7, Figure 8 and Figure 9). Obtained results showed the comparative trend over both penetration plates at all the moisture contents. The average maximum sinkage for plates 1 and 2 was 202.405 and 204.178 mm at 38% and the minimum was 44.942 and 53.103 mm at 7.5% soil moisture content, respectively. Similarly, the greater force soil reaction force was 195.126 and 195.465 N at 38% and smaller was 128.7 and 117.782 N at 7.5% moisture content for plates 1 and 2, respectively. Consequently, the soil sinkage increased with an increase in soil moisture content, the reason being that the soil becomes softer with the addition of water, thus allowing the plate to penetrate more quickly in soil and resulting more sinkage. The increase trend was observed over moisture contents for both plates. The overall results of sinkage and soil reaction force/pressure were found significant (p < 0.05). The main effect of soil sinkage on moisture content was observed by 38%. The same findings have been recorded previously that plate sinkage with high moisture content is increased [23]. At 35% moisture content the plate sinkage was high [24]. The maximum sinkage varied linearly with the pressure applied in moist soil [25]. When the soil reaction force increases the soil sinkage increases [6,26,27,28,29,30].

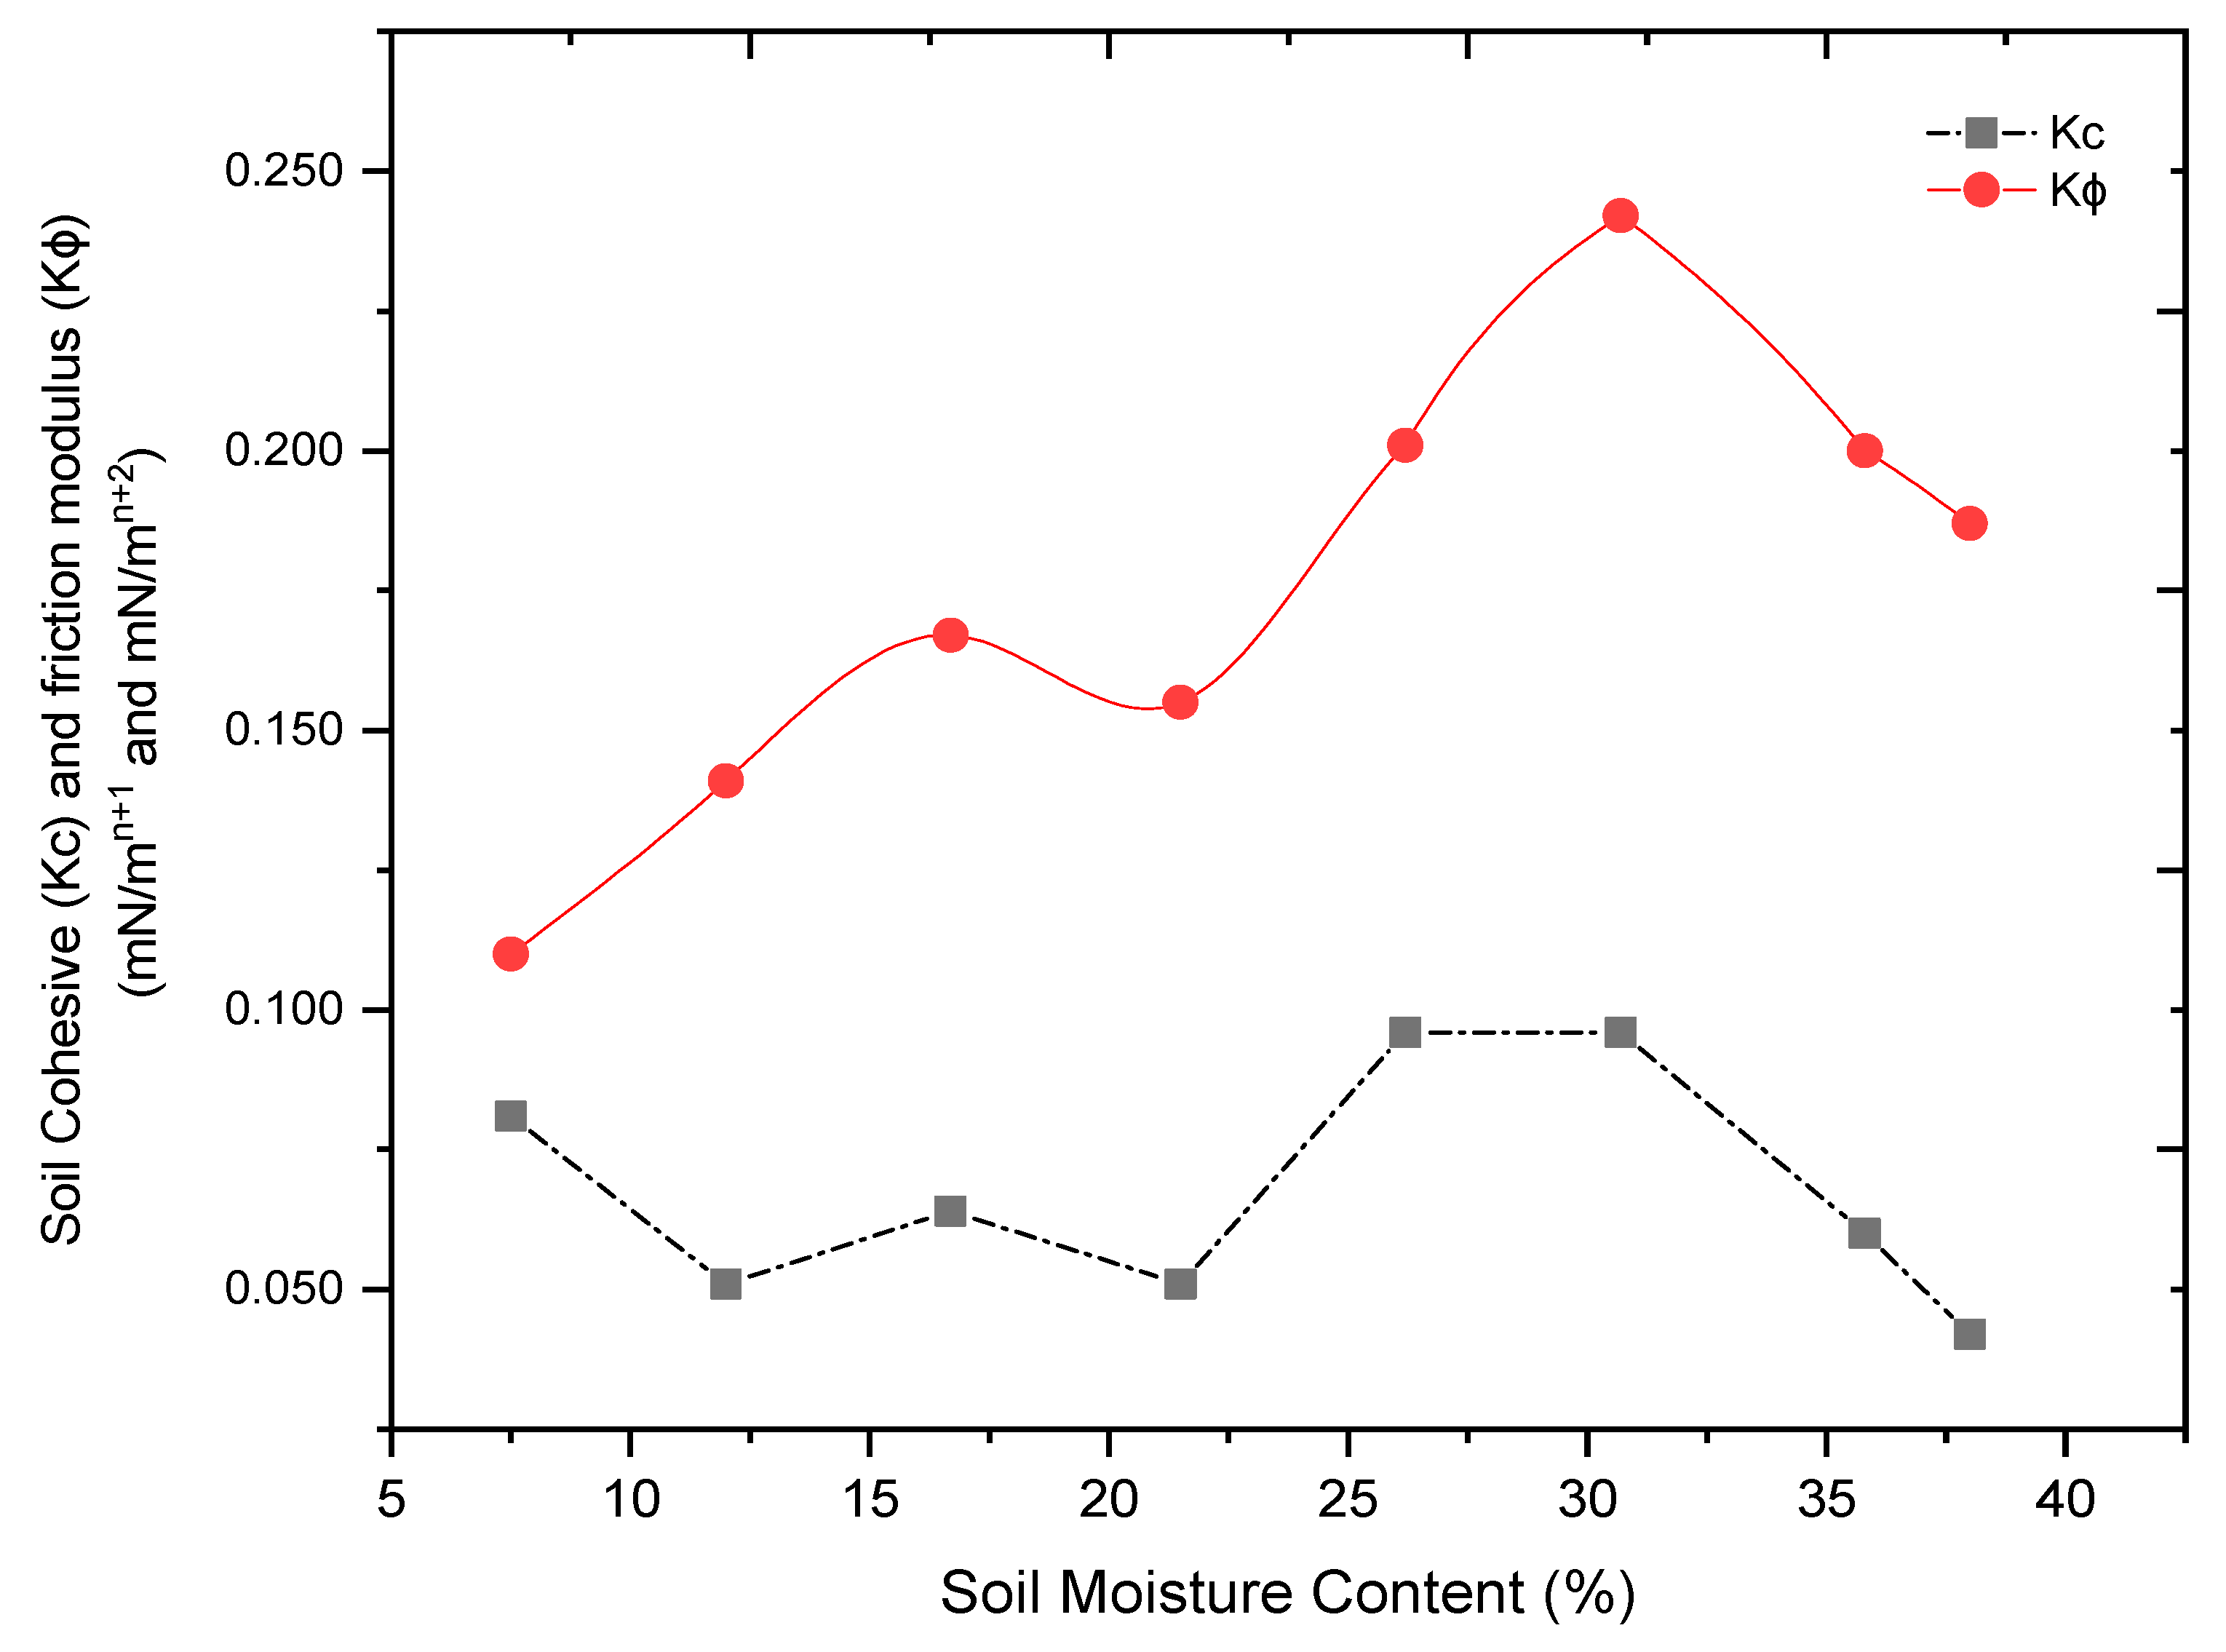
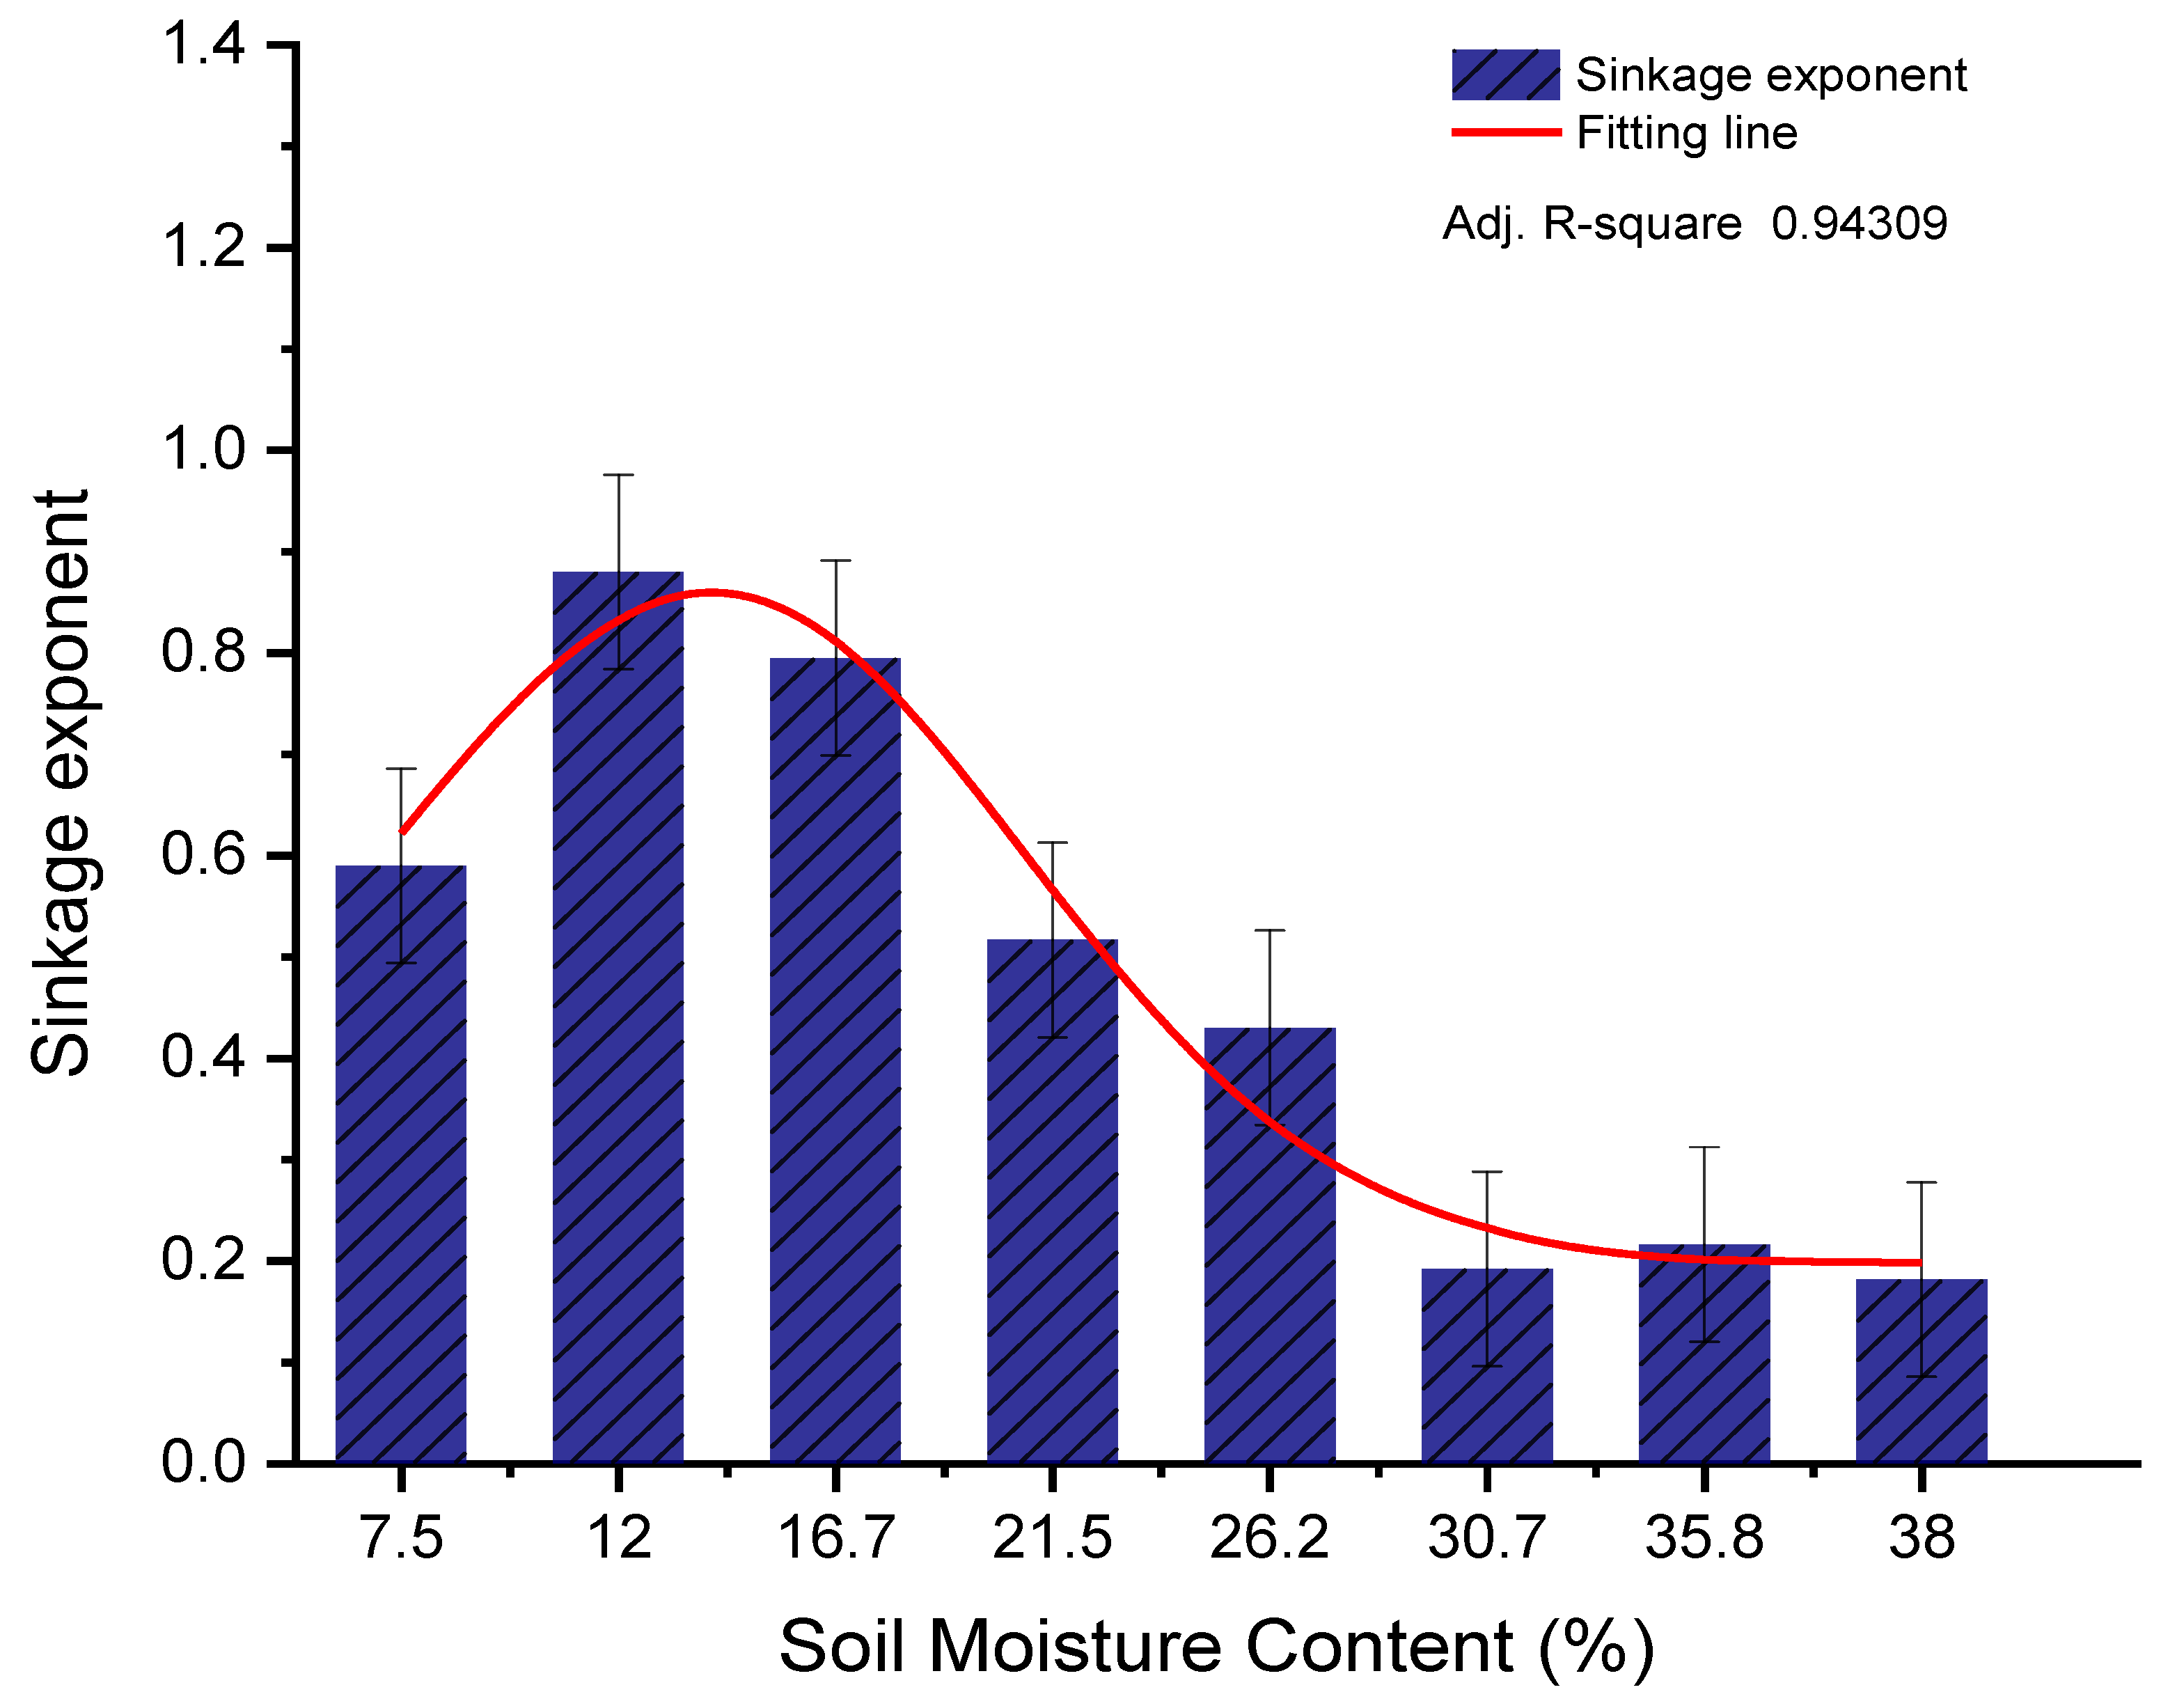
3.2. Soil Cohesion Modulus (Kc), Friction Modulus (Kϕ), and Sinkage Exponent (n) at Moisture Contents

The Bekker’s pressure sinkage model parameters, including soil cohesion modulus (Kc), soil friction modulus (), and sinkage exponent (n) were derived after penetration test for eight moisture content. The relationship between soil cohesion and friction modulus is shown in Figure 10. The values of both parameters were initially increased with an increase in moisture content to 30.7% and then began decreasing until the final moisture content 38%. The findings of the tests suggest that the effect of the water content on the soil cohesive modulus is not apparent. Forces between soil particles may influence the cohesive properties of soil; furthermore, the interaction between soil moisture content and various forces may differ. For the friction modulus of soil, initially, a rapid increase followed by a gradual increase with the increase in moisture content was observed.
The maximum soil cohesion and friction modulus were 0.096 mN/mn+1 and 0.242 mN/mn+2 recorded at 30.7% soil moisture content. Similarly, the minimum Kc was 0.042 mN/mn+1 at 38% and Kϕ were 0.110 mN/mn+2 observed at 7.5% moisture content. The sinkage exponent (Figure 11) of soil was increased when the moisture content increased to 12%, then gradually decreased with an increase in moisture content to 38%. The effect of pore pressure build-up may be the internal cause of this phenomenon. The rise of the sinkage exponent indicates the increase in sinkage of the vehicle under the same pressure. The adjusted R square of sinkage exponent was 0.94309 found by non-linear curve fitting using the Gauss model. The present results are in close agreement with previously reported that the soil cohesive and friction modulus increased with the increase in the moisture content to a certain level, and after that, it decreased with the increase in the moisture [24,31,32,33,34].

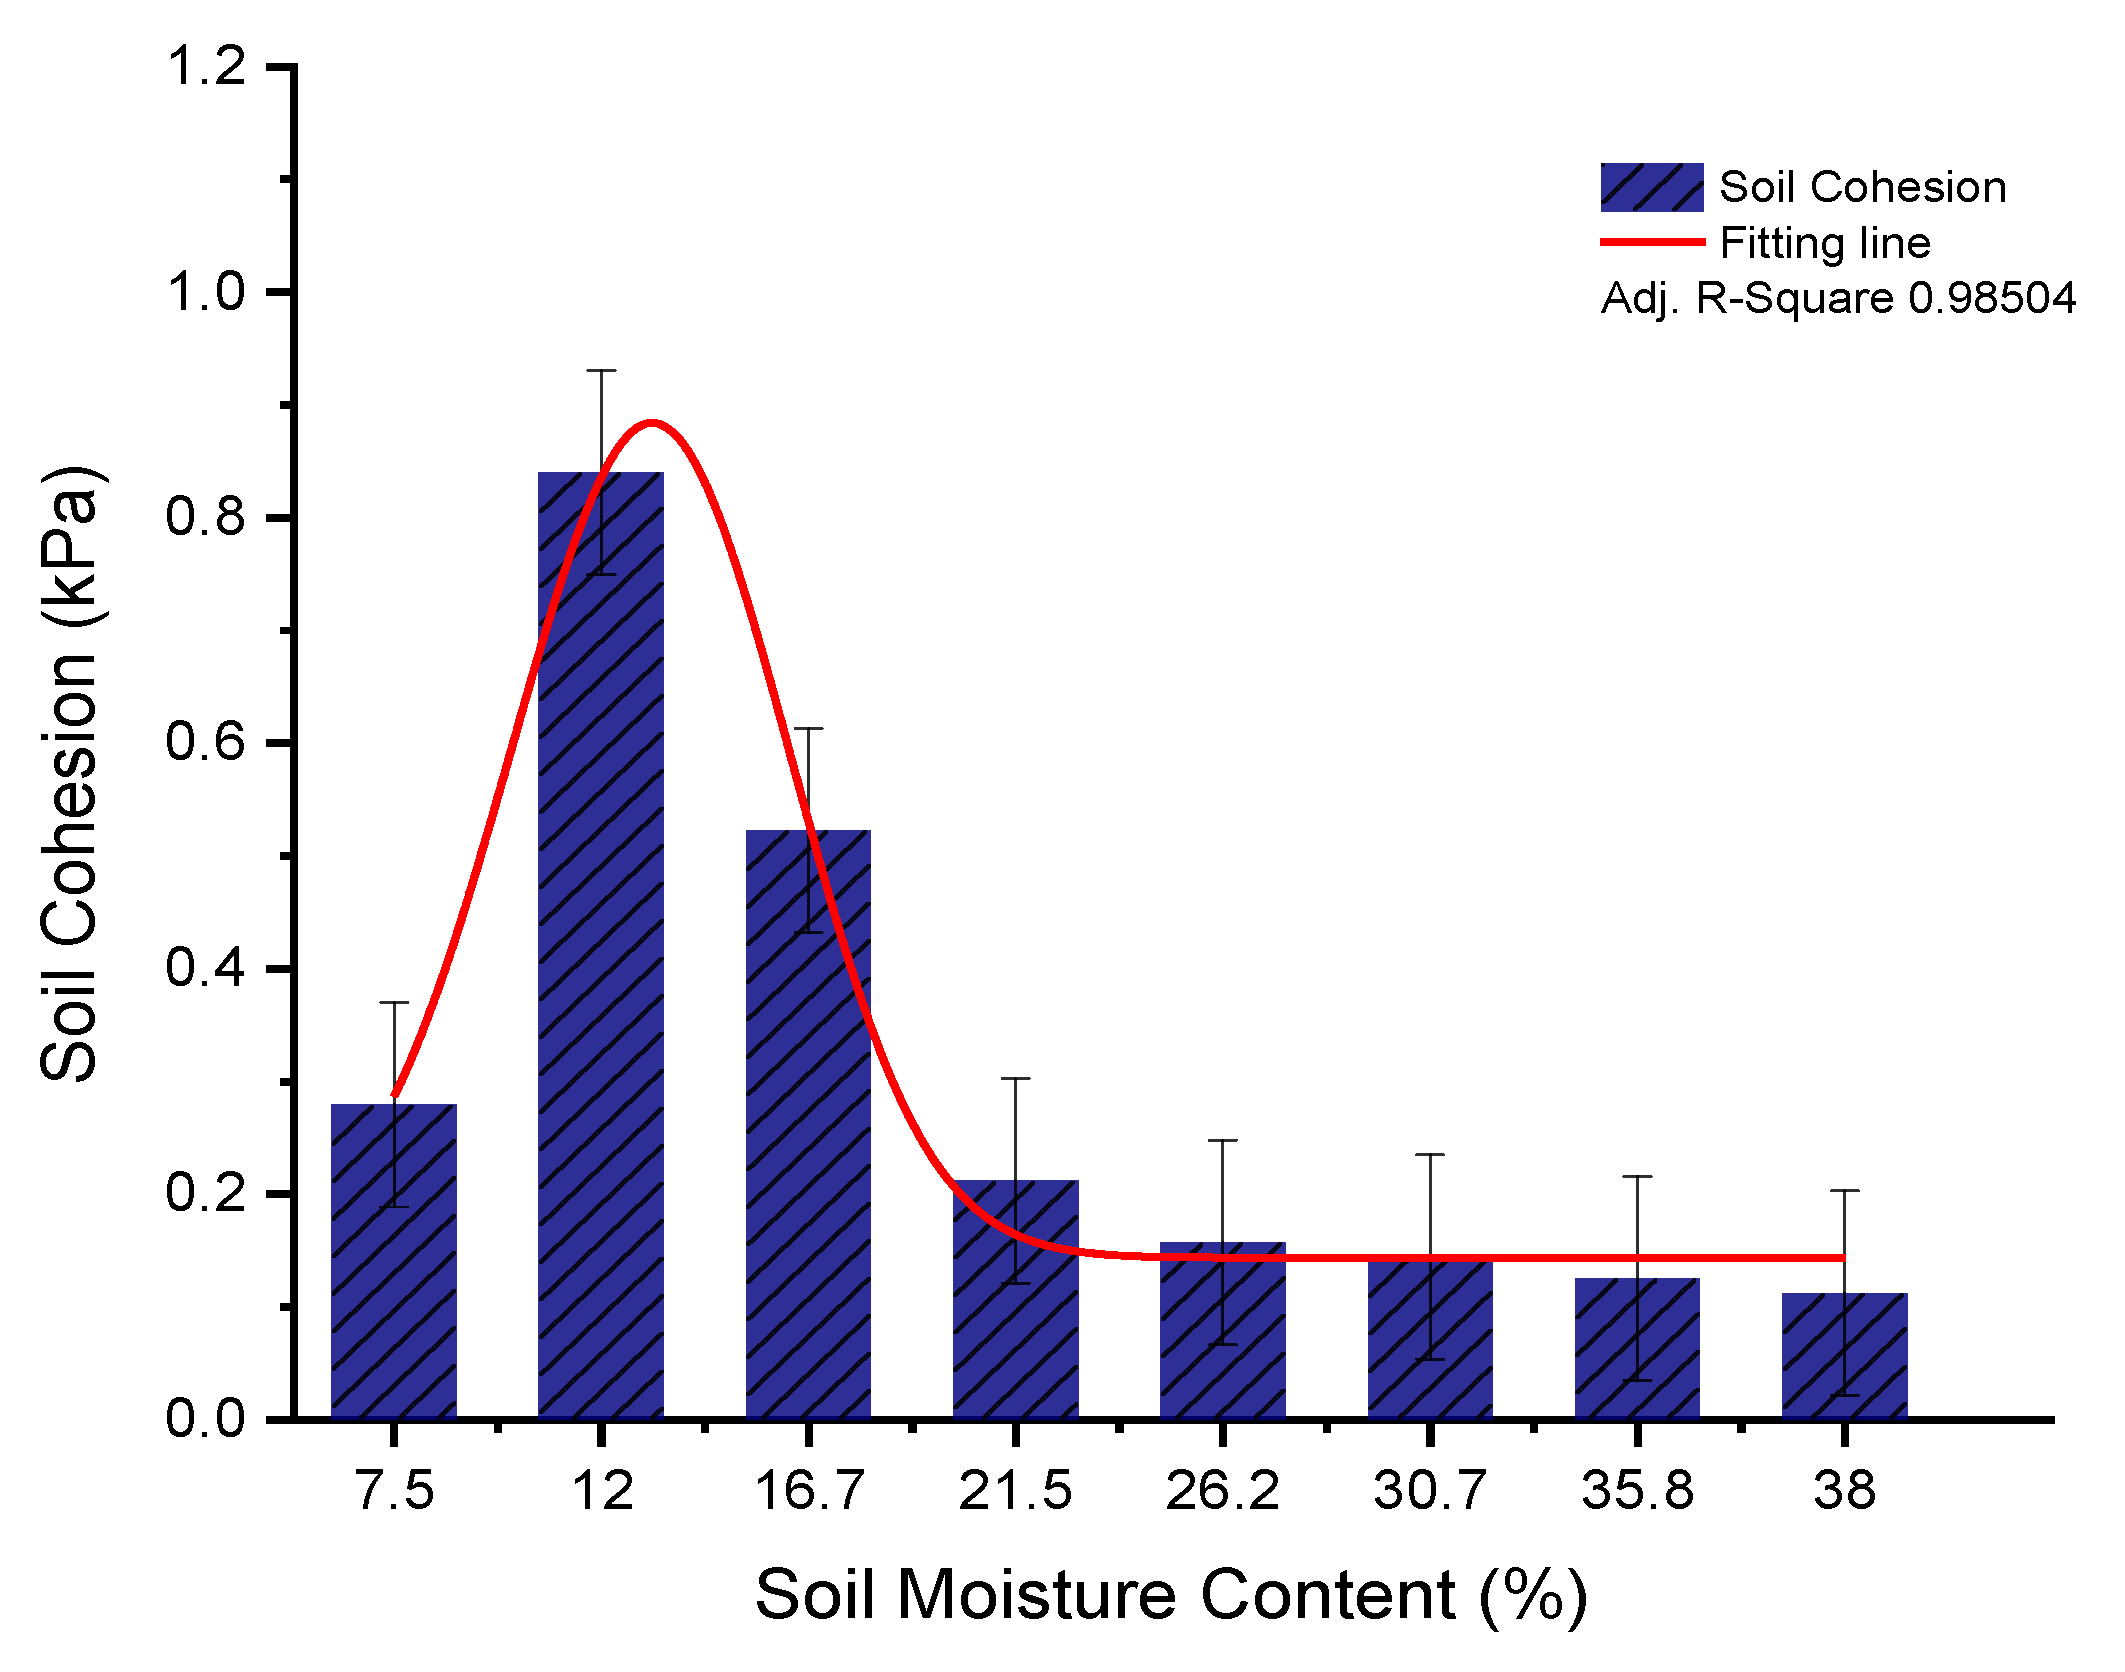
3.3. The Cohesion of Soil (C) at Different Moisture Contents

The experimental results of soil cohesion were obtained by direct shear test for eight moisture contents (Figure 12). The plot showed the rapid rise in cohesion with moisture content until 12%, then it was gradually dropped with further increase in soil moisture content. The mean maximum cohesion was 0.84 kPa at 12% while a minimum 0.112 kPa at 35.8% moisture content. The non-linear curve fitting was performed by Gauss model. the adj. R-square of soil cohesion was 0.98504. The present results are in line with Jun et.al, who found the increase in cohesion with moisture content until certain values then begin decrease in cohesion [35,36,37]. Other studies reported the significant effect of soil mechanical properties on moisture content [38,39].

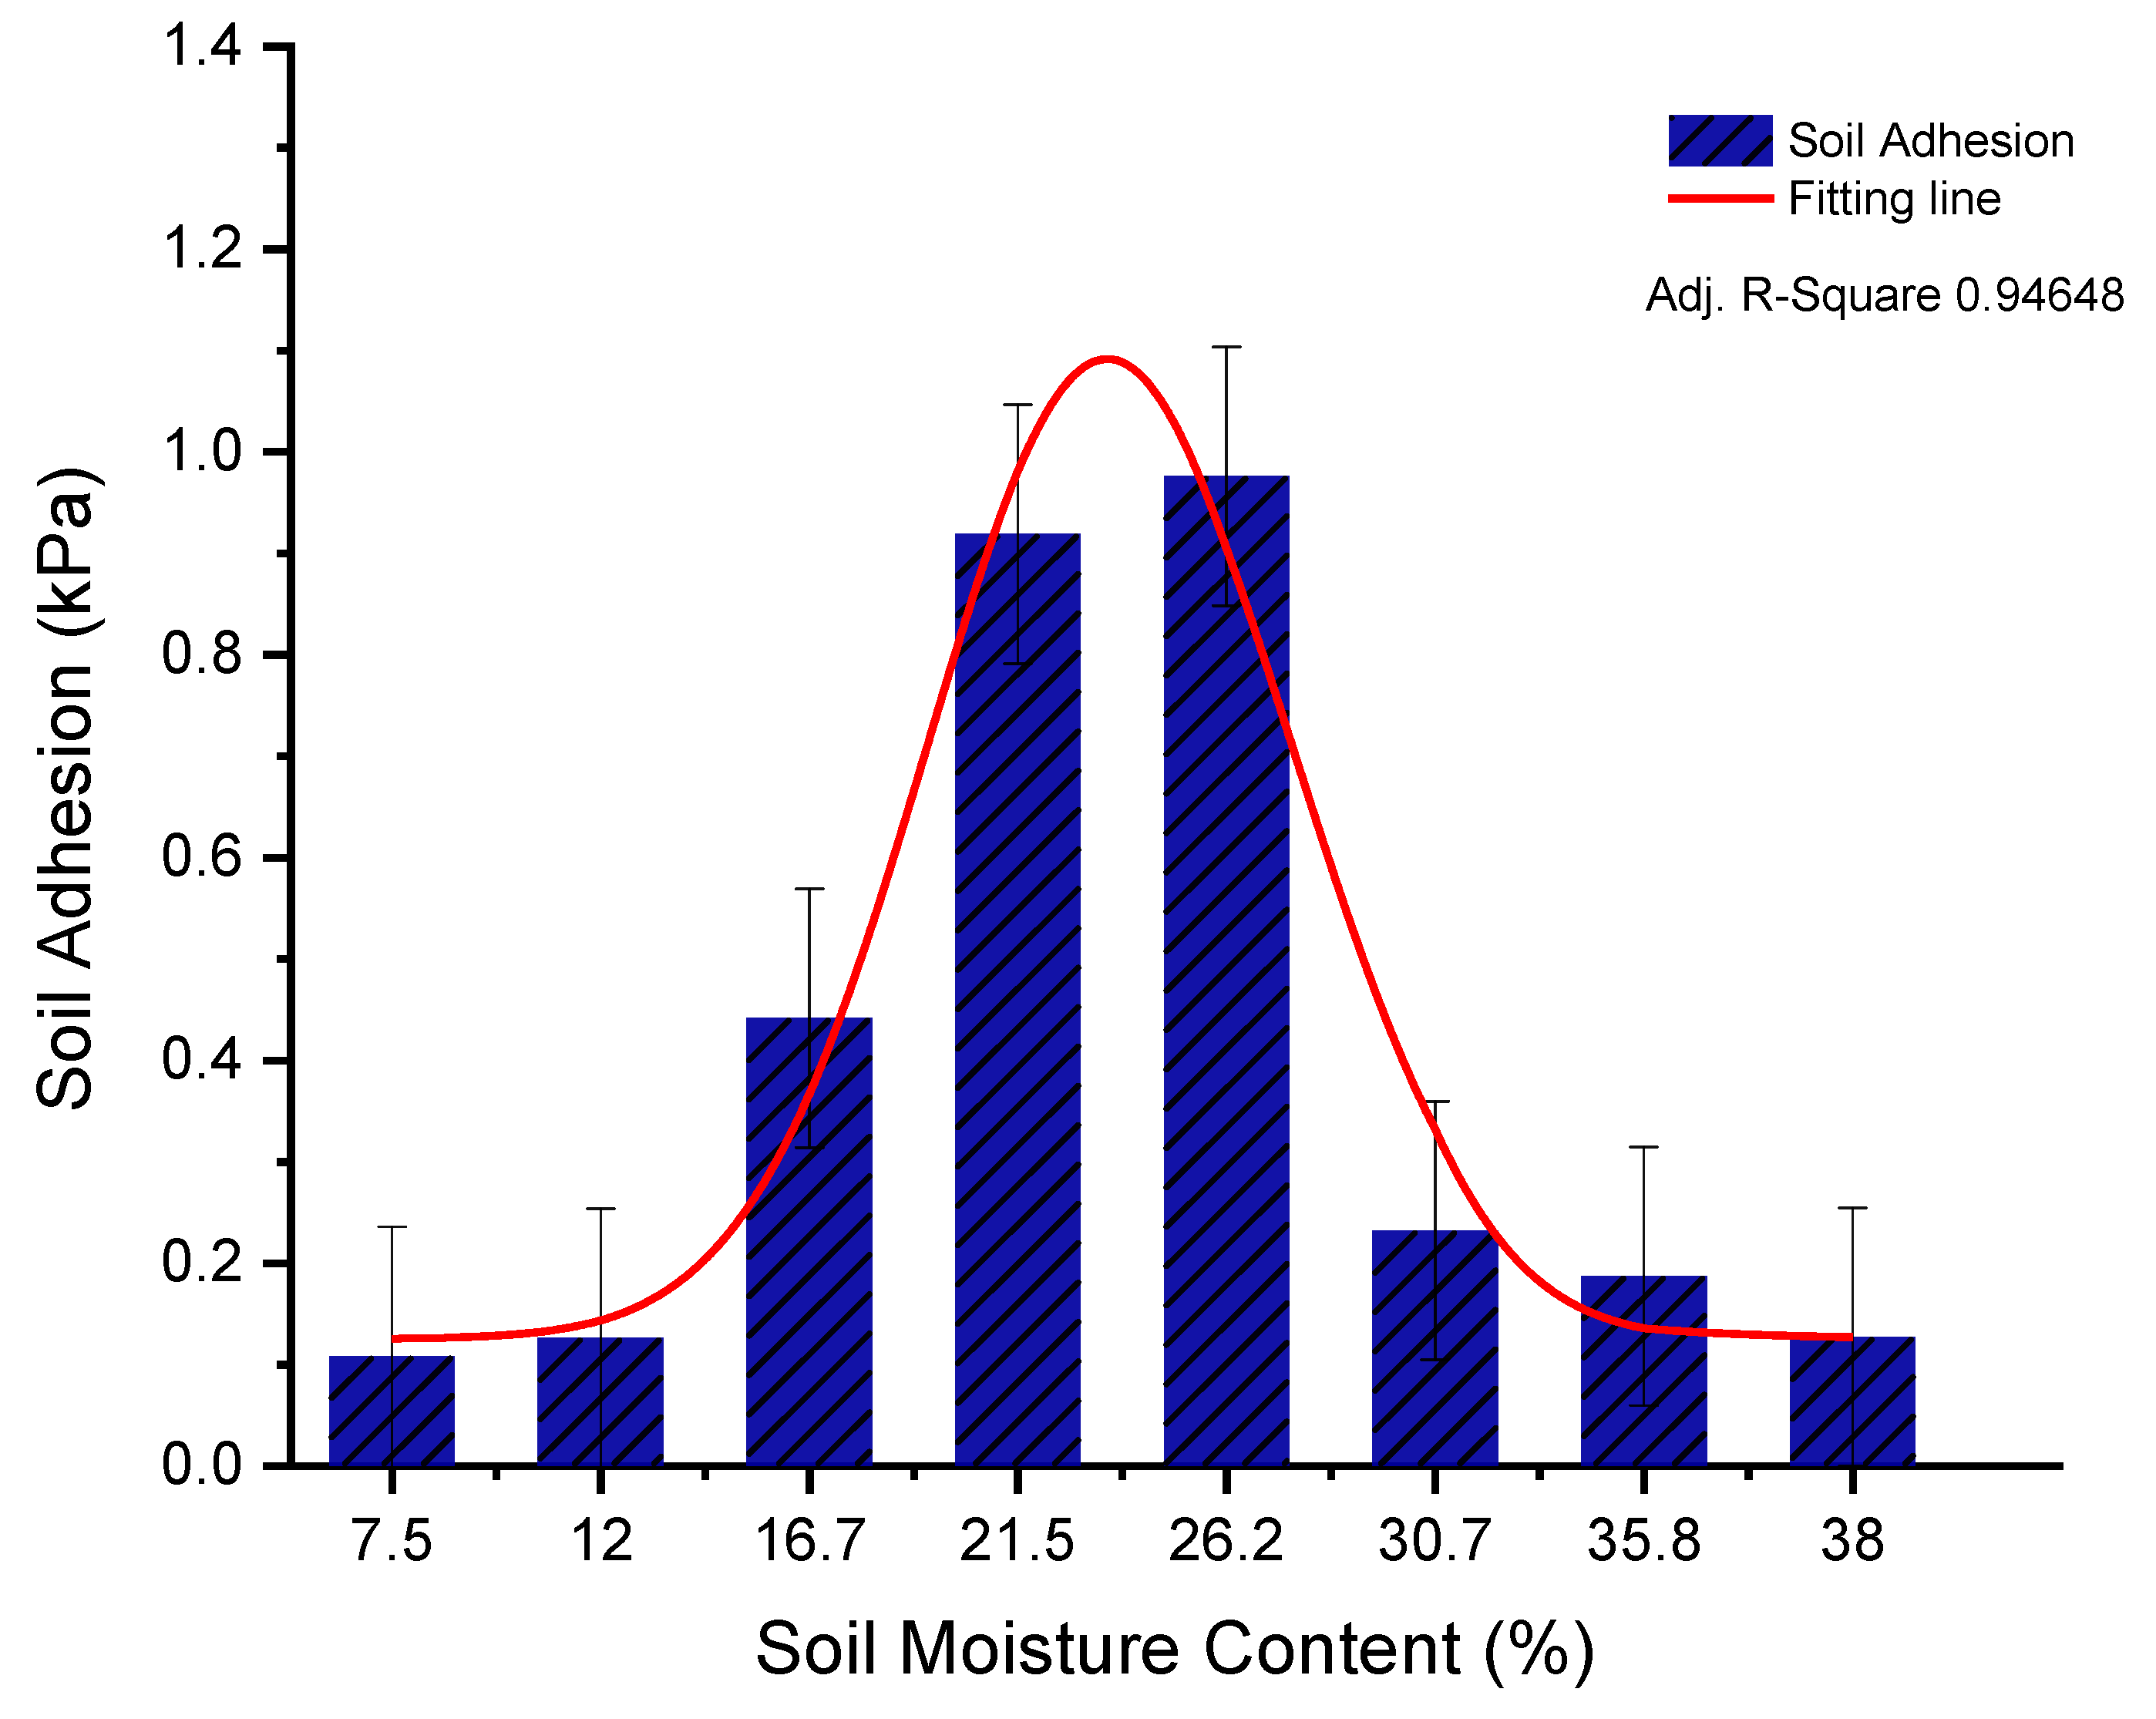
3.4. Soil Adhesion (Ca) at Different Moisture Contents

The relationship between soil adhesion and soil moisture content is shown in Figure 13. The plot discloses the parabolic curve of results. It has been found that soil adhesion is higher when the soil is wet. Initially, adhesion increased with increasing moisture content, it was higher at 26.2% moisture content, and as the moisture content further increased, soil adhesion decreased. The average greater adhesion was 0.976 kPa at 26.2%, similarly, the smaller was 0.108 kPa at 7.5% moisture content. Statistically, the results were significant (p < 0.05). The Gauss model was used to fit the data and to get best fitting line, the adjusted R2 value was 0.94648. The previous results reported that the soil moisture content significantly affected soil cohesion and adhesion [7,37,40,41]. Present results are in line with those reported results.

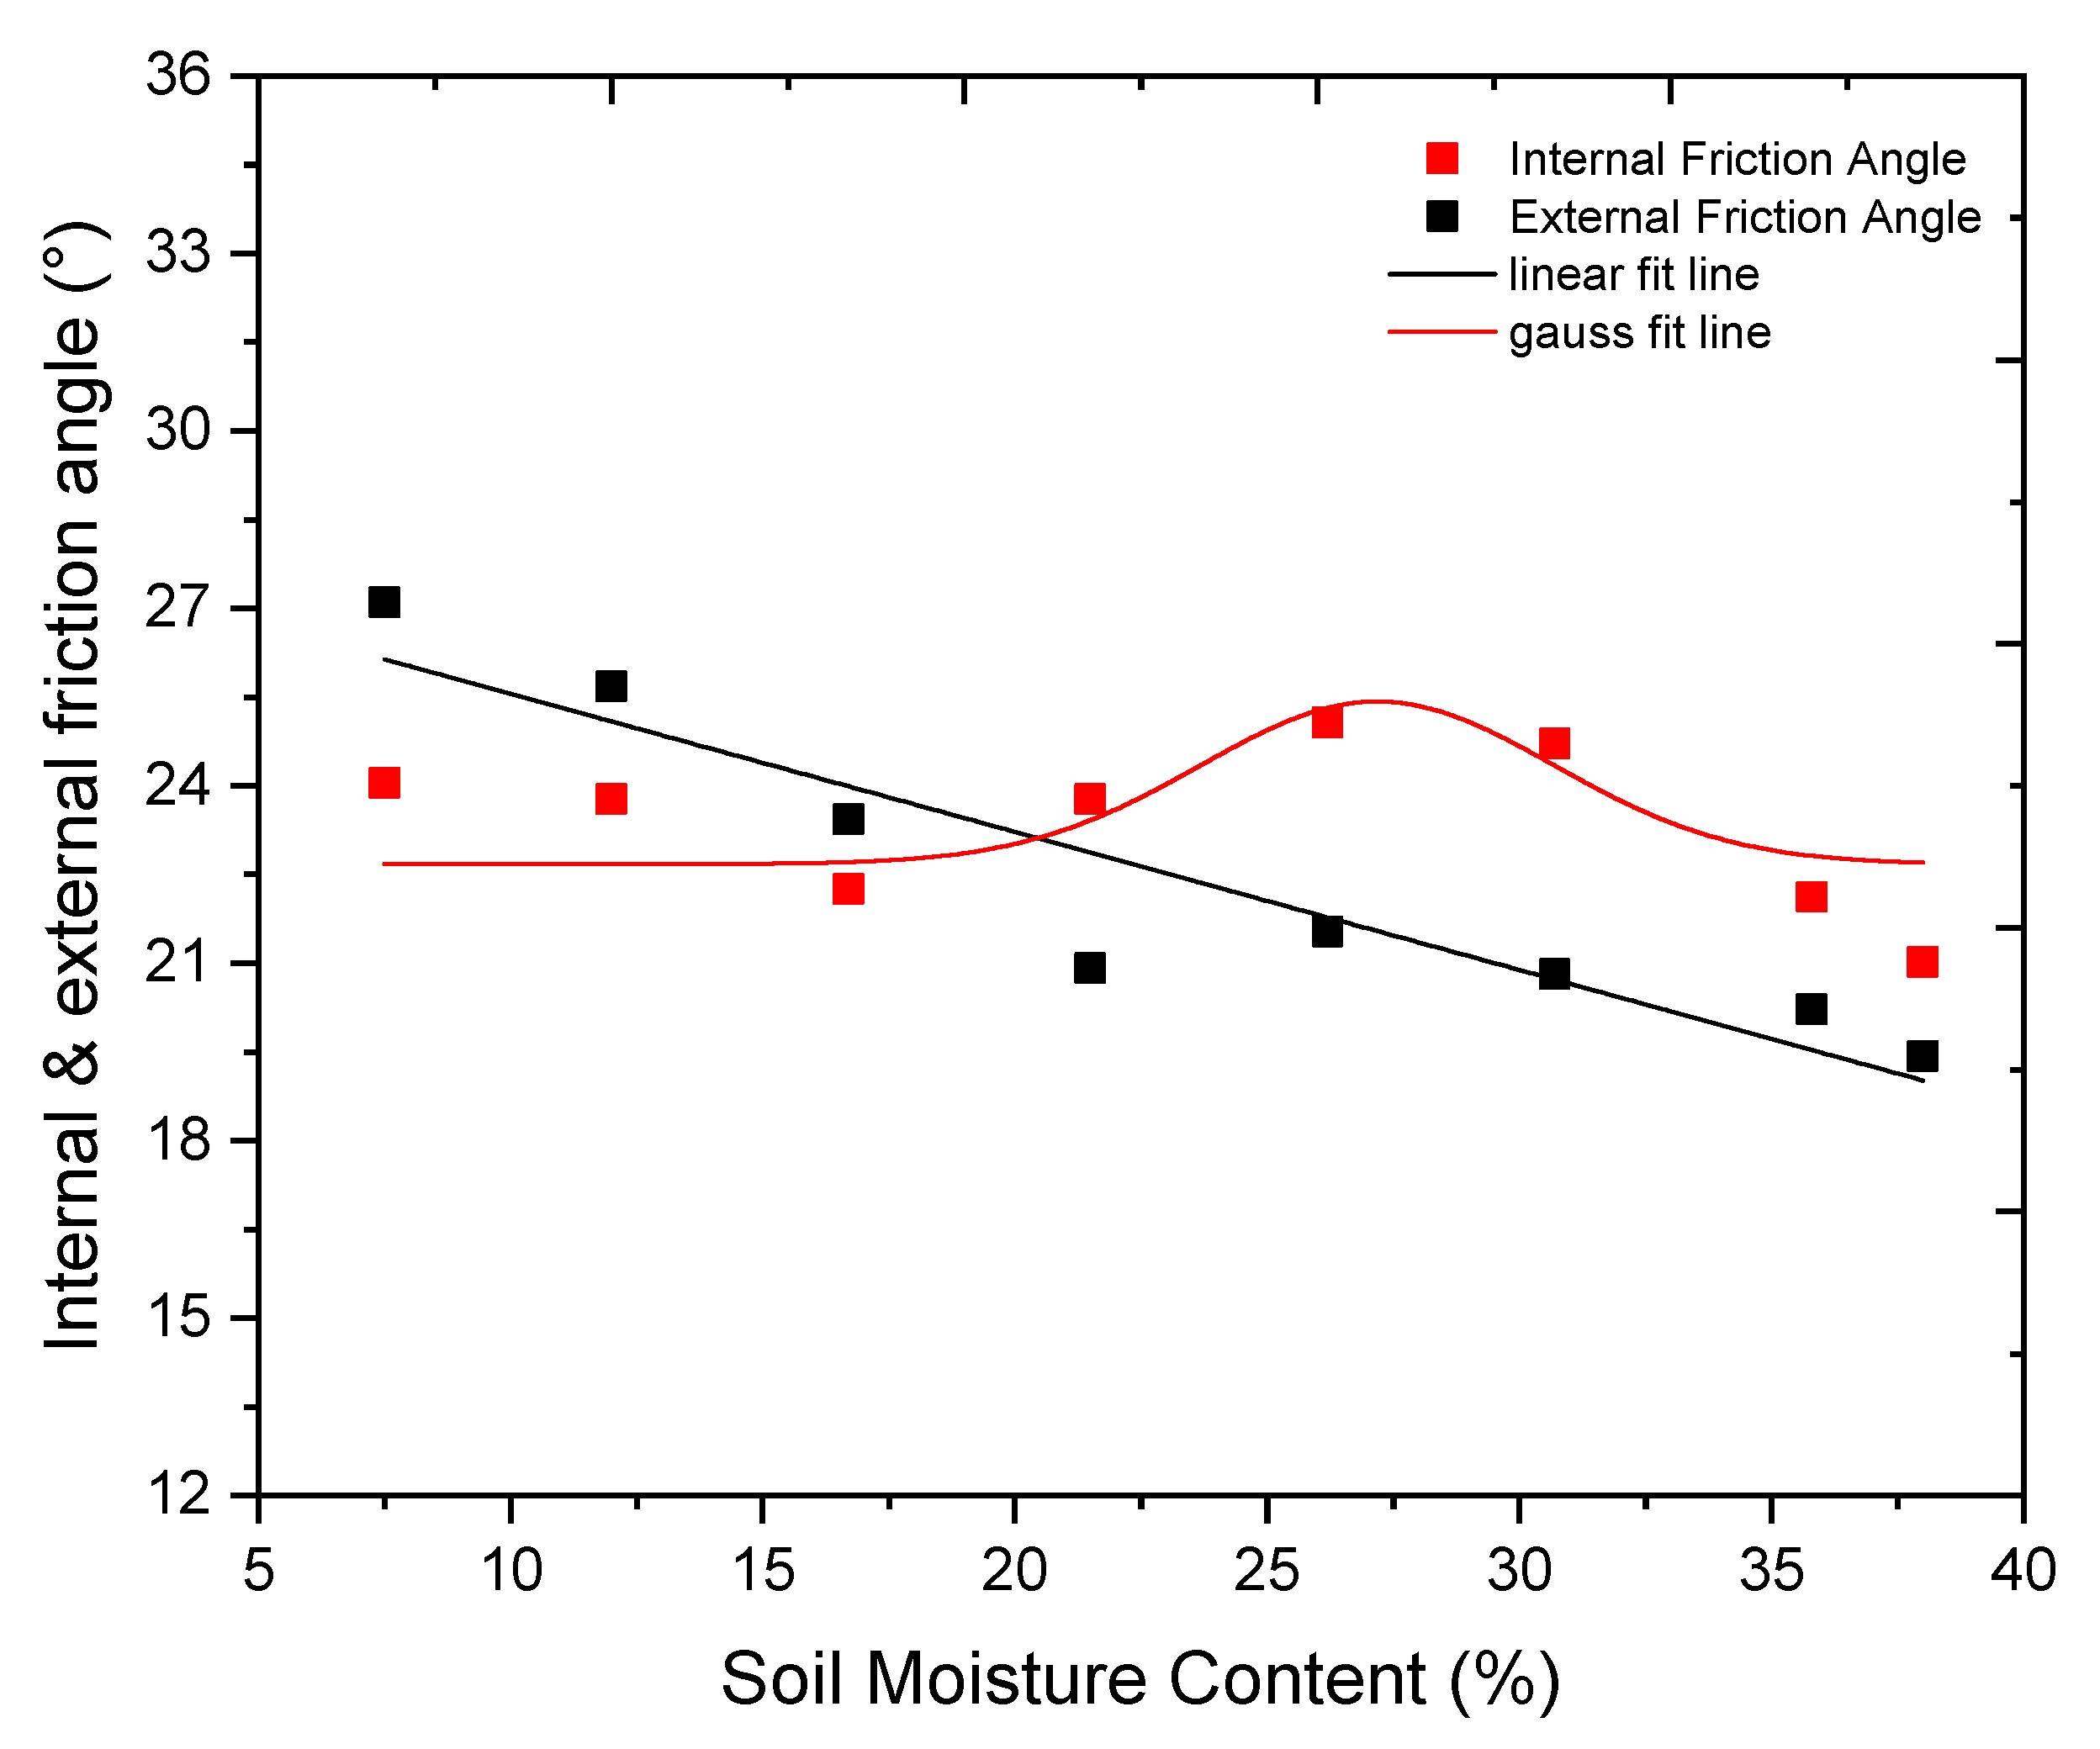
3.5. Internal and External Friction Angle

The experimental results of soil internal and external friction angles were obtained by the direct shear test and shown in Figure 14. The comparative trend between both angles was observed in results, initially, both angles slowly decreased with an increase in moisture content to 21.5%, but when moisture content further increased the internal friction angle initiated to increase and the external friction angle remains decreased. The maximum internal and external friction was 25.07 and 20.82 observed at 26.2 and 30.7% moisture content, respectively. Moreover, the minimum 21.02, and 19.43 were recorded at 16.7 and 38%. The gauss model was used to perform non-linear curve fitting. The adjusted coefficient of determinations was 0.84497 and 0.8655 calculated for internal and external friction angle, respectively. Previous research reported that a decrease in external friction angle was observed with increasing soil moisture content [42,43]. Additionally, another previous report indicated that soil moisture increases with a decrease in the angle of internal and external friction [44,45].

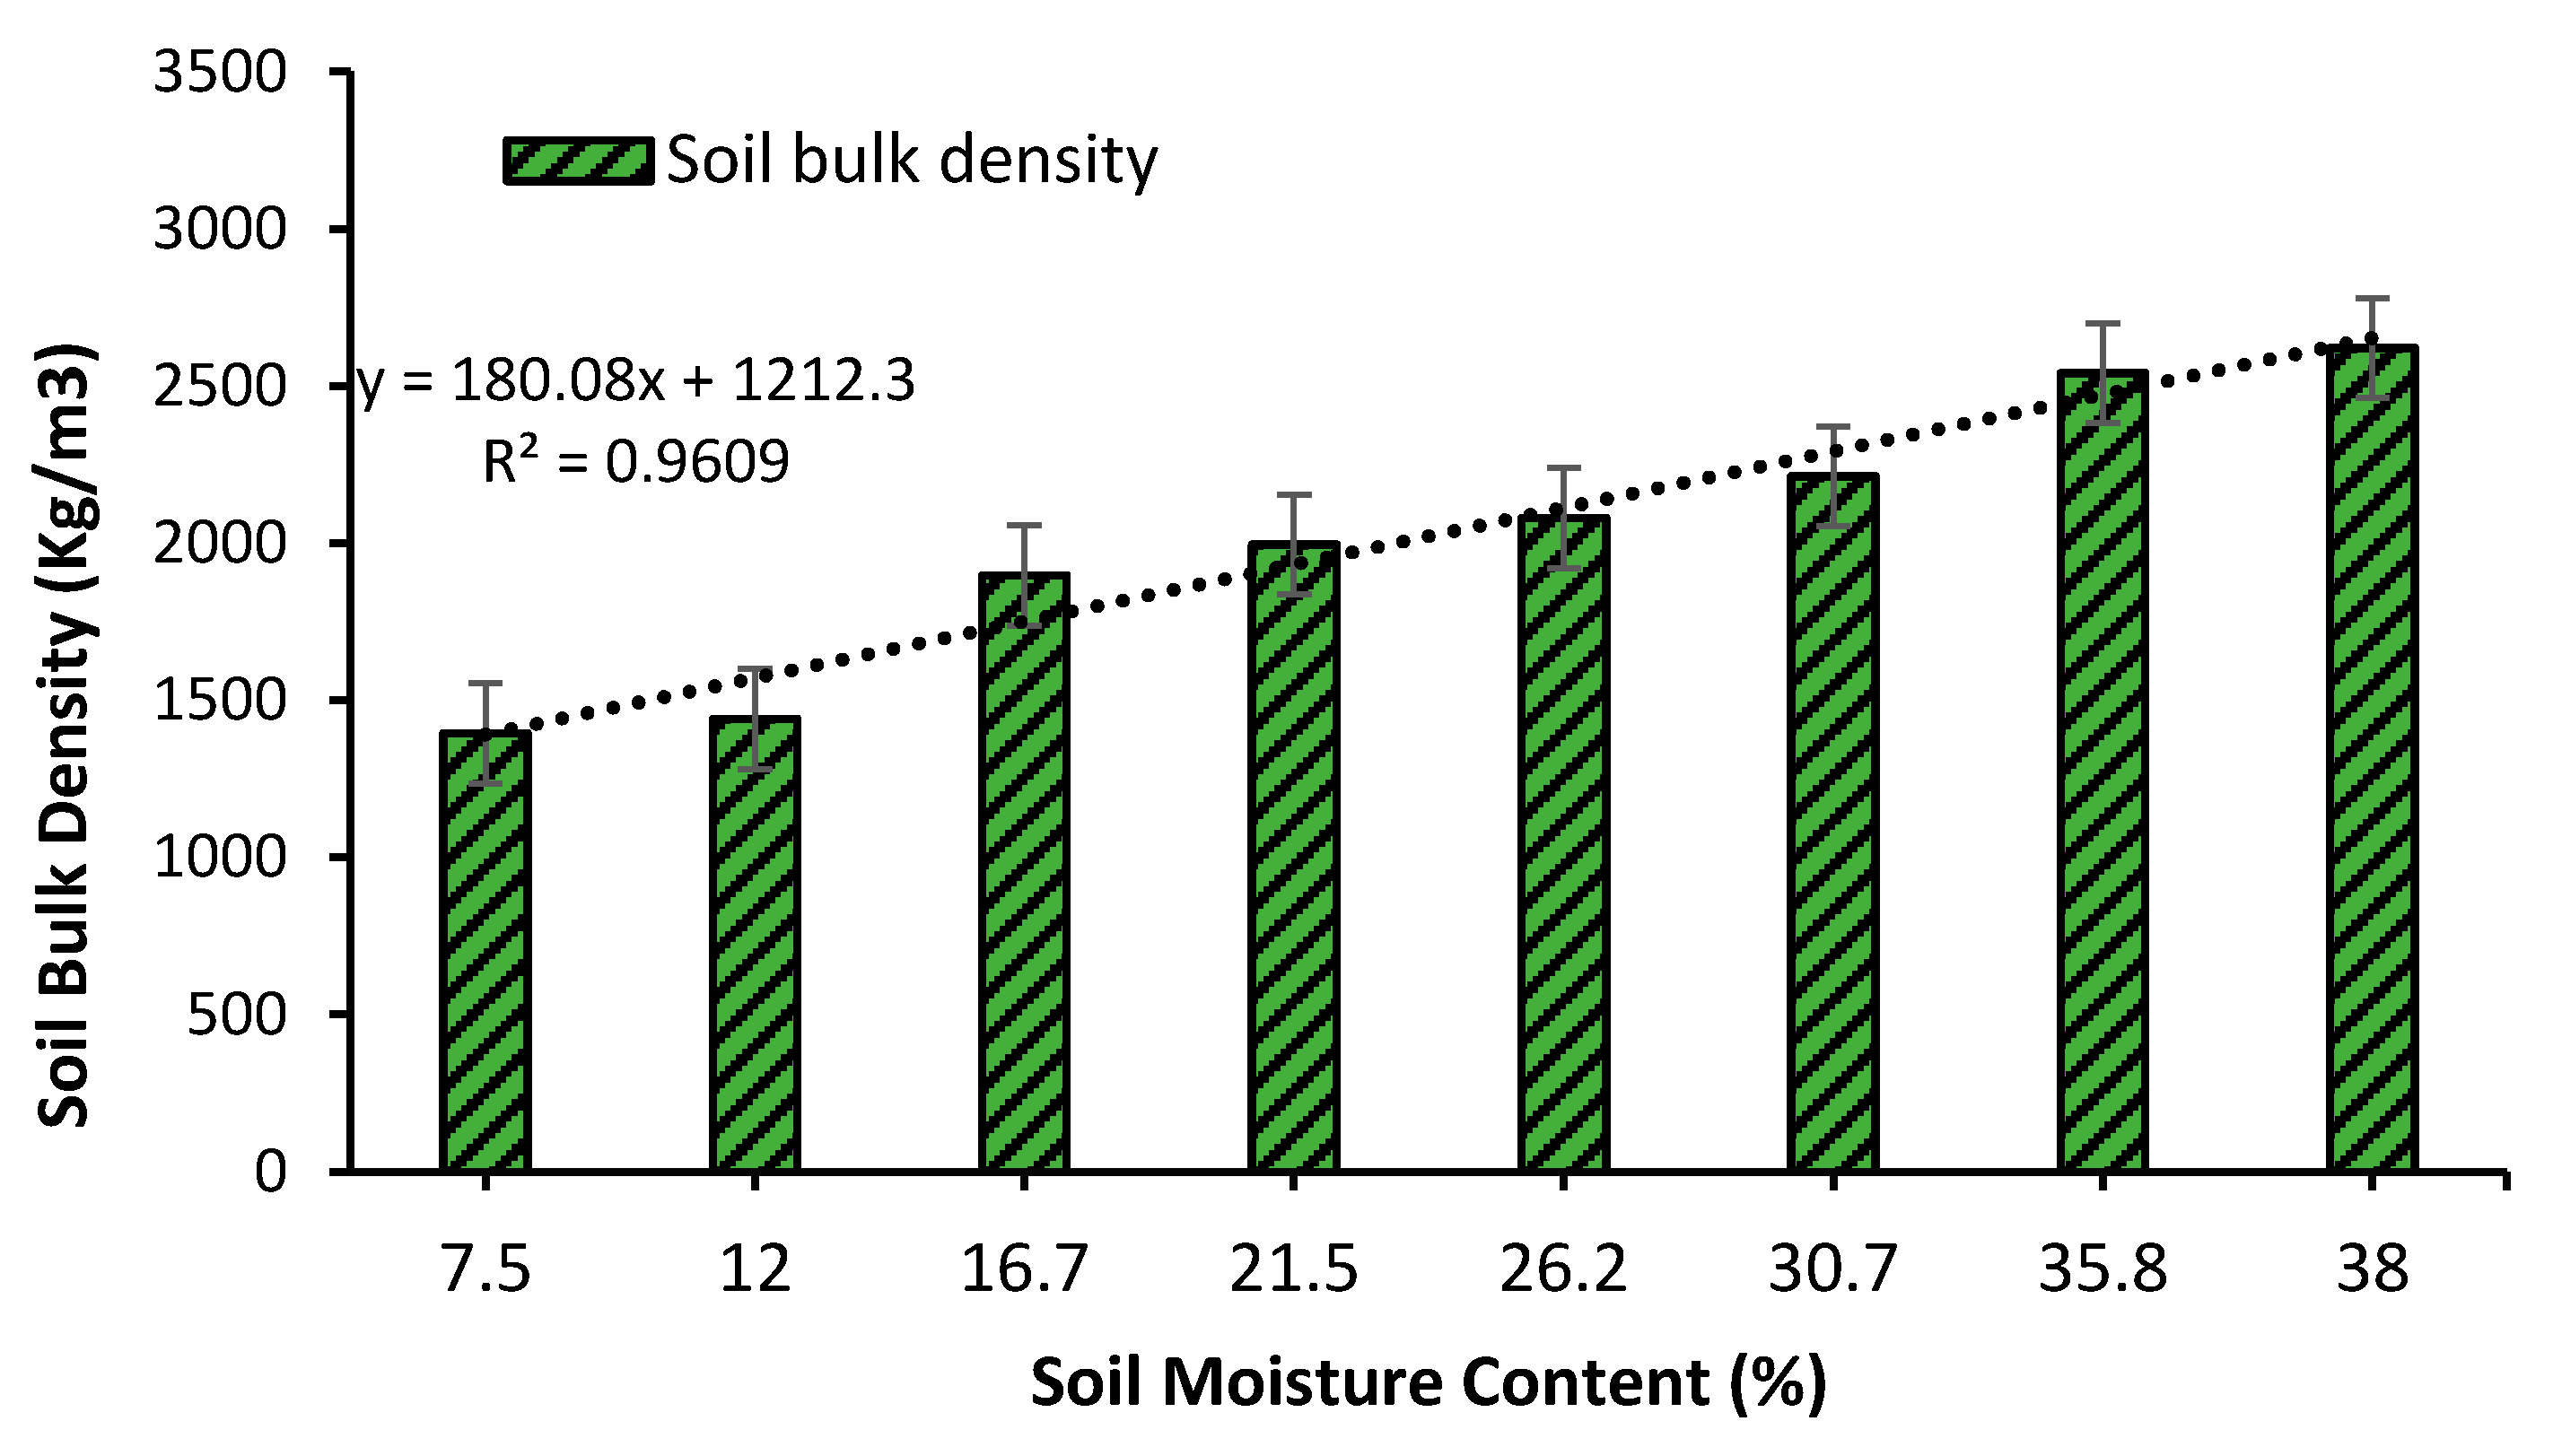
3.6. Soil Bulk Density

Bulk density offers the most basic details on the solid, water and air proportions and seems to be important to any study. The results of soil bulk density at eight moisture contents (7.2, 12, 16.7, 21.5, 26.2, 30.7, 35.8, and 38%) were shown in Figure 15. As one can see from the figure that the soil bulk density linearly increased with an increase in soil moisture content. The major increase in soil bulk density was found at 38%, while the lower was at 7.5% moisture content. The reason for the change in soil bulk density is when water is applied to the soil to reach optimum moisture levels, the soil form varies from semisolid to liquid because of capillary force. The influence of soil bulk density on moisture content was significant (p < 0.05), the R2 was 0.9609 calculated by linear regression. The present results are in line with the previously reported studies found the maximum change in soil dry bulk density at 30% moisture content [37,46,47].

3.7. Tractive Performance Parameters of Single-Track Shoe

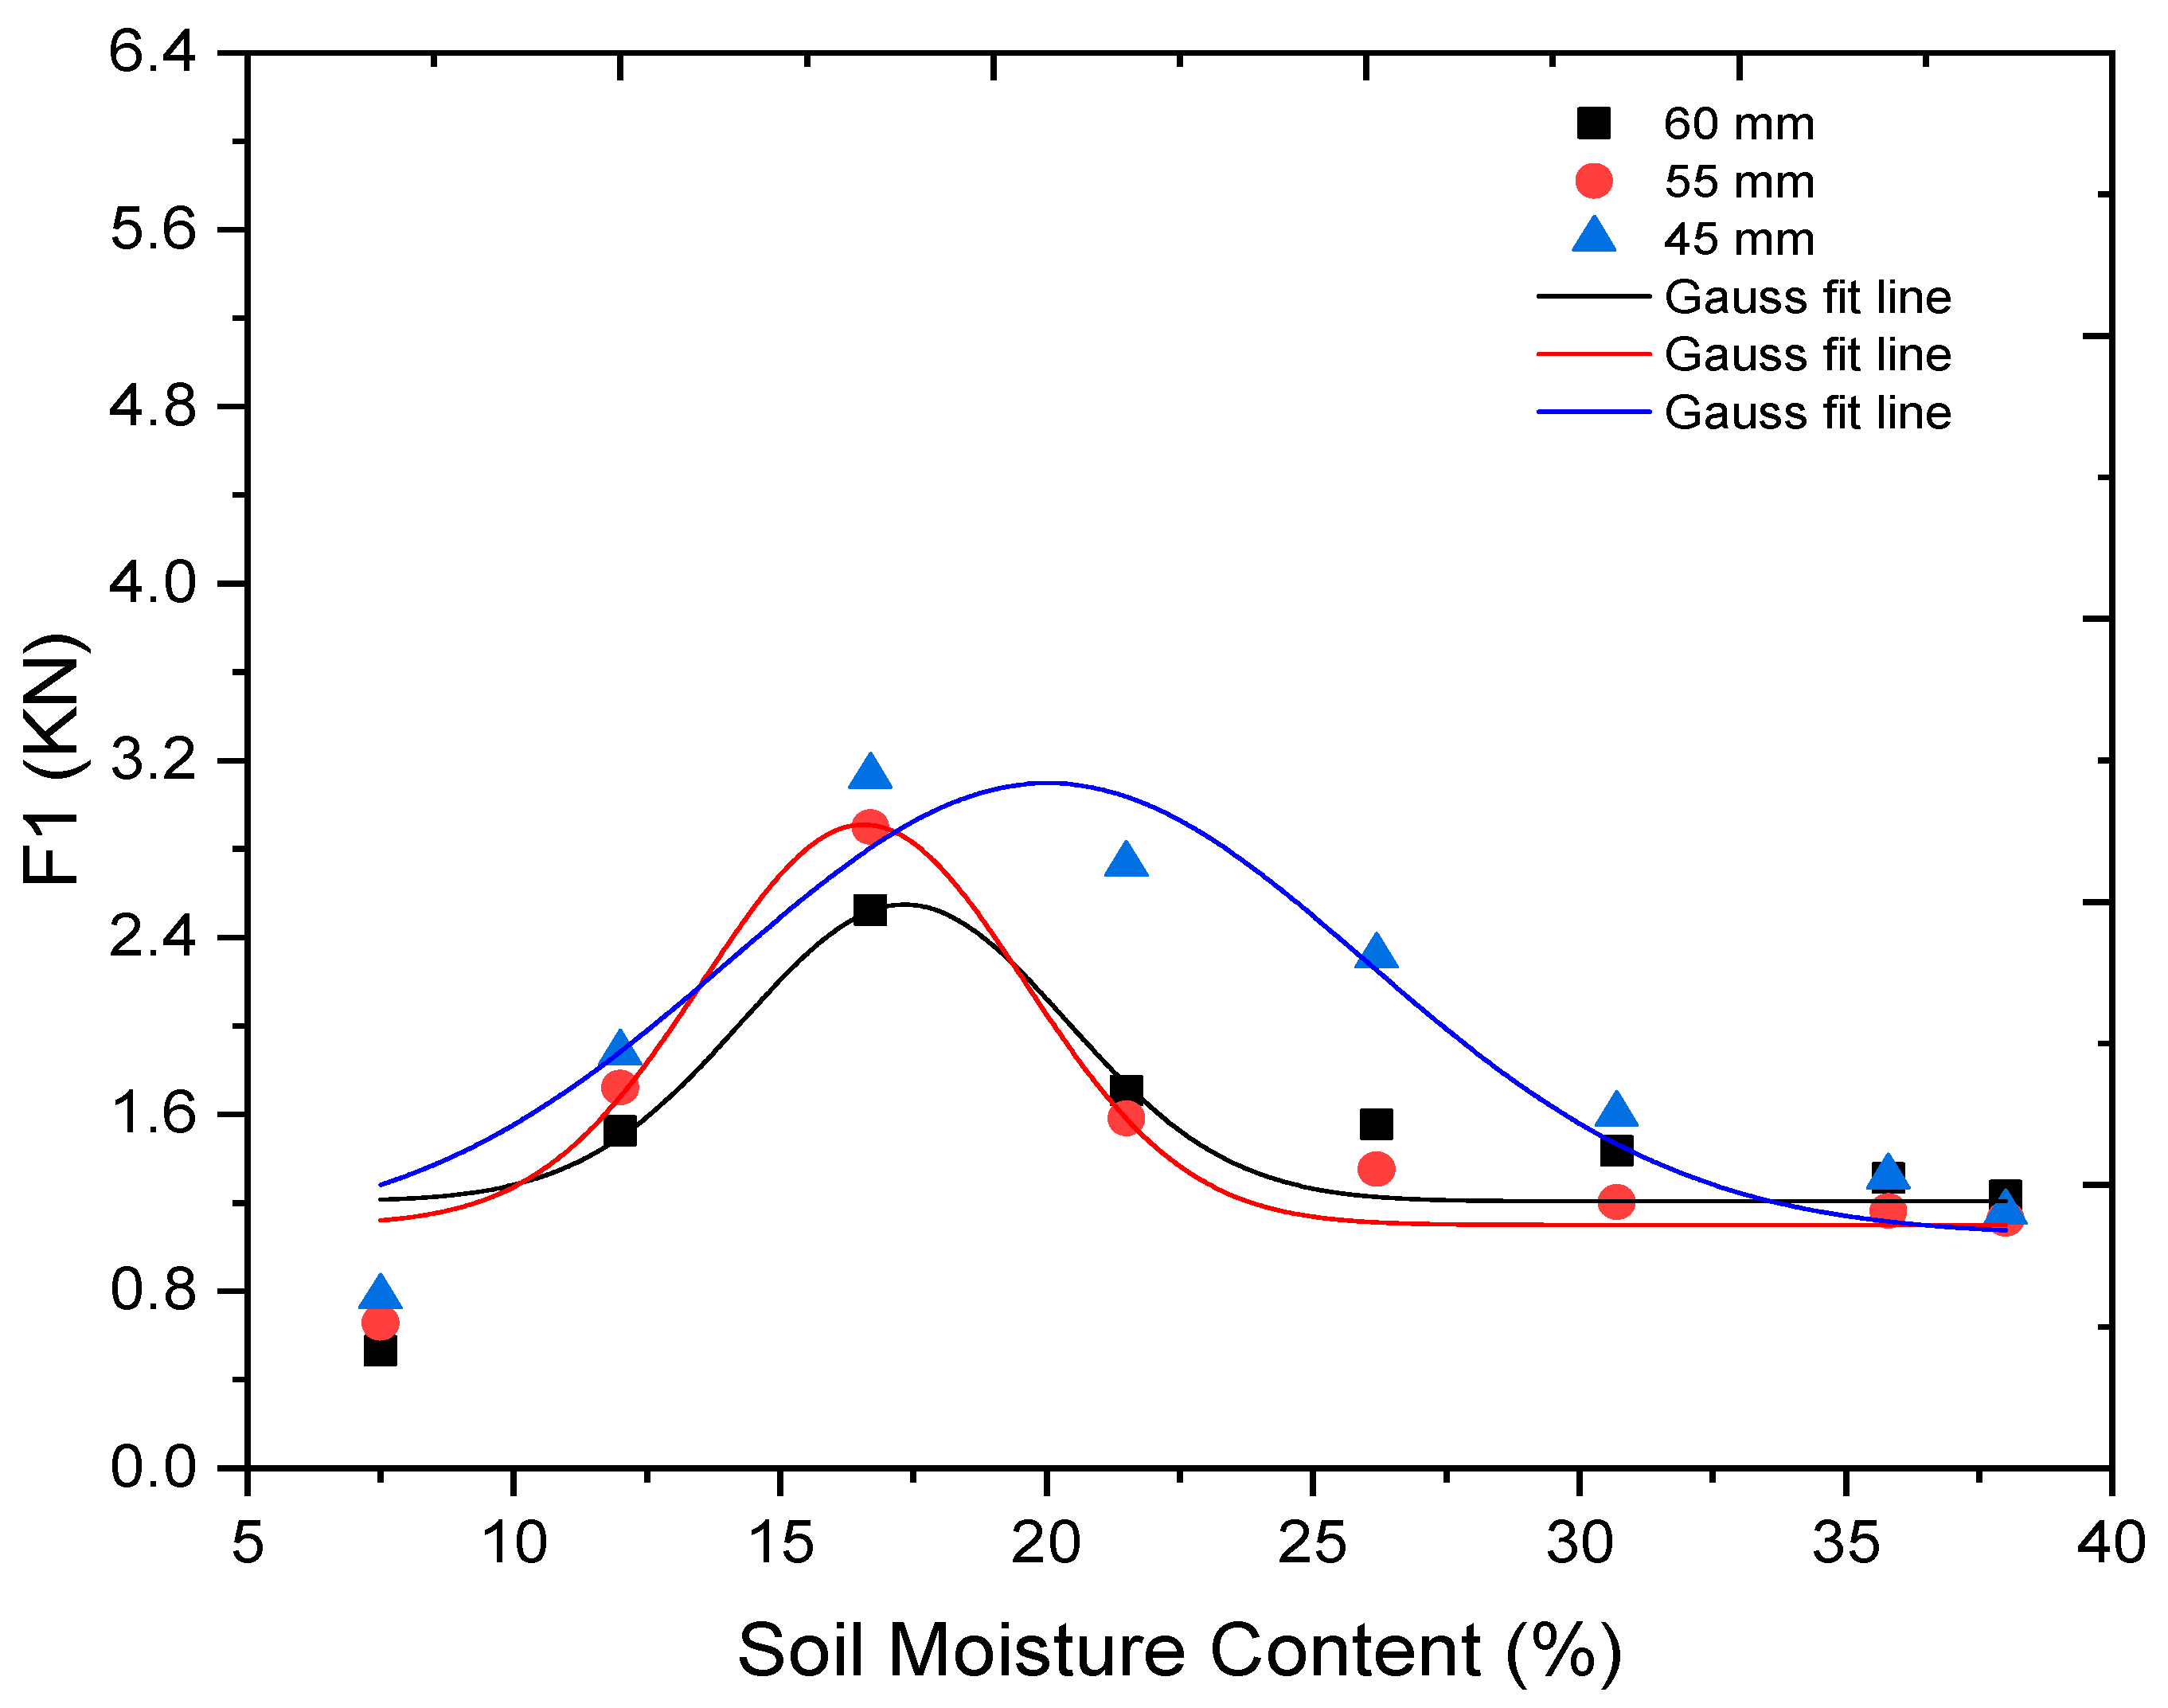
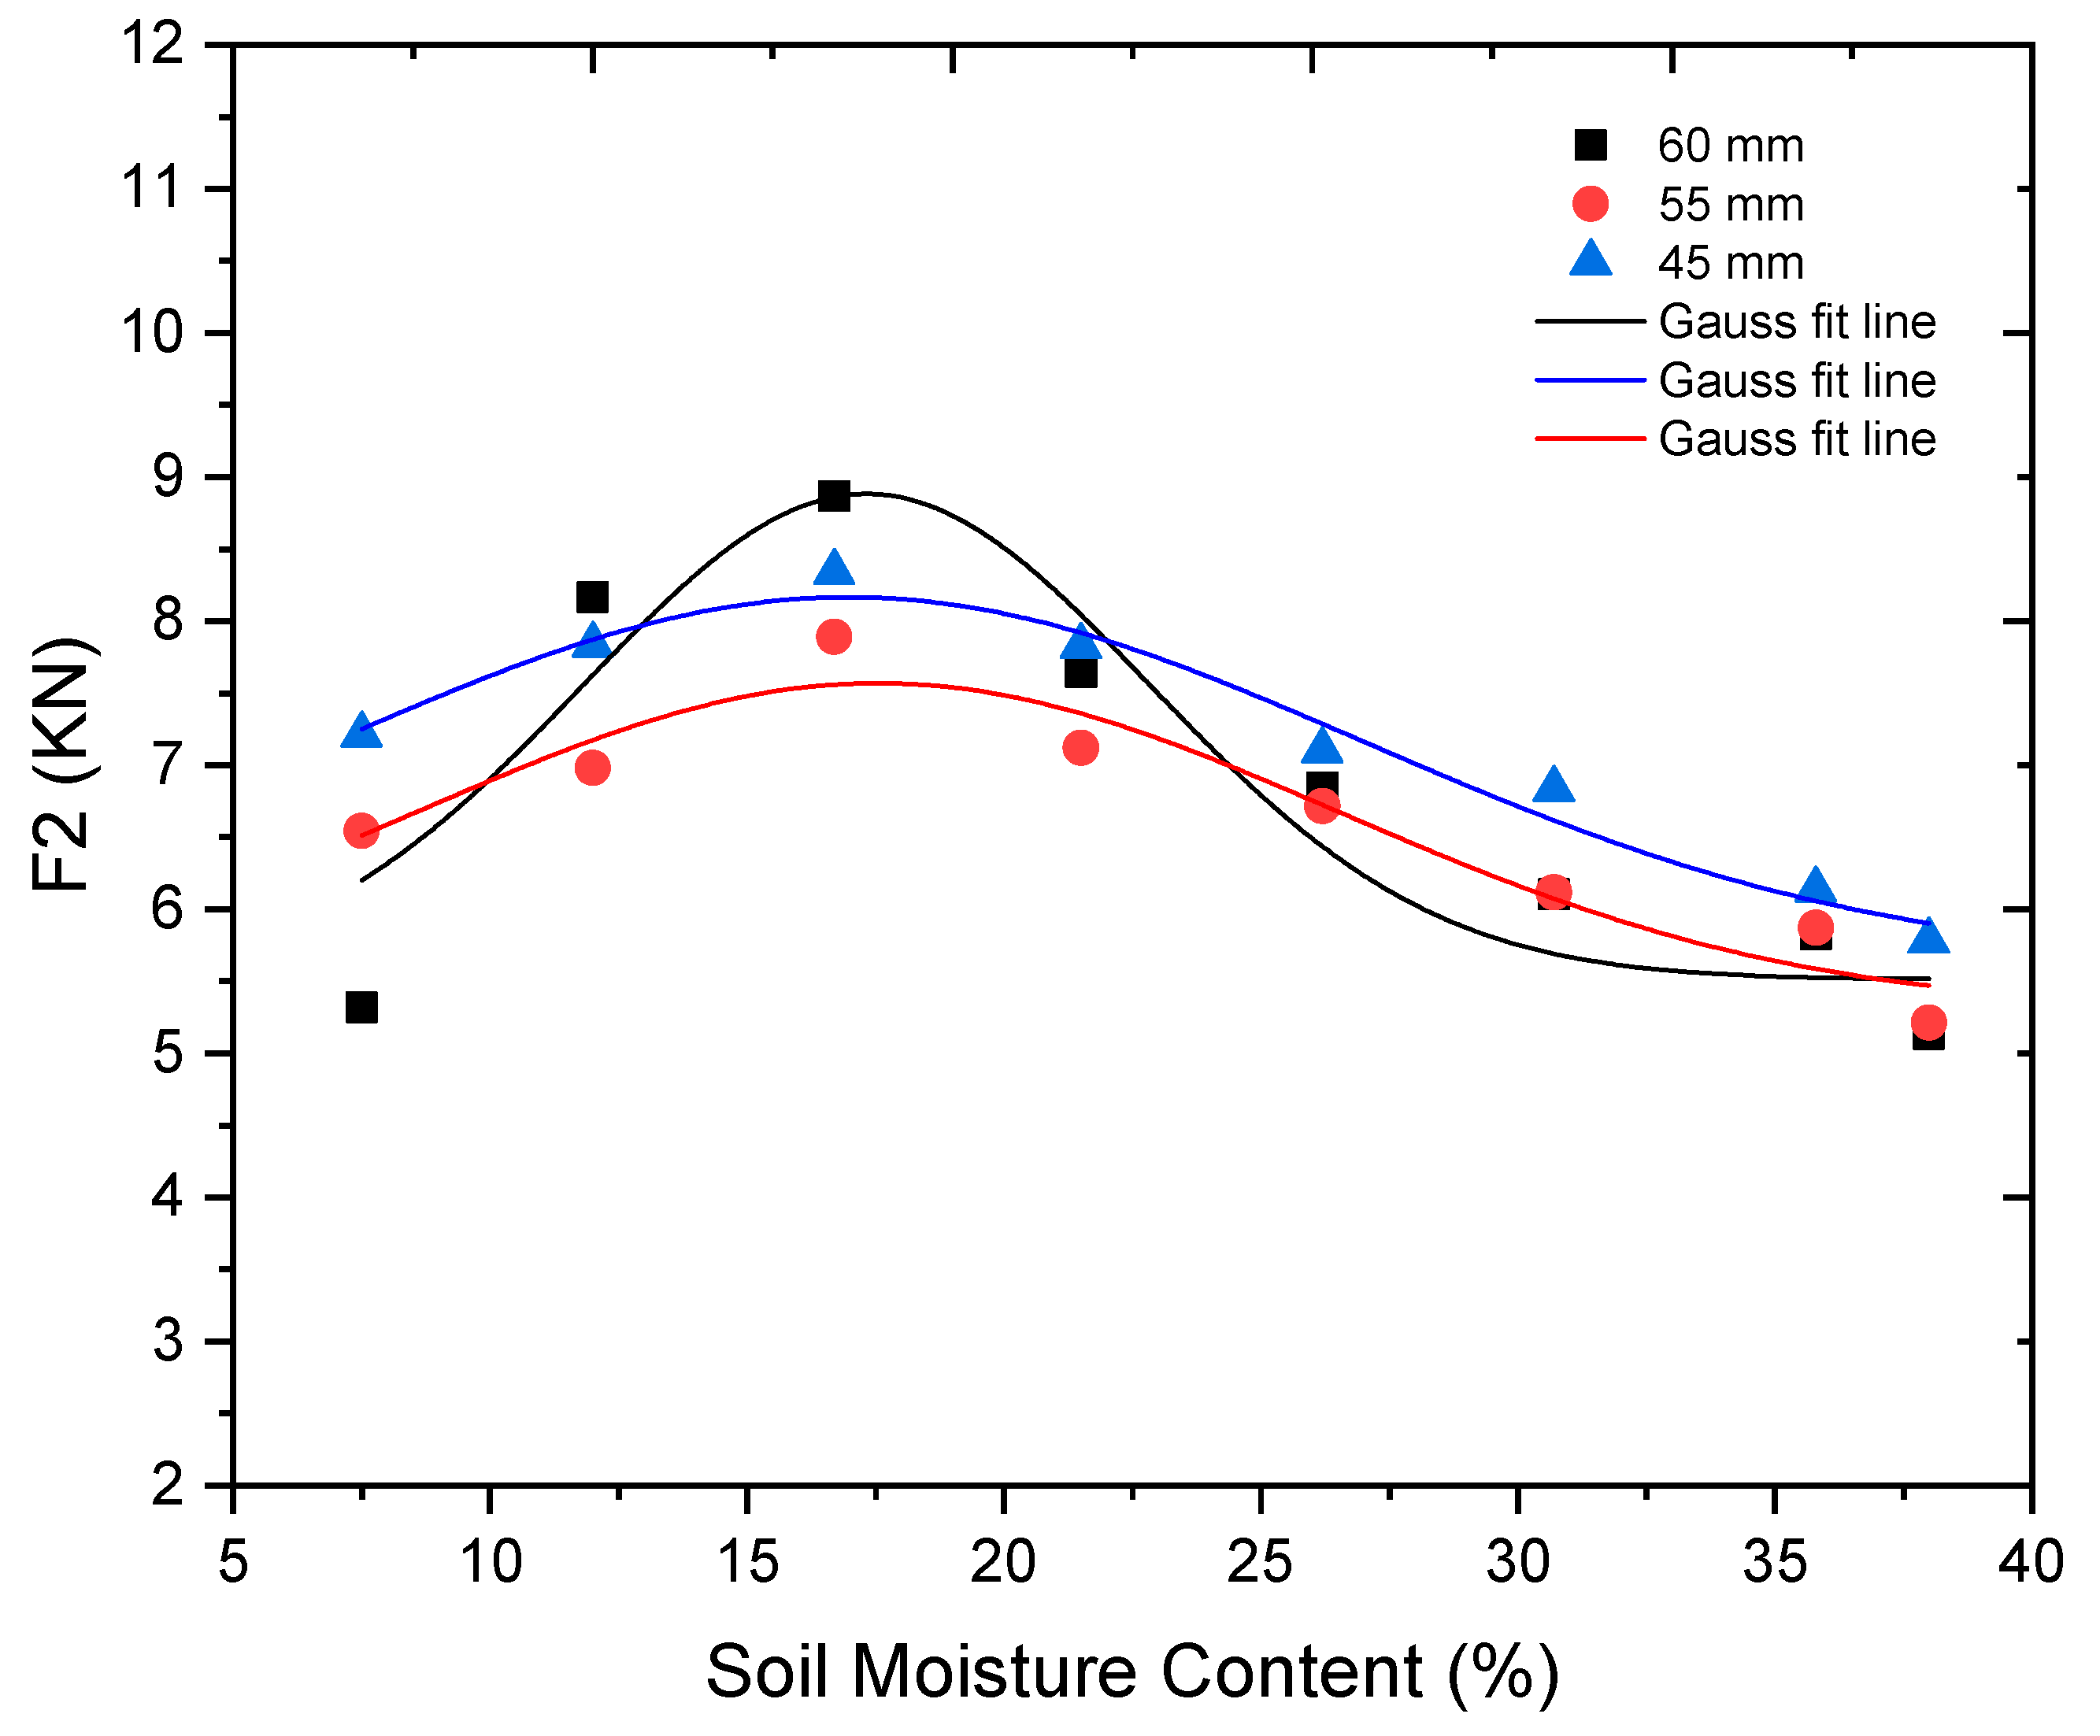
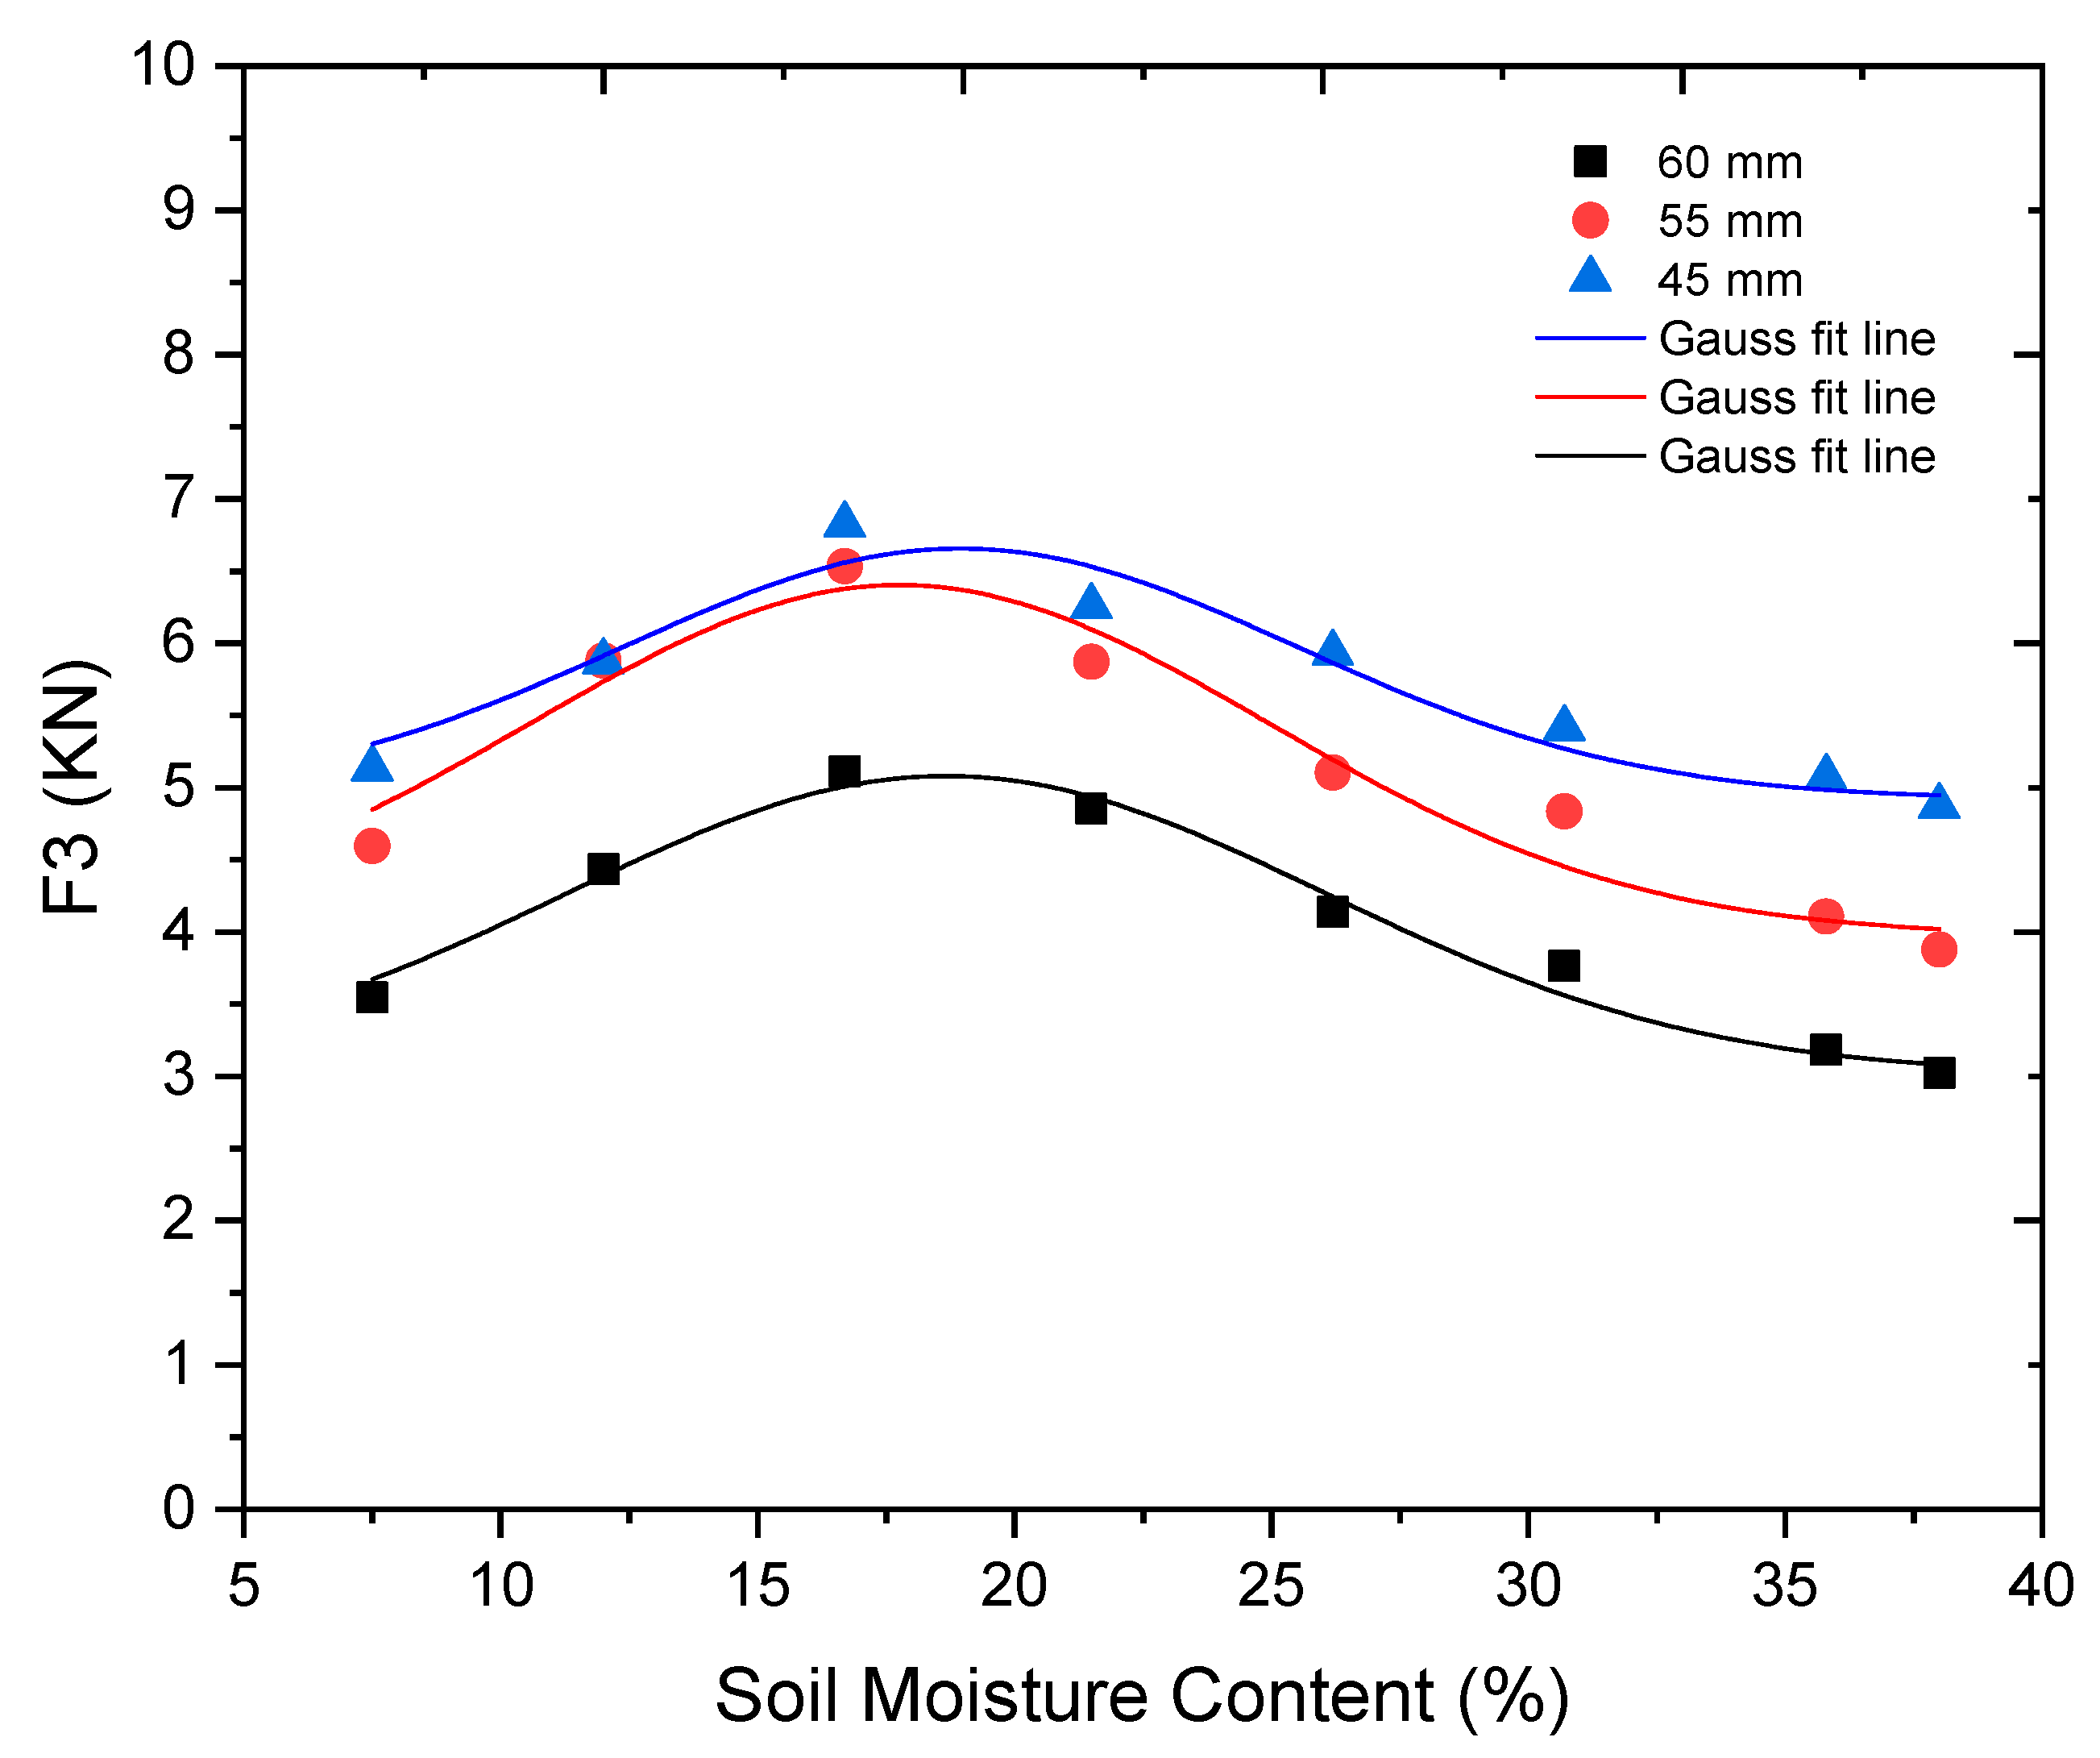
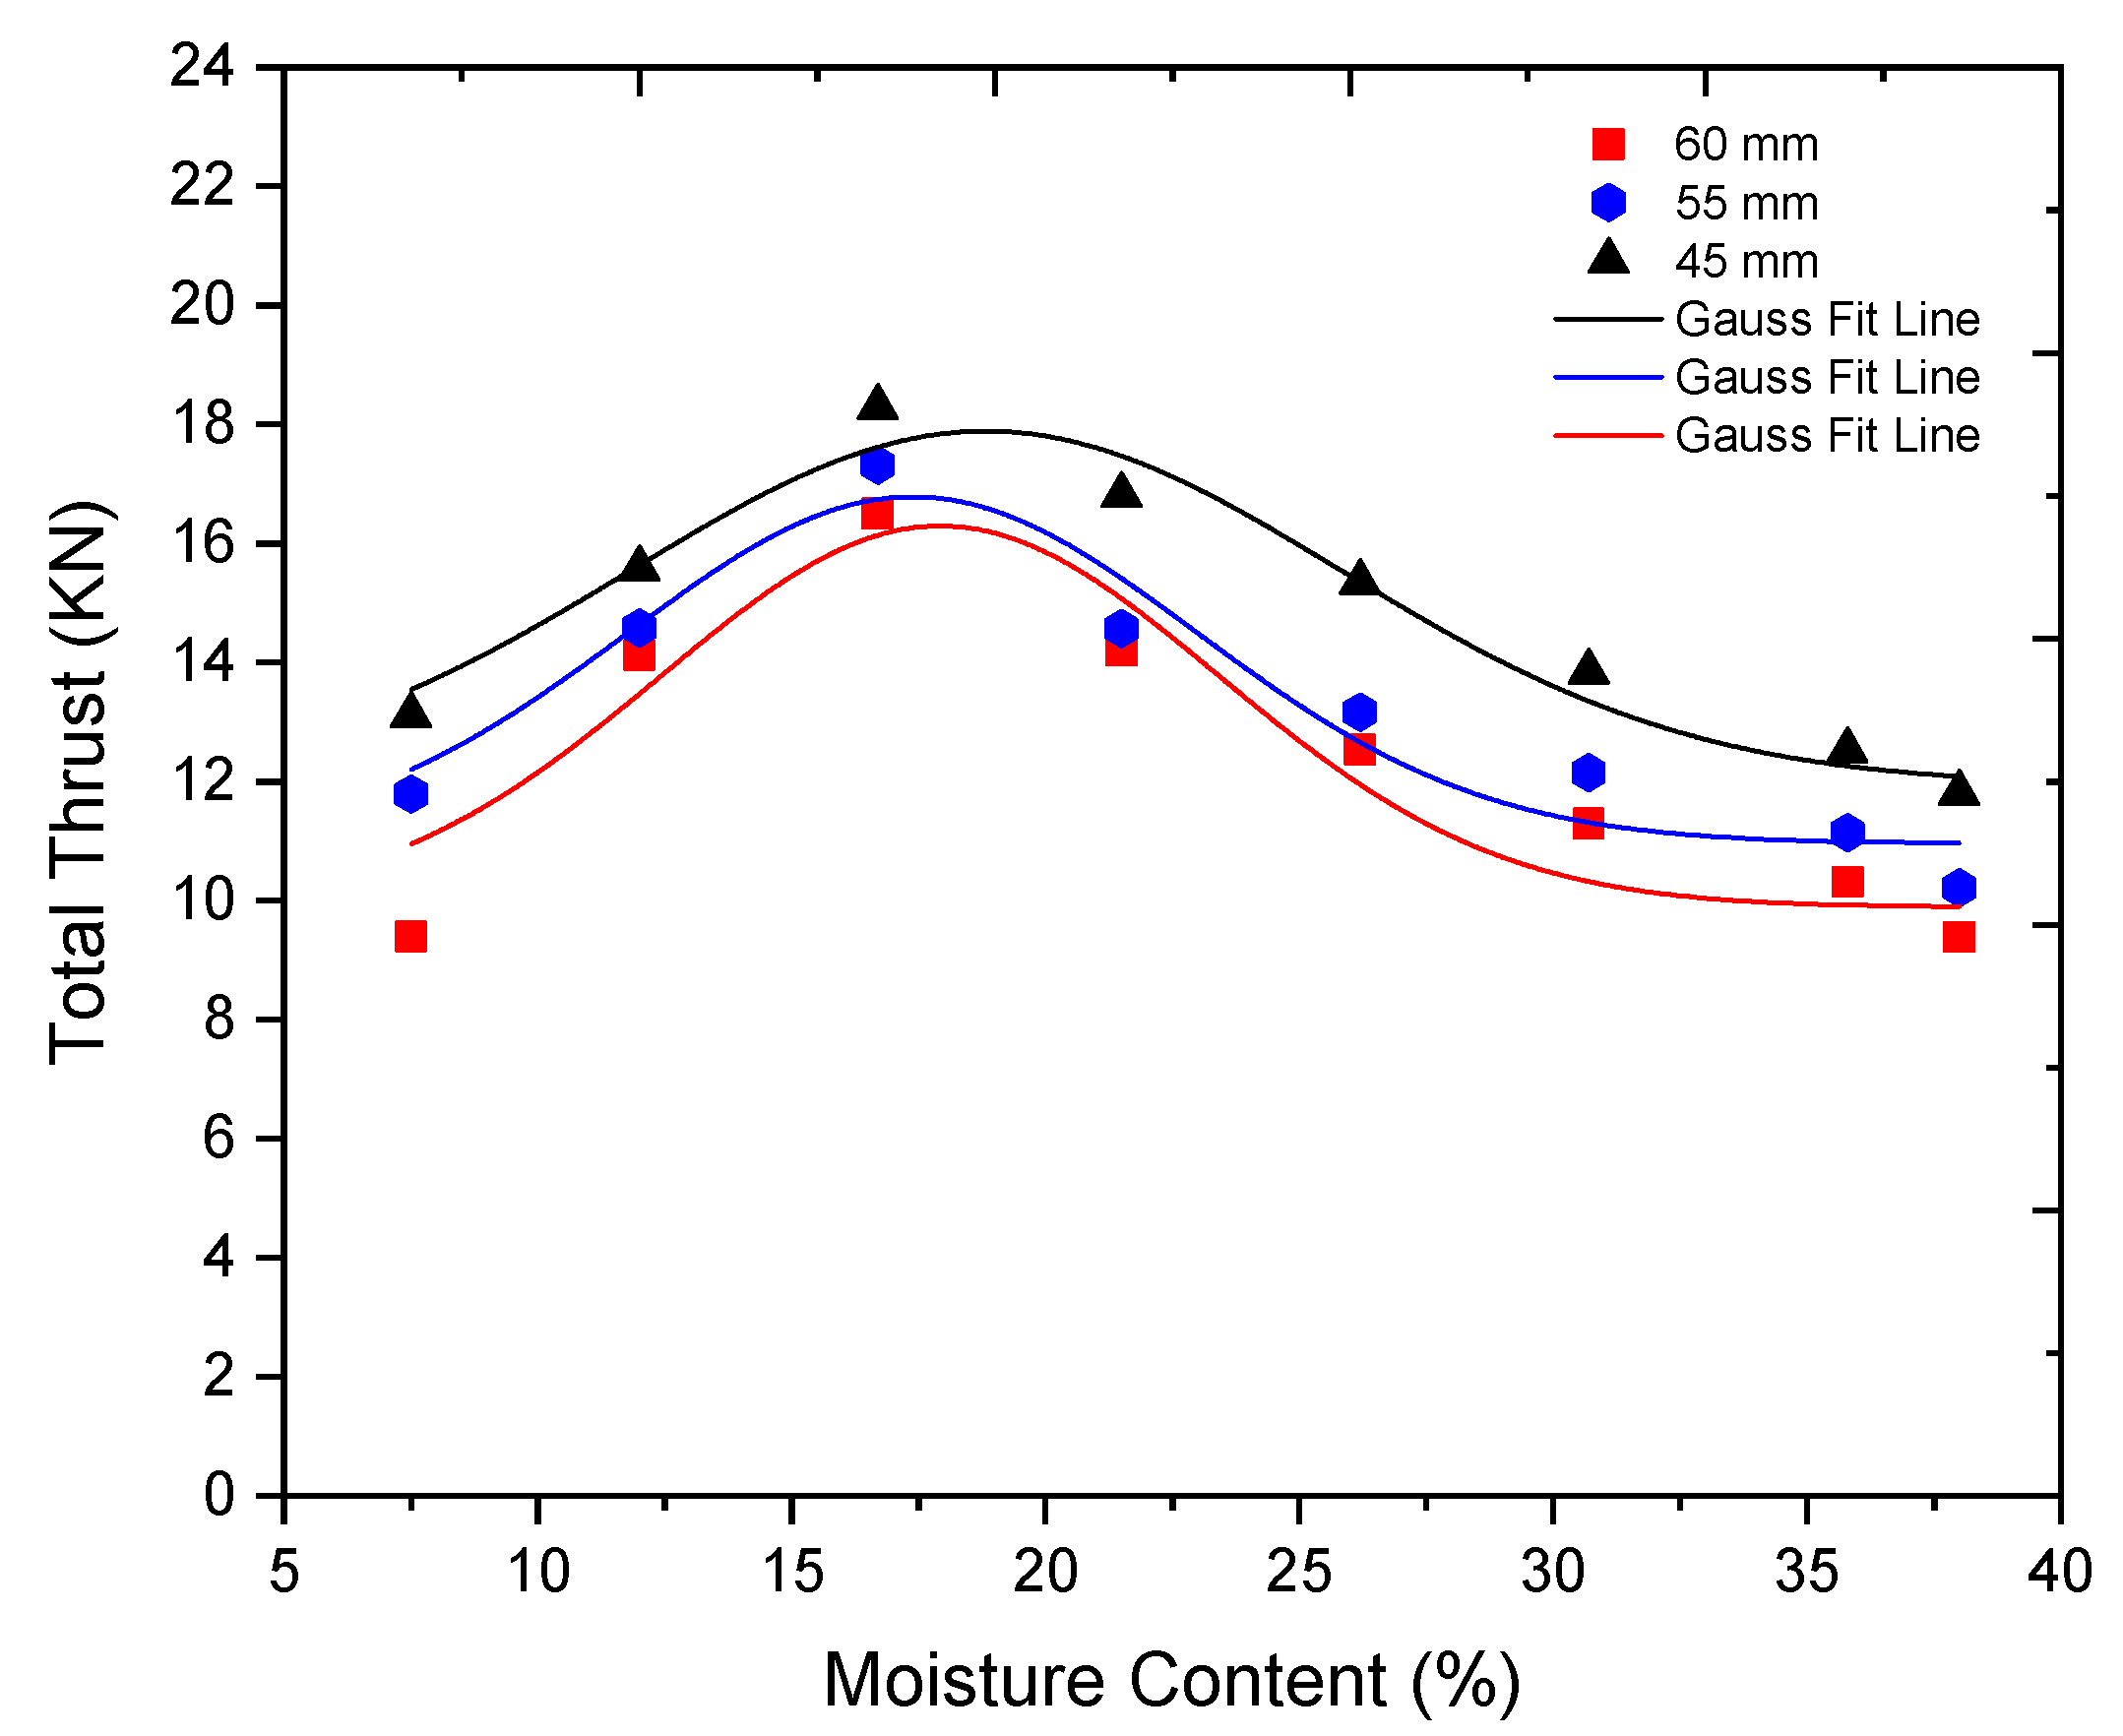
3.7.1. The Thrust Generated at Lateral Sides and Bottom of the Grouser

The total soil thrust is the addition of thrust generated at the tip surface of grouser (F1), lateral sides of grouser and spacing, the surface of spacing (F2), and the bottom surface of grouser (F3). Figure 16 shows the results of thrust at the tip of grouser (F1) with different heights, results reveal that all grouser heights had the same trend over moisture content, but the high value (2.732 KN) was recorded 21.5% with 45 mm grouser height and it was steadily decreased with the rise in moisture content until the end of the experiment. F2 results were shown in Figure 17, the results indicated that the thrust was increased with a rise in moisture content until 16.7%, and then slowly decreased with further increase in moisture content, the maximum thrust of F2 was (8.867 KN) observed for 60 mm height at 16.7%. Similarly, the F3 has also the same pattern (Figure 18), the more value of thrust was (6.821 KN) recorded with 45 mm height at 16.7% moisture content. The gauss model was used for non-linear curve fitting to obtain best fit line and coefficient of determination.
The total thrust generated at the single-track shoe was presented in Figure 19, the thrust with 45, 55, 60 mm height grew before 16.7% moisture content, while moisture content was increased all results were decreased until the end of 38%. The maximum thrust 18.293 KN was calculated as 45 mm grouser height at 16.7%, while a minimum 9.38 KN was observed with 60 mm height at 16.5% moisture content. The coefficient of determination for total thrust was 0.92673, 0.86866 and 0.79471 observed for 45, 55 and 60 mm grouser height, respectively. The results evaluated that the major increase in thrust was observed for 45 mm grouser height as compared to other heights; it was seen that grouser with small height had the best performance. Ge et al. reported that soil thrust decreased with an increase in moisture content [34]. Other studies reported that an increase in soil moisture content causes a decrease in the peak values of the thrust [48,49].

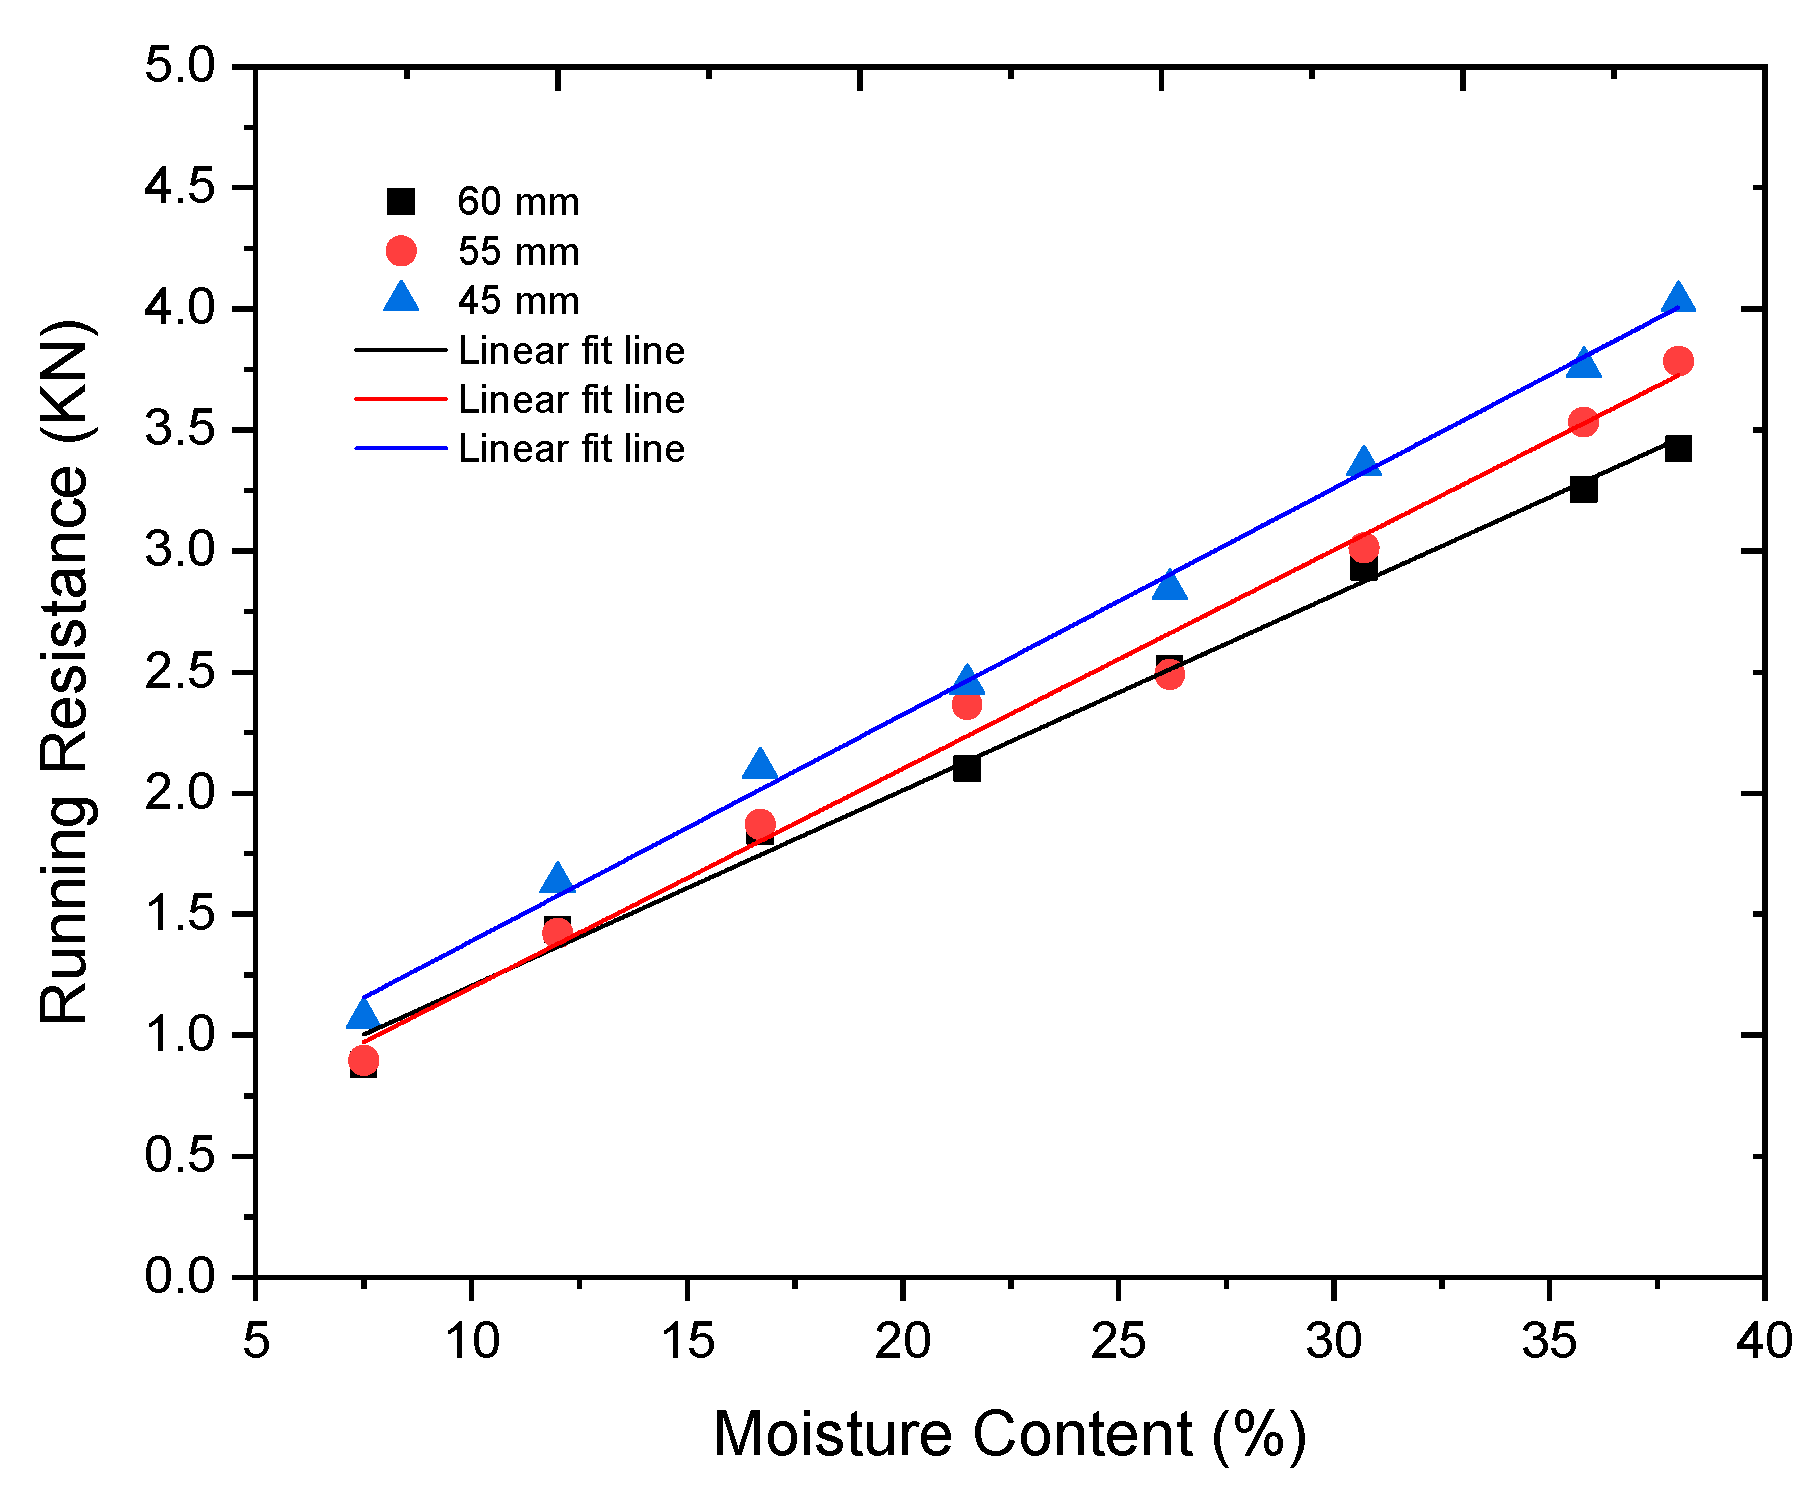
3.7.2. Motion (Running) Resistance of the Single-Track Shoe

The Running resistance of single-track shoe with three grouser heights at eight moisture contents is shown in Figure 20. The result running resistance showed the variation from 1.07 to 4.03, 0.89 to 3.78, and 0.87 to 3.42 KN for 45, 55 and 60-mm grouser height, respectively. The linear increasing trend was found in results because moisture content directly proportionated the running resistance. The major rise in running resistance was recorded with 45 mm height at 38% moisture content as compared to 55 and 60 mm height. It is clear from the results that, when the contact area was increased the running resistance decreases because of less sinkage, it also leads to increased net traction. The linear fitting was performed to get best fit, the coefficient of determination for running resistance was 0.99612, 0.98938 and 0.99232 calculated for 45, 55 and 60 mm grouser height, respectively Present results are in agreement with the reported results that increase in running resistance was determined with the increase in moisture content [37,50,51]. Another study reported that the softer, wetter, and more slippery the soil, the smaller the traction and greater the running resistance [52]. Actually, the dynamic transformation of the soil flow produced by the grouser can be found, as the grouser height is adequately high [19].

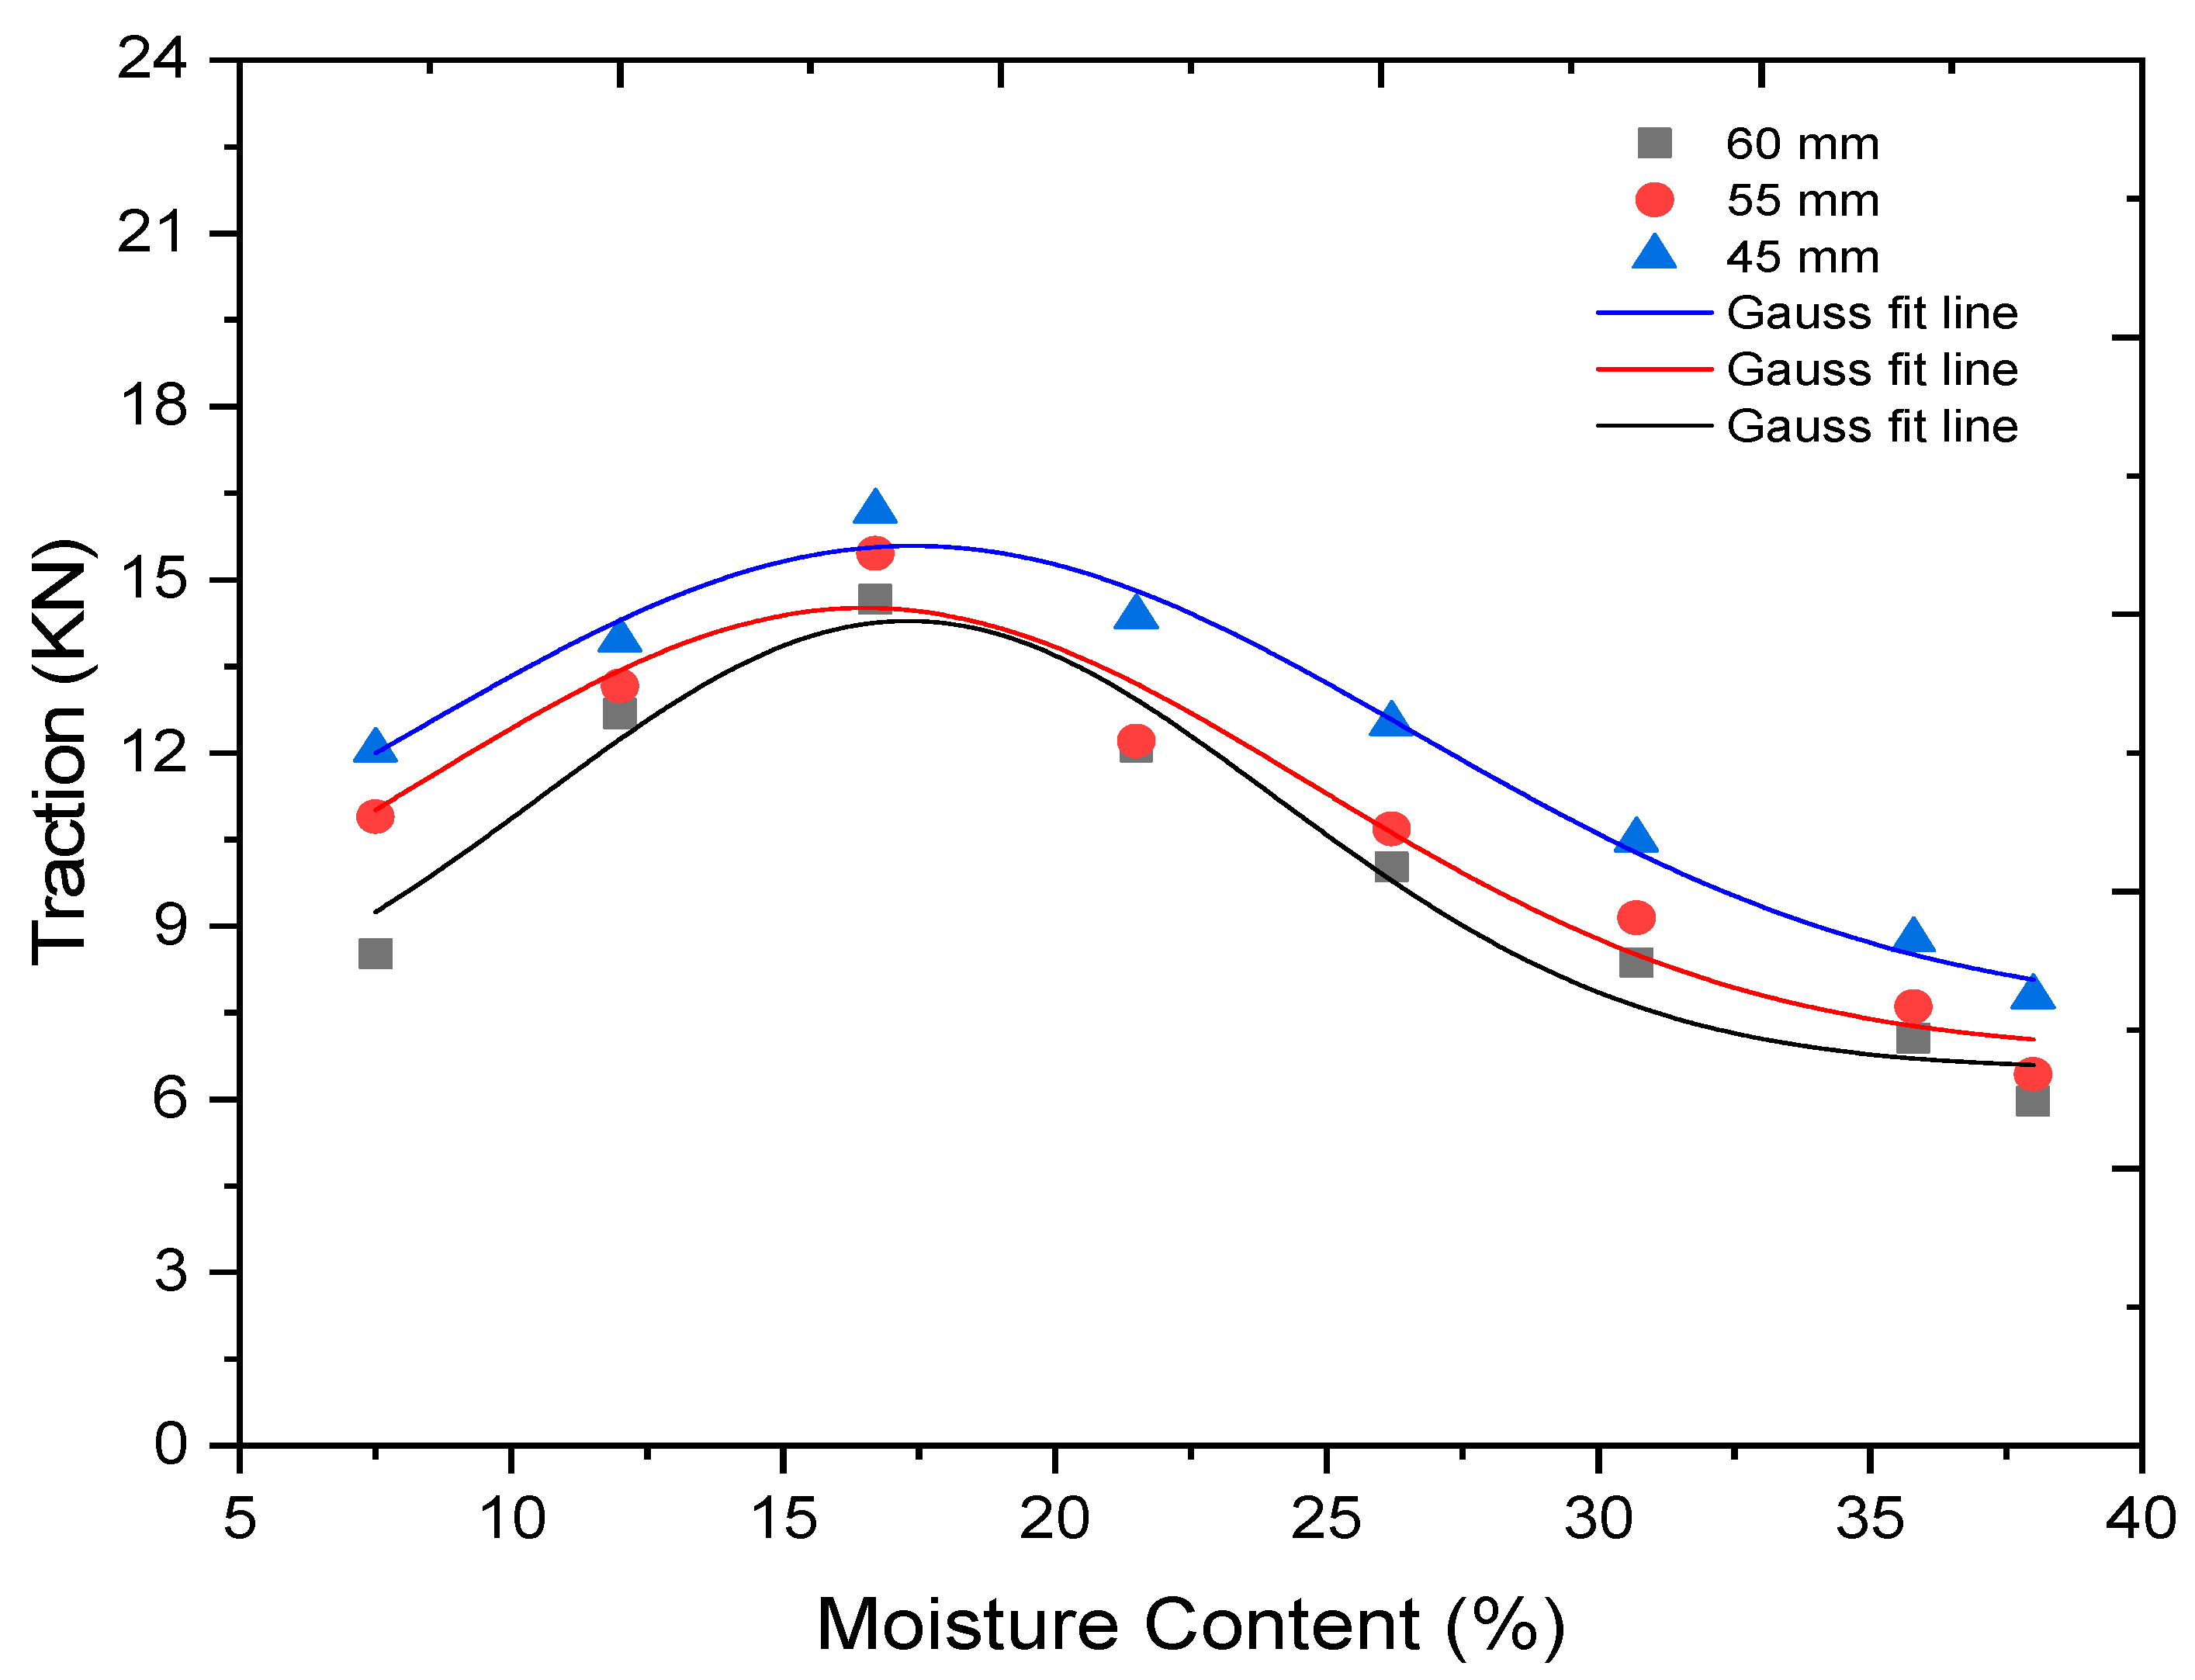
3.7.3. Tractive Effort (Traction) of Single-Track Shoe

Figure 21 shows the results of the tractive effort of a single-track shoe with three grouser heights for eight moisture contents. The variation in the result was found for each height at all moisture content, initially, the traction of single-track shoe increased with an increased in moisture content until 16.7%, then it decreased steadily until the end of the experiment 38%. The mean maximum traction 16.189, 15.452, and 14.66 KN, similarly minimum was 7.78, 6.43, and 5.97 KN was determined for 45, 55 and 60 mm grouser height at 16.7% and 38% moisture content, respectively. Results indicated the more traction with smaller grouser height (45 mm) as compared to larger heights, and when soil is wetter the tractive effort was less. The gauss model was used to perform non-linear curve fitting and coefficient of determination, adjusted R square was 0.92468, 0.91853 and 0.97225 for 45, 55 and 60 mm height, respectively. Previous studies reported that soft soil can drastically reduce the traction performance [53,54], traction efficiency of two-wheel agricultural tractor reduced in soft soil [37,55], the moisture content between 15% and 20% is ideal for the net traction, greater the moisture content lower the traction [56]. Presented results are in close agreement with these results. Spacing between the grouse also influences on the sinkage, and gross traction [20].

4. Conclusions

The effect of grouser height on the tractive performance of single grouser shoe at eight moisture content was studied in this research. The semi-empirical method for tractive performance of grouser was used, which is based on Bekker’s bevameter method. Soil cohesive and friction modulus were increased with moisture content while the sinkage exponent was decreased. Soil sinkage increased with an increase in moisture content, soil cohesion decreased, and adhesion was initially increased to 21.5%, then decreased until the end level 38%. Soil dry bulk density varied from 1394 to 2621 Kg/m3. Maximum soil thrust was observed at 4.5 cm grouser height at 16.5% moisture content. The running resistance was decreased with a rise in moisture content, the major decrease was in 4.5 cm grouser height at 38% moisture content. Traction is the difference of soil thrust to running resistance, the grouser height 4.5 cm height showed the best results, followed by 5.5 and 6 cm grouser height at moisture contents (7.5–38%). It could be concluded that an off-road tracked vehicle (crawler combine harvester) with 4.5 cm grouser height of single-track shoe could be operated towards moderate moisture content (16.7–21.5%) under paddy soil for achieving better traction.

Author Contributions

Conceptualization, L.Y. and S.A.S.; methodology, L.Y., S.A.S., M.Z. and F.A.C.; investigation, L.Y., S.A.S. and M.Z.; data collection, S.A.S., formal analysis, F.A., F.A.C. and I.A.; writing-review and editing, L.Y., S.A.S., M.H.T. and F.A.; supervision, L.Y. All authors have read and agreed to the published version of the manuscript.

Funding

This research was funded by the National Natural Science Foundation, 51975256, a project funded by Priority Academic Program of the Development of Jiangsu Higher Education Institutions (PAPD).

Institutional Review Board Statement

Not applicable.

Informed Consent Statement

Not applicable.

Data Availability Statement

The data presented in this study are available in the main body of this manuscript.

Conflicts of Interest

The authors declare no conflict of interest.

References

  1. Wong, J.Y. Theory of Ground Vehicles, 3rd ed.; John Wiley & Sons: New York, NY, USA, 2001. [Google Scholar]
  2. Bekker, M.G. Introduction of Terrain Vehicle Systems; University of Michigan Press: Ann Arbor, MI, USA, 1969. [Google Scholar]
  3. Conte, O.; Levien, R.; Debiasi, H.; Stürmer, S.L.K.; Mazurana, M.; Müller, J. Soil disturbance index as an indicator of seed drill efficiency in no-tillage agrosystems. Soil Tillage Res. 2011, 114, 37–42. [Google Scholar] [CrossRef]
  4. Chen, Y.; Munkholm, L.J.; Nyord, T. A discrete element model for soil–sweep interaction in three different soils. Soil Tillage Res. 2013, 126, 34–41. [Google Scholar] [CrossRef]
  5. Rajaram, G.; Erbach, D.C. Drying stress effect on mechanical behaviour of a clay-loam soil. Soil Tillage Res. 1998, 49, 147–158. [Google Scholar] [CrossRef]
  6. Abubakar, M.S.; Ahmad, D.; Othman, J.; Sulaiman, S. Mechanical properties of paddy soil in relation to high clearance vehicle mobility. Aust. J. Basic Appl. Sci. 2010, 4, 906–913. [Google Scholar]
  7. Lyasko, M. Multi-pass effect on off-road vehicle tractive performance. J. Terramech. 2010, 47, 275–294. [Google Scholar] [CrossRef]
  8. Wong, J.Y. Methods for evaluating tracked vehicle performance. In Terramechanics and Off-Road Vehicle Engineering; Elsevier: Amsterdam, The Netherlands, 2010; pp. 155–176. ISBN 978-0-7506-8561-0. [Google Scholar]
  9. Chang, B.-S.; Baker, W.J. Soil parameters to predict the performance of off-road vehicles. J. Terramech. 1973, 9, 13–31. [Google Scholar] [CrossRef]
  10. Soltynski, A. The mobility problem in agriculture. J. Terramech. 1979, 16, 139–149. [Google Scholar] [CrossRef]
  11. Bodin, A. Development of a tracked vehicle to study the influence of vehicle parameters on tractive performance in soft terrain. J. Terramech. 1999, 36, 167–181. [Google Scholar] [CrossRef]
  12. Zoz, F.M. Predicting tractor field performance. Trans. ASAE 1972, 15, 0249–0255. [Google Scholar] [CrossRef]
  13. Tiwari, V.K.; Pandey, K.P.; Pranav, P.K. A review on traction prediction equations. J. Terramech. 2010, 47, 191–199. [Google Scholar] [CrossRef]
  14. Grisso, R.; Perumpral, J.; Zoz, F. An empirical model for tractive performance of rubber-tracks in agricultural soils. J. Terramech. 2006, 43, 225–236. [Google Scholar] [CrossRef]
  15. Nakashima, H.; Yoshida, T.; Wang, X.L.; Shimizu, H.; Miyasaka, J.; Ohdoi, K. Comparison of gross tractive effort of a single grouser in two-dimensional DEM and experiment. J. Terramech. 2015, 62, 41–50. [Google Scholar] [CrossRef]
  16. Abou-Zeid, A.S. Distributed Soil Displacement and Pressure Associated with Surface Loading. Ph.D. Thesis, University of Saskatchewan, Saskatoon, SK, Canada, 2004. [Google Scholar]
  17. Nagaoka, K.; Sawada, K.; Yoshida, K. Shape effects of wheel grousers on traction performance on sandy terrain. J. Terramech. 2020, 90, 23–30. [Google Scholar] [CrossRef]
  18. Li, J.; Liu, S.; Dai, Y. Effect of grouser height on tractive performance of tracked mining vehicle. J. Braz. Soc. Mech. Sci. Eng. 2017, 39, 2459–2466. [Google Scholar] [CrossRef]
  19. Yamanoa, Y.; Nagaokaa, K.; Yoshidaa, K. PIV analysis of soil deformation beneath a grouser wheel. In Proceedings of the 10th Asia-Pacific Conference ISTVS, Kyoto, Japan, 11–13 July 2018. [Google Scholar]
  20. Yokoyama, A.; Nakashima, H.; Shimizu, H.; Miyasaka, J.; Ohdoi, K. Effect of open spaces between grousers on the gross traction of a track shoe for lightweight vehicles analyzed using 2D DEM. J. Terramech. 2020, 90, 31–40. [Google Scholar] [CrossRef]
  21. Reeb, J.E.; Milota, M.R.; Association, W.D.K. Moisture content by the oven-dry method for industrial testing. Engineering 1999. Available online: ir.library.oregonstate.edu (accessed on 10 August 2020).
  22. Tiwari, V.K.; Pandey, K.P.; Sharma, A.K. Development of a tyre traction testing facility. J. Terramech. 2009, 46, 293–298. [Google Scholar] [CrossRef]
  23. Massah, J.; Noorolahi, S. Effects of tillage operation on soil properties from Pakdasht, Iran. Int. Agrophys. 2008, 22, 143–146. [Google Scholar]
  24. Bahnasy, A.M.F. Utilization of different soil sinkage plates to predict tire inflation pressure and its sinkage under different soil conditions. Misr. J. Agric. Eng. 2012, 29, 531–552. [Google Scholar] [CrossRef]
  25. Upadhyaya, S.K.; Wulfsohn, D.; Mehlschau, J. An instrumented device to obtain traction related parameters. J. Terramech. 1993, 30, 1–20. [Google Scholar] [CrossRef]
  26. Gotteland, P.; Benoit, O. Sinkage tests for mobility study, modelling and experimental validation. J. Terramech. 2006, 43, 451–467. [Google Scholar] [CrossRef]
  27. Liu, K.; Ayers, P.; Howard, H.; Anderson, A. Lateral slide sinkage tests for a tire and a track shoe. J. Terramech. 2010, 47, 407–414. [Google Scholar] [CrossRef]
  28. Rashidi, M.; Fakhri, M.; Sheikhi, M.; Azadeh, S.; Razavi, S. Evaluation of Bekker model in predicting soil pressure-sinkage behaviour under field conditions. Middle East J. Sci. Res. 2012, 12, 1364–1369. [Google Scholar]
  29. Malý, V.; Kučera, M. Determination of mechanical properties of soil under laboratory conditions. Res. Agric. Eng. 2014, 60, S66–S69. [Google Scholar] [CrossRef] [Green Version]
  30. Baek, S.-H.; Shin, G.-B.; Lee, S.-H.; Yoo, M.; Chung, C.-K. Evaluation of the slip sinkage and its effect on the compaction resistance of an off-road tracked vehicle. Appl. Sci. 2020, 10, 3175. [Google Scholar] [CrossRef]
  31. Zhang, J.X.; Sang, Z.Z.; Gao, L.R. Adhesion and friction between soils and solids. Nung Yeh Chi Hsieh Hsueh Pao Trans. Chin. Soc. Agric. Mach. 1986, 17, 32–40. [Google Scholar]
  32. Zhao, J.; Wang, W.; Sun, Z.; Su, X. Improvement and verification of pressure-sinkage model in homogeneous soil. Trans. Chin. Soc. Agric. Eng. 2016, 32, 60–66. [Google Scholar]
  33. Yang, C.; Yang, G.; Liu, Z.; Chen, H.; Zhao, Y. A method for deducing pressure–sinkage of tracked vehicle in rough terrain considering moisture and sinkage speed. J. Terramech. 2018, 79, 99–113. [Google Scholar] [CrossRef]
  34. Ge, J.; Zhang, D.; Wang, X.; Cao, C.; Fang, L.; Duan, Y. Tractive performances of single grouser shoe affected by different soils with varied moisture contents. Adv. Mech. Eng. 2019, 11. [Google Scholar] [CrossRef] [Green Version]
  35. Huang, K.; Wan, J.W.; Chen, G.; Zeng, Y. Testing study of relationship between water content and shear strength of unsaturated soils. Rock Soil Mech. 2012, 33, 2600–2604. [Google Scholar]
  36. Zydroń, T.; Dąbrowska, J. The influence of moisture content on shear strength of cohesive soils from the landslide area around Gorlice. AGH J. Min. Geoengin 2012, 36, 309–317. [Google Scholar]
  37. Jun, G.; Xiulun, W.; Kito, K. Comparing tractive performance of steel and rubber single grouser shoe under different soil moisture contents. Int. J. Agric. Biol. Eng. 2016, 9, 11–20. [Google Scholar]
  38. Mouazen, A.M.; Ramon, H.; De Baerdemaeker, J. SW—Soil and water: Effects of bulk density and moisture content on selected mechanical properties of sandy loam soil. Biosyst. Eng. 2002, 83, 217–224. [Google Scholar] [CrossRef]
  39. Bravo, E.L.; Suárez, M.H.; Cueto, O.G.; Tijskens, E.; Ramon, H. Determination of basics mechanical properties in a tropical clay soil as a function of dry bulk density and moisture. Revista Ciencias Técnicas Agropecuarias 2012, 21, 5–11. [Google Scholar]
  40. Adeniran, K.A.; Babatunde, O.O. Investigation of wetland soil properties affecting optimum soil cultivation. J. Eng. Sci. Technol. 2010, 3, 23–26. [Google Scholar] [CrossRef]
  41. Abbaspour-Gilandeh, Y.; Fazeli, M.; Roshanianfard, A.; Hernández-Hernández, J.L.; Fuentes Penna, A.; Herrera-Miranda, I. Effect of different working and tool parameters on performance of several types of cultivators. Agriculture 2020, 10, 145. [Google Scholar] [CrossRef]
  42. Komandi, G. On the mechanical properties of soil as they Affect traction. J. Terramech. 1992, 29, 373–380. [Google Scholar] [CrossRef]
  43. Han, Z.; Li, J.; Gao, P.; Huang, B.; Ni, J.; Wei, C. Determining the shear strength and permeability of soils for engineering of new paddy field construction in a hilly mountainous region of Southwestern China. Int. J. Environ. Res. Public Health 2020, 17, 1555. [Google Scholar] [CrossRef] [Green Version]
  44. McKyes, E.; Nyamugafata, P.; Nyamapfene, K.W. Characterization of cohesion, friction and sensitivity of two hardsetting soils from Zimbabwe. Soil Tillage Res. 1994, 29, 357–366. [Google Scholar] [CrossRef]
  45. Rajaram, G.; Erbach, D.C. Effect of wetting and drying on soil physical properties. J. Terramech. 1999, 36, 39–49. [Google Scholar] [CrossRef]
  46. Mari, I.A.; Changying, J.; Leghari, N.; Chandio, F.A.; Arslan, C.; Hassan, M. Impact of tillage operation on soil physical, mechanical and rhelogical properties of paddy soil. Bulg. J. Agric. Sci. 2015, 21, 940–946. [Google Scholar]
  47. Shaikh, S.A.; Yaoming, L.; Chandio, F.A.; Tunio, M.H.; Ahmad, F.; Mari, I.A.; Solangi, K.A. Effect of wheat residue incorporation with tillage management on physico-chemical properties of soil and sustainability of maize production. Fresenius Environ. Bull. 2020, 29, 10. [Google Scholar]
  48. Hermawan, W.; Oida, A.; Yamazaki, M. The characteristics of soil reaction forces on a single movable lug. J. Terramech. 1997, 34, 23–35. [Google Scholar] [CrossRef]
  49. Xie, Z.; Wang, X.L.; Ge, J. Effect of soil moisture content on tractive performance of single grouser shoe in tracked vehicle. Int. Inf. Inst. Tokyo Inf. Koganei 2019, 22, 229–240. [Google Scholar]
  50. Wang, X.L.; Ito, N.; Kito, K. Studies on grouser shoe dimension for optimum tractive performance (part 2) effect on thrust, rolling resistance and traction. Agric. Mach. J. Jpn. 2002, 64, 55–60. [Google Scholar]
  51. Keen, A.; Hall, N.; Soni, P.; Gholkar, M.D.; Cooper, S.; Ferdous, J. A review of the tractive performance of wheeled tractors and soil management in lowland intensive rice production. J. Terramech. 2013, 50, 45–62. [Google Scholar] [CrossRef] [Green Version]
  52. Abubakar, M.S.; Ahmad, D.; Othman, J.; Suleiman, S. Present state of research on development of a high clearance vehicle for paddy fields. Res. J. Agric. Biol. Sci. 2009, 5, 489–497. [Google Scholar]
  53. Senatore, C. Prediction of Mobility, Handling, and Tractive Efficiency of Wheeled Off-Road Vehicles. Ph.D. Thesis, Virginia Tech, Blacksburg, VA, USA, 2010. [Google Scholar]
  54. Rasool, S.; Raheman, H. Suitability of rubber track as traction device for power tillers. J. Terramech. 2016, 66, 41–47. [Google Scholar] [CrossRef]
  55. McKyes, E. Soil Cutting and Tillage; Elsevier: New York, NY, USA, 1985. [Google Scholar]
  56. Schreiber, M.; Kutzbach, H.D. Influence of soil and tire parameters on traction. Res. Agric. Eng. 2008, 54, 43–49. [Google Scholar] [CrossRef] [Green Version]
Figure 1. Flow diagram of the experimental procedure.
Sustainability 13 01156 g001
Figure 2. Forces acting on single track shoe.
Sustainability 13 01156 g002
Figure 3. Strain controlled direct shear test apparatus ZJ type.
Sustainability 13 01156 g003
Figure 4. Designed device for the Penetration test.
Sustainability 13 01156 g004
Figure 5. Original picture of the designed penetration device
Sustainability 13 01156 g005
Figure 6. Soil sinkage and reaction force for plate 1 and 2 at 7.5% (A) and 12% (B).
Sustainability 13 01156 g006
Figure 7. Soil sinkage and reaction force for plate 1 and 2 at 16.7% (A) and 21.5% (B).
Sustainability 13 01156 g007
Figure 8. Soil sinkage and reaction force for plate 1 and 2 at 26.2% (A) and 30.7% (B).
Sustainability 13 01156 g008
Figure 9. Soil sinkage and reaction force for plates 1 and 2 at 35.8% (A) and 38% (B).
Sustainability 13 01156 g009
Figure 10. Soil cohesive (Kc) and friction modulus () at moisture contents (7.5–38%).
Sustainability 13 01156 g010
Figure 11. Soil sinkage exponent (n) at moisture contents (7.5–38%).
Sustainability 13 01156 g011
Figure 12. Soil cohesion at moisture contents (7.5–38%).
Sustainability 13 01156 g012
Figure 13. Soil Adhesion at moisture contents (7.5–38%)
Sustainability 13 01156 g013
Figure 14. Internal and external friction angle of soil at moisture contents (7.5–38%).
Sustainability 13 01156 g014
Figure 15. Soil bulk density at moisture contents (7.5–38%).
Sustainability 13 01156 g015
Figure 16. Soil thrust at grouser tip surface with three grouser heights at moisture contents (7.5–38%).
Sustainability 13 01156 g016
Figure 17. Soil thrust at grouser and spacing lateral sides and spacing surface with three grouser heights at moisture contents (7.5–38%).
Sustainability 13 01156 g017
Figure 18. Soil thrust at the bottom surface of grouser with three grouser heights at moisture contents (7.5–38%).
Sustainability 13 01156 g018
Figure 19. Total soil thrust generated at single track shoe with three grouser heights at moisture contents (7.5–38%).
Sustainability 13 01156 g019
Figure 20. Grouser running resistance of single-track shoe with three grouser heights at moisture contents (7.5–38%).
Sustainability 13 01156 g020
Figure 21. Traction of the single-track shoe with three grouser heights at moisture contents (7.5–38%).
Sustainability 13 01156 g021
Table 1. Dimension details of single-track shoe model.
ParametersDimensions (mm)
Length, L100
Width, B 150
Height of grouser, h60, 55, 45
Grouser thickness ratio, λL6
The thickness of the shoe plate, t40
Publisher’s Note: MDPI stays neutral with regard to jurisdictional claims in published maps and institutional affiliations.

