Article

Technical Efficiency of Chemical Fertilizer Use and Its Influencing Factors in China’s Rice Production

Institute of Agricultural Economics and Development, Chinese Academy of Agricultural Sciences, Beijing 100081, China
*
Author to whom correspondence should be addressed.
Sustainability 2021, 13(3), 1155; https://doi.org/10.3390/su13031155
Submission received: 27 November 2020 / Revised: 5 January 2021 / Accepted: 19 January 2021 / Published: 22 January 2021
(This article belongs to the Section Sustainable Management)

Abstract

:
Low technical efficiency and excessive usage of chemical fertilizer in grain production is a problem commonly faced by China and many other developing countries, which leads to serious environment pollution and high environmental governance cost. China is the largest rice producing and consuming country, and several kinds of rice are grown in China and all of which are important edible grain. However, there has been no systematic research on kind difference and provincial difference of technical efficiency of chemical fertilizer use (TEFU) for rice production. Using the data of China’s 22 rice production provinces from the China Agricultural Product Cost-Benefit Compilation and the China Statistical Yearbook, this study measures the TEFU for early indica rice, intermediary indica rice, late indica rice, and japonica rice production by using a stochastic frontier production function (SFPF) model, and then analyzes TEFU’s influencing factors using a Tobit model and conducts the robustness check using a panel data fixed effect model. We found that, on average, TEFU for four kinds of rice production were improved significantly during 1997–2018, increasing by 67.70%, 39.93%, 14.76%, and 21.88%, respectively. TEFU for China’s rice production have significant differences among different kinds and production provinces, and still have large improvement potential. Government’s fiscal support to agriculture, agricultural labor productivity, agricultural mechanization, effective irrigation, and implementation of the “Soil Testing and Formulated Fertilization Program” (STFFP) have significant positive impact on TEFU; and natural disaster and fertilizer price have significant negative impact on TEFU.

1. Introduction

Chemical fertilizer is an important input in grain production, known as the “food” for grain. Serving as one of the most fundamental determinants of grain yield, chemical fertilizer contributed more than 40% to the improvement of China’s grain yield [1], and played an irreplaceable role in ensuring China’s food security [2,3]. The average chemical fertilizer usage per hectare in China’s grain production increased from 258.54 kg/ha in 1997 to 362.99 kg/ha in 2014, then began to decrease since 2015 and arrived at 340.77 kg/ha in 2018, but still 31.81% higher than that in 1997 [4]. Compared with 225 kg/ha, the maximum safe usage internationally recognized [2], the intensity of chemical fertilizer in China’s grain production is still in low use efficiency with excessive usage mainly because of poor soil nutrient management [5,6,7], which leads to excessive nutrient pollutants runoff into the natural environment and severe nonpoint source pollution in many Chinese rivers such as the Yangtze rivers and seas such as the Yellow Sea [8,9,10,11], and high environmental governance cost for government [12,13]. The problem will likely continue to increase in the future, as a result of the food demand by a growing population in China [14], and is also widespread in many other developing countries [15].
Rice is a very important food in China and worldwide [14]. Rice accounts for 34% and 30% of China’s grain production and planting area [4]. As the world’s largest rice producing and consuming country, China’s rice production and consumption in 2019 accounted for 28.17% and 28.75% of the world’s, respectively [14]. In recent years, China’s rice has an even more severe chemical fertilizer use efficiency problem than other grains [7]. The average intensity of chemical fertilizer for rice reached 338.25 kg/ha, compared to 411.15 kg/ha for wheat and 371.70 kg/ha for maize [4].
In order to move to a more sustainable grain production, especially for rice and other major grain, and comprehensively achieve the Sustainable Development Goals (SDGs) set out in the 2030 Agenda for Sustainable Development as soon as possible by 2030, of the 17 SDGs and their 169 associated targets, four SDGs contain targets related to sustainable soil nutrient management [16], considering farmers’ lack of knowledge regarding chemical fertilizer use is a main cause of low use efficiency with excessive usage [5,6,7], China’s soil nutrient management policies needs to be improved urgently [17,18].
Since 2005, in order to scientifically accelerate use efficiency improvement and usage reduction of chemical fertilizer, and guarantee safe and efficient grain supply, Chinese government has implemented the “Soil Testing and Formulated Fertilization Program” (STFFP) since 2005, at the county level within a specific time, soil tests and field trials were conducted across the nation to detect the content of major nutrients in soil, including nitrogen (N), phosphorus (P), and potassium(K), and based on the results of which, scientific county-specific fertilizer usage and timing for rice and other major crops and different types of formulated fertilizers were determined, and techniques of STFFP and formulated fertilizer were promoted to achieve optimal soil nutrient management [19]. In 2015, the Action Plan for Zero Growth in Chemical Fertilizer Usage by 2020 was put into effect, aiming to significantly improve use efficiency and realize usage zero growth of chemical fertilizer for grain production by 2020 [20]. In recent years, under the background of increasingly scarce endowment of agricultural resources, greater governance pressure from nonpoint sources pollution, and tend-to-shrink marginal contribution of chemical fertilizer to grain yield [21,22,23,24], the research on chemical fertilizer use efficiency for rice and other major grain production and its influencing factors, especially the impact of STFFP, has important practical significance and scientific value, which can evaluate the effectiveness of present government policies on use efficiency improvement and usage reduction of chemical fertilizer, and provide empirical evidences for policies optimization.
There are two types of method for measuring chemical fertilizer use efficiency for grain production: the index method [2,25,26,27] and the model method [1,28,29,30]. The index method mainly includes the Recovery Efficiency Index, Partial Factor Production Index, Agronomic Efficiency Index, and Physiological Efficiency Index [2], which measure the proportional relation between yield and intensity of chemical fertilizer from the perspective of agronomy; the index method is easy to understand, but fails to holistically reflect whole input–output process in grain production because treating chemical fertilizer as the only input. The model method refers to the stochastic frontier production function (SFPF) model, which is based on the modern economic efficiency theory and set on the “multi-input, single-output” relation. Adopting the stochastic production frontier (SPF) technique [31,32], technical efficiency (TE) is measured firstly, represented by the ratio between observed output and theoretical maximum output denoted by production frontier; then based on TE, technical efficiency of chemical fertilizer use (TEFU) is estimated, indicated by the ratio between theoretical minimum usage and observed usage of chemical fertilizer [33,34].The model method extends single-input into multi-inputs, and takes most inputs into consideration, better reflecting the economic meaning of technical efficiency, and more in line with actual grain production [35].
TEFU and its influencing factors in China’s grain production have aroused attention of academia in China and abroad. It is found in relevant literatures that TEFU for China’s rice, wheat, and corn production were still low and had significant differences at farmer level [1,29,35,36,37,38]. Furthermore, the Tobit model [1,29,30,36,37,39] and difference-in-difference (DID)model [37] were used to analyze TEFU’s influencing factors. At the macro level, significant positive effect was found in government’s fiscal support for agriculture and famers’ income [1,36,37], and significant negative effect was found in ratio of off-farm labor transfer, fertilizer price, and natural disaster [35]. At the micro level, there were many factors that significantly affected TEFU, including household characteristics (such as age, educational attainment, quantity of household labor force, and ratio of migrant labor force), and agricultural production characteristics (such as area of arable land, quality of arable land, fragmentation of arable land, agro-technique training, and cooperative participation) [1,26,35]. In relevant literatures, TEFU is measured at the level of whole grain and without segmentation analysis on various kinds of grain, data are mainly acquired from farmer survey in a given province and year, and research conclusions are incapable of explaining the long-term characteristics of change in TEFU at multi-provincial level.
According to shape and trait, rice is categorized into indica rice and japonica rice, planting areas of which accounting for approximately 70% and 30%, respectively, in China [40]; and according to the differences in seeding time, growing season and maturation period, indica rice is further categorized into early indica rice, intermediary indica rice, and late indica rice. What is the evolution trend of TEFU for China’s four kinds of rice production? Are there significant differences among different kinds and production provinces? What factors are affecting the evolution trend and its difference? No systematic studies have been done on these questions presently. Therefore, taking China’s 22 production provinces of early indica rice, intermediary indica rice, late indica rice, and japonica rice as examples, this study measures TEFU for China’s four kinds of rice production by adopting a SFPF model, and then analyzes its influencing factors using a Tobit model and further check the robustness using a panel data fixed effect model.

2. Materials and Methods

2.1. Model for Measuring TEFU

Given the production technology being specified a priori, the stochastic production frontier (SPF) technique is defined as [32,41]:
Y i t = β X i t + V i t U i t
where Y i t denotes output; X i t represents input; β is X i t ’s coefficient; V i t is the random error term that reflects statistical error, and subject to independent normal distribution N 0 , σ v 2 with mean 0 and variance σ v 2 ; U i t is the non-negative random error term that reflects technical inefficiency, and subject to independent truncated half-normal distribution N + m i t , σ u 2 with mean m i t and variance σ u 2 . U i t and V i t are mutually independent to each other.
Based on Equation (1), we firstly developed the following panel data SFPF model for measuring technical efficiency (TE) for China’s rice production:
L n Y i t = f L n X i t , T ; β exp ( V i t U i t )
where i indicates the ith province; t represents year; Y i t represents rice yield in ith province; X i t is the input in ith province’s rice production; T is the time trend item.
Given technical level and inputs are unchanged at observed levels, TE is defined as the ratio between observed yield and theoretical maximum yield when U i t = 0 . Then TE can be expressed as:
T E i t = E ( Y i t * | U i t , X i t ) / E ( Y i t * | U i t = 0 , X i t ) = exp ( V i t U i t ) / exp ( V i t ) = exp ( U i t )
where E ( Y i t * | U i t , X i t ) is observed yield; E ( Y i t * | U i t = 0 , X i t ) is theoretical maximum yield. T E i t = 1 when U i t = 0 , which means there is no technical efficiency loss, and all the gap between E ( Y i t * | U i t , X i t ) and E ( Y i t * | U i t = 0 , X i t ) comes from V i t . 0 T E i t < 1 When 0 < U i t 1 , which means there is technical efficiency loss, and the gap is collectively caused by U i t and V i t . The measure of TE is an output-oriented measure.
The specification of the SFPF model includes Translog and Cobb–Douglas [26]. In order to derive TEFU’s measure equation, by reference to the measure proposed by Reinhard et al. [33,34] and Huang et al. [42], we model the environmental effect as a conventional input rather than as an undesirable output from a nonradial input-oriented measure perspective, and firstly develop the Translog SFPF model as:
ln Y i t = β 0 + β F ln F e r i t + j = 1 n β j ln Z i t j + 1 2 β F F ( ln F e r i t ) 2 + 1 2 j = 1 n β F j ln F e r i t ln Z i t j + 1 2 j = 1 n k = 1 j β j k ln Z i t j ln Z i t k + V i t U i t
where Fer is observed intensity of chemical fertilizer; Z is the other inputs; β 0 is constant term. When U i t = 0 , there is no technical efficiency loss, and techniques of rice production are efficient ( T E = 1 ). Supposing F e r * is theoretical minimum intensity of chemical fertilizer when techniques of chemical fertilizer use are efficient, and given technical level and other inputs are unchanged at observed levels, then TEFU can bedefined as:
ln T E F U i t = ln F e r i t * ln F e r i t
Equation (4) can be further written as:
ln Y i t = β 0 + β F ln F e r i t * + j = 1 n β j ln Z i t j + 1 2 β F F ( ln F e r i t * ) 2 + 1 2 j = 1 n β F j ln F e r i t * ln Z i t j + 1 2 j = 1 n k = 1 j β j k ln Z i t j ln Z i t k + V i t
Combining Equations (4) and (6):
1 2 β F F ( ln F e r i t * ln F e r i t ) 2 + ϕ ln F e r i t * ln F e r i t + U i t = 0
where ϕ = β F + β F F ln F e r i t + j = 1 n β F j ln Z i t j . Combining Equations (5) and (7):
1 2 β F F ( ln T E F U i t ) 2 + ϕ ln T E F U i t + U i t = 0
Solving Equation (8):
ln T E F U i t = ϕ ± ϕ 2 2 β F F U i t / β F F
According to Equation (9), when techniques of rice production are efficient ( T E = 1 ),   ln T E F U i t = 0 only when the solution to ln T E F U i t is expressed as Equation (10) and techniques of chemical fertilizer use are also efficient ( T E = 1 ). Therefore, TEFU for Translog SFPF model can be expressed as:
T E F U i t = exp [ ( ϕ + ϕ 2 + 2 β F F ln T E i t ) / β F F ]
Similarly, we also develop the Cobb–Douglas SFPF model as:
ln Y i t = β 0 + β F ln F e r i t + j = 1 n β j ln Z i t j + V i t U i t
When both of techniques of rice production and techniques of chemical fertilizer use are efficient, Equation (11) can be further expressed as:
ln Y i t = β 0 + β F ln F e r i t * + j = 1 n β j ln Z i t j + V i t
Combining Equations (11) and (12):
β F ln F e r i t * ln F e r i t + U i t = 0
Combining Equations (5) and (13):
ln T E F U i t = U i t / β F
Therefore, TEFU for Cobb–Douglas SFPF model can be represented as:
T E F U i t = exp ( U i t / β F ) = exp [ ln T E i t / β F ) ] = exp ( ln T E i t / β F )
In this study, data of output and input variables for measuring TEFU for China’s four kinds of rice production are from the China Agricultural Product Cost-Benefit Compilation [43], which includes data of output and input variables of China’s most rice production provinces. Considering the continuity and integrity of data of output and input variables, we selected 22 rice production provinces as shown in Table 1, and the accumulative rice production and planting area of which have totally accounted for 98.47% and 98.75% of China, respectively, in 2018.
Inputs in Chinese farmers’ rice production include chemical fertilizer, seed, pesticide, labor force of farmers and employees, animal power, machinery, fuel, agricultural film, and canopy frame materials [40]. Chemical fertilizer, seed, pesticide, and labor force are the fundamental inputs during rice production, and all the yearly statistical data of which are available for each rice production province included in the China Agricultural Product Cost-Benefit Compilation [43]. But other inputs such as animal power, machinery, fuel, agricultural film, and canopy frame materials, are not used in each rice production province within each year. Therefore, referring to relevant literatures [1,25,26,36,37,38], we chose rice yield as output variable of rice production, and chemical fertilizer usage, seed usage, pesticide expenditure, number of labor force including both farmers and employees, and other expenditure that refer to the total expenditure of all other inputs as input variables. Considering that all output and input variables are valued at 1 hectare, the input variables do not include area of arable land. Sample period of input and output variables is 1997–2018.
In order to eliminate the impact of price fluctuation, provincial price index of agricultural input from the China Statistical Yearbook adjusted with 1997 as base [4], is used to process the original data of pesticide expenditure and other expenditure. According to Table 2, during the sample period, average intensity of chemical fertilizer for japonica rice is obviously higher than that for early indica rice, intermediary indica rice, and late indica rice. It is because, in China, indica rice usually has a growing period less than 180 days and can be multi-cropping, and growing period of early indica rice, intermediary indica rice and late indica rice is 90–120 days, 120–150 days, and 150–180 days respectively; Japonica rice usually has a longer growing period about 200 days and is single-cropping, therefore, need larger usage of chemical fertilizer than indica rice [40].

2.2. Model for Estimating TEFU’s Influencing Factors

TEFU is a non-negative and discretely distributed random variable with value range between 0 and 1. When using the TEFU as the dependent variable, ordinary least square (OLS) is not suitable for estimating TEFU’s influencing factors and the Tobit model, one of the limited dependent variable model (LDVM) should be adopted. Therefore, based on the Tobit model, we further develop following model for estimating TEFU’s influencing factors:
T E F U i t = 0 δ 0 + δ j x i j t + ε i t 0 T E F U i t * 0 < δ 0 + δ j x i j t + ε i t < 1 1 δ 0 + δ j x i j t + ε i t 1
where T E F U i t * is the latent variable of T E F U i t , and T E F U i t * = δ 0 + δ j x i j t + ε i t ; 0 and 1 are the left and right censored points of T E F U i t respectively; δ 0 is constant term; x i j t is influencing factor; δ j is x i j t ’s coefficient; ε i t is stochastic error term subject to normal distribution.
According to the characteristics of China’s rice production and by reference to relevant literatures, the following seven independent variables were selected to empirically estimate TEFU’s influencing factors: (1) Government’s fiscal support for agriculture. Grain production is one of the main emission sources of agricultural source pollution in China [39]. Larger support from government for agriculture is beneficial to the promotion of chemical fertilizer use techniques in agricultural production. (2) Agricultural labor productivity. Higher agricultural labor productivity means higher use efficiency of each inputs including chemical fertilizer in agricultural production, then brings more output with same inputs. (3) Agricultural mechanization. Wide application of agricultural machinery is regarded as an important symbol of transformation from traditional agriculture to modern agriculture [44]; increasingly improvement of agricultural machinery level is favorable for the improvement of scientific fertilization and TEFU. (4) Effective irrigation. During each rice’s growing period before maturation, a large amount of water and fertilizer are needed; with higher effective irrigation level, not only can water demand be met, but also chemical fertilizer can be better absorbed by the rice’s root system after dissolving in water. (5) Natural disaster. Natural attribute of agriculture determines its vulnerability to natural disaster such as flood and drought, and severer natural disaster not only causes reduction in grain production, but also restrains the use and effectiveness of inputs especially chemical fertilizer [45,46]. (6) Fertilizer price. Chemical fertilizer is not irreplaceable in modern agricultural production. When chemical fertilizer price goes up, the farmer may increase the usage of its substitutes like organic fertilizer and minimize chemical fertilizer usage, and also may turn to some low-price and poor-quality chemical fertilizer that will cause lower TEFU [35]. (7) Soil Testing and Formulated Fertilization Program (STFFP). The STFFP, implemented since 2005, has played a critical and favorable role in improving TEFU and promoting usage reduction of chemical fertilizer in China’s agricultural production [38,47,48]. Therefore, T E F U i t * can be further expressed as:
T E F U i t * = δ 0 + δ 1 ln F A i t + δ 2 ln L P i t + δ 3 ln A M i t + δ 4 ln E R i t + δ 5 ln D R i t + δ 6 ln F P i t + δ 7 D t + ε i t
The data of influencing factors (1) to (5) are from the China Statistical Yearbook [4], and the data of influencing factor (6) are from the China Agricultural Product Cost-Benefit Compilation [43], with the same sample period 1997–2018. In order to eliminate the impact of price fluctuation, provincial consumption price index (CPI) from the China Statistical Yearbook, adjusted with 1997 as base [4], is used to process the original data of government’s fiscal support for agriculture, agricultural labor productivity, and fertilizer price. The introduction of influencing factors was shown in Table 3.

3. Results and Discussion

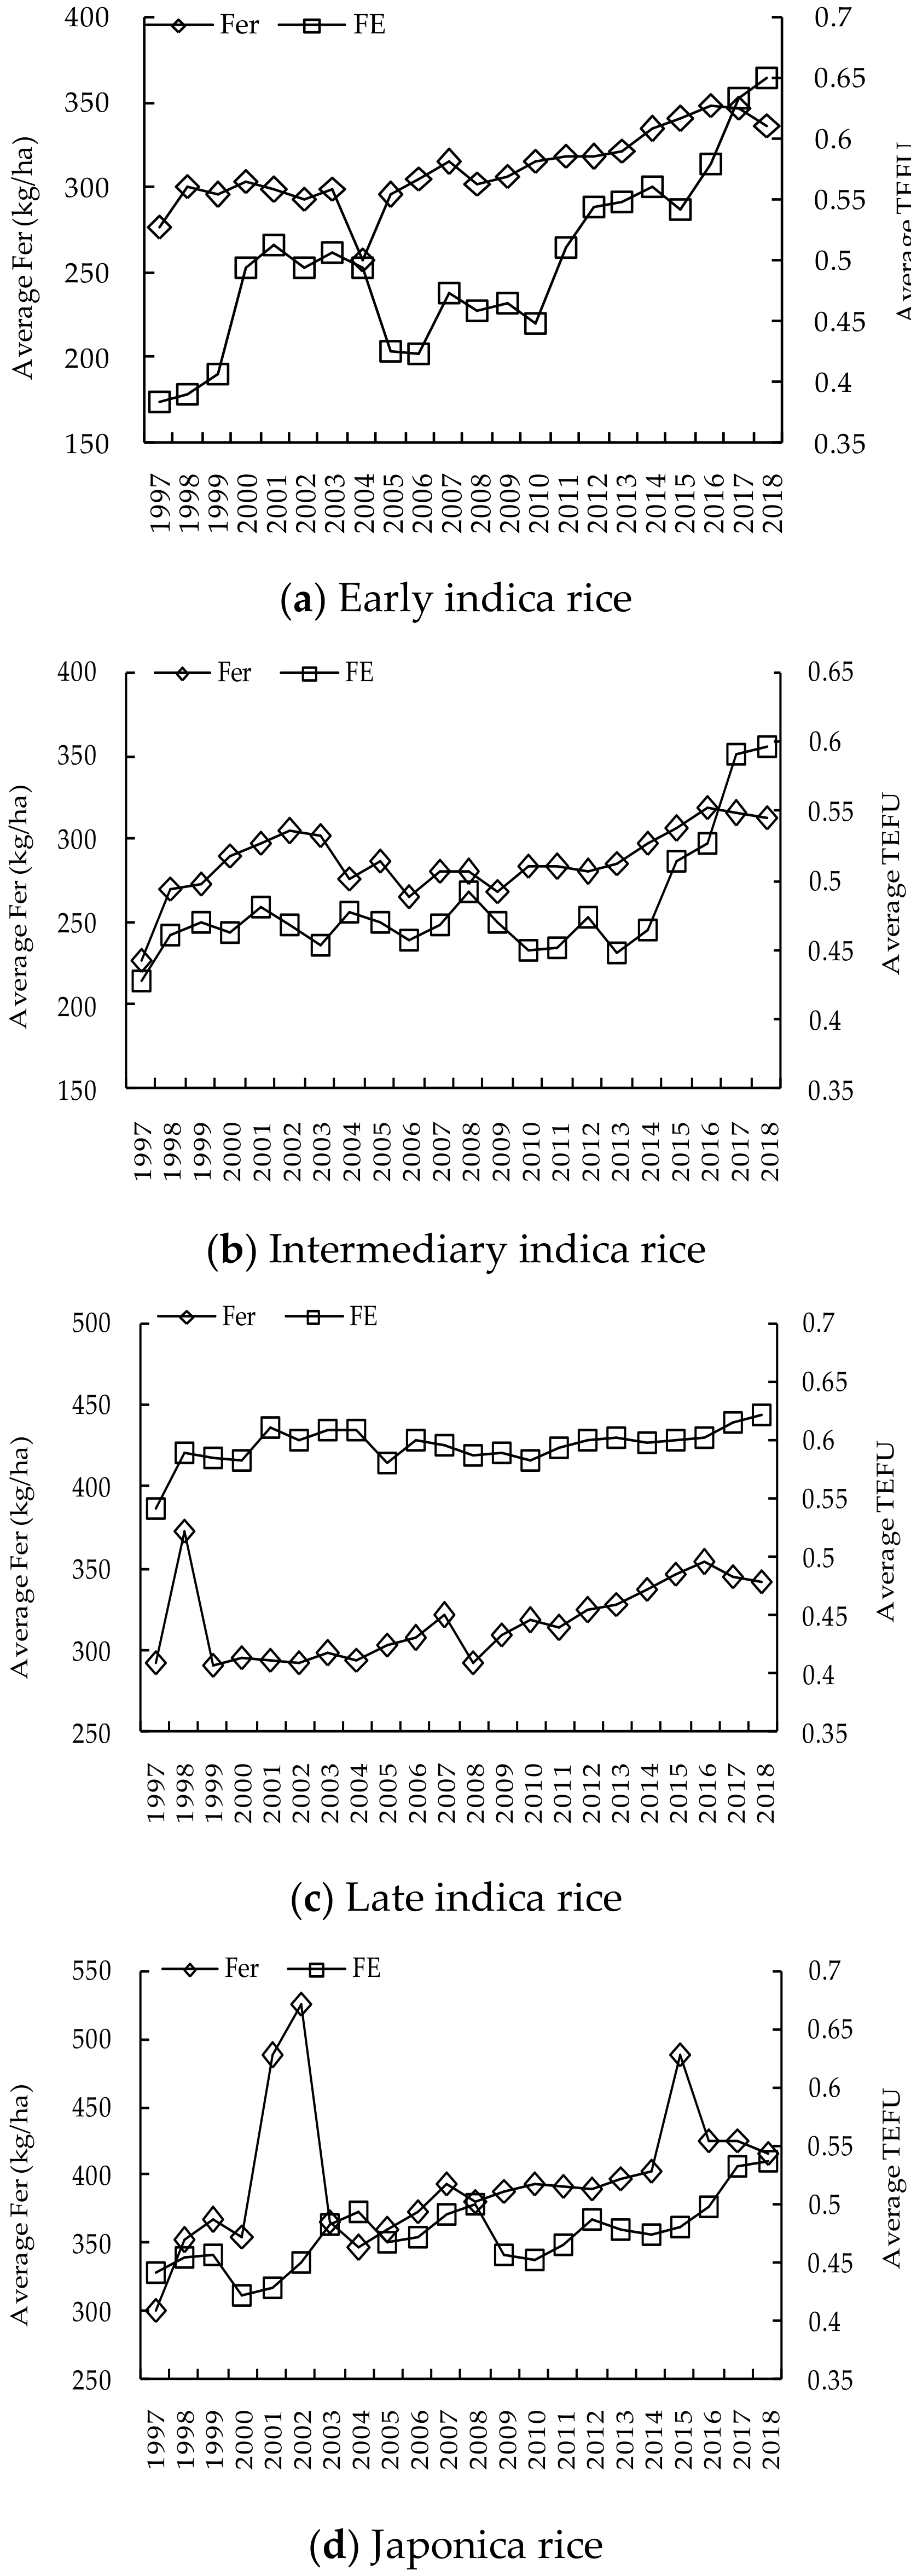
3.1. Estimation of TEFU

There is significant difference between the estimation results of Translog SFPF model and the Cobb–Douglas SFPF model. Therefore, we use the ratio-ergodic theorem of log-likelihood function (LLF) to check the optimal specification of SFPF model for four kinds of rice. The null hypothesis (H0) of LLF test is “SFPF model adopts Equation (11)”, which means β F F , β F j , and β j k equal to 0 simultaneously; the alternative hypothesis (H1) of LLF test is “SFPF Model adopts Equation (4)”, which means β F F , β F j , and β j k donot equal to 0 simultaneously. The likelihood ratio (LR) statistics of LLF test can be expressed as follows [49,50]:
L R = 2 ln [ L H 0 / L H 1 ] = 2 ln [ L H 0 ln [ L H 1 ~ χ 2 q
where ln [ L H 0 ] and ln [ L H 1 ] denote LLF value under H0 and H1 respectively; q is the number of zero restriction within H0, and q = 15 . When LR test statistics is higher than critical value ( χ 0.01 2 ), obtained from Kodde and Palm [51], then H0 should be rejected, and the SFPF model adopts Equation (4); otherwise, H0 should be accepted, and SFPF model adopts Equation (11). According to Table 4, we found that the SFPF model should adopt Equation (4) for early indica rice and late indica rice, and Equation (11) for intermediary rice and japonica rice. Based on the LLF test, the possible effect of interaction among various inputs on TEFU is taken into account; if the SFPF model adopts Equation (4), then the effect is significant, and if adopting Equation (11), then the effect is not significant.
Based on the defined SFPF model specifications and by using the Frontier 4.1 software, we replace σ V 2 and σ U 2 with σ 2 = σ V 2 + σ U 2 and γ = σ U 2 / σ V 2 + σ U 2 , respectively, and use the Maximum Likelihood Estimation (MLE) approach to estimate the SFPF model. σ 2 is the sigma-squared; γ is the proportion of U i t in σ 2 , and γ 0 , 1 . When γ is approaching 0, the gap between observeded yield and therotical maximum yield is mainly from V i t ; when γ is approaching 1, the gap is mainly from U i t .
According to the estimation results of SFPF model in Table 5 and the measured TE for four kinds of rice production, based on Equations (10) and (15), we measure TEFU for four kinds of rice production and then calculate the yearly average of Fer and TEFU, and Figure 1 presents corresponding analysis results.
In terms of Fer, during sample period, average Fer of early indica rice, intermediary indica rice, late indica rice, and japonica rice have totally been rising in most years, and increased by 60.42 kg, 86.11 kg, 49.61 kg and 114.90 kg per hectare respectively in 2018 compared with 1997. In recent years, average Fer of early indica rice, intermediary indica rice, late indica rice, and japonica rice have shown turning points in 2017, 2017, 2017, and 2016, respectively, and continuously declining since then. Therefore, the goal of reducing chemical fertilizer usage by 2020 set out in the Action Plan for Zero Growth of Chemical Fertilizer Use by 2020 has already been achieved ahead of schedule.
In terms of TEFU, along with the change of Fer, the year 2006 is basically a demarcation point for average TEFU for early indica rice, intermediary indica rice, late indica rice, and japonica rice production, which continuously fluctuating before 2006 and mainly rising since 2006, showing that TEFU were improved during 2006–2018. It is mainly because the Chinese government has continuously implemented the STFFP all over the country since 2005. The STFFP focuses on grain and other major crops, aiming to help farmer master scientific fertilization methods and promote the techniques of soil testing and fertilizer recommendation, and puts emphasize on supporting soil test, field experiment, technical services, and formula fertilizer promotion, and promoting farmers’ scientific fertilization and application of formulated fertilizer [19]. As of 2014, cumulatively, about 190 million farmers received technical services of soil testing and fertilizer recommendation, and area of the technical services was nearly 100 million hectare; in 2012, fertilizer utilization efficiency measured by Agronomic Efficiency Index in program area was 33%, 5% higher than 2005, and cumulative reduction of unreasonable chemical fertilizer usage was more than 10 million tons [52].
Average TEFU for early indica rice, intermediary indica rice, late indica rice, and japonica rice in 2018 were 0.651, 0.597, 0.623, and 0.538, respectively, significantly higher than previous studies [35,36], and increasing by 67.70%, 39.93%, 14.76%, and 21.88%, respectively compared with 1997. At the same time, TEFU for all four kinds of rice production still have large improvement potential. Theoretically, given technical level and other inputs unchanged at observed levels, average Fer for early indica rice, intermediary indica rice, late indica rice, and japonica rice production could be reduced by 34.9%, 40.3%, 37.7%, and 46.2%, respectively in 2018, without affecting yield.
According to 225 kg/ha, the maximum safe usage internationally recognized, we divide Fer into four classes: low, intermediary, high, and very high, with 225 kg/ha, 300 kg/ha, and 375 kg/ha as the demarcation points, respectively; and by reference to Zhou et al. [28], we divide TEFU into four classes: low, intermediary, high, and very high, with 0.4, 0.6, and 0.8 as the demarcation points, respectively. Then, we obtain 16 Fer-TEFU combinations as shown in Table 6. In 2018, only Fer for Chongqing’s intermediary indicarice production was lower than 225 kg/ha. During 22 rice production provinces, TEFU for two early indica rice production provinces were lower than 0.6, so were five intermediary indica rice production provinces, two late indica rice production provinces, and 11 japonica rice production provinces. Totally, only early indica rice production in Fujian and Hubei and later indica rice production in Hunan belonged to nearly ideal type of medium Fer-high TEFU, while 12 provinces belonged to very high Fer-medium TEFU or high Fer-medium TEFU types that need to be improved urgently.
The results proved that Fer for China’s main rice production provinces still had considerable reduction potential, and TEFU for China’s main rice production provinces still had considerable improvement potential, and reducing Fer was a very important way to achieve increase in TEFU. Meanwhile, we found that both of Jiangsu and Shandong with very high TEFU for rice production, were located in eastern coastal areas of China with very high economic development level, provincial Gross Domestic Product (GDP) in 2018 of which reaching 9320.76 billion CNY and 6664.89 billion CNY respectively [4], ranked second and third in the country. The higher the economic development level of the rice production provinces, the stronger its fiscal support for agriculture especially promotion and application of agricultural technology, which in turn being more conducive to the improvement in TEFU for rice production.

3.2. Tobit Estimation of TEFU’s Influencing Factors

Table 7 presents estimation results of TEFU’s influencing factors from the Tobit model, by using the Maximum Likelihood Estimation (MLE) approach. We find that estimated values of all independent variables’ coefficients were statistically significant, and impact directions of most independent variables were as consistent as expected, which is shown in Table 3.
lnFA had significant positive impact on TEFU for four kinds of rice production, which shows that greater government fiscal support for agriculture significantly led to higher TEFU. Greater government fiscal support for agriculture could stimulate rice farmers to purchase and use higher-quality chemical fertilizer, and promote perfection and operation of agricultural technology extension system including scientific fertilizer use techniques for grain production, which would in turn lead to higher TEFU. lnLP had significant positive impact on TEFU for four kinds of rice production, which indicating that stronger agricultural labor productivity significantly led to higher TEFU. Higher agricultural labor productivity could improve use efficiency of all inputs in rice production, including chemical fertilizer.
lnAM had significant positive impact on TEFU for four kinds of rice production, which suggests that higher agricultural mechanization level significantly led to higher TEFU. The comprehensive mechanization rate for China’s agriculture has kept rising, reaching 69% in 2019, with mechanical farming rate, mechanical seeding rate and mechanical harvest rate reaching 84%, 56%, and 61%, respectively, and comprehensive mechanization rate for rice reached 81% in 2019 [53]. Increasingly improvement of agricultural machinery level could promote more scientific chemical fertilizer use, and be favorable for increasing TEFU. lnEI had significant positive impact on TEFU for four kinds of rice production, which showing that higher effective irrigation level significantly led to higher TEFU. Scientific water management techniques, such as water-saving irrigation technique, could improve the growth of root and above-ground part of rice, and promote the efficient absorption of chemical fertilizer [54,55]. Meanwhile, compared with arable land with poor irrigation conditions, organic matter content in arable land with better irrigation conditions are generally higher, which could provide better soil conditions for reducing chemical fertilizer usage without reducing rice yield.
lnND had significant negative impact on TEFU for four kinds of rice production, which showing that severer natural disaster significantly led to lower TEFU. The increase in natural disaster would directly result in the decline in rice yield; and when affected by natural disaster, the more severely affected rice farmers were, the more motivated they might be to make up for the negative effect of natural disaster on rice yield by purchasing and using more chemical fertilizer, which in turn leading to the decrease in TEFU. lnFP had significant negative impact on TEFU for four kinds of rice production, which shows that higher fertilizer price significantly led to lower TEFU.As chemical fertilizer price rise, in order to ensure yield, rice farmers might purchase and use low-priced chemical fertilizer with low-quality to replace high-priced chemical fertilizer with high-quality, which then leading to the increase in chemical fertilizer usage and decrease in TEFU.
D had significant positive impact on TEFU for four kinds of rice production, which indicating that implementation of the STFFP significantly led to higher TEFU. The result was consistent with the conclusion we obtained earlier that average TEFU in major rice production provinces had mainly kept increasing since 2006, and offered suggestive evidence that the STFFP was significantly effective in improving TEFU. Therefore, it is of great significance to strengthen funding for scientific research on sustainable soil nutrient management, and promote the adoption of scientific fertilizer use techniques for grain production, which will generate multiple socioeconomic benefits, especially for smallholder farmers and large scale agricultural producers worldwide whose livelihoods directly depend on their soil resources.

3.3. Robustness Check

The specifications for panel data model include mixed estimation, fixed effect, and random effect. Without taking cross-section effect and period effect possibly included in panel data into account, estimation results from mixed estimation model may be biased and non robust [56,57]. The Hausman test should be used to determine the optimal specification for panel data model between fixed effect and random effect. According to the Hausman test results in Table 8, we found that, for four kinds of rice, Chi-Squared statistics values were statistically significant, and fixed effect was the optimal specification. Therefore, we used a panel data fixed effect model to further estimate TEFU’s influencing factors, and check the robustness of the Tobit model estimation results. In order to solve the possible heteroscedasticity and counterintuitive sign, the panel data fixed effect model included the province-fixed effect and year-fixed effect, and we estimated the panel data fixed effect model by using the Estimated General Least Square (EGLS) approach with cross-section Seemingly Unrelated Regression (SUR) as weights.
Table 8 presents estimation results from the panel data fixed effect model. For four kinds of rice, R-squared statistics values were higher than 0.55, which means that over 55% difference in TEFU could be explained by the selected seven influencing factors, and estimation results had a good fitting effect; F statistics values were statistically significant, which means that all the selected seven influencing factors had significant impact on TEFU; DW statistics values were very close to two, which reveals that there were no first-order autocorrelation sign. Compared with estimates from the Tobit model in Table 7, estimated values and statistical significance of the selected seven influencing factors’ coefficients from the panel data fixed effect model were basically the same. Therefore, the estimates from the Tobit model were robust and effective.

4. Conclusions and Policy Implications

Using the 1997–2018 data of China’s 22 rice production provinces from the China Agricultural Product Cost-Benefit Compilation and the China Statistical Yearbook, this study is the first to measure the TEFU for early indica rice, intermediary indica rice, late indica rice, and japonica rice production using a SFPF model at the kind level with provincial panel data, and then analyzes TEFU’s influencing factors using a Tobit model and conducts the robustness check using a panel data fixed effect model.
Estimates from SFPF model indicated that average TEFU for early indica rice, intermediary indica rice, late indica rice, and japonica rice production had been fluctuating during 1997–2005 and rising during 2006–2018, being 0.651, 0.597, 0.623, and 0.538 in 2018 and increasing by 67.70%, 39.93%, 14.76%, and 21.88% compared with 1997, respectively. In recent years, TEFU for China’s rice production have significant differences among different kinds and production provinces, and still have large improvement potential, theoretically given technical level and other inputs unchanged at observed levels, average intensity of chemical fertilizer for early indica rice, intermediary indica rice, late indica rice, and japonica rice production could be reduced by 34.9%, 40.3%, 37.7%, and 46.2%, respectively in 2018, without affecting yield. Estimates from the Tobit model showed that, for four kinds of rice production, the government’s fiscal support to agriculture, agricultural labor productivity, agricultural mechanization, effective irrigation, and implementation of the STFFP had significant positive impact on TEFU; natural disaster and fertilizer price had significant negative impact on TEFU. Estimates from panel data fixed effect model indicated that estimates from the Tobit model were robust and effective.
It can be known from the above conclusions that the Chinese government’s policies for reducing usage and promoting application techniques of chemical fertilizer in agriculture, especially the STFFP, has been effective in significantly improving TEFU for China’s rice production. Considering the TEFU still have large improvement potential presently, by optimizing existing related policies and establishing a comprehensive policy system that more consistent with the United Nations 2030 Sustainable Development Goals (SDGs) [16] and the Voluntary Guidelines for Sustainable Soil Management (VGSSM) [58], and widely absorbing and learning from other good practices, such as the soil testing methods of the Global Soil Doctors Programme proposed by the Food and Agriculture Organization of the United Nations (FAO) [59] and relevant institutional designs in the Common Agricultural Policy (CAP) of the European Union that promote the sustainable development of agriculture and rural regions [60,61], the TEFU could be continuously increased and chemical fertilizer usage could be further reduced for China’s rice production. The conclusions of this study offer following policy implications for the Chinese government: first, the government should timely release soil test results for formulated fertilization, and by implementing incentives, encourage more enterprises to participate in the STFFP and produce formula fertilizer with good quality and affordable price. Second, the government should develop and improve support policies on promoting sustainable agricultural machinery and technologies, such as precision agricultural equipment and water-saving irrigation, and enhancing natural disaster response capacity of grain production. Third, the government should establish category-specific fertilizer regulatory price, and encourage grain farmers to purchase and use formulated fertilizer and organic fertilizer. Fourth, without affecting food security capacity, the government should implement arable land fallow policy more widely, and priority should be given to areas with high intensity of chemical fertilizer and serious pollution from agricultural sources.
To our best knowledge, using China’s provincial panel data, this research is the first to rigorously evaluate kind differences and inter-provincial differences in TEFU for rice production and their influencing factors, and is a significant improvement over past studies mainly based on cross-sectional data. Our research findings will be valuable for other developing countries facing common problem that chemical fertilizer use for grain production is in low technical efficiency and excessive usage. China’s effective policies especially those focused on achieving sustainable soil nutrient management will also provide good practical experience for other developing countries.
There are two areas beyond the scope of this research but should be explored in future research. First, limited by data availability, this research only measured the technical efficiency of chemical fertilizer use for rice production in China. Considering fertilizer use cannot disregard organic fertilizer use, and organic fertilizer is receiving increasing research interest in recent years [62,63], future studies should evaluate the technical efficiency of organic fertilizer use. Second, different kinds of chemical fertilizer, including N, P, and K, usually play different roles in rice growth. Future studies should explore the TEFU of different kinds of chemical fertilizer in order to provide practical evidences to achieve more precise and efficient use of chemical fertilizer.

Author Contributions

The authors contribute equally in the research. Both authors have read and agreed to the published version of the manuscript.

Funding

This research was funded by the Agricultural Science and Technology Innovation Project of Chinese Academy of Agricultural Sciences (Project No. ASTIP-IAED-2021-06; Project No. ASTIP-IAED-2021-ZD-02), the Sinograin II Project (Project No. CHN 2152, 17/0019), and the National Natural Science Foundation of China (Project No. 71703157).

Institutional Review Board Statement

Not applicable.

Informed Consent Statement

Not applicable.

Data Availability Statement

Not applicable.

Acknowledgments

The authors greatly acknowledge the comments from the participants at the Sinograin II Project Annual Meeting 2020.

Conflicts of Interest

The authors declare no conflict of interest. The funders had no role in the design of the study; in the collection, analysis, or interpretation of data; in the writing of the manuscript, or in the decision to publish the results.

References

  1. Hu, L.X.; Zhang, X.H.; Zhou, Y.H. Farm size and fertilizer sustain able use: An empirical study in Jiangsu, China. J. Integr. Agr. 2019, 18, 2898–2909. [Google Scholar] [CrossRef]
  2. Zhang, F.S.; Wang, J.Q.; Zhang, W.F.; Cui, Z.L.; Ma, W.Q.; Chen, X.P.; Jiang, R.F. Nutrient use efficiencies of major cereals in China and measures for improvement. J. Integr. Agr. 2008, 45, 915–924. [Google Scholar]
  3. Li, Y.X.; Zhang, W.F.; Ma, L.; Huang, G.Q.; Oenema, O.; Zhang, F.S.; Dou, Z.X. An analysis of China’s fertilizer policies: Impacts on the industry, food security, and the environment. J. Environ. Qual. 2013, 42, 972–981. [Google Scholar] [CrossRef]
  4. National Bureau of Statistics of China. China Statistical Yearbook, 1998–2019; China Statistics Press: Beijing, China, 1998–2019. [Google Scholar]
  5. Reidsma, P.; Feng, S.Y.; van Loon, M.; Luo, X.J.; Kang, C.K.; Lubbers, M.; Kanellopoulos, A.; Wolf, J.; Ittersum, M.K.; Qu, F.T. Integrated assessment of agricultural and use policies on nutrient pollution and sustainable development in Taihu Basin, China. Environ. Sci. Policy 2012, 18, 66–76. [Google Scholar] [CrossRef]
  6. Jia, X.P.; Huang, J.K.; Xiang, C.; Hou, L.K.; Zhang, F.S.; Chen, X.P.; Bergmann, H. Farmer’s adoption of improved nitrogen management strategies in maize production in China: An experimental knowledge training. J. Integr. Agr. 2013, 12, 364–373. [Google Scholar] [CrossRef]
  7. Cai, J.; Xia, X.L.; Chen, H.B.; Wang, T.; Zhang, H.L. Decomposition of fertilizer use intensity and its environmental risk in China’s grain production process. Sustainability 2018, 10, 498. [Google Scholar] [CrossRef] [Green Version]
  8. Wang, M.; Ma, L.; Strokal, M.; Chu, Y.; Kroeze, C. Exploring nutrient management options to increase nitrogen and phosphorus use efficiencies in food production of China. Agr. Syst. 2018, 163, 58–72. [Google Scholar] [CrossRef]
  9. Ju, X.T.; Xing, G.X.; Chen, X.P.; Zhang, S.L.; Zhang, L.J.; Liu, X.J.; Cui, Z.L.; Yin, B.; Christie, P.; Zhu, Z.L.; et al. Reducing environmental risk by improving N management in intensive Chinese agricultural systems. Proc. Natl. Acad. Sci. USA 2009, 106, 3041–3046. [Google Scholar] [CrossRef] [Green Version]
  10. Chen, X.P.; Cui, Z.L.; Fan, M.S.; Vitousek, P.; Zhao, M.; Ma, W.Q.; Wang, Z.L.; Zhang, W.J.; Yan, X.Y.; Yang, J.C.; et al. Producing more grain with lower environmental costs. Nature 2014, 514, 486–489. [Google Scholar] [CrossRef]
  11. Shen, J.B.; Cui, Z.L.; Miao, Y.X.; Mi, G.H.; Zhang, H.Y.; Fan, M.S.; Zhang, C.C.; Jiang, R.F.; Zhang, W.F.; Li, H.G.; et al. Transforming agriculture in China: From solely high yield to both high yield and high resource use efficiency. Glob. Food Secur. 2013, 2, 1–8. [Google Scholar] [CrossRef]
  12. Abler, D.G. Economic evaluation of agricultural pollution control options for China. J. Integr. Agric. 2015, 14, 1045–1056. [Google Scholar] [CrossRef]
  13. Jin, S.Q.; Zhou, F. Zero growth of chemical fertilizer and pesticide use: China’s objectives, progress and challenges. J. Resour. Ecol. 2018, 9, 50–58. [Google Scholar]
  14. Food and Agriculture Organization of the United Nations. Food Outlook: Biannual Report on Global Food Markets—November 2020. 2020. Available online: http://www.fao.org/3/cb1993en/cb1993en.pdf (accessed on 28 December 2020).
  15. Nair, K.P. Soil fertility and nutrient management. In Intelligent Soil Management for Sustainable Agriculture; Springer: Cham, Switzerland, 2019. [Google Scholar]
  16. United Nations. Transforming our world: The 2030 Agenda for Sustainable Development. 2015. Available online: https://sdgs.un.org/sites/default/files/publications/21252030%20Agenda%20for%20Sustainable%20Development%20web.pdf(accessed on 28 December 2020).
  17. Huang, J.K.; Yang, G.L. Understanding recent challenges and new food policy in China. Glob. Food Secur. 2017, 12, 119–126. [Google Scholar] [CrossRef]
  18. Shen, J.B.; Zhu, Q.C.; Jiao, X.Q.; Ying, H.; Wang, H.L.; Wen, X.; Xu, W.; Li, T.Y.; Cong, W.F.; Liu, X.J.; et al. Agriculture green development: A model for China and the world. Front. Agric. Sci. Eng. 2020, 7, 5–13. [Google Scholar] [CrossRef] [Green Version]
  19. Ministry of Agriculture and Rural Affairs of China. Urgent Notice on Initiating the Soil Testing and Formulated Fertilization Operation. 2005. Available online: http://www.moa.gov.cn/ztzl/ctpfsf/xgzl/200504/t20050411_352723.htm (accessed on 28 January 2020).
  20. Ministry of Agriculture and Rural Affairs of China. Notice on Issuing the Action Plan for Zero Growth in Chemical Fertilizer Usage by 2020. 2015. Available online: http://jiuban.moa.gov.cn/zwllm/tzgg/tz/201503/t20150318_4444765.htm (accessed on 18 March 2020).
  21. Huang, J.K.; Wei, W.; Cui, Q.; Xie, W. The prospects for China’s food security and imports: Will China starve the world via imports. J. Integr. Agric. 2017, 15, 2933–2944. [Google Scholar] [CrossRef]
  22. Sun, Y.D.; Hu, R.F.; Zhang, C. Does the adoption of complex fertilizers contribute to fertilizer over use? Evidence from rice production in China. J. Clean. Prod. 2019, 219, 677–685. [Google Scholar] [CrossRef]
  23. Tian, X.; Yi, F.J.; Yu, X.H. Rising cost of labor and transformations in grain production in China. China Agric. Econ. Rev. 2020, 12, 158–172. [Google Scholar] [CrossRef]
  24. Huang, J.K.; Rozelle, S.; Zhu, X.K.; Zhao, S.J.; Sheng, Y. Agricultural and rural development in China during the past four decades: An introduction. Aust. J. Agric. Resour. Econ. 2020, 64, 1–13. [Google Scholar] [CrossRef]
  25. Li, H.L.; Zhang, W.F.; Zhang, F.S.; Du, F.; Li, L.K. Chemical fertilizer use and efficiency change of main grain crops in China. Plant Nutr. Fert. Sci. 2010, 16, 1136–1143. (in Chinese). [Google Scholar]
  26. Lin, Y.; Ma, J. Measurement on the economic level of fertilizer use of farmers’ grain production: Taking wheat farmers of North China Plain. J. Agrotechnol. Econ. 2013, 32, 25–31. (in Chinese). [Google Scholar]
  27. Chen, Y.T.; Peng, J.; Wang, J.; Fu, P.H.; Hou, Y.; Zhang, C.D.; Fahad, S.; Peng, S.B.; Cui, K.H.; Nie, L.X.; et al. Crop management based on multi-split top dressing enhances grain yield and nitrogen use efficiency in irrigated rice in China. Field Crop. Res. 2015, 184, 50–57. [Google Scholar] [CrossRef]
  28. Zhou, Y.H.; Zhang, X.H.; Tian, X.; Geng, X.H.; Zhang, P.; Yan, B.J. Technical and environmental efficiency of hog production in China: A stochastic frontier production function analysis. J. Integr. Agric. 2015, 14, 1069–1080. [Google Scholar] [CrossRef]
  29. Si, C.L.; Zang, Y.; Guo, Y.; Zhu, J.F. The impact of land fragmentation on farmer’s chemical fertilizer use efficiency. J. Nat. Resour. 2019, 34, 2687–2700. (in Chinese). [Google Scholar]
  30. Wei, H.; Li, J. Efficiency performance of fertilizer use in arable agricultural production in China. China Agric. Econ. Rev. 2019, 11, 52–69. [Google Scholar]
  31. Battese, G.E.; Coelli, T.J. Frontier production functions, technical efficiency and panel data: With application to paddy farmers in India. J. Prod. Anal. 1992, 3, 153–169. [Google Scholar] [CrossRef]
  32. Battese, G.E.; Coelli, T. A model for technical in efficiency effects in a stochastic frontier production functions for panel data. Empir. Econ. 1995, 20, 325–332. [Google Scholar] [CrossRef] [Green Version]
  33. Reinhard, S.; Lovell, C.A.K.; Thijssen, G. Econometric estimation of technical and environmental efficiency: An application to Dutch dairy farms. Am. J. Agric. Econ. 1999, 81, 44–60. [Google Scholar] [CrossRef]
  34. Reinhard, S.; Lovell, C.A.K.; Thijssen, G. Analysis of environmental efficiency variation. Am. J. Agric. Econ. 2002, 84, 1054–1065. [Google Scholar] [CrossRef]
  35. Si, C.L.; Zhu, J.F.; Luan, J. Fertilizer input efficiency of wheat and its determinates: Empirical analysis based on 15 wheat producing provinces. J. Agrotechnol. Econ. 2015, 34, 69–78. (in Chinese). [Google Scholar]
  36. Li, J.; Li, J.Y. Fertilizer using efficiency of China’s grain production and its determining factors. Res. Agric. Mod. 2011, 32, 565–568. (in Chinese). [Google Scholar]
  37. Yang, Z.X.; Han, H.Y. Technical efficiency of fertilizer and its influencing factors: Based on wheat and corn empirical study. J. China Agric. U. 2011, 16, 140–147. (in Chinese). [Google Scholar]
  38. Wang, P.P.; Zhang, W.D.; Li, M.H.; Han, Y.J. Does fertilizer education program increase the technical efficiency of chemical fertilizer use: Evidence from wheat production in China. Sustainability 2019, 11, 543. [Google Scholar] [CrossRef] [Green Version]
  39. Zhou, L.L.; Liu, Y.S.; Wang, Y.S.; Hu, X.D. Assessment and analysis of agricultural non-point source pollution loads in China: 1978–2017. J. Environ. Manag. 2020, 263, 110400. [Google Scholar] [CrossRef]
  40. National Rice Industry Technology System. Research on the Sustainable Development Tragedy of Chinese Modern Agriculture Industry (Rice); China Agriculture Press: Beijing, China, 2017. [Google Scholar]
  41. Monchuk, D.; Chen, Z.; Bonaparte, Y. Explaining production in efficiency in China’s agriculture using data envelopment analysis and semi-parametric boots trapping. China Econ. Rev. 2010, 21, 346–354. [Google Scholar] [CrossRef]
  42. Huang, W.; Bruemmer, B.; Huntsinger, L. Incorporating measures of grass land productivity into efficiency estimates for livestock grazing on the Qinghai-Tibetan Plateau in China. Ecol. Econ. 2016, 122, 1–11. [Google Scholar] [CrossRef]
  43. National Development and Reform Commission of China. China Agricultural Product Cost-Benefit Compilation, 1998–2019; China Statistics Press: Beijing, China, 1998–2019. [Google Scholar]
  44. Xu, Y.B.; Li, J.Y.; Wan, J.M. Agriculture and crop science in China: Innovation and sustainability. Crop. J. 2017, 5, 95–199. [Google Scholar] [CrossRef]
  45. Food and Agriculture Organization of the United Nations. The Impact of Natural Hazards and Disasters on Agriculture and Food Security and Nutrition: A Call for Action to Build Resilient Livelihood. 2015. Available online: http://www.fao.org/3/a-i4434e.pdf (accessed on 20 June 2020).
  46. Du, X.D.; Jin, X.B.; Yang, X.L.; Yang, X.H.; Xiang, X.M.; Zhou, Y.K. Spatial-temporal pattern changes of main agriculture natural disasters in China during 1990–2011. J. Geogr. Sci. 2015, 25, 387–398. [Google Scholar] [CrossRef]
  47. Ding, W.C.; Xu, X.P.; He, P.; Ullah, S.; Zhang, J.J.; Cui, Z.L.; Zhou, W. Improving yield and nitrogen use efficiency through alternative fertilization options for rice in China: Ameta-analysis. Field Crop. Res. 2018, 227, 11–18. [Google Scholar] [CrossRef]
  48. Li, C.X.; Ma, S.C.; Shao, Y.; Ma, S.T.; Zhang, L.L. Effects of long-termorganic fertilization on soil microbiologic characteristics, yield and sustainable production of winter wheat. J. Integr. Agric. 2018, 17, 210–219. [Google Scholar] [CrossRef] [Green Version]
  49. Battese, G.E.; Tessema, G.A. Estimation of stochastic frontier production functions with time-varying parameters and technical efficiencies using panel data from Indian villages. Agric. Econ. 1993, 9, 313–333. [Google Scholar]
  50. Coelli, T.J.; Rao, D.S.P.; O’Donnell, C.J.; Battese, G.E. An Introduction to Efficiency and Productivity Analysis; Springer: New York, NY, USA, 2005. [Google Scholar]
  51. Kodde, D.A.; Palm, F.C. Wald criteria for jointly testing equality and inequality restrictions. Econometrica 1986, 54, 1243–1248. [Google Scholar] [CrossRef]
  52. Ministry of Finance of China. The Central Fiscal Support on the Soil Testing and Formulated Fertilization Has Achieved Remarkable Results. 2014. Available online: http://www.gov.cn/xinwen/2014-04/16/content_2660833.htm (accessed on 22 April 2020).
  53. Ministry of Agriculture and Rural Affairs of China. The Transformation and Upgrading of Agricultural Machinery Has Been Accelerated in China. 2020. Available online: http://www.njhs.moa.gov.cn/gzdt/202001/t20200110_6334759.htm (accessed on 25 December 2020).
  54. Li, T.; Feng, Y.; Zhu, A.; Huang, J.; Wang, H.; Li, S.; Liu, K.; Peng, R.; Zhang, H.; Liu, L. Effects of main water-saving irrigation methods on morphological and physiological traits. Chin. J. Rice Sci. 2019, 33, 293–302. [Google Scholar]
  55. Wang, H.; Zhang, Y.; Zhang, Y.; McDaniel, M.D.; Sun, L.; Su, W.; Fan, X.; Liu, S.; Xiao, X. Water-saving irrigation is a ‘win-win’ management strategy in rice paddies—With both reduced greenhouse gas emissions and enhanced water use efficiency. Agric. Water Manag. 2020, 228, 105889. [Google Scholar] [CrossRef]
  56. Stock, J.H.; Watson, M.W. Introduction to Econometrics; Prentice Hall: New York, NY, USA, 2003. [Google Scholar]
  57. Greene, W. Fixed and random effects in stochastic frontier models. J. Prod. Anal. 2005, 23, 7–32. [Google Scholar] [CrossRef] [Green Version]
  58. Food and Agriculture Organization of the United Nations. Voluntary Guidelines for Sustainable Soil Management. 2017. Available online: http://www.fao.org/3/a-bl813e.pdf (accessed on 28 December 2020).
  59. Food and Agriculture Organization of the United Nations. Soil testing methods: Global Soil Doctors Programme—Afarmer-to-farmer training programme. 2020. Available online: http://www.fao.org/3/ca2796en/CA2796EN.pdf (accessed on 28 December 2020).
  60. Toma, P.; Miglietta, P.P.; Zurlini, G.; Valente, D.; Petrosillo, I. Anon-parametric bootstrap-data envelopment analysis approach for environmental policy planning and management of agricultural efficiency in EU countries. Ecol. Indic. 2017, 83, 132–143. [Google Scholar] [CrossRef]
  61. Balezentis, T.; Ribasauskiene, E.; Morkunas, M.; Volkov, A.; Streimikiene, D.; Toma, P. Young farmers’ support under the Common Agricultural Policy and sustainability of rural regions: Evidence from Lithuania. Land Use Policy 2020, 94, 104542. [Google Scholar] [CrossRef]
  62. Avadì, A. Screening LCA of French organic amendments and fertilisers. Int. J. Life Cycle Assess. 2020, 25, 698–718. [Google Scholar] [CrossRef]
  63. Pandey, A.; Dou, F.; Morgan, C.L.S.; Guo, J.; Deng, J.; Schwab, P. Modeling organically fertilized flooded rice systems and its long-term effects on grain yield and methane missions. Sci. Total Environ. 2021, 755, 142578. [Google Scholar] [CrossRef]
Figure 1. Average Fer and TEFU for China’s four kinds of rice production, 1997–2018.
Sustainability 13 01155 g001
Table 1. Selected 22 rice production provinces in China.
Kind of RiceSelected Rice Production Provinces
Early indica riceZhejiang, Anhui, Fujian, Jiangxi, Hubei, Hunan, Guangdong, Guangxi, and Hainan
Intermediary indica riceJiangsu, Anhui, Fujian, Henan, Hubei, Chongqing, Sichuan, Guizhou, and Shanxi
Late indica riceZhejiang, Anhui, Fujian, Jiangxi, Hubei, Hunan, Guangdong, Guangxi, and Hainan
Japonica riceHebei, Jilin, Heilongjiang, Jiangsu, Zhejiang, Anhui, Shandong, Henan, Hubei, Yunnan, and Ningxia
Table 2. Introduction and descriptive statistics of output and input variables in China’s rice production, 1997–2018.
Kind of RiceOutput VariableIntput Variables
YFerZ1Z2Z3Z4
Yied (kg/ha)Total Usage Per Hectare of Nitrogen Fertilizer (Urea, Ammonium Phosphate, and Other Nitrogen Fertilizer), Phosphorus Fertilizer, Potash Fertilizer, and Compound Fertilizer (kg/ha)Seed Usage Per Hectare (kg/ha)Pesticide Expenditure Per Hectare (CNY/ha)Number of Labor Force Including Both Farmers and Employees Per Hectare, A Standard Working Day Equals to 8 h (d/ha)Other Expenditure Per Hectare, Including Animal Power, Machinery, Fuel, Agricultural Film, and Canopy Frame Materials (CNY/ha)
Early indica riceMean5930.39324.1665.87441.56142.041898.35
S.D.520.2577.6440.35264.3256.941020.60
Min4297.35183.1515.9071.8552.50493.20
Max7371.00720.00193.501066.50343.504367.70
Intermediary indica riceMean7734.76287.0217.79343.80189.451844.90
S.D.4978.0061.756.95261.3590.89841.07
Min5163.00114.609.4549.0556.70372.00
Max9543.90468.9044.551002.60420.003504.15
Late indica riceMean6057.33317.3825.46606.15141.511992.85
S.D.989.0173.019.15339.8655.011107.41
Min3301.50158.4010.5018.0056.10408.45
Max8150.101087.3570.731429.35313.504527.00
Japonica riceMean7770.29420.7496.19607.92165.422486.32
S.D.1048.24186.5473.20421.2386.931202.10
Min4966.50160.3528.35154.3544.25724.20
Max10,756.651564.20373.351875.00537.456715.80
Table 3. Introduction of technical efficiency of chemical fertilizer use (TEFU)’s influencing factors in China’s rice production.
Influencing FactorsIntroduction and UnitExpected Impact Direction on TEFU
Government’s fiscal support for agriculture (FA)Ratio between government’s fiscal support for agriculture and rural population (CNY/person)+
Agricultural labor productivity (LP)Ratio between added-value of agriculture and employed population in agricultural industry (CNY/person)+
Agricultural mechanization (AM)Ratio between total power of agricultural machinery and total land area of crops (W/ha)+
Effective irrigation (EI)Ratio between effective irrigated area and total land area of crops (%)+
Natural disaster (ND)Ratio between total land area of crops affected by natural disaster and total land area of crops (%)
Fertilizer price (FP)Ratio between chemical fertilizer expenditure and usage per hectare in rice production (CNY/kg)?
STFFP (D)The STFFP has been implemented since 2005, D = 1 when 2005–2019, and D = 0 when 1998–2004+
Note: CNY, Chinese Currency Yuan; + denotes influencing factor’s expected impact on TEFU is positive; − denotes influencing factor’s expected impact on TEFU is negative; ? denotes influencing factor’s expected impact on TEFU is uncertain.
Table 4. Specification test of stochastic frontier production function (SFPF) model.
Kinds of RiceLLF Value (H0)LLF Value (H1)LR Test Statistics χ 0.01 2
Early indica rice270.77288.5335.5130.58
Intermediary indica rice99.22106.5814.7230.58
Late indica rice120.19167.4694.5330.58
Japonica rice292.05304.4124.7230.58
Table 5. Estimates from SFPF model.
VariablesEarly Indica RiceIntermediary Indica RiceLate Indica RiceJaponica Rice
β0−13.088
(−1.351)
8.193 ***
(21.096)
−17.584 ***
(−3.289)
6.074 ***
(4.145)
lnFer−0.233 **
(−2.605)
0.172 *
(2.009)
0.851 **
(2.522)
0.101 ***
(6.161)
lnZ10.407 *
(1.952)
0.018 **
(2.643)
0.161
(0.900)
0.016 *
(1.936)
lnZ20.179 *
(2.029)
0.019 *
(1.988)
0.518 ***
(2.696)
0.020 *
(2.013)
lnZ3−0.105 **
(−2.733)
−0.021 **
(−2.604)
−0.128 ***
(−3.548)
−0.091 ***
(−6.817)
lnZ40.353 *
(2.061)
0.102 ***
(3.908)
0.196 *
(1.863)
0.222 *
(1.927)
lnFer × lnFer0.047
(0.414)
0.513 *
(1.915)
lnZ1 × lnZ10.045 *
(2.133)
0.331 **
(2.506)
lnZ2 × lnZ2−0.131 *
(−1.910)
0.363 **
(2.274)
lnZ3 × lnZ30.177
(1.299)
−0.261
(−0.665)
lnZ4 × lnZ4−0.031 *
(−1.802)
0.112
(0.384)
lnFer × lnZ10.164 *
(1.930)
0.335
(0.838)
lnFer × lnZ2−0.029 *
(−1.976)
−0.145 ***
(−3.272)
lnFer × lnZ3−0.106 ***
(−4.215)
0.292 ***
(3.547)
lnFer × lnZ40.002
(0.987)
−0.040
(−0.558)
lnZ1 × lnZ20.219 **
(2.839)
0.715 ***
(3.387)
lnZ1 × lnZ3−0.045
(−0.644)
−0.874 ***
(−2.661)
lnZ1 × lnZ40.182 *
(1.815)
−0.102 ***
(−3.462)
lnZ2 × lnZ30.258 *
(1.966)
0.852 *
(2.099)
lnZ2 × lnZ40.138
(0.839)
0.576 *
(1.993)
lnZ3 × lnZ4−0.042
(−1.602)
0.264
(0.447)
Sigma-squared (σ2)0.063 ***
(5.735)
0.048 ***
(3.908)
0.060 ***
(8.774)
0.013 ***
(6.920)
Gamma (γ)0.847 ***
(11.403)
0.886 ***
(5.735)
0.895 ***
(6.225)
0.804 ***
(12.208)
LLF value288.52899.224167.458292.050
LR test of the one-sided error12.030103.69936.56912.491
Note: Fer, chemical fertilizer usage; Z1, seed usage; Z2, pesticide expenditure; Z3, number of labor force; Z4, other expenditure. t-statistics values are in parentheses. *** p < 0.01, ** p < 0.05, and * p < 0.1.
Table 6. Fer-TEFU combinations in China’s four kinds of rice production provinces in 2018.
Kinds of RiceLow TEFU (0–0.4)Medium TEFU (0.4–0.6)High TEFU (0.6–0.8)Very High TEFU (0.8–1.0)
Early indica riceLow Fer (0–225 kg/ha)
Medium Fer (225–300 kg/ha) HunanFujian, Hubei
High Fer (300–375 kg/ha) Anhui, GuangdongZhejiang, Jiangxi, Hainan
Very high Fer (>375 kg/ha) Guangxi
Intermediary indica riceLow Fer (0–225 kg/ha) Chongqing
Medium Fer (225–300 kg/ha) Henan, Sichuan
High Fer (300–375 kg/ha)FujianHubeiAnhui, Guizhou, Shanxi
Very high Fer (>375 kg/ha) Jiangsu
Late indicariceLow Fer (0–225 kg/ha)
Medium Fer (225–300 kg/ha) Hunan
High Fer (300–375 kg/ha) Guangdong, HainanZhejiang, Fujian, Jiangxi, Hubei, Guangxi
Very high Fer (>375 kg/ha) Anhui
Japonica riceLow Fer (0–225 kg/ha)
Medium Fer (225–300 kg/ha) Heilongjian
High Fer (300–375 kg/ha) Jilin, Zhejiang, Hubei, Anhui
Very high Fer (>375 kg/ha) Hebei, Liaoning, Jiangsu, Henan, Yunnan, Ninxia Shandong
Table 7. TEFU’s influencing factors in China’s rice production: estimates from the Tobit model.
VariablesEarly Indica RiceIntermediary Indica RiceLate Indica RiceJaponica Rice
Constant−0.496
(−1.402)
−0.417
(−0.826)
−0.660 ***
(−3.191)
−0.274
(−1.189)
lnFA0.023 *
(1.801)
0.002 **
(2.075)
0.017 **
(2.281)
0.029 *
(1.755)
lnLP0.079 *
(1.796)
0.085 *
(1.755)
0.018 *
(1.759)
0.007 *
(1.806)
lnAM0.032 **
(2.063)
0.057 *
(1.791)
0.020 *
(1.773)
0.062 *
(1.917)
lnEI0.054 *
(1.961)
0.043 *
(1.826)
0.022 *
(1.756)
0.041 *
(1.792)
lnND−0.009 **
(−2.242)
−0.019 *
(−1.811)
−0.006 *
(−1.849)
−0.001 *
(−1.904)
lnFP−0.180 **
(−2.480)
−0.096 **
(−2.212)
−0.072 ***
(−4.326)
−0.048 **
(−2.272)
D0.076 *
(1.743)
0.005 *
(1.809)
0.017 *
(1.733)
0.035 **
(1.989)
Log likelihood109.784114.524389.394152.347
Left censored observations0000
Right censored observations0000
Uncensored observations198198198264
Total observations198198198264
Note: Government’s fiscal support for agriculture (FA), agricultural labor productivity (LP), agricultural mechanization (AM), effective irrigation (EI), natural disaster (ND), fertilizer price (FP), and STFFP (D). Z-statistics values are in parentheses. *** p < 0.01, ** p < 0.05, and * p < 0.1.
Table 8. TEFU’s influencing factors in China’s rice production: estimates from panel data fixed effect model.
VariablesEarly Indica RiceIntermediary Indica RiceLate Indica RiceJaponica Rice
Constant−1.319 ***
(−3.256)
−0.871
(−1.447)
−0.342 ***
(−3.634)
−0.576
(−1.053)
lnFA0.078 ***
(2.601)
0.030 *
(1.923)
0.012 *
(1.726)
0.034 **
(2.033)
lnLP0.104 *
(1.721)
0.029 *
(1.901)
0.031 **
(1.997)
0.041 *
(1.859)
lnAM0.063 *
(1.876)
0.035 **
(2.013)
0.010 *
(1.874)
0.012 ***
(2.742)
lnEI0.073 **
(2.004)
0.022 ***
(3.469)
0.023 **
(1.979)
0.077 **
(2.412)
lnND−0.030 ***
(−2.798)
−0.048 ***
(−3.636)
−0.007 ***
(−3.061)
−0.002 *
(−1.722)
lnFP−0.020 **
(−2.215)
−0.027 *
(−1.820)
−0.024 **
(−2.293)
−0.037 ***
(−4.952)
D0.076 **
(2.391)
0.011 *
(1.909)
0.002 *
(1.871)
0.003 *
(1.841)
R-squared0.6090.5560.5730.612
F24.267 ***13.157 ***14.416 ***19.300 ***
DW1.8271.9801.8121.879
Chi-Squared (Hausman test)18.551 ***24.512 ***31.557 ***22.553 ***
Total observations198198198264
Controls
Province-fixed effectYesYesYesYes
Year-fixed effectYesYesYesYes
Note: Government’s fiscal support for agriculture (FA), agricultural labor productivity (LP), agricultural mechanization (AM), effective irrigation (EI), natural disaster (ND), fertilizer price (FP), and STFFP (D). t-statistics values are in parentheses. *** p < 0.01, ** p < 0.05, and * p < 0.1.
Publisher’s Note: MDPI stays neutral with regard to jurisdictional claims in published maps and institutional affiliations.

