Abstract
Obliquely incident seismic waves have been habitually overlooked in fragility analysis. In this paper, a new approach to solving the equivalent loads on the infinite element boundary due to obliquely incident seismic waves is proposed. Based on the site conditions and structural characteristics in the Jiaxing area, the seismic response of a multi-story reinforced concrete (RC) frame structure has been fully investigated through the finite element method. Under obliquely incident SV waves (shear wave in the vertical x-z plane), the distribution of internal forces on the structure in the case of homogeneous foundation soil is significantly asymmetrical. Among the 3 obliquely incident angles investigated in this paper, the maximum inter-story displacement is smallest when the incident angle is 20° and largest when the angle equals 30°. For the structural fragility, the exceedance probability at each structural damage level is smallest when the incident reflection angle is 20° and largest when the angle equals 30°. When the structure is located in the silty valley, the influence of oblique incidence is attenuated and there is no obvious stress asymmetry on the structure due to the refraction of seismic waves on the interface.
1. Introduction
In numerical analysis, the rationale for the seismic wave input method directly determines the correctness and accuracy of the output. The traditional input methods mostly utilize the method of uniform consistency. This method supposes that the seismic waves are normally incident shear waves, which means only time characteristics are considered while spatial variation of seismic waves is ignored, notwithstanding the fact that normal incidence is just a special case and oblique incidence is much more common. Jin [1] analyzed 214 different ground seismic records using regression analysis and found that incident angles of seismic waves varied between 45° and 75°. Following a back analysis of 24 seismic records, Tokimatsu [2] concluded that incident angles were distributed within the range of 12.4°∼54.1°. In fact, oblique incidence not only significantly influences soil properties [3], but also contributes a lot to the dynamic response of structures. The exclusive consideration of normally incident SV waves will lead to an overestimate of the anti-liquefaction capacity of the foundation soil and the seismic performance of structures. Huang [4] investigated the dynamic response of the Beigongmen metro station under obliquely incident SV waves and found that the axial stresses in columns, the first and second principal stresses at control points on the sidewall all increased as incident angles became larger. Gao [5] studied the dynamic response of a 5-span bridge subjected to oblique seismic waves in detail, and the results showed that when the incident angle was 20°, the shear forces in the bridge piers were more than 3 times greater than the normal incidence case. Therefore it can be concluded that considering obliquely incident seismic waves is of paramount importance when analyzing the seismic performance of superstructures. However, it should be mentioned that oblique incidence is still rarely considered in structural seismic fragility analysis.
In the new edition of the seismic ground motion parameter zonation map of China, seismic fortification is mandated for all regions in Zhejiang Province. Jiaxing area is a prosperous and densely populated area located in Zhejiang and is vulnerable to seismic disasters. As a result, the seismic fortification level has been increased from 6 to 7 degrees [6]. Meanwhile, it has become even more urgent to investigate the seismic performance and fragility levels of the local structures while considering the local site and structural characteristics. As depicted in Figure 1, two fault zones near the region of interest are likely to induce earthquake motions, including a possible far-field earthquake originated from the Yangtze river’s estuary fault (approximately 140 km to the site of interest) and a near-field one originated from the Xiaoshan-Qiuchuan fault (approximately 10 km to the site of interest). The coloured polygons in Figure 1 correspond to the maximum magnitudes of earthquakes that can be induced by different potential earthquake sources in the area. Moreover, deep soft soils and silty valley terrain are widespread in this region. According to Panzera [7], local sites would seriously affect the propagation of seismic waves. Thus the geological features of the Jiaxing area are expected to contribute a lot to the seismic performance of local structures. However, past research about seismic fragility of structures has seldomly considered soil-structure interaction (SSI) since the seismic waves were traditionally applied directly to the foundation. As a result, the local site effects were not reflected in such fragility analyses [8,9].
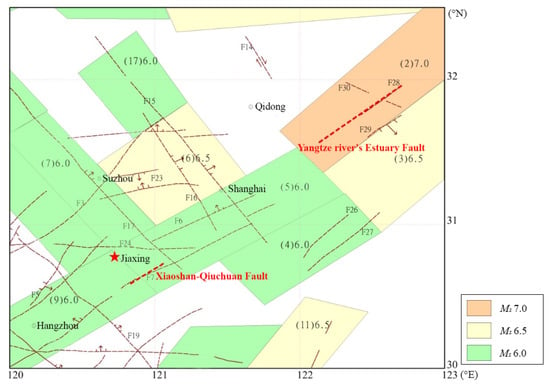
Figure 1.
Two fault zones close to the region of interest.
In this paper, the formulae for calculating the equivalent boundary loads on the infinite element boundary for obliquely incident SV waves and P waves (primary waves) are first derived based on the elastic wave theory. By comparing the numerical result with the analytical solution, the validity of the aforementioned input method is proved. Based on the typical site conditions and the seismic fortification requirements in the Jiaxing area, the dynamic response and fragility of a characteristic multi-story frame structure are thoroughly investigated while considering obliquely incident SV waves with different incident angles. Consequently, a reliable reference can then be provided for the seismic performance evaluation and strengthening design of local structures.
2. Model for Analysis
2.1. Structural Model
Jiaxing area has been economically developed for a long time. As a result, there are many relatively old masonry and concrete structures in the local communities. The structural heights generally range from 5 to 7 stories. The foundations are of simple forms, such as strip and mat foundations. To select a representative structure in the local area, the authors first investigated the construction archives from the local urban-rural development bureau and consulted experienced structural engineers. Finally, an 18 m-high, 5-story, 3-span reinforced concrete structure was adopted as the target structure. This structural configuration is quite common for local structures built before 1990 in the Jiaxing area. The corresponding 2D model is depicted in Figure 2. The cross-sectional area of the beam and column were 200 mm × 400 mm and 600 mm × 600 mm, respectively. The construction materials for both were C30 concrete and HRB335 rebar. A 1.5m-deep strip foundation was adopted as the structural foundation. The floor and roof dead loads were both 7 kN/m in the current simulation.
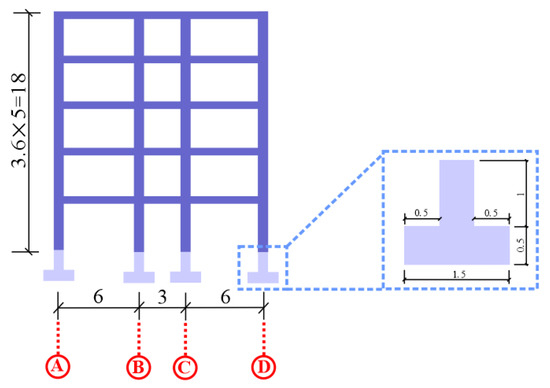
Figure 2.
Structural and strip foundation model used in the simulation (unit: m).
In the numerical model, the Timoshenko beam element was adopted to model beams and columns of the structure. The corresponding parameters can be found in Table 1. The concrete damage plasticity model [10] was used as the constitutive model for concrete. The relevant parameters include elastic modulus , uniaxial compression peak stress , peak strain , uniaxial tension peak stress and peak strain , as listed in Table 1.

Table 1.
Parameters for the concrete plasticity model used in the simulation.
In order to take account of the tension stiffening effect and the contribution from stirrup, the stress-strain relationship for concrete was modified according to research conducted by Gao [11]. The longitudinal steel bars were simulated through the keyword *rebar in ABAQUS [12]. The 4-node reduced integral plane strain element was adopted to analyze the strip footing. In light of the binding model used by Zhuang [13] to study the interaction between the non-vibrating isolation structure and pile caps, the tie constraints were used to simulate the interaction between the strip footings and column bases.
2.2. Foundation Soil Model
In this study, two types of simplified foundation soil models were examined. The first one represents homogeneous foundation soil, whereas the second one represents a silty valley foundation soil. These two foundation soil types can well capture the typical geological conditions in the Jiaxing area. The homogeneous foundation soil is composed of 100 m-deep silty clay, while the silty valley terrain is the result of the backfilling of river channels and pools, which are widespread in the area. For convenience, the valley terrain was further simplified as a semicircle with a radius of 50 m. This semicircle is filled with mud, as illustrated in Figure 3b.
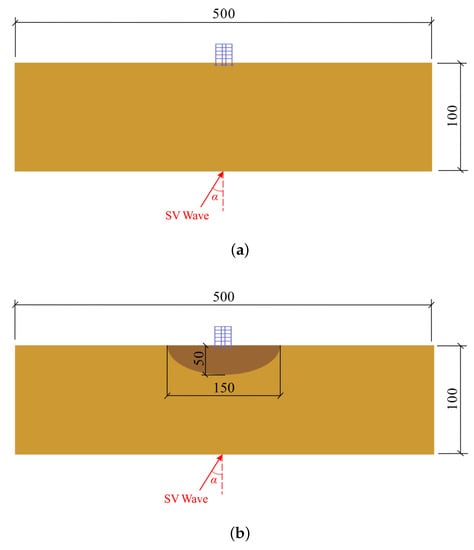
Figure 3.
Soil-structure systems used in the simulation (unit: m): (a) Homogeneous foundation soil model. (b) Silty valley foundation soil model.
In the numerical simulation, the 4-node reduced integral plane strain element (CPE4R) [12] was used to discretize the foundation soil and the Mohr-Coulomb elastoplastic model was adopted as the constitutive relationship [14]. The soil parameters for silty clay and mud are obtained from massive site investigation in the Jiaxing area [15], as shown in Table 2.

Table 2.
Soil parameters used in the simulation.
2.3. Soil-Structure Interface Modeling
As for the soil-structure interface, the surface-to-surface contact model was adopted to simulate the interaction between strip footings and the foundation soil. The surface with the larger stiffness was chosen as the master surface. Normal behavior was defined as hard contact in the current simulation, which means that normal stress exists if and only if there is no gap between the surfaces. The Coulomb friction model was adopted to simulate the mechanical behavior in the tangential direction. The ultimate shear stress can be expressed in Equation (1):
where is the friction coefficient between strip footing and foundation soil; p is the normal stress at the surface; represents the internal friction angle of the soil.
2.4. Soil and Structural Damping
In nonlinear finite element analysis, Rayleigh damping [16] was adopted to simulate the material damping behavior. The damping matrix is shown in Equation (3).
where is the mass-proportional damping coefficient and is the stiffness-proportional damping coefficient. These two coefficients can be obtained using the method proposed by Hudson [17], as shown in Equations (4) and (5).
where represents the fundamental frequency of the model; and n is an odd number greater than ; is the fundamental frequency of the seismic wave; represents the damping ratio; Nejati [18] suggested that the damping ratio for soft soil should be 2.6%. 5% is adopted as the damping ratio for the RC frame structure.
2.5. Selection of Input Seismic Motions
In accordance with the aforementioned two possible earthquake sources, both near-field and far-field earthquakes are likely to happen in the Jiaxing area. However, no strong motion records are available in the area so far. Thus, the seismic motions currently used in the simulation are selected from other existing records. In the seismic motion selection process, the earthquake magnitude () and the distance (R) from the rupture zone to the site of interest are two main parameters [19]. For near-field earthquakes, since the Xiaoshan-Qiuchuan fault is 10 km approximately from the site and the of induced earthquakes are expected to be around 6 degrees, 13 earthquakes of which R are approximately 10 km and are in the range 4.9∼7.6 are selected from the Pacific Earthquake Engineering Research Center [20]. For far-field earthquakes, another 5 different seismic waves were selected. The distances of these earthquakes are larger than 25 km to reduce near-field effects [21]. The spectral accelerations and the characteristic pairs of the selected seismic motions are plotted in Figure 4.
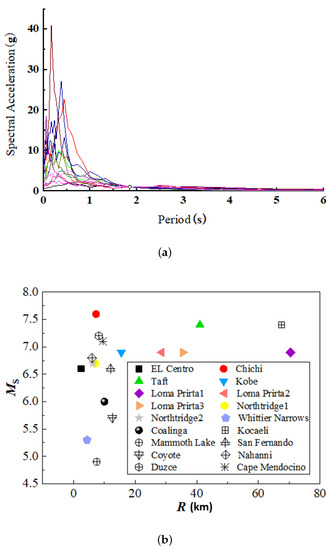
Figure 4.
Details of the 18 selected earthquake motions: (a) Spectral accelerations. (b) ( pairs.
3. Seismic Oblique Incidence on the Infinite Element Boundary
3.1. Seismic Oblique Incidence in a Free Field
As a case of external excitation, the oblique incidence of seismic waves in free field must obey the wave propagation theory. As shown in Figure 5, the SV wave changes its wave mode when reflected by the ground surface. When the SV wave is obliquely incident, the incident angle and the reflection angle must satisfy the Snell’s law, as shown in Equation (6). The amplitudes of the reflected SV wave and P wave can be expressed in Equations (7) and (8).
where represents the angle of incident and reflected SV waves; represents the reflection angle of P waves; represents the amplitude ratio of the reflected SV wave and the incident SV wave; represents the amplitude ratio of the reflected P wave and the incident SV wave.
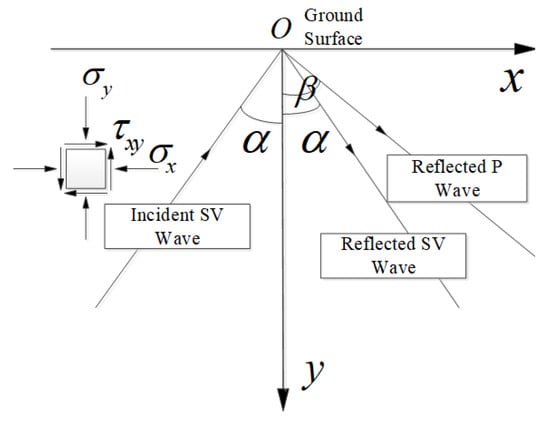
Figure 5.
The conversion of wave mode when the SV wave is reflected by the ground surface.
The case for obliquely incident P wave is also similar. The reflection angle is shown in Equation (9). The amplitudes of the reflected P wave and SV wave can be expressed in Equations (10) and (11).
where represents the angle of incident and reflected P waves; represents the reflection angle of SV waves; represents the amplitude ratio of the reflected P wave and the incident P wave while represents the amplitude ratio of the reflected SV wave and the incident P wave. Using Equations (6)–(11), the wave field at any point in the foundation soil can be obtained by a superposition of the incident wave field and two reflected wave fields.
3.2. The Equivalent Loads on the Infinite Element Boundary
For a fixed boundary, seismic waves will be reflected and generate extra energy in the field of interest, which gives rise to certain errors. Therefore a special artificial boundary is required to avoid this phenomenon. Lysmer [22] proposed a viscous boundary to prevent wave reflection. Liu [23] and Zhao [24] developed a special visco-elastic boundary. In the study reported in this paper, the infinite element implemented in ABAQUS was used to absorb the reflected seismic waves. Yang [25] derived the formula to calculate of the equivalent loads on the infinite element boundary for the vertical incidence case, as expressed by Equation (12) for the SV wave and Equation (13) for the P wave.
For the SV wave:
For the P wave:
In Equations (12) and (13), the superscripts of equivalent force represent the outer normal direction of the infinite element boundary, and the minus sign means the direction is in the negative direction. The subscripts refer to the equivalent force on the l-th element. refers to the area of the l-th element; is the material density; is the shear wave velocity; is the primary wave velocity; is the velocity of seismic motions induced by shear waves; is the velocity of seismic motions induced by primary waves.
Both Equations (12) and (13) include the force components required to overcome the damping of infinite elements and the force of the free field at the finite element boundary. The analysis results in Yang [25] suggest that infinite elements are very efficient in absorbing the reflection energy at the boundary interface. These equations, however, cannot be used for the case of oblique incidence seismic waves.
By using the concept of wave fronts, the problem of oblique incidence can be equivalent to normal incidence on the wave front. As a result, the differential input on the boundary can be transformed into a uniform excitation problem. For example, for the obliquely incident SV wave, as shown in Figure 6, SV wave is incident from the lower left side of the model at an angle of with respect to the vertical direction, as depicted in Figure 7. The time variable t is defined as 0 when the wave reaches the lower left corner of the model. The total wave field on the artificial boundary can be decomposed into an internal field and an external field. The external field can be simulated via the infinite element boundary. The internal field on the boundary is depicted in Figure 6, in which the field on the left boundary is a free field composed of the incident SV wave, reflected SV wave and reflected P wave while on the lower boundary the incident SV wave is considered exclusively. Note that no internal field exists on the right boundary.
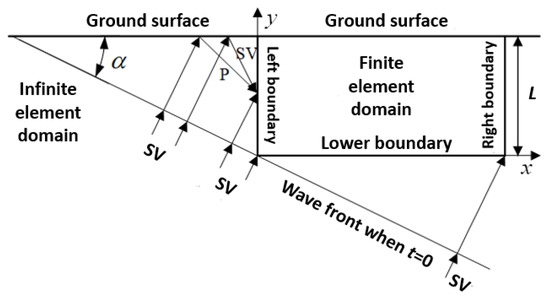
Figure 6.
Wave fields on the artificial boundary with oblique incidence of SV waves.
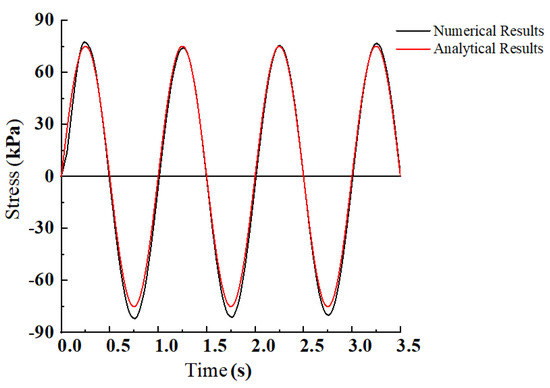
Figure 7.
Comparison of the analytical and simulated shear stress-time series at the central point of the ground surface.
The equivalent nodal force associated with the incident SV wave on the infinite element boundary can then be calculated based on the elastic wave equation. The nodal force is composed of two components, i.e., the nodal force resisting the damping of the infinite element boundary and the nodal force resisting the near-field media. The formulae are listed below.
For the lower boundary:
For the left boundary:
where , and are the time lags of the incident SV wave, reflected SV wave and reflected P wave on the left boundary, respectively. is the time lag of the incident SV wave on the lower boundary, as shown in Equations (18)–(21).
In the case of oblique incidence of the P wave, the equivalent nodal force on the lower boundary is shown in Equations (22) and (23).
For the left boundary:
where , and are the time lags of the incident SV wave, reflected SV wave and reflected P wave on the left boundary, respectively. is the time lag of the incident SV wave on the lower boundary, as shown in Equations (26)–(29).
In this paper, only the case of SV oblique incidence is verified due to the length limitation. It should be noted that there exists a critical incident angle , which is related to the propagation of an SV wave, as shown in Equation (30).
where represents the SV wave velocity; represents the P wave velocity; is the Poisson’s ratio of the soil. When the incident angle is smaller than , a reflected SV wave and a P wave can be generated. When , only the reflected SV wave is generated. Due to the fact that the density of soil increases with depth, the incident angle of seismic waves propagating to the ground surface from the deep part of the foundation gradually decreases according to the laws of refraction and reflection. Hence only is considered in this paper [4].
In order to verify the reliability equivalent nodal force formulae, the numerical method described in this paper was compared with the analytical solution [26]. In the numerical model, the foundation soil model has a width of 500 m and a depth of 100 m. The soil is assumed to be elastic, with a density of 2000 kg/, a Poisson’s ratio of 0.3, an elastic modulus of 208 MPa, a critical incident angle of 32.31° and a shear wave velocity of 200 m/. The SV wave has a frequency of 1 Hz and an amplitude of 1. The angle of incidence is 30°. The dynamic shear stress-time series at the central point of the ground surface, calculated in two different ways, are depicted in Figure 7. It can be observed that the horizontal stress calculated by the method proposed in this paper agrees well with the analytical solution in terms of the period and amplitude, indicating the method proposed in this paper is highly accurate.
4. Dynamic Response of Multi-Story RC Frame Structures Subjected to Obliquely Incident Seismic Waves
In order to compare dynamic responses of multi-story RC structures under incident SV waves with different incident angles, a series of SV waves with the same amplitude but different incident angles were used in the simulation. The amplitudes for these SV waves are 0.1 g. Although the seismic response of the superstructure is expected to vary under different SV waves with different incident angles qualitatively, calculating all possible oblique incident waves with is extremely arduous and time-consuming. As a result, with the aim to foreground such influences quantitatively, the incident angles used in the simulation were 0°, 10°, 20° and 30°, respectively. Moreover, to highlight the influence of topographic effects on the oblique incidence, the dynamic structural responses for the case of homogeneous foundation soil and silty valley foundation soil were also compared.
4.1. The Influence of Oblique Incidence of SV Waves on the Column
Table 3 shows the peak shear force at the top and bottom of columns A, B, C and D in the cases of homogenous foundation soil and silty valley foundation soil. With the increase of incident angle, the peak shear force at the top of each column first decreases and then increases. The shear force variation tendency at the bottom of each column is consistent with the top one. In the case of homogenous soft soil, columns A and B on the left of the structure have larger peak shear forces than their counterparts D and C. The peak shear force in column B (A) is 1.38 (2.2) times as large as in C (D). Hence the distribution of the shear force at the bottom of the column is significantly asymmetrical. However, for the silty valley case, the degree of asymmetry is not large and is independent of the incident angle of SV waves. This is because the valley terrain has topographic effects [27] and changes the direction of wave propagation on the interface. Therefore the superstructure is more evenly stressed. In the meantime, it should be noted that the peak shear force in the case of the silty valley foundation soil is larger than that in the case of homogeneous soil, which is the result of the valley focusing effects [28]. Gao [5] observed a similar situation when analyzing the influence of valley focusing effects on the seismic resistance of bridge piers. He found that the dynamic response of the piers was amplified significantly when the incident angle of the SV wave is between 0° and 30°.

Table 3.
Peak shear force on each column in different foundation soil under the Coyote wave (unit: kN).
4.2. The Influence of Obliquely Incident SV-Waves on the Displacement of Each Story
In Figure 8a,b, the maximum inter-story displacement of each story under the influence of the Coyote wave is depicted. It is evident that in both homogeneous soil and silty valley cases, the maximum inter-story displacement occurs on the first floor and decreases for other higher stories. This phenomenon agrees well with the structural deformation observed during Wenchuan Earthquake [29]. Moreover, the maximum inter-story displacement in the case of silty valley foundation soil is larger than the homogeneous foundation soil. When the seismic wave is normally incident, the slopes of the curves in Figure 8a,b are almost identical, which indicates that the maximum inter-story displacement of each story is distributed in a uniform way. When the SV wave is obliquely incident, it appears that the slope of the lower part of the curve is larger than the upper part, indicating that the oblique incidence of the seismic wave aggravates the inter-story displacement. Among all the three different incident angles investigated in this paper, the maximum inter-story displacement is smallest when the incident angle is 20°. When the incident angle is 30°, the maximum inter-story displacements on the higher stories is smaller than that in the case of vertical incidence. However, the maximum inter-story displacement at the lower story has a contrary tendency.
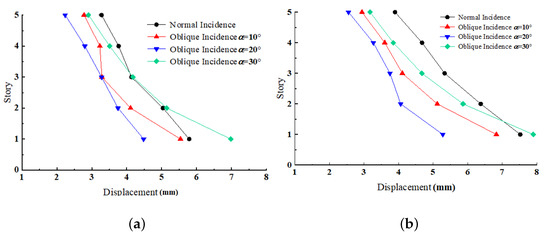
Figure 8.
The distribution of maximum inter-story displacement along the height under the obliquely incident Coyote wave: (a) Homogenous foundation soil case. (b) Silty valley foundation soil case.
5. Fragility Analysis of Multi-Story RC Frame Structures under Obliquely Incident Seismic Waves
5.1. The Method of Fragility Analysis
According to Code for Seismic Design of Buildings (GB50011-2010) [30], the structural damage level is divided into five sections, i.e., perfect, slight damage, moderate damage, severe damage and collapse. The corresponding threshold values for these intervals are denoted as , , and . In this paper, the maximum drift is adopted as the index for structural seismic performance. In the current code in China, the 4 threshold values for RC structures are defined as , , and respectively.
The current seismic fortification intensity for the Jiaxing area is 6∼7 degrees. According to the relationship between the seismic fortification intensity and peak ground acceleration(PGA), as specified in the Code of Seismic Design of Buildings [30], 18 different seismic waves were modulated with 5 different PGAs: namely 0.05 g, 0.1 g, 0.2 g, 0.3 g, and 0.4 g. Together with 2 foundation soil types and 4 incident angles, a total of 720 seismic wave cases were generated to build up the database.
In fragility analysis, it is generally assumed that inter-story drift follows a lognormal distribution for seismic waves of identical PGAs [31].
where and are the logarithms of the mean value and the standard deviation of the inter-story drifts, respectively.
The failure probability of the structure can be expressed in Equation (32).
where and are derived from time history analysis; represents the corresponding threshold values of the structural damage levels; represents the standard normal distribution function.
As discussed above, through probability and statistical analyses, the exceedance probability for each model with different PGAs can be obtained. The data points are then depicted with PGA as the abscissa and the exceedance probability as the ordinate. The corresponding seismic fragility curve can finally be derived.
5.2. The Influence of Oblique Incidence of SV Waves on the Seismic Fragility of Structures
The seismic fragility curves for the structures located on the homogeneous soft foundation soil and the silty valley foundation soil are depicted in Figure 9 and Figure 10, respectively. The subgraphs (a), (b), (c), and (d) correspond to the 4 different levels of structural performance, respectively. It can be observed from the figures that the variation trends of the fragility curves for the two foundation models are almost identical. Nevertheless, the deformation of the structure built on the valley terrain has been magnified due to the topographic effects [5]. As a result, structures are more susceptible to destruction in this case. Thus the exceedance probability for structures built upon on the silty valley foundation soil is overall higher than for structures located on the homogenous soil.
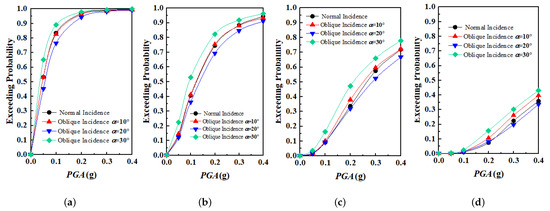
Figure 9.
The seismic fragility curves of homogeneous foundation soil model at different seismic damage levels: (a) Slight demage (b) Moderate damage (c) Severe damage (d) Collapse.
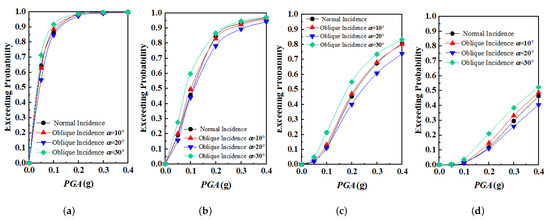
Figure 10.
The seismic fragility curves of silty valley model at different seismic damage levels: (a) Slight demage (b) Moderate damage (c) Severe damage (d) Collapse.
At each damage level, there seems to be a significant correlation between the structural fragility and the incident angles. Among the 4 incident angles investigated, the exceedance probability is smallest when the incident angle is 20° and largest when the incident angle is 30°, indicating that the structure is most vulnerable in the latter situation. In order to analyze the influence of obliquely incident seismic waves on the fragility of structures at a deeper level, the differences in exceedance probabilities between normally incident and obliquely incident waves were obtained for 3 different incident angles, as shown in Figure 11 and Figure 12. It is quite evident that the variation trends with respect to PGA for the two foundation models are quite similar. The observed differences only depend on the incident angle of seismic waves. When the incident angle is 10°, the corresponding exceedance probabilities at each damage level are almost identical to the case of normal incidence. The exceedance probabilities for each damage level reduce when the incident angle is 20° but tend to be magnified when the incident angle is 30°. For the silty valley model, the amplification effects at the levels of slight damage and severe damage are smaller than the case for the homogenous soil model. The amplification effect, however, is rather obvious at the level of moderate damage, with a 14% larger maximum damage probability. Consequently, it is of paramount importance to consider the influence of obliquely incident seismic waves at the level of moderate damage when analyzing the fragility of structures.
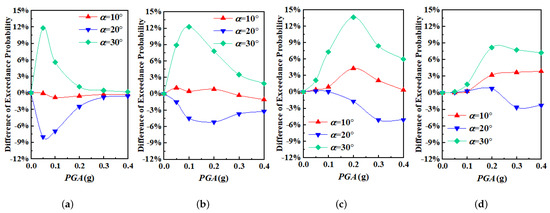
Figure 11.
Differences of exceedance probability between the normal incidence and the oblique incidences at different seismic damage levels in the case of homogenous foundation soil: (a) Slight demage (b) Moderate damage (c) Severe damage (d) Collapse.
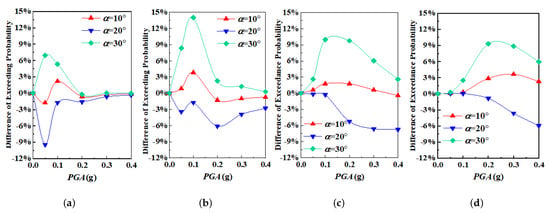
Figure 12.
Differences of exceedance probability between the normal incidence and the oblique incidences at different seismic damage levels in the case of silty valley foundation soil: (a) Slight demage (b) Moderate damage (c) Severe damage (d) Collapse.
The abovementioned detrimental effects of oblique incidence were also observed in other relevant research. For instance, Cen [32] concluded that the increase of incident angle could lead to larger seismic response of the dam. Gao [5] studied the seismic performance of bridges and concluded that the structure was more fragile when the incident angle of SV waves was 30°. Lyu [33] investigated the influence of oblique SV waves on the underground tunnel and largest seismic response was observed when the incident angle equaled 30°. Wang [34] systematically analyzed the dynamic performance of an underground powerhouse and the structural damage reached the maximum when the incident angle was 30°. Li [35] studied the site response under obliquely incident seismic waves and found that earthquake-induced internal force had the largest magnitude when the SV wave was obliquely incident at 30°. These results are consistent with those reported in this paper. However, it should be noted that previous research seldom considered the influence of oblique incidence on the fragility of superstructures. Furthermore, this equivalent load method proposed previously is based on the infinite element, which has already been implemented in ABAQUS. Therefore, this method is believed to be easily applicable in engineering practice.
6. Conclusions
In this paper, the infinite element is used to absorb the reflected wave at the boundary, and the equivalent load formulae for obliquely incident seismic waves are derived. Two numerical models were established based on local topography, geological conditions and seismic fortification requirement of the Jiaxing Area. The dynamic responses of multi-story structures subjected to obliquely incident seismic waves have been thoroughly investigated. From the results, it can be concluded that obliquely incident seismic waves have a non-negligible influence on the dynamic response of structures, as stated below.
- For homogenous foundation soil, the internal force distribution within the structure is significantly asymmetrical, i.e., shear forces on the columns close to the seismic source are much larger than those far from the seismic source.
- Among the 4 specific different incident angles investigated in the case of homogenious foundation soil, the maximum inter-story displacement is smallest when the incident angle is 20° and largest when the incident angle is 30°. Moreover, this rule also applies to the fragility of structures. At each structural damage level, the exceedance probability is smallest when the incident angle is 20° and largest when 30°.
- For silty valley foundation, there is no obvious asymmetry of internal force distribution since the reflection and refraction of seismic waves at the terrain interface attenuate the influence of obliquely incident seismic waves. However, the valley terrain does magnify the dynamic response of the superstructure. Moreover, the fragility of structures built on a silty valley foundation soil is strongly influenced by the incident angles, particularly at the moderate damage level.
Author Contributions
Conceptualization, B.H. and Y.Z.; methodology, B.H.; software, J.G.; validation, B.H.and K.L.; formal analysis, J.G.; investigation, J.G.; resources, Y.Z.; data curation, K.L.; writing—original draft preparation, J.G. and K.L.; writing—review and editing, J.G.; visualization, J.G.; supervision, B.H.; project administration, Y.Z.; funding acquisition, Y.Z. All authors have read and agreed to the published version of the manuscript.
Funding
This research was funded by the the National Natural Science Foundation of China, grant number 51988101 and Provincial Key Research and Development Program of Zhejiang, grant number 2018C03045.
Institutional Review Board Statement
Not applicable.
Informed Consent Statement
Not applicable.
Acknowledgments
The authors gratefully acknowledge the financial supports from the Key Research and Development Program of Zhejiang Province, grant number 2018C03045.
Conflicts of Interest
The authors declare no conflict of interest.
References
- Jin, X.; Liao, Z.P. Statistical Research on S-Wave Incident Angle; Disaster Prevention Research Institute Kyoto University: Kyoto, Japan, 1997; Volume 40, pp. 91–97. [Google Scholar]
- Tokimatsu, K.; Seed, H.B. Evaluation of settlements in sands due to earthquake shaking. J. Geotech. Eng. 1987, 113, 861–878. [Google Scholar] [CrossRef]
- Li, N.; Huang, B.; Ling, D.S. Experimental research on behaviors of saturated loose sand subjected to oblique ellipse stress path. Rock Soil Mech. 2015, 36, 156–170. [Google Scholar]
- Huang, J.; Du, X.L.; Tian, Z.M. Effect of the oblique incidence of seismic SV waves on the seismic response of subway station structure. Eng. Mech. 2014, 31, 81–88. [Google Scholar]
- Gao, X.J.; Zhao, C.G.; Liu, Q. Seismic response analysis of multi-span viaduct considering topographic effect and soil-structure dynamic interaction based on inclined wave. Eng. Mech. 2011, 28, 237–243. [Google Scholar]
- Ge, L.Y. Introduction to the New Edition of China’s Seismic Wave Parameter Zoning Map and Its Impact on Zhejiang Province. Zhejiang Archit. 2017, 34, 26–28. [Google Scholar]
- Panzera, F.; Lombardo, G.; Monaco, C.; Di Stefano, A. Seismic site effects observed on sediments and basaltic lavas outcropping in a test site of Catania, Italy. Nat. Hazard. 2015, 79, 1–27. [Google Scholar] [CrossRef]
- Celik, O.C.; Ellingwood, B.R. Seismic fragilities for non-ductile reinforced concrete frames–Role of aleatoric and epistemic uncertainties. Struct. Saf. 2010, 32, 1–12. [Google Scholar] [CrossRef]
- Park, J.; Kim, J. Fragility analysis of steel moment frames with various seismic connections subjected to sudden loss of a column. Eng. Struct. 2010, 32, 1547–1555. [Google Scholar] [CrossRef]
- Grassl, P.; Xenos, D.; Nyström, U.; Rempling, R.; Gylltoft, K. CDPM2: A damage-plasticity approach to modelling the failure of concrete. Int. J. Solids Struct. 2013, 50, 3805–3816. [Google Scholar] [CrossRef]
- Gao, X.; Zhang, Y.; Li, J. Numerical Simulation of a RC Frame Based on ABAQUS Beam Elements. Struct. Eng. 2013, 29, 19–26. [Google Scholar]
- Dassault Systemes Simulia Corp. ABAQUS, Version 6.14; Dassault Systemes Simulia Corp.: Providence, RI, USA, 2014. [Google Scholar]
- Zhuang, H.Y.; Yu, X. Dynamic Interaction of Soil-Pile-Isolated Structure; China Building Industry Press: Beijing, China, 2016; pp. 100–108. [Google Scholar]
- Rayhani, M.H.T.; El Naggar, M.H. Centrifuge modeling of seismic response of layered soft clay. Bull. Earthq. Eng. 2007, 5, 571–589. [Google Scholar] [CrossRef]
- Cai, W.Z.; Zhou, J.L.; Zhang, Y.F.; Zhao, Y.J. Evaluation on Features of Soft Foundation Engineering and Bearing Layer of Pile in Jiaxing City. J. Xinjiang Agri. Univ. 2011, 34, 353–357. [Google Scholar]
- Belytschko, T.; Liu, W.K.; Moran, B.; Elkhodary, K. Nonlinear Finite Elements for Continua and Structures, 2nd ed.; John Wiley & Sons: West Sussex, UK, 2014; pp. 399–401. [Google Scholar]
- Hudson, M.; Idriss, I.M.; Beikae, M. QUAD4M: A computer program to evaluate the seismic response of soil structures using finite element procedures and incorporating a compliant base. In Structural Engineer; Center for Geotechnical Modeling, Department of Civil and Environmental Engineering, University of California: Davis, CA, USA, 1994. [Google Scholar]
- Nejati, H.R.; Ahmadi, M.; Hashemolhosseini, H. Numerical analysis of ground surface vibration induced by underground train movement. Tunn. Undergr. Space Technol. 2012, 29, 1–9. [Google Scholar] [CrossRef]
- Katsanos, E.I.; Sextos, A.G.; Manolis, G.D. Selection of earthquake ground motion records: A state-of-the-art review from a structural engineering perspective. Soil Dyn. Earthq. Eng. 2010, 30, 157–169. [Google Scholar] [CrossRef]
- PEER Ground Motion Database. Available online: https://ngawest2.berkeley.edu/ (accessed on 21 December 2020).
- Hu, X.; Zhou, Z.; Chen, H.; Ren, Y. Seismic Fragility Analysis of Tunnels with Different Buried Depths in a Soft Soil. Sustainability 2020, 12, 892. [Google Scholar] [CrossRef]
- Lysmer, J.; Kuhlemeyer, R.L. Finite dynamic model for infinite media. J. Eng. Mech. Div. 1969, 95, 859–878. [Google Scholar]
- Liu, J.B.; Gu, Y.; Du, Y.X. Uniform Viscoelastic Artificial Boundary and Viscoelastic Boundary Element. J. Geotech. Eng. 2006, 28, 1070–1075. [Google Scholar]
- Zhao, C.; Valliappan, S. A dynamic infinite element for three-dimensional infinite-domain wave problems. Int. J. Numer. Methods Eng. 1993, 36, 2567–2580. [Google Scholar] [CrossRef]
- Yang, D.; Wang, Z.L. Numerical analysis of seismic response based on infinite element and wave field separation method. J. Tongji Univ. Nat. Sci. 2012, 40, 1129–1134. [Google Scholar]
- Huang, B.; Ling, D.S.; Ding, H. Seismic stress path induced by obliquely incident waves and its simulation. Chin. J. Geotech. Eng. 2013, 35, 276–283. [Google Scholar]
- Boore, D.M. The effect of simple topography on seismic waves: Implications for the accelerations recorded at Pacoima Dam, San Fernando Valley, California. Bull. Seismol. Soc. 1973, 63, 1603–1609. [Google Scholar]
- Choi, Y.; Stewart, J.P.; Graves, R.W. Empirical model for basin effects accounts for basin depth and source location. Bull. Seismol. Soc. Am. 2005, 95, 1412–1427. [Google Scholar] [CrossRef]
- Sun, B.T.; Zhang, G.X. Statistical analysis of the seismic vulnerability of various types of structures in Wenchuan M8. 0 earthquake. China Civ. Eng. J. 2012, 45, 26–30. [Google Scholar]
- National Standard of the People’s Republic of China. Code for Seismic Design of Buildings (GB50011-2010); Ministry of Housing and Urban-Rural Construction of P.R.C.: Beijing, China, 2010. [Google Scholar]
- Li, G. Performance-Based Seismic Design of Structures; Science Press: Beijing, China, 2004; pp. 76–85. [Google Scholar]
- Cen, W.J.; Du, X.H.; Li, D.J.; Yuan, L.N. Oblique incidence of seismic wave reflecting two components of design ground motion. Shock Vib. 2018, 2018, 4127031. [Google Scholar] [CrossRef]
- Lyu, D.; Ma, S.; Yu, C.; Liu, C.; Wang, X.; Yang, B.; Xiao, M. Effects of Oblique Incidence of SV Waves on Nonlinear Seismic Response of a Lined Arched Tunnel. Shock Vib. 2020, 2020, 8093804. [Google Scholar] [CrossRef]
- Wang, X.; Chen, J.; Xiao, M. Seismic responses of an underground powerhouse structure subjected to oblique incidence SV and P waves. Soil Dyn. Earthq. Eng. 2019, 119, 130–143. [Google Scholar] [CrossRef]
- Li, Q.Q. Theoretical and Numerical Study of Dynamic Stress Paths Caused by Oblique Incident Seismic Waves. Master’s Thesis, Zhejiang University, Hangzhou, China, 2017. [Google Scholar]
Publisher’s Note: MDPI stays neutral with regard to jurisdictional claims in published maps and institutional affiliations. |
© 2021 by the authors. Licensee MDPI, Basel, Switzerland. This article is an open access article distributed under the terms and conditions of the Creative Commons Attribution (CC BY) license (http://creativecommons.org/licenses/by/4.0/).