Article

Catchworks: A Historical Water-Distribution System on Mountain Meadows in Central Slovakia

1
Department of Landscape Planning and Design, Faculty of Ecology and Environmental Sciences, Technical University in Zvolen, 960 01 Zvolen, Slovakia
2
Department of Ecology and Environmental Sciences, Faculty of Natural Sciences, Constantine the Philosopher University in Nitra, 949 74 Nitra, Slovakia
*
Author to whom correspondence should be addressed.
Sustainability 2021, 13(3), 1107; https://doi.org/10.3390/su13031107
Submission received: 30 December 2020 / Revised: 17 January 2021 / Accepted: 18 January 2021 / Published: 21 January 2021
(This article belongs to the Special Issue Agricultural Water Management and Irrigation Systems Assessment)

Abstract

:
Water meadows or flooded meadows are known from many European countries. A historical irrigation system—catchworks—was identified in only one locality in Slovakia. This article brings a methodical approach to the identification of catchworks on mountain slopes. The main aim was to delineate catchworks using terrain and land use geospatial data intended to supplement existing data on catchworks from the field survey. The identification of shallow and narrow channels in the field is difficult, and their detection in a digital terrain model (DTM) and orthomosaic photos is also challenging. A detailed DTM elaborated from laser scanning data was not available. Therefore, we employed break lines of a Triangulated Irregular Network (TIN) model created by EUROSENSE Ltd. 2017, Bratislava, Slovakia. to determine microtopographic features on mountain slopes. Orthomosaics with adjusted red (R) green (G) and blue (B) band thresholds (digital numbers) in a time sequence of 16 years (2002–2018) and the Normalized Green-Red Difference Index (NGRDI) (2018) determined vital herbaceous vegetation and higher biomass. In both cases, the vegetation inside wet functional catchworks was differently coloured from the surroundings. In the case of dry catchworks, the identification relied only on microtopography features. The length of catchworks mapped in the field (1939.12 m; 2013) was supplied with potential catchworks detected from geospatial data (2877.18; 2018) and their total length in the study area increased above 59.74% (4816.30 m). Real and potential catchworks predominantly occupied historical grassland (meadows and pastures) (1952–1957) (4430.31; 91.99%). This result corresponds with the findings of foreign studies referring that catchworks on mountain slopes were related to livestock activities. They are important elements of sustainable land use with a water retention function in traditional agricultural landscapes.

1. Introduction

Traditional agricultural landscapes contain landscape archetypes primarily determined by the properties of relief and geological structure and reflecting the adaptation of the country to human activities [1]. These landscapes contain many valuable historical features interacting with sustainable agriculture. For the last sixty years, after the Communist Reform, traditional agricultural landscapes have gradually disappeared from many submountain and mountain regions of Slovakia [2]. One of the traditionally cultivated landscapes justifying sustainable agriculture are water meadows [3].
Agricultural production primarily depends on the production potential of the soil and ecological conditions determining the natural biomass production. The production potential then significantly influences the priorities of agricultural practice [4]. Water meadows reflect a human demand for a higher production of hay and livestock fodder in general. They were established to increase the natural agricultural potential of a given area [5]. A term of floated meadows is a synonym for water meadows [5,6,7,8]. In Europe, water meadows can be found on alluvial floodplains where complex bedwork systems developed [8], or on mountain slopes where long channels of catchworks were built up and represent traditional irrigation systems [3]. Catchworks appeared frequently in agricultural landscapes over nearly all of Europe [9]. Known literature refers to the existence of catchworks in traditional agricultural systems [3,9,10,11,12,13].
Catchworks are watering gutters on mountain meadows usually constructed in several height levels. They are also called catch-meadows [14] or downward floated water-meadows [15]. Catchworks “catch” water from a river or its tributary. Then, water flows through artificial channels or gutters to a place when it is expected to be flowing downslope through the grass. In that place, a gutter wall is interrupted and water flow from a gutter to a meadow is regulated with hatches of turves [16]. Gravity is the main power for the water distribution and the cost exploitation is often close to zero [17]. Catchworks usually appear on hay making meadows [12] or pastures [11], and they are particularly designed to bring water on mountain slopes from water streams. Catchworks have been historically recorded in writing since circa the 16th century in Europe [6,14]. However, more complex and sophisticated irrigation systems were predominantly developed by ancient civilizations in India, Egypt, Mesopotamia, South-East Asia, China and by Incas in tropical America [18]. These civilizations built extensive irrigation systems, focusing mainly on the intensification of crop production. As the authors [9] noted, in comparison with the irrigation systems of the European Mediaeval and pre-modern ages, latter meadow irrigations in Europe were not so extensive and advanced. Leibundgut and Kohn [9] brought a complex work on traditional irrigation systems and created a map of their distribution in Europe. However, Slovakia is missing on the map. Therefore, research has been initiated since 2013 in Slovakia and the first studies were published about catchworks in the cadastral district of Hriňová [13,19]. The cadastral territory is characterized by heterogeneous land cover, which has been maintained firstly by shepherds since the establishment of the first settlements in the 17th century and later by peasants practicing traditional agriculture [13].
The presence of High Nature Valuable (HNV) biotopes in traditional agricultural systems sub-ordinates the planning of their land use to protective measures targeting the preservation of natural values and simultaneously respecting the residents’ identity to the landscape. In Slovakia, catchworks are not well recognized by the public in comparison to the United Kingdom, Austria, or Mediterranean countries. They suffer from inadequate maintenance and field surveys of undistinguished shallow channels locally interrupted due to erosion processes or cultivation practices are difficult or even impossible.
Catchworks can be identified in historical aerial photos and consequently their future land use management is proposed [16]. Microtopographic terrain features are detectable only in highly precise and detailed digital models. High-resolution digital terrain models (DTMs) are very useful for the extraction of water networks regarding a condition that the terrain in the model expresses well-defined morphology [20]. Generally, the mapping and positioning of small streams, channels or artificial gutters and ditches using remote sensing techniques is not common and it is always challenging [21,22]. The main obstacles are their small size, shape indeterminacy and natural settings (dense shrubs, forests, rugged terrain with steep slopes and deep valleys, etc.) complicating the sensing of the land surface with remote devices [23].
Shallow channels rarely appear in remote sensing literature, nevertheless, some studies exist [22,24,25]. Archaeological surveys obviously employ modern remote sensing technologies for the identification of artificial landforms [26]; frequently, Light Detection and Ranging (LiDAR) is used, mainly due to its high penetration level through land cover [27]. Photogrammetry is also common [28] due to the accuracy, sufficient density of point clouds for detailed analysis of microtopography and relatively fast and low-cost data acquisition in the field [29]. However, these techniques require professional geodetic staff for data acquisition in the field. McCoy et al. (2011) [24] derived cultural features in terrain from LiDAR digital models using the Slope Contrast Mapping technique in Geographic Information System (GIS) application. Based on the identification of irrigation channels, the authors calculated the water capacity of historical channels and the equivalent size of the irrigated area. Bedford et al. (2017) [25] explored remnants of the irrigation systems across the studied islands in Oceania (the Vanuatu archipelago, namely the islands of Maewo and Aneityum), and according to the irrigation survey, the authors indicated a denser population in the past as they expected.
This article brings a methodical approach to the identification of linear shallow and narrow irrigation channels—catchworks—on mountain slopes. The main aim was to delineate catchworks using terrain and land use geospatial data intended to supplement existing data on catchworks from the field survey (2013). LiDAR data were not available for the study area and highly precise and detailed DTMs as well. Therefore, terrain data were purchased from EUROSENSE Ltd. 2017, Bratislava, Slovakia. The company created a DTM in the form of a Triangulated Irregular Network (TIN) compatible with Environmental Systems Research Institute (ESRI) GIS products. We assumed that micro-scale linear terrain discontinuities on the slopes interpretated as break lines in TIN might indicate the presence of catchworks. We elaborated TIN break lines very precisely by the experts in order to also capture tiny terrain discontinuities on the slopes. On the other hand, break lines might also indicate other terrain linear edges, such as, for instance, plot borders. Therefore, a vegetation analysis in orthomosaic photos and a vegetation index were used to supply the terrain data. The presence of darker green colour hues indicated vital herbaceous vegetation inside catchworks, with higher humidity differing them from other drier areas. However, during the field inventory in 2013, we observed that not all catchworks were functional and some of them were covered with dried vegetation or vegetation without any contrast of vitality or biomass extent in comparison to the surrounding area. Therefore, we expected that not all catchworks can be delineated using terrain and land use geospatial data. To confirm or reject the statement that catchworks correspond with livestock activities [5,30], we evaluated the length of real and potential catchworks in the land use categories derived from current topographic maps (2019), in plots registered in the national cadastre of real estate and inside land use categories of historical maps (1952–1957). According to the results, we could determine the primary purpose of catchworks in the study locality and confirm or reject whether they were developed to intensify fodder production for livestock, as they were in other European countries.

2. Materials and Methods

2.1. The Study Area

The cadastral district of Hriňová is 12,642.96 ha [31] and it is situated in central Slovakia. Its main part is in the Veporské Vrchy Mts. and the Poľana Mt. and the South-western part of the district is in the Zvolenská Kotlina Basin. Catchworks were identified in the field (2013) in the Riečka water catchment (783.1 ha) (Figure 1). The altitude varies from 598 m ASL in the lowest Southern part of the catchment to 1194 m ASL in the North. Results were demonstrated in a model area of 1 km2 located in the central part of the Riečka water catchment. Water permeability of the granodiorite bedrock is low and less intensive springs prevail [32]. Evident lack of water is mainly during the vegetation period [33]. Rainfall rapidly penetrates to the lower bedrock horizons through the sandy loam weathering mantle. Slightly productive soils, harsh weather conditions which are not suitable for intensive agriculture and lack of water were the main reasons why land consolidation reforms have never changed the traditional character of the study area and catchworks have been preserved [19].
The northern part of the cadastral district has been under the nature and landscape protection of The Protected Landscape Area Poľana since 1981 and The Poľana Biosphere Reserve (BR) since 1990 [34]. Residents living in the vicinity of the protected area or directly inside the area cherish the values rising from the presence of natural heritage because the BR’s management closely co-operated with stakeholders [35]. The “Action Plan of the Poľana Biosphere Reserve 2014–2018” is an exceptional documentation in Slovakia. It brings a model of the BR’s management and demonstrates the coordination and consolidation of human economic activities with the natural carrying capacity of the landscape. The cadastral district of Hriňová is not rich only in natural values. It belongs to one of five regions in Slovakia with specific traditional scattered settlements [36]. Moreover, in addition to the fact that The Protected Landscape Area Poľana belongs to the less urbanized protected areas in Slovakia [34], the relationship between the residents and the landscape is very strong. The identity of residents and the landscape are mirrored in traditionally cultivated narrow long plots of ploughlands, meadows and pastures, often located on the terraces of moderate slopes. Intangible cultural heritage is recorded in coloured curved religious wooden architecture (crosses) and folk festivals [37]. We assume that a strong landscape identity might help to maintain and preserve catchworks.
The cadastral district is covered predominantly with forests and semi natural areas (9027.79 ha), and the agricultural landscape (3343.48 ha) occurs up to an altitude of circa 900 m ASL. Almost the whole area of the agricultural landscape is classified as High Nature Valuable (HNV) farmland, corresponding particularly with a Corine Land Cover category of Agricultural landscape/heterogeneous agricultural areas/Complex cultivation patterns and Agricultural landscape/Arable land/Non-irrigated arable land (Figure 1; Table S1). Catchworks belong to the traditional agricultural land use system on grassland (pastures and mowed meadows). During the field survey (May; September–November 2013), they were observed in HNV farmland in the study area (Figure 1). They were identified on slopes with declination ranging from 7–12° (32.45%) and 12–17° (26.83%). In total, 3736.68 m of catchworks were identified in the Riečka water catchment, but 54% of them were dysfunctional [19].

2.2. Material

GIS geospatial data were processed in Quantum GIS (QGIS) București 3.12.3 and 3.14 π “Pi” and the System for Automated Geoscientific Analyses (SAGA) GIS 2.3.2. Both applications are free and open-source cross-platform desktop GIS. A coordinate reference system S-JTSK (Greenwich)/Krovak East North (EPSG code 5514) was applied. Online datasets were accessed from Open Geospatial Consortium (OGC) Web Map Services (WMS) and Web Map Tile Service (WMTS). Maps provided by national OGC WMS were accessed through the Hypertext Transfer Protocol (HTTP) protocol using a WMS QGIS client.
We used WMS and WMTS services provided by ZBGIS® Map Clients at the ZBGIS Geoportal website to access Topographic maps and Plots of the national Cadastre of Real Estate. ZBGIS® is a part of the Information System of Geodesy, Cartography and Cadastre and it is provided and maintained by the Geodesy Cartography and Cadastre Authority of the Slovak Republic under the Act No. 215/1995 Coll. on Geodesy and Cartography, as amended [31].
Historical data (1952–1957)—military topographic maps of scale 1:25,000—were accessed through the WMS of the Slovak Environmental Agency [38].
Historical data of the orthomosaic photos (1950) were accessed at the website “Historická ortofotomapa Slovenska Centrum excelentnosti pre podporu rozhodovania v lese a krajine, TU Zvolen” of the Technical University in Zvolen [39].
Orthomosaic photos in true colours red (R), green (G) and blue (B) (2002, 2006, 2009, 2011, 2015, 2018) were provided by EUROSENSE Ltd. 2017 and their parameters are in Table 1.
Terrain data and a digital terrain model were purchased from EUROSENSE Ltd. and detailed characteristics are in Section 2.3.1.
Field data of real catchworks were collected during 8, 10 and 28 October 2013. They were localized with geodetic Global Navigation Satellite System (GNSS) Leica GS05 and imported to QGIS using the Global Positioning System (GPS) Tool plugin. The receiver uses up to 14 channels of continuous tracking on L1 (GPS); up to 14 channels of continuous tracking on L1 (GLONASS). The baseline precision of a differential code solution for static and kinematic surveys is 40 cm. However, accuracy depends on the number of tracking satellites and many other external factors [40].
Geospatial data were processed with different GIS software, tools and modules, which are summarized in Table 2 and described in detail in further methodical steps.

2.3. Methodology

2.3.1. Identification of Catchworks in a Digital Model

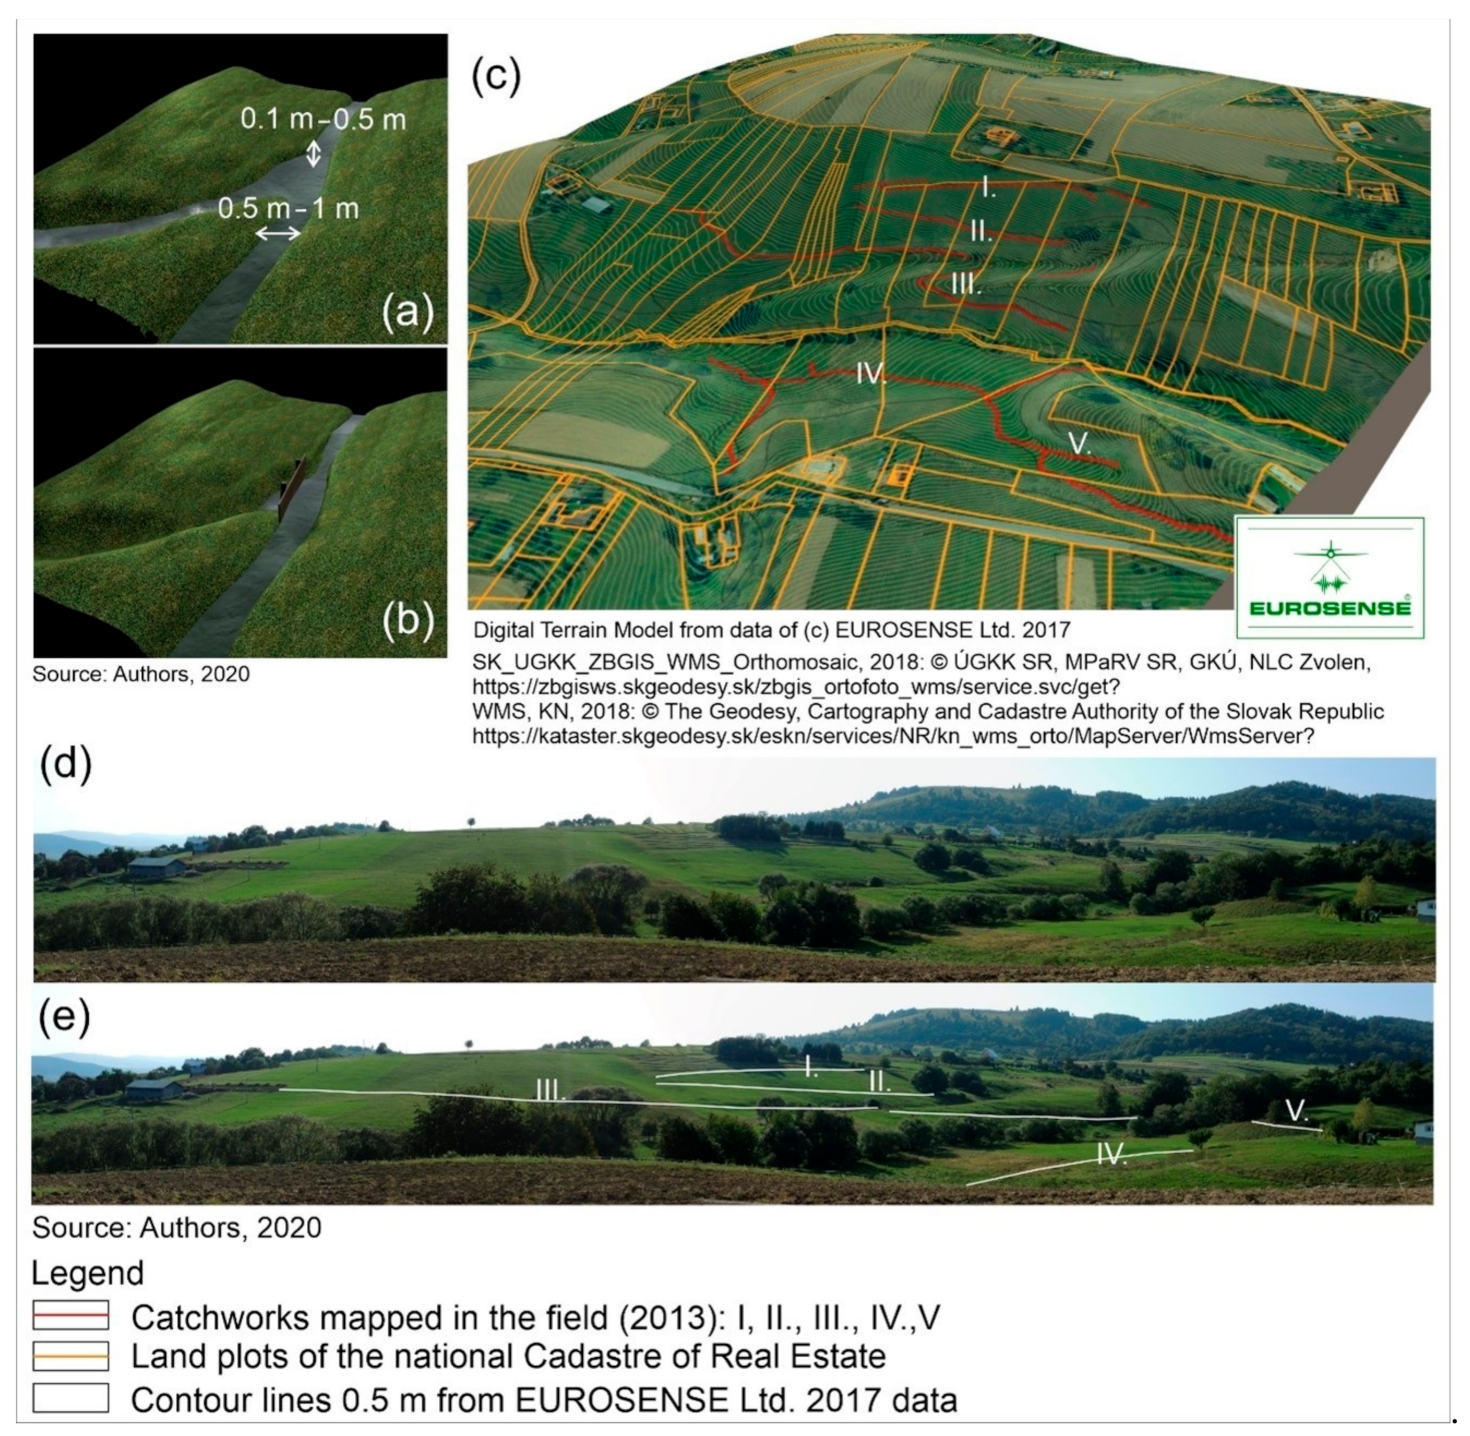
Catchworks can be identified as linear landforms in pixel based derivates of a DTM. Identification is not easy because these shallow and narrow linear concave landforms usually do not have sharp edges which are easy to detect automatically, semi-automatically or even manually [41] (Figure 2).
Since 2017, The Geodesy, Cartography and Cadastre Authority of the Slovak Republic has been working on the project of a new highly accurate and detailed digital relief model DMR 5.0 (Digital Model of Relief) for the entire territory of the Slovak Republic created from aerial laser scanning data. The estimated date when the whole territory of Slovakia will be covered with LiDAR data is 2023 and the study area has not been scanned yet.
Therefore, ESRI TIN was purchased for the study area from the EUROSENSE Ltd. company 2017. The EUROSENSE Ltd. experts created TIN from aerial photos (2017–2019) with a resolution of 25 cm/px. A digital model was elaborated by the photogrammetric method in the Socet Set® software developed and published by BAE Systems. The model was further processed, and a grid of elevation points was automatically generated. Then, the network of points was manually supplemented in the 3D environment with break lines where terrain edges were visible. At the same time, the network of points was manually edited. Points were inserted or adjusted to best fit the ground. Points under the dense vegetation cover were not adjusted accurately. Here, we note that catchworks were mainly mapped in grasslands and not under the woody vegetation canopy during the field survey. They were also expected to be identified in grasslands in the GIS environment. Therefore, these irregularities in the digital model did not limit the accuracy of the presented results.
Accuracies of TIN RMSEz ≤ 0.6 m and RMSExy ≤ 0.6 m were achieved in built-up areas, transport corridors in valleys along streams and in sites without woody vegetation. The size of catchworks varied approximately in the interval of 0.1–0.5 m of the depth and 0.5–1 m of the width. TIN accuracy would be sufficient for the detection of catchworks in a digital model. The density of points was only 14,456 points/km2, which means 0.014 points/m2. The point density is a limiting factor to detect microtopographic landforms [21]. However, we performed an experiment to detect terrain discontinuities indicating catchworks in the pixel based digital terrain model.
The ESRI TIN format is a proprietary geospatial vector format developed by ESRI for ArGIS products. It describes elevation and breaking edge features—break lines. It was possible to import ESRI TIN to QGIS 3.14 but further export was possible only to the Layer Definition File, which cannot be used for geospatial analyses. Moreover, a regular grid is needed for pixel based analyses of local morphometric variables (curvature in this study) to detect edge-delineating microtopography of shallow channels. Therefore, we created a DTM from the original dataset of EUROSENSE Ltd. consisting of points, and an output was a raster with regularly gridded data (Grid). The raster grid was elaborated using the z-coordinate of points. A basis for the creation of the grid model is equidistant regular sampling. Inverse Distance Weighting (IDW), kriging, and polynomial fitting are used for the interpolation of scattered points in each region [42]. As the authors [43] note, the IDW technique allowed the interpolation of points collected from differently oriented hedges and furrow structures with low errors compared with other methods. In this article, the IDW grid method supported with GDAL (GDAL is a translator library for raster and vector geospatial data) was used to compute a regular grid from the scattered points of the study area. We applied the nearest neighbour (NN) IDW search algorithm. It computes the inverse distance to a power gridding combined with the nearest neighbour method [44]. The following parameters were set up: weighting power—default value (2); smoothing (0); the radius of the search circle (25); maximum number of data points to use (50); minimum number of data points to use (5); no data marker to fill empty points (0). A grid was automatically generated with a size of 4.61 m/pixel. The grid was filtered using SAGA Simple Filter [45] and the following parameters were set up: filter method (1) sharpen; kernel search mode (1) circle; kernel radius in cells (2). The output was a DTM with sharpened terrain discontinuities.
Further, pixel based terrain analyses were processed in DTM raster derivates. Catchworks are water channels running mainly parallel to the contour lines (Figure 2c—I., II., III.), but not always (Figure 2c—IV., V.). The filtered DTM was processed using the SAGA module of Terrain Analysis—Morphometry [46], and profile curvature was computed using the second-degree polynomial function for the nine target parameters with the method of Zevenbergen and Thorne [47]. Curvature is a common tool used to identify landforms related to channelized and hill-slope processes in detail [21]. Profile curvature is parallel to slope and it is the second derivative of elevation with respect to distance along the line of maximum slope. Positive values indicate the increasing slope steepness in the downslope direction, leading to the acceleration of water flow, and negative values indicate convex surface and water flow is decelerated. Zero values mean that the slope is linear [48,49].
Edges of catchworks were assumed to be indicated in each grid cell as the maximum upwardly concave values of profile curvature at that cell. These grid cells were selected, applying the reclassification of raster to “maximum” and “other values” using the operation in a raster calculator:
(“raster@1” ≤ maximum value) × 1 + (“raster@1” ≥ maximum value) × 2
Then, threshold values were vectorized using GDAL raster conversion.
In our experiment, terrain discontinuities identified in the pixel based DTM and delimited with maximum values of the profile curvature were compared with break lines of TIN created in different software environments (Socet Set®) using the TIN method. Break lines were interpreted as buffer zones with a radius of 2.3 m to match the best pixels of threshold values of the profile curvature with a grid cell size of 4.61 m. The datasets comparison was based on GDAL supported raster analysis, using a zonal histogram. The zonal histogram was calculated for a vector layer created from original break lines used in TIN from EUROSENSE Ltd. and for polygons of maximum profile curvature. The datasets coincidence of the length of catchworks identified in the field within areas of break line buffer zones and within areas of maximum curvature was evaluated [m; %]. A close data match was expected, and the explanation of inconsistencies is provided in the discussion as well as recommendations for future investigation using more detailed DTMs.

2.3.2. Multitemporal Analyses of Catchworks in Orthomosaics Using Break Lines of a Digital Model

Considering the data uncertainty of DTMs and the impossibility of differing shallow channels from other edges (such as, for instance, frequent plot borders) in a DTM, catchworks were investigated in orthomosaic photos provided by EUROSENSE Ltd. Parameters charactering time-series datasets are in Table 1. We examined whether the green colour of vegetation and different green colour hues within buffer zones of possible catchworks might indicate humid areas with vital herbaceous vegetation. To examine the possible presence of catchworks according to the vegetation green colour hues in orthomosaics, we searched for colour indicators of shallow channels in several orthomosaics time-series from 2002 to 2018. For this purpose, minimum and maximum thresholds of RGB bands (Table 1) were adjusted to unified scheme R (95–140)—G (60–150)—B (60–170). Parameters were adjusted experimentally to obtain the best contrast between dried (higher yellow colour hues) and vital wet vegetation (higher green colour hues).

2.3.3. Validation of Catchworks Using the Normalized Green-Red Difference Index and Delineation

Green vegetation reflects more energy in the near infrared band than dry or unhealthy plants. While the near infrared aerial images are not freely publicly accessible in Slovakia, we applied the Normalized Green-Red Difference Index (NGRDI) for the identification of catchworks. The NGRDI approximates biomass and nitrogen status [50,51]. RGB image-based vegetation indices were applied to predict dry matter forage yield in grasslands [52]. In case of catchworks, we expected that herbaceous vegetation in catchworks with higher humidity of the soils would exhibit higher values of NGRDI than surrounding areas. The NGRDI was obtained from a true colour image by calculating the reflectance of the green and red zone of the electromagnetic spectrum [53].
The NGRDI was calculated using Semi-automatic Classification Plugin (SCP) v7.2.0 for QGIS. Classification was performed in the latest orthomosaic photos from 2018. During pre-processing, original RGB bands (not adjusted) of raster were split to obtain a single band list of the R, G and B rasters. The calculation of NGRDI in the raster band calculator of SCP was performed from the red digital number (DN) and green DN using the following formula [54]:
NGRDI = (Green25−234 DN − Red28−236 DN)/(Green25−234 DN + Red28−236 DN)
The NGRDI may range from −1.0 to 1.0, but it more often varies at closer ranges to zero [51]. For the NGRDI raster output, pseudocolour scheme for the Normalized Difference Vegetation Index available under the GNU General Public License (NDVI GPL) (2009) was chosen. This colour scheme allows us to highlight contrast between the higher biomass of vital herbaceous vegetation on the humid soils and dry vegetation, substrate and built-up areas.
A classified raster of the NGRDI was a supplementary output and it was superposed with the buffer zones of break lines, indicating the potential occurrence of catchworks in terrain. Orthomosaic with adjusted RGB colour ramp was used as an underlying ground dataset under both of these outputs. Potential catchworks were manually delineated—vectorized primarily inside the buffers of break lines created by EUROSENSE Ltd. (2017). In case of data mismatch between break lines and indicators of catchworks in orthomosaics and the NGRDI values, they were preferably delineated according to the status of vegetation regarding the spatial inaccuracy of break lines. Finally, the length of real and potential catchworks was evaluated to demonstrate the method effectiveness. The delineation of potential catchworks in a GIS laboratory can save time spent in the field and finally decrease survey costs.

2.3.4. Evaluation of Real and Potential Catchworks in Land Use Categories

Concerning the real catchworks mapped in the field and the potential ones, we tried to prove the statement that they were also primarily constructed for the irrigation of meadows [12,14,15,16] and pastures [11] in this locality in Slovakia.
Firstly, the relative area of the ZBGIS land use categories inside plots (with catchworks) registered by the national Cadastre of Real Estate [31] was calculated (%), and the relative length of catchworks (%) was calculated in these plots. Secondly, the relative area of historical land use categories of historical maps (1952–1957) [38] inside plots was evaluated and the relative length of catchworks (%) was calculated within these historical land use categories.
In the last step, land use changes over the last 70 years were interpreted in the historical orthomosaic photos (1950–2010–2018) [39]. We selected the locality where land use changes were markedly visible on plots with catchworks.

3. Results

3.1. Detection of Catchworks in a Digital Model

Maximum profile curvature is parallel to the slope and captures the position of catchworks on slopes with high certainty. After superposing the maximum profile curvature with buffer zones of break lines created by EUROSESNE Ltd. 2017, we observed that this digital model (4.61 m/px) does not have sufficient grid resolution to allow the detection of all catchworks. Figure S1a shows the data coincidence between catchworks mapped in the field and the buffer zones of break lines. In total, 1939.12 m of catchworks were identified in the field within the study locality, while 1289.86 m were present in the buffer zones of break lines (66.52%). In some localities, the data coincidence was markedly visible when the terrain edges of plot borders were superposed with the buffer zones of break lines and areas of maximum profile curvature (Figure S1a,b), but this relation was not evaluated with zonal statistics because we focused on catchworks. Figure S1c presents the data match between the areas of maximum profile curvature and break lines exhibiting 69.60% (7587 px from a total sum of 10,560 px). The data match is promising. We assume that in the case of a more detailed DTM (minimally 1–4 m/px), we could apply maximum profile curvature for catchworks detection in the DTM, and this methodical procedure might be adopted for further research.

3.2. Multitemporal Analysis of Catchworks Using Orthomosaics and Terrain Data of Break Lines

In further investigation of catchworks, orthomosaic photo time series were superposed with the buffer zones of break lines. The break lines were created by EUROSENSE Ltd. 2017 according to real terrain discontinuities (edges, channels, roads, etc.), which were visible in the three-dimensional environment in the orthomosaic photos. However, we considered the possibility of spatial inaccuracies. Figure S2 demonstrates the changes in land use in the buffer zones of break lines over 16 years (2002–2018). The orthomosaic from 2018 was chosen to be a ground dataset used for the catchworks identification and for further analyses. Catchworks mapped in the field predominantly appeared on grasslands (meadows and pastures). Thus, we also expected the occurrence of potential catchworks in grasslands. The orthomosaic had sufficient resolution (20 m/px) to identify the linear darker green coloured herbaceous vegetation of catchworks, which was not very visible in older orthomosaics. In comparison to the orthomosaic photo from 2015 with the same spatial resolution, the linear darker green coloured herbaceous vegetation was less represented in 2015 probably due to lower soil humidity. Therefore, the contrast of green colour hues was not sufficient.
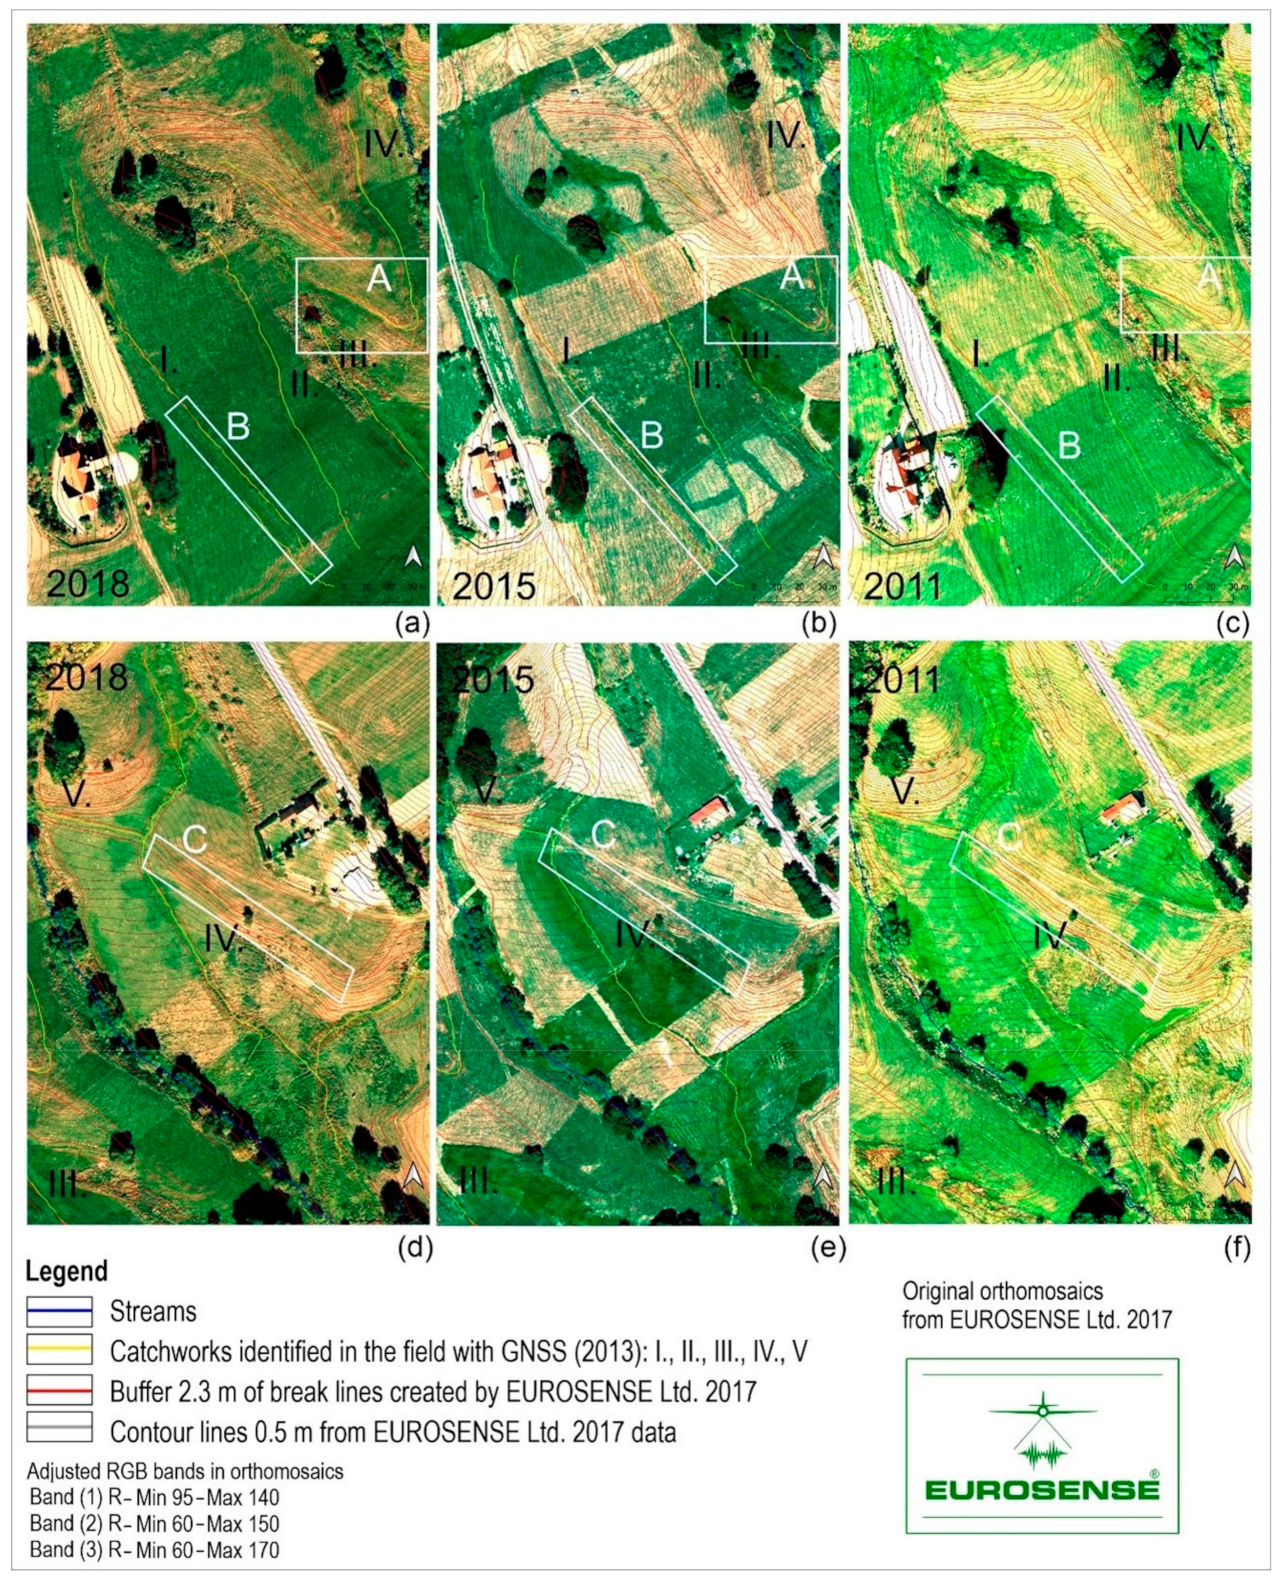
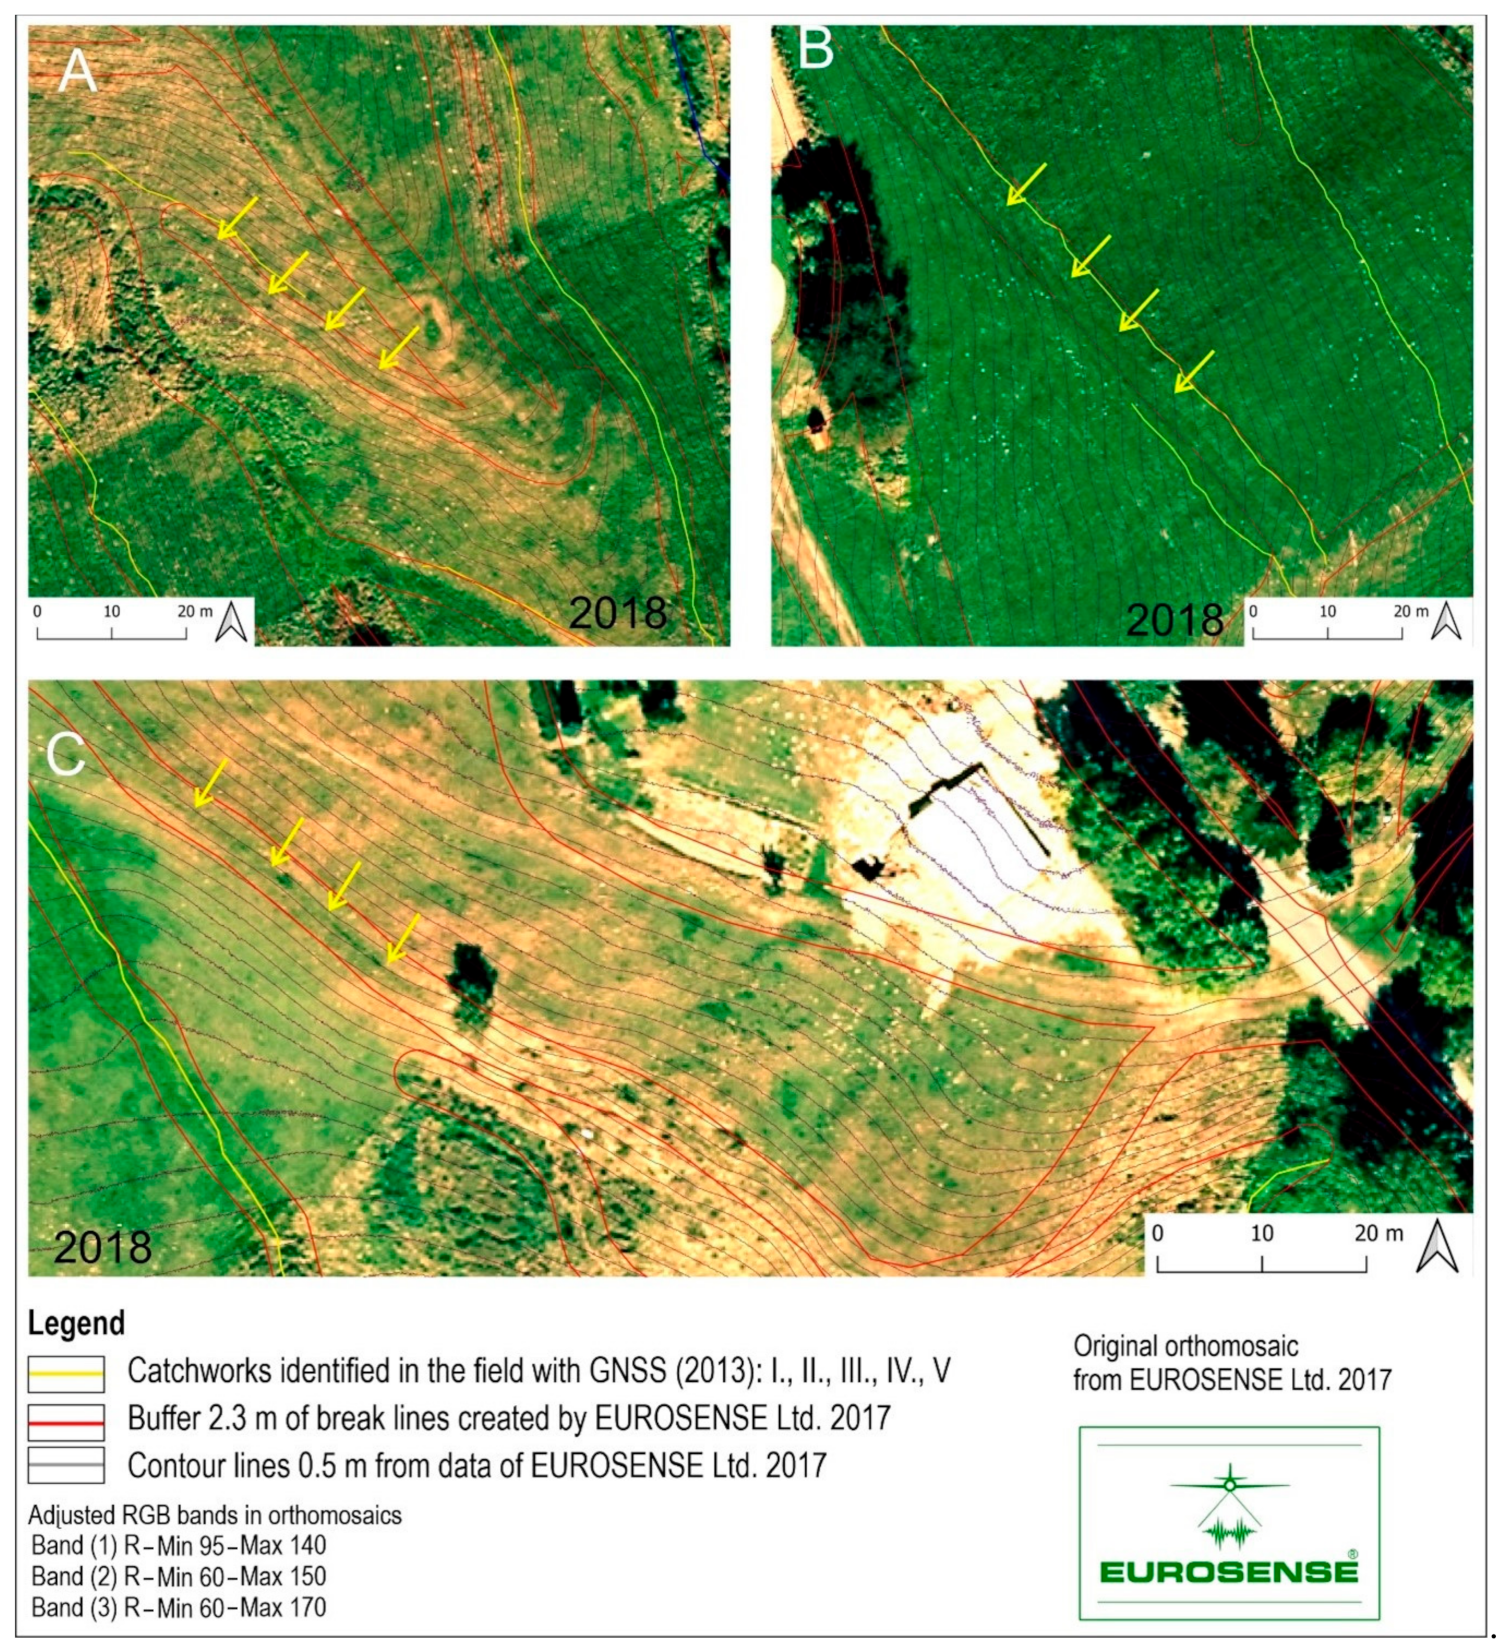
Figure 3 and Figure 4 show in detail three orthomosaic categories (A, B, C) indicating catchworks. These can be identified according to their colour and the level of green colour hue of the vegetation. The categories were further used to delineate potential catchworks. Category A represents a well visible green belt of darker green herbaceous vegetation inside an area of drier yellow coloured vegetation oriented in the direction of the contour lines. Category B represents a linear form of darker green coloured herbaceous vegetation located inside lighter green coloured vegetation. We can distinguish both green hues according to the presence of the linear darker green vegetation structure. Both categories were spatially located inside the buffer zones of break lines and alongside the catchworks mapped in the field. Category C represents a non-compact linear form of herbaceous vegetation (appears like dispersed dots) located inside the buffer zones of break lines. This category was not identified in the field due to the weak presence of wet vital vegetation. Combining the orthomosaic photos and microtopography represented by break lines, we were able to also identify the catchworks which were not captured during the last field survey in 2013.
The categories in Figure 4A–C were applied in a further step to validate and delineate catchworks.

3.3. Validation of Catchworks Using the Normalized Green-Red Difference Index (NGRDI) and Delineation of Potential Catchworks

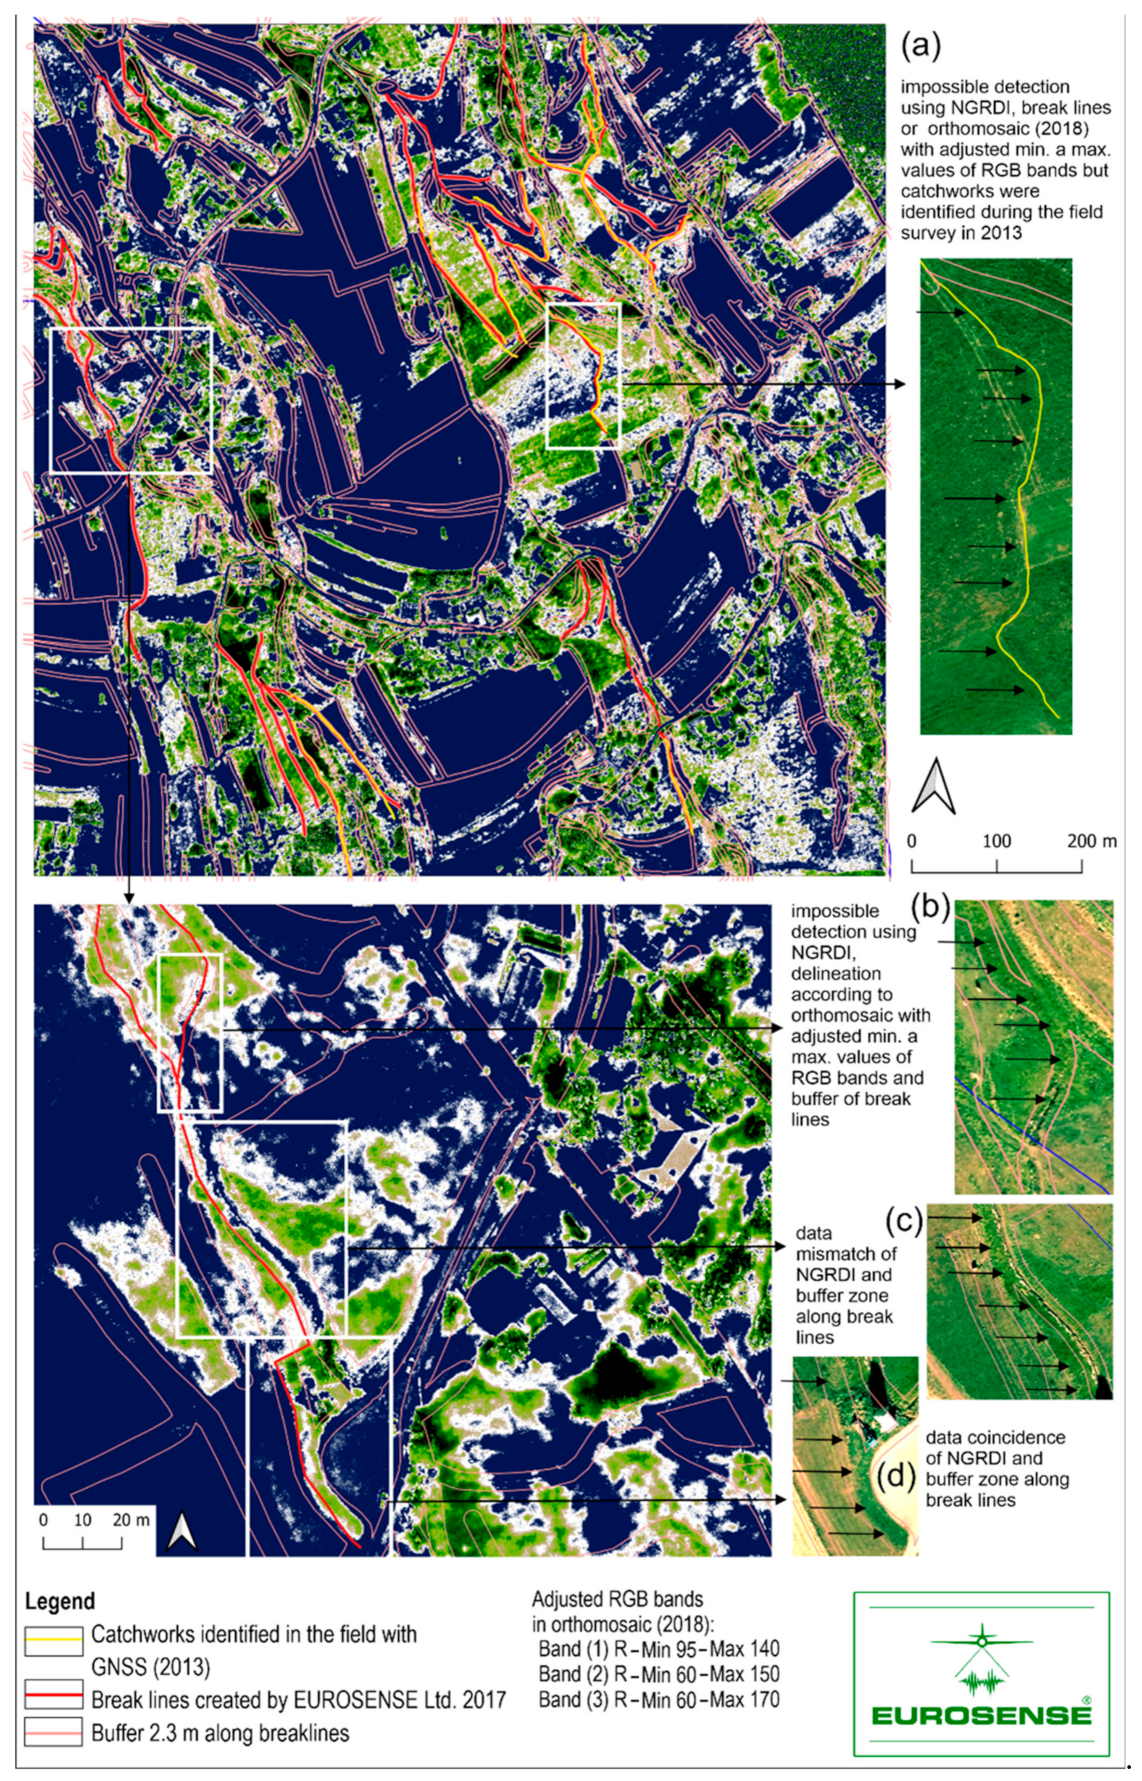
The NGRDI index is helpful in case the contrast of darker green coloured vegetation compared to the surrounding green areas is weak in orthomosaic photos or the wet vegetation inside catchworks has a discontinuous character. The more humid the vegetation is, the more biomass is produced. The vegetation has darker green colour hues and the NGRDI exhibits higher values (Figure 5).
During manual delineation–vectorization of catchworks, four situations appeared: Figure 5a: the identification of catchworks was impossible using adjusted orthomosaics, the NGRDI or buffer zones of break lines. The existence of these catchworks was proved only during the last field survey. Figure 5b: the most effective role played by the buffer zones of break lines was to delineate catchworks in a situation where the contrast of green colour hues in the adjusted orthomosaic was not sufficient and no higher biomass was indicated by the NGRDI. Figure 5c: catchworks were indicated in the adjusted orthomosaics and by the NGRDI, but their position was outside of the buffer zones of break lines. This situation indicated the spatial inaccuracy of the break lines. Figure 5d: full data coincidence was observed—catchworks were found inside the buffer zones of break lines, they corresponded with high values of the NGRDI and they were also highly visible in the adjusted orthomosaic. The last situation is the most ideal, but it only corresponded with the shorter length of catchworks.
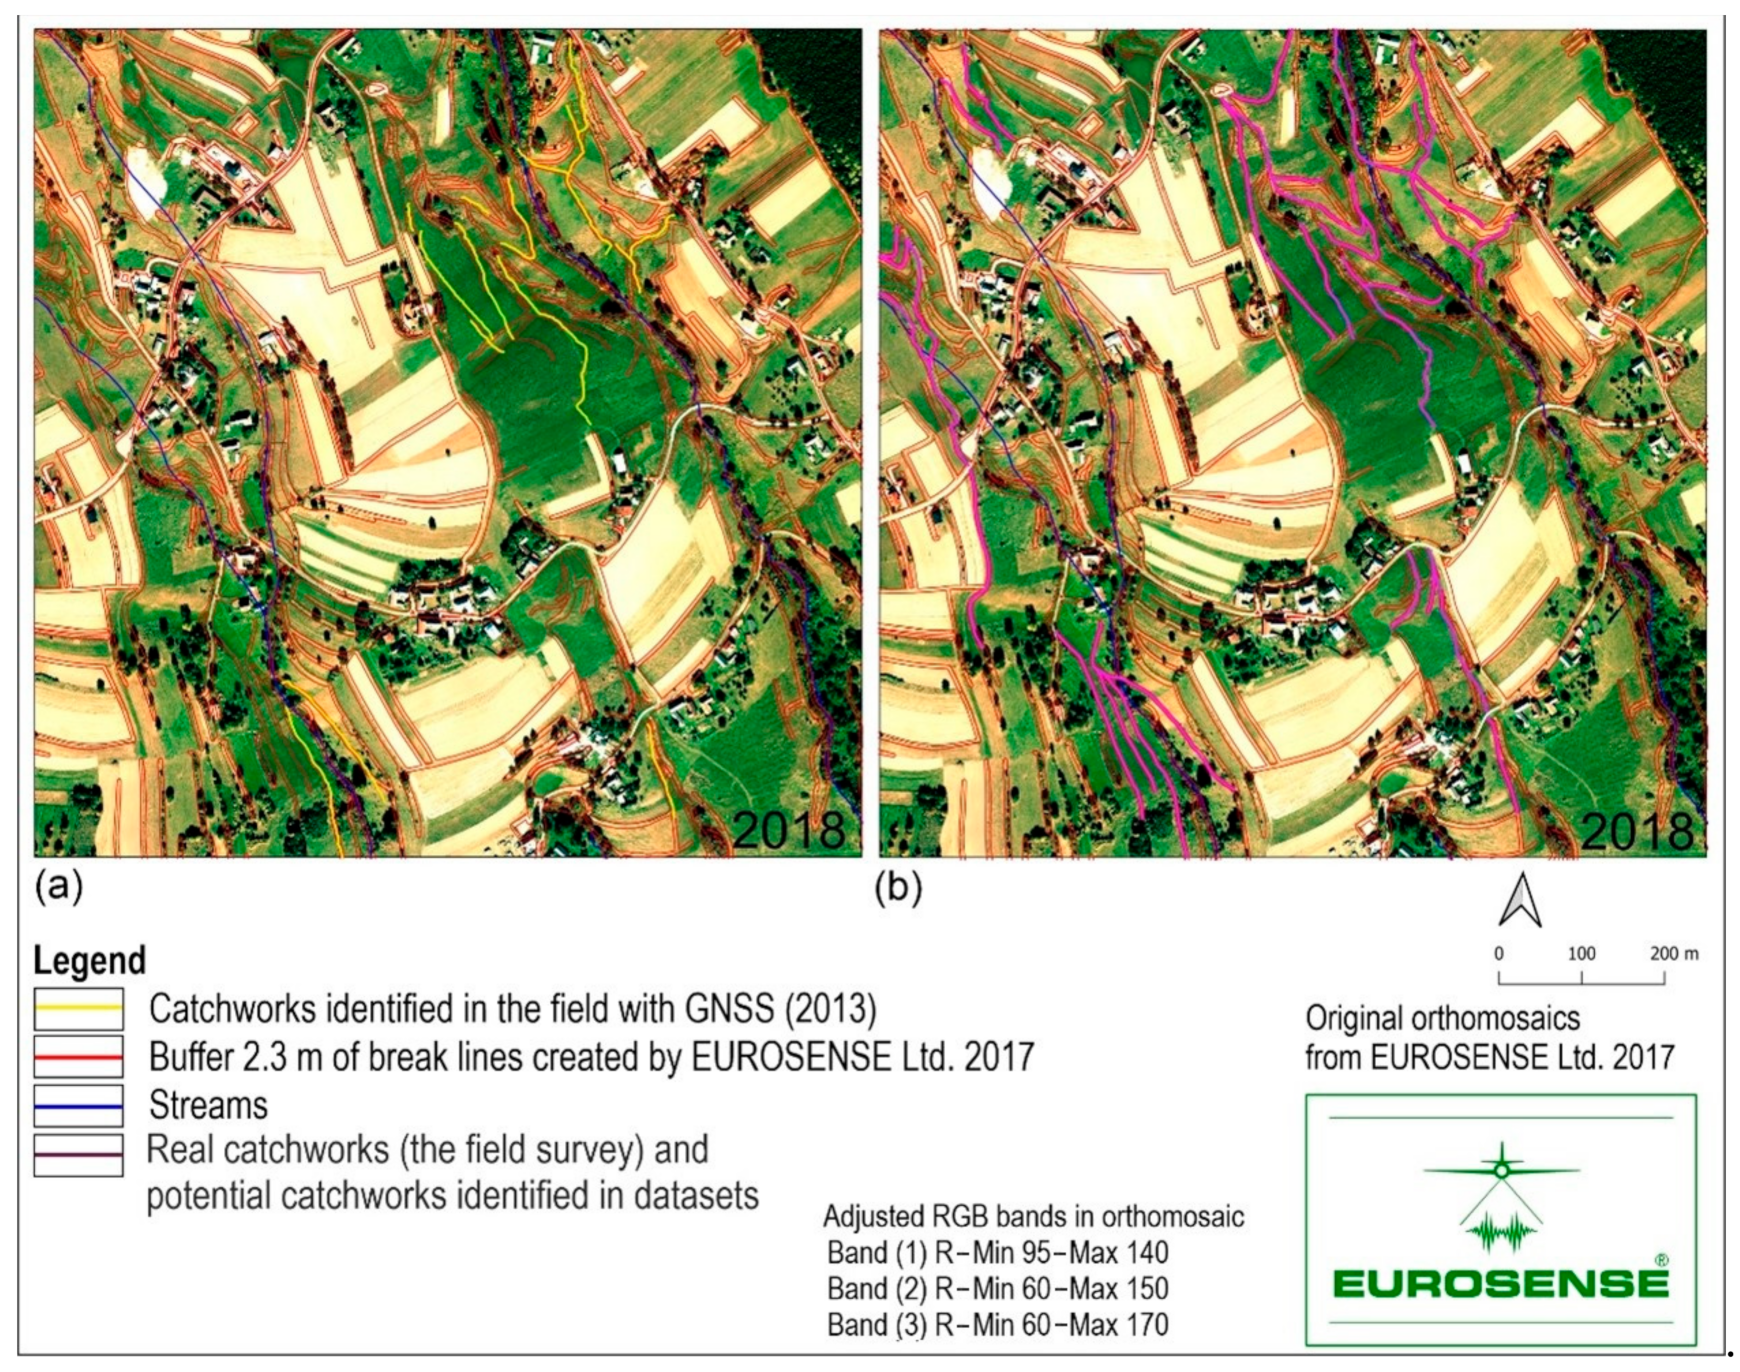
The length of catchworks mapped in the field (1939.12 m) (Figure 6a) increased to 4816.30 m (Figure 6b) (2877.18 m; 59.74%) by the manual delineation of potential catchworks. These catchworks were identified only using terrain and land use geospatial data and need to be confirmed in the field. A map of potential catchworks will be applied in future field research to complement a network of catchworks mapped in 2013.

3.4. Evaluation of Catchworks in Land Use Categories

Real catchworks (mapped in 2013) had a length of 1939.12 m in the study area. Concerning the land use, they were observed on plots registered at the Cadastre of Real Estate (2019) as “meadows and pastures permanently covered with grass or land temporarily not used for permanent grasslands” and “land with a civil engineering object (road)”. Further, taking into consideration the ZBGIS classification of land use (it characterizes the land use of plots in more detail in comparison to the Cadastre of Real Estate), catchworks were found on meadows and land with a civil engineering object (road), covering 68.24% of the total area and including 69.84% of the total length of catchworks. Further, they were frequently present in ZBGIS land use categories of grasslands and shrubs covering 23.24% of the total area and with the total length of catchworks 24.84% (Table 3, Figure 7). Nearly one third of catchworks (28.24%) were identified in ZBGIS categories as “meadows/grassland” and “grassland and shrubs” (27.82%). The category “grassland and shrubs” is not actively used as mowed meadows or pastures and differs from the category of “meadows”, where active land use management is present.
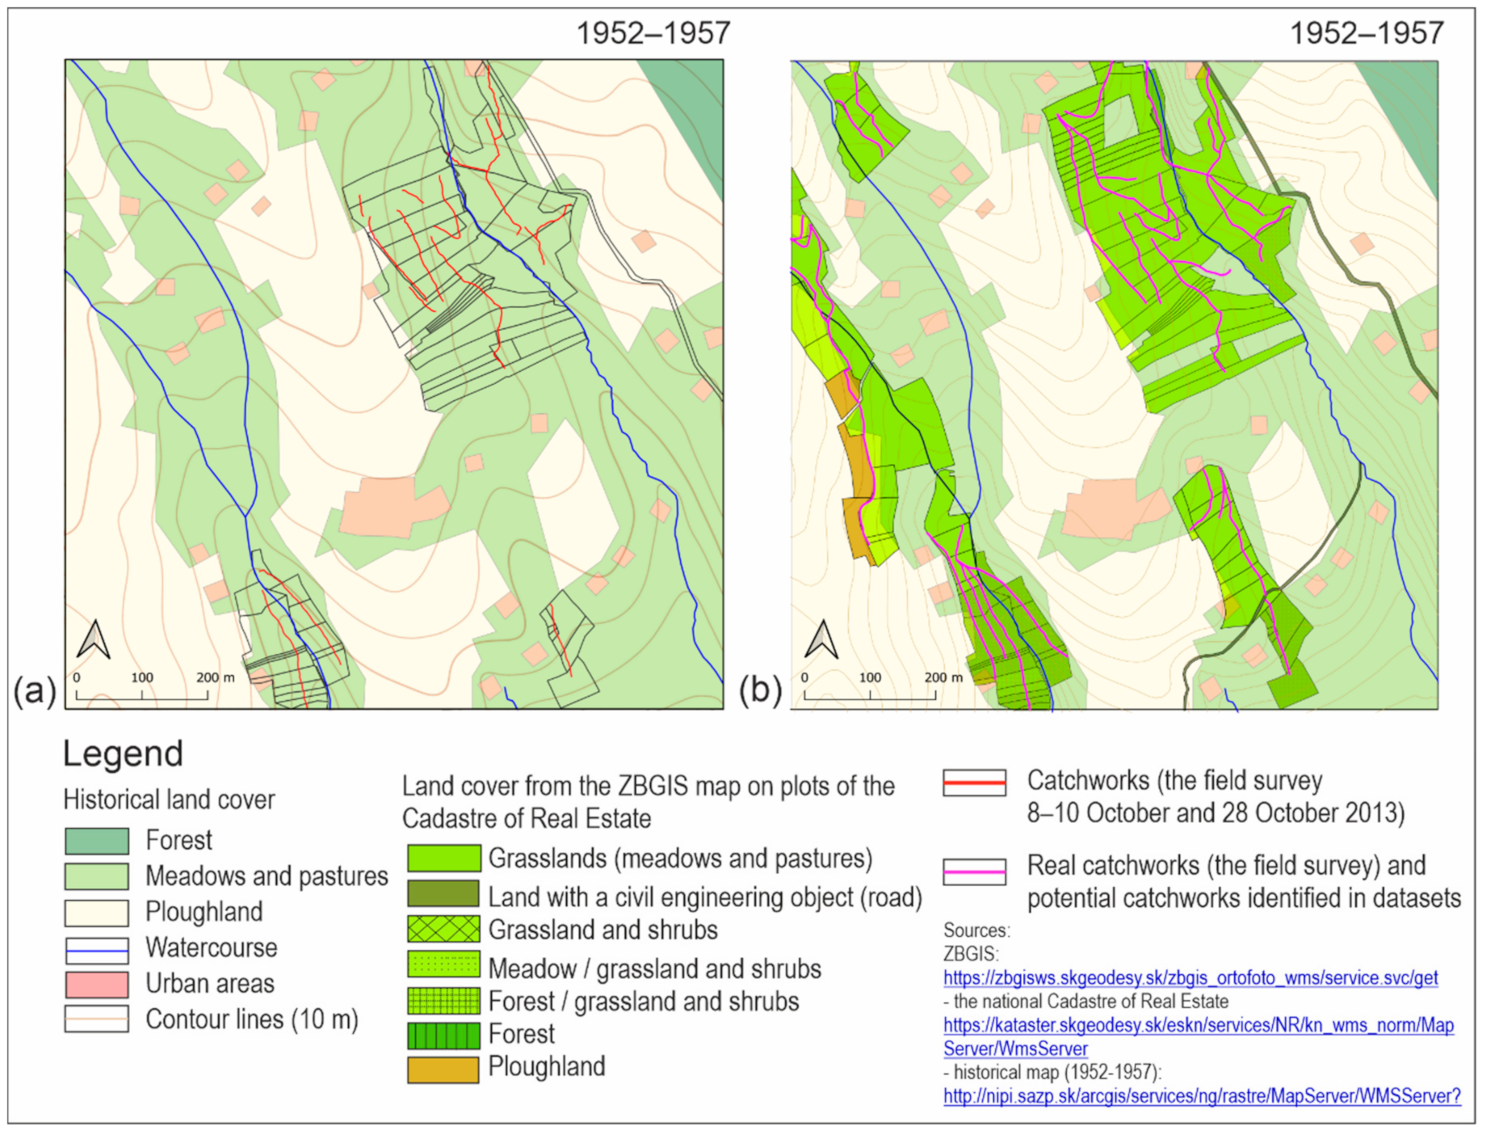
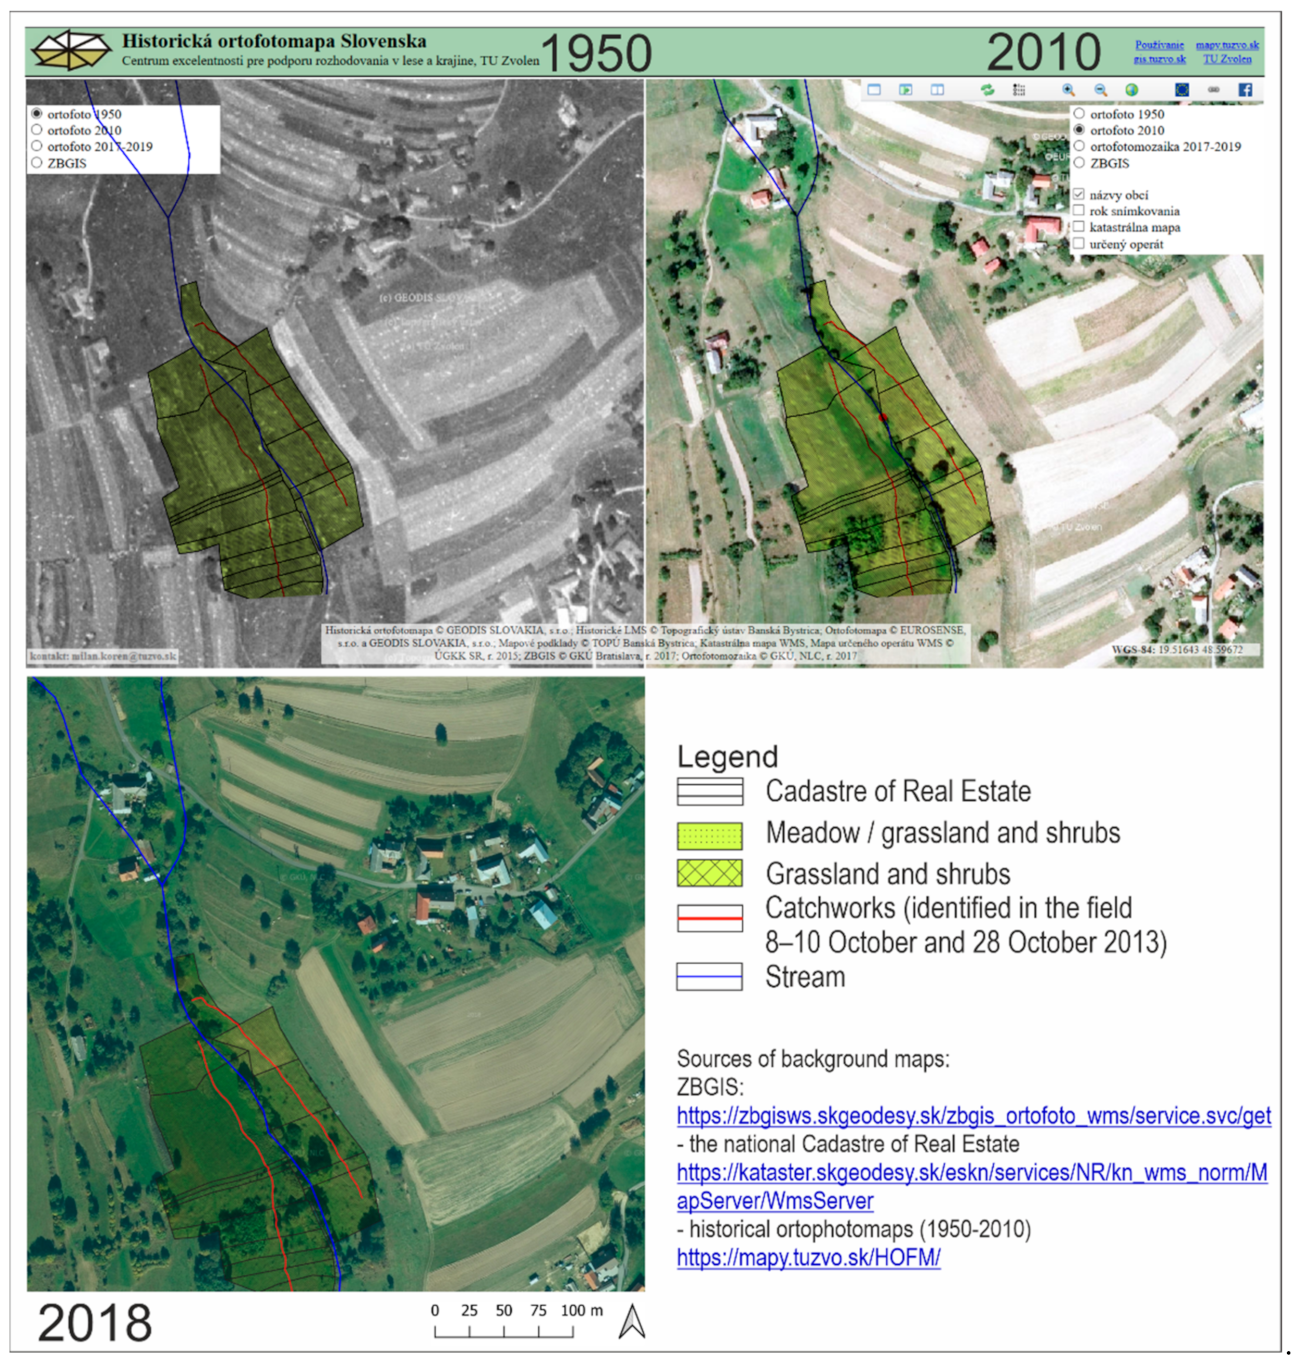
Figure 7 demonstrates that the plots with catchworks (1952–1957) were historically used as meadows and pastures. Three years (1950, 2010 and 2018) document progressive successive processes on the plots with catchworks in the southern part of the study area (Figure 8).
The comparison of historical land use showed that potential catchworks were mainly located in the same land use category of historical meadows and pastures (2811.16 m; 97.71%; 2018) as real catchworks identified in the field (1893.74 m; 97.66%; 2013) (Figure 7). The very short length of the potential catchworks was found in ploughland and land with a civil engineering object (road) (66.02 m). Potential catchworks occupied mainly historical meadows and pastures (1952–1957), as we documented in Figure 7. The total length of all catchworks (real and potential) occupying historical meadows and pastures (1952–1957) was 4430.31 m (91.99%), while ploughland (368.48 m) and built-up areas (1.19 m) exhibited much lower coverage.
According to the orthomosaic time series covering 16 years (Figure S2), it is not possible to interpret whether agricultural plots with catchworks were meadows or pastures because the land use of the same plot varies markedly over the study period. Based on the research results, we can clearly conclude that catchworks were predominantly used for the irrigation of the Cadastre of Real Estate land use category “meadows and pastures permanently covered with grass or land temporarily not used for permanent grasslands”.

4. Discussion and Conclusions

This article brought a methodical approach to the identification of catchworks, using geospatial data and GIS tools to make the field survey more effective and addressed to areas with the occurrence of potential catchworks, which can be preliminary delineated in the GIS laboratory. The catchworks survey was limited by the accessible data. We only used common GIS technologies which can be independently applied without the assistance of GIS experts, drone pilots or other aircraft vehicles. However, we are aware of its weak points which could be improved.
The methodology applied in the survey is transferable to other study areas and is applicable to common landscape-ecological surveys. For instance, the research popularity of a water supply system of water reservoirs in the historical mining area of Banská Štiavnica is increasing (Banská Štiavnica is inscribed in the UNESCO World Heritage List) [55]. The water supply system was designed to bring water from mountain slopes to the artificial lakes called “tajchy”, and water from the reservoirs powered industrial machines or machines pumping the water from mines. Now, irrigation channels require reconstruction, and the proposed method might be applied for their identification in terrain.

4.1. Application of Digital Terrain Models in Catchworks Detection

Published scientific works on traditional irrigation systems usually focus on their history [6,7,8,9,10,11,12,14,15,18] or soil attributes affected by irrigation. For instance, increases in the soil temperature due to catchworks irrigation were addressed in past research [5,7,8]. A little less attention was given to the identification of catchworks as micro-scale landforms. We focused on narrow and shallow channels (depth of 0.1–0.5 m; width of 0.5–1 m) located predominantly on mountain slopes, but also locally in terrain depressions of shallow valleys. The detection of microtopographic features using DTMs requires precise and detailed models [23]. Here, the fusion of data acquired with different technologies plays a key role. On the other hand, data acquisition and the processing of these precise DTMs require geodetic experts, and this is time consuming and sometimes expensive [56]. Catchworks in this work were studied in open areas of grasslands. In case we would continue mapping in shrubs or under the forest canopy, then data are expected to be acquired with terrestrial remote sensing devices equipped with an inertial measurement unit using the technology of Simultaneous Localization and Mapping (SLAM). These technologies allow measurement with a centimetre accuracy and the collection of very dense point clouds [57].
However, the research of catchworks was limited by the availability of precise and detailed terrain data. For the detection of catchworks, as microtopographic features we used terrain data purchased from EUROSENSE Ltd. 2017. Break lines created by the company allowed us to identify the potential zones of the catchworks’ occurrence in terrain. We also performed an experiment with a point field adopted from TIN created by EUROSENSE Ltd. 2017 to construct a pixel based DTM. According to the experimental work of [58], interpolation algorithms applied for regular grid generation have a relatively similar performance in terms of overall DTM accuracy. We applied the IDW NN method to generate the regular grid. The sampling density of points used in the grid creation was relatively low (0.014 points/m2). In this case, the interpolation technique has high impact due to large spaces amongst known values [43]. The point field (0.014 points/m2) and pixel size of the grid (4.61 m/px) were not sufficient to detect the microtopography of catchworks. Based on recent experiments and a survey of natural microtopography, Tarolli [59] recommended a grid cell size smaller than 1 m.
Profile curvature is a useful tool to identify terrain discontinuities on slopes and other incised landform elements [60], which might indicate the presence of catchworks. In this research, due to limiting data density, the data coincidence between maximum profile curvature and catchworks identified in the field exhibited 66.52%, and between catchworks and break lines created with EUROSENS Ltd. 2017 it was 69.60%. In both cases, the maximum profile curvature and break lines characterizing microtopography were not applicable to capture the network of shallow and narrow channels. Further, it was impossible to distinguish channels from the linear edges of plot boundaries, which are so typical for this area (Figure S1b). Therefore, the identification of catchworks required additional datasets entering into the process of detection using geospatial data. Nevertheless, as shown by the locality C in Figure 3 and Figure 4, the break lines helped to identify catchworks which were not localized during the field survey in 2013 because green or hydrophilic herbaceous vegetation was not observed in the field.
We can conclude that future field surveys would be more effective in case the catchworks’ position is known and, primarily, localities with their potential occurrence would be visited in the field. This is especially important in the study area, where almost all private plots are bounded by fences, and there is a similar situation in other traditionally cultivated agricultural landscapes in Slovakia.

4.2. Identification of Catchworks in Orthomosaic Photos and Using Vegetation Indices

Currently, RGB and near-infrared (NIR) orthomosaic photos are used in the semi-automatic and automatic classification of land cover, implementing different machine learning approaches. For instance, land use classes use to be extracted using algorithms of Random forests [61], Support Vector Machine-learning Algorithms [62], Convolutional Neural Networks [63], and others. Applying machine learning techniques is effective for big data processing. The semi-automatic classification of microtopography in relation to land use and vegetation indices is not a frequent research topic, especially in relation to shallow irrigation channels. Nevertheless, some studies exist. This approach was used to detect shallow paleochannels and to create a paleohydrological map [64]. Regarding the microtopography of natural landforms, Mondini et al. [65] applied this approach to identify small and shallow landslides from optical satellite images. The study area presented in this article had a size of 1 km2 and the main objective was the identification of catchworks using geospatial data and the evaluation of catchworks in land use categories. Therefore, none of the novel machine learning techniques were applied in this research. Nevertheless, this method or updated method might be applied in any algorithm to delineate catchworks semi-automatically in a future study.
We applied true-colour RGB orthomosaic photos because these were accessible free of charge. The adjusted RGB bands allowed us to distinguish green as vital vegetation on humid soils, and yellow-green and yellow colours as dried vegetation. Catchworks on humid soils corresponded with lines of vital darker green vegetation, and they were highly visible in orthomosaics with adjusted thresholds of RGB bands.
The validation of vital green vegetation was performed through the NGRDI. The NGRDI highly positively correlates with biomass amount [66]. The index markedly differentiated vegetation of higher biomass from dried predominantly herbaceous vegetation and other surfaces in the NGRDI raster (Figure 5). Lines of vital darker green and green herbaceous vegetation inside the buffer zones of break lines surrounded with lighter green, blue or white coloured areas were considered to be potential catchworks. In case of insufficient colour contrast, the buffer zones of break lines determined the area of potential catchworks. Further, within these areas the presence of catchworks was confirmed or refuted using the underlying RGB adjusted orthomosaics. Orthomosaics and the NGRDI also helped to detect these potential catchworks which were not identified inside the buffer zones of break lines, but alongside buffers where the presence of vital darker green vegetation was markedly visible (Figure 5C). The reason was the positional inaccuracy of the break lines. Only a very short length of the catchworks, which were localized in terrain during the field mapping in 2013 (Figure 5A), was hardly visible in the orthomosaic. They were not interpreted by the NGRDI due to their low contrast and no break lines were present in the terrain model. Therefore, we stated that such catchworks can only be localized in the field.
The NGRDI is not the most suitable vegetation index to differ between vital green and dried herbaceous vegetation. The numerical difference between the green and red bands exhibits lower values compared with the numerical difference of NIR and red bands [51]. On the other hand, we note that the employment of vegetation indices into catchworks’ identification works effectively only when the humidity of soils inside catchworks is higher than in surrounding areas. Dry catchworks were also present in the study area. Therefore, further experimental investigation requires the application of charged NIR orthomosaics and results might be compared with RBG ones (free of charge).

4.3. Delineation of Catchworks and Implementation in Sustainable Land Use Planning

GIS has countless applications in landscape assessment. GIS tools help to investigate interrelations and compare phenomena among different landscape units and transform scientific experimentally based knowledge to the landscape planning documentations [67]. The delineation of catchworks was performed manually and we did not apply any semi-automatic classifications. The main reason for this was that this is a pilot study area in Slovakia and the methodology for the detection of these shallow and narrow irrigation channels also occurs rarely in foreign studies [22,24,25,64,65]. From this point of view, the presented approach can be updated or modified and used in similar studies to confirm the correctness of individual steps of the methodological procedure. Consequently, methodical steps might be applied in any known algorithms of machine learning using SAGA GIS. The combination of topographic features and vegetation indices in machine learning algorithms is a common method in studies where both terrain and land cover parameters are required [68]. Both natural and land cover factors enter into semi-automatic data processing, employing fuzzy algebraic functions as it is obvious, for instance, in case of the assessment of landslide vulnerability [69].
We observed and confirmed findings from previous studies that catchworks occur predominantly in grasslands, concerning actively used meadows and pastures and grasslands overgrown with woody vegetation as well. Despite the fact that we analysed catchworks in orthomosaics in the time sequence of 16 years and we had historical data about the plot land use of the 1950s, we were not able to define whether catchworks were constructed primarily on meadows or pastures. Figure S2 demonstrates the changes of land use over 16 years (2002, 2006, 2009, 2011, 2015, 2018), and in the orthomosaics it is visible that the plot land use varied over time (pastures, meadows and local ploughland). The predominant land use officially registered in the Cadastre of Real Estate is “meadows and pastures permanently covered with grass or land temporarily not used for permanent grasslands”, without specification of whether a plot is managed as a meadow or pasture. Regarding the historical data, we assume that both these kinds of land uses were present in the areas irrigated with catchworks.
Leibundgut and Kohn part II [10] ironically paraphrased a statement of Evard (2005) [70] and noted that traditional irrigation systems vanished due to the same reason as they were established—higher productivity of an agricultural system. Farmland abandonment is related to the decline of livestock breeding. Irrigated grasslands were directly and indirectly related to animal fodder production. We observed changes (1950, 2010 and 2018) in extensively used grasslands (in the southern part of the study area, Figure 8). Over the last 70 years, these plots have become overgrown with woody vegetation. This phenomenon is present in almost all regions with traditional land use in Slovakia [71,72], and also in Mediterranean landscapes with deeply rooted agricultural traditions [30].
The study area belongs to the cadastral district of Hriňová, which suffers from population decline and land use extensification. Fortunately, some residents are aware of the values of this traditional landscape with scattered settlements [13]. Locally, catchworks are functional, but like all technical constructions, they require regular maintenance. They are hardly visible in the country. Therefore, the proposed methodology might be helpful for future field surveys, which might be particularly addressed to certain localities where potential catchworks were identified using terrain and land use geospatial data.
Nowadays, water meadows are bearers of natural heritage, deserving subsidies for maintenance from European programs [73]. Semi-natural agricultural land corresponds with high biodiversity of habitat specialists and species, indicating areas of high conservation value [74]. The functional irrigation network has many positive ecological effects on agricultural landscape, as demonstrated Kozelová et al. [75] in the case study of artificial ditches in Slovakian lowlands, or Slámová et al. [13] in the case study of Hriňová. The occurrence of biotopes of European significance (lowland hay meadows (Natura 2000 code: 6510) and hydrophilous tall herb fringe communities of plains and montane to alpine levels (Natura 2000 code: 6430) and biotopes of national significance (mesotrophic grazed pastures and meadows and waterlogged mountain meadows) corresponded with catchworks’ occurrence [13]. Nevertheless, in both cases of artificial water supply systems in agricultural land, we can conclude that they perform a water retention function. Irrigation systems evidently influence local and regional climate, interacting with global climate changes [76]. Therefore, since irrigation systems are the elements of long-term sustainable historical land use, then finance subsidies might be provided to residents to maintain them and make them functional in the landscape.

Supplementary Materials

The following are available online at https://www.mdpi.com/2071-1050/13/3/1107/s1. Table S1: Corine Land Cover 2018 categories and High Nature Value Farmland in the cadastral district of Hriňová. Figure S1abc: Experimental analysis of catchworks lengths in the buffer zones of break lines created from EUROSENSE Ltd. data (a) and in areas of maximum profile curvature (b) and data coincidence between buffer zones of break lines and areas of maximum profile curvature (c). Figure S2: Changes in different land use of plots in orthomosaics for 16 years. Break lines created by EUROSENSE Ltd. 2017 and catchworks identified in the field (2013).

Author Contributions

Conceptualization, M.S. and J.H.; methodology, M.S.; software, M.S.; validation, H.G.; formal analysis, F.P.; investigation, M.S.; resources, J.H.; data curation, M.S.; writing—original draft preparation, M.S.; writing—review and editing, H.G.; visualization, M.S.; supervision, F.P.; project administration, J.H.; funding acquisition, F.P. All authors have read and agreed to the published version of the manuscript.

Funding

This publication is the result of the project implementation: “Scientific support of climate change adaptation in agriculture and mitigation of soil degradation ” (ITMS2014+ 313011W580) supported by the Integrated Infrastructure Operational Programme funded by the ERDF.

Institutional Review Board Statement

Not applicable.

Informed Consent Statement

Not applicable.

Data Availability Statement

Data used in this contribution are from public resources cited in the article. Terrain data were purchased from EUROSENSE Ltd. 2017, Bratislava, Slovakia and orthomosaic photos were provided by EUROSENSE Ltd. 2017, Bratislava, Slovakia.

Conflicts of Interest

The authors declare no conflict of interest. The funders had no role in the design of the study; in the collection, analyses, or interpretation of data; in the writing of the manuscript, or in the decision to publish the results.

References

  1. Hreško, J.; Petrovič, F.; Mišovičová, R. Mountain Landscape Archetypes of the Western Carpathians (Slovakia). Biodivers. Conserv. 2015, 24, 3269–3283. [Google Scholar] [CrossRef]
  2. Spulerova, J.; Dobrovodska., M.; Stefunkova., D. Driving Forces. Threats and Trends Relating to Mosaics in Agricultural Landscape in Slovakia. J. Landsc. Ecol. 2010, 3, 59–72. [Google Scholar] [CrossRef] [Green Version]
  3. Renes, H.; Centeri, C.; Eiter, S.; Gaillard, B.; Kruse, A.; Kučera, Z.; Puschman, O.; Roth, M.; Slámová, M. Water Meadows as European Agricultural Heritage. In Adaptive Strategies for Water Heritage; Hein, C., Ed.; Springer International Publishing: Cham, Switzerland, 2020; pp. 107–131. [Google Scholar] [CrossRef] [Green Version]
  4. Miklós, L.; Špinerová, A.; Belčáková, I.; Offertálerová, M.; Miklósová, V. Ecosystem Services: The Landscape-Ecological Base and Examples. Sustainability 2020, 12, 10167. [Google Scholar] [CrossRef]
  5. Williamson, T. Fodder Crops and the ‘Agricultural Revolution’ in England, 1700–1850. Environ. Archaeol. 1998, 1, 11–18. [Google Scholar] [CrossRef]
  6. Martins, S.W.; Williamson, T. Floated Water-Meadows in Norfolk: A Misplaced Innovation. Agric. Hist. Rev. 1994, 42, 20–37. [Google Scholar] [CrossRef]
  7. Cook, H.; Sterne, K.; Williamson, T. The Origins of Water Meadows in England. Agric. Hist. Rev. 2003, 51, 155–162. [Google Scholar] [CrossRef]
  8. Sterne, K.; Cook, H. Water Meadow Management in Wessex: Dynamics of Change from 1800 to the Present Day. Landsc. Res. 2015, 40, 377–395. [Google Scholar] [CrossRef]
  9. Leibundgut, C.; Kohn, I. European Traditional Irrigation in Transition Part I: Irrigation in Times Past—A Historic Land Use Practice Across Europe. Irrig. Drain. 2014, 63, 273–293. [Google Scholar] [CrossRef]
  10. Leibundgut, C.; Kohn, I. European Traditional Irrigation in Transition Part II: Traditional Irrigation in Our Time—Decline. Rediscovery and Restoration Perspectives. Irrig. Drain. 2014, 63, 294–314. [Google Scholar] [CrossRef]
  11. Kerridge, E. The Sheepfold in Wiltshire and the Floating of the Water Meadows. Econ. Hist. Rev. 1954, 6, 282–289. [Google Scholar] [CrossRef]
  12. Vasari, Y. The Ecological Background of the Livelihood of Peasants in Kuusamo (NE Finland) during the Period 1670–1970. In The Silent COUNTDOWN; Brimblecombe, P., Pfister, C., Eds.; Springer: Berlin/Heidelberg, Germany, 1990; pp. 125–134. [Google Scholar] [CrossRef]
  13. Slámová, M.; Jančura, P.; Fabriciusová, V.; Beláček, B.; Zrníková, K.; Prídavková, Z. Traditional Agricultural Practices. Land Cover Diversity and Biodiversity in the Southern Podpolanie Region. In Biocultural Diversity in Europe; Environmental History 5; Springer International Publishing: Cham, Switzerland, 2016; pp. 247–268. [Google Scholar] [CrossRef]
  14. Pusey, M.P. On the Theory and Practice of Water Meadows. J. R. Agric. Soc. Engl. 1849, 10, 462–479. Available online: https://books.google.sk/books/about/Journal_of_the_Royal_Agricultural_Societ.html?id=JHQZAQAAMAAJ&redir_esc=y (accessed on 6 September 2020).
  15. Taylor, C.; Smith, N.; Brown, G. Rowland Vaughan and the Origins of Downward Floated Water-Meadows: A Contribution to the Debate. Landsc. Hist. 2012, 28, 35–51. [Google Scholar] [CrossRef]
  16. Pearson, A.W.; Soar., P.J. Meadowlands in Time: Re-Envisioning the Lost Meadows of the Rother Valley, West Sussex, UK. Landsc. Hist. 2018, 39, 25–55. [Google Scholar] [CrossRef] [Green Version]
  17. Cutting, R.; Cummings, I. Water Meadows: Their Form. Ecology and Plant Ecology. In Water Management in the English Landscape; Cook, H.F., Williamson, T., Eds.; Edinburgh University Press: Edinburgh, UK, 1999; pp. 157–178. [Google Scholar]
  18. Leibundgut, C. Historical Meadow Irrigation in Europe—A Basis for Agricultural Development. Available online: http://hydrologie.org/redbooks/a286/iahs_286_0077.pdf (accessed on 6 September 2020).
  19. Slámová, M.; Beláček, B.; Jančura., P.; Prídavková, Z. Relevance of the Historical Catchwork System for Sustainability of the Traditional Agricultural Landscape in the Southern Podpolanie Region. Agric. Agric. Sci. Procedia 2015, 4, 10–19. [Google Scholar] [CrossRef] [Green Version]
  20. Sofia, G.; Tarolli, P.; Cazorzi, F.; Dalla Fontana, G. Channel Network Identification from High-Resolution DTM: A Statistical Approach. Hydrol. Earth Syst. Sci. 2010, 7, 9327–9365. [Google Scholar] [CrossRef]
  21. Pirotti, F.; Tarolli, P. Suitability of LiDAR Point Density and Derived Landform Curvature Maps for Channel Network Extraction. Hydrol. Process. 2010, 24, 1187–1197. [Google Scholar] [CrossRef]
  22. Rapinel, S.; Hubert-Moy, L.; Clément, B.; Nabucet, J.; Cudennec, C. Ditch Network Extraction and Hydrogeomorphological Characterization Using LiDAR-Derived DTM in Wetlands. Hydrol. Res. 2015, 46, 276–290. [Google Scholar] [CrossRef]
  23. Chudý, F.; Slámová, M.; Tomaštík, J.; Prokešová, R.; Mokroš, M. Identification of Micro-Scale Landforms of Landslides Using Precise Digital Elevation Models. Geosciences 2019, 9, 117. [Google Scholar] [CrossRef] [Green Version]
  24. McCoy, M.D.; Asner, G.P.; Graves, M.W. Airborne Lidar Survey of Irrigated Agricultural Landscapes: An Application of the Slope Contrast Method. J. Archaeol. Sci. 2011, 38, 2141–2154. [Google Scholar] [CrossRef]
  25. Bedford, S.; Simeoni, P.; Lebot, V. The Anthropogenic Transformation of an Island Landscape: Evidence for Agricultural Development Revealed by LiDAR on the Island of Efate, Central Vanuatu, South-West Pacific. Archaeol. Ocean. 2017, 53, 1–14. [Google Scholar] [CrossRef]
  26. Luo, L.; Wang, X.; Guo, H.; Lasaponara, R.; Zong, X.; Masini, N.; Wang, G.; Shi, P.; Khatteli, H.; Chen, F.; et al. Airborne and Spaceborne Remote Sensing for Archaeological and Cultural Heritage Applications: A Review of the Century (1907–2017). Remote Sens. Environ. 2019, 232, 111280. [Google Scholar] [CrossRef]
  27. Chase, A.S.Z.; Chase, D.Z.; Chase, A.F. LiDAR for Archaeological Research and the Study of Historical Landscapes. In Sensing the Past, Geotechnologies and the Environment; Masini, N., Soldovieri, F., Eds.; Springer Nature: Cham, Switzerland, 2017; pp. 89–100. [Google Scholar] [CrossRef]
  28. Gasparini, M.; Moreno-Escribano, J.C.; Monterroso-Checa, A. Photogrammetric Acquisitions in Diverse Archaeological Contexts Using Drones: Background of the Ager Mellariensis Project (North of Córdoba-Spain). Drones 2020, 4, 47. [Google Scholar] [CrossRef]
  29. Chudý, F.; Slámová, M.; Tomaštík, J.; Tunák, D.; Kardoš, M.; Saloň, Š. The Application of Civic Technologies in a Field Survey of Landslides. Land Degrad. Dev. 2018, 29, 1858–1870. [Google Scholar] [CrossRef]
  30. García-Ruiz, J.M.; Lasanta, T.; Nadal-Romero, E.; Lana-Renault, N.; Álvarez-Farizo, B. Rewilding and Restoring Cultural Landscapes in Mediterranean Mountains: Opportunities and Challenges. Land Use Policy 2020, 99, 104850. [Google Scholar] [CrossRef]
  31. The Geodesy, Cartography and Cadastre Authority of the Slovak Republic. Geoportál ZBGIS® Map Client. 2020. Available online: https://zbgis.skgeodesy.sk/mkzbgis?bm=zbgis# (accessed on 10 September 2020).
  32. Landscape Atlas of the Slovak Republic. Available online: http://globus.sazp.sk/atlassr/ (accessed on 30 August 2020).
  33. Fric, M.; Orena, M.; Strelcova, K.; Jezik, M.; Sitkova, Z. The Changes of Stem Circumference and Microclimatic Parameters of Spruce Forests in BR Poľana during the Vegetation Season of 2009. In Microclima and Mesoclima of Landscape Structures and Anthropogenic Environment, Proceedings, Skalní mlýn, Czech Republic, 2–4 February 2011; Stredova, H., Roznovsky, J., Litschmann, T., Eds.; Cesky Hydrometeorologicky Ustav: Prague, Czech Republic, 2011. [Google Scholar]
  34. Fabriciusova, V. Natural Values in the Area of the CHKO-BR Polana. (In Slovak). Available online: http://huskforwildlife.eu/assets/docs/Zbornik_referatov.pdf (accessed on 30 September 2020).
  35. Fabriciusová, V.; Slámová, M.; Jančura, P. Protection of Landscape Values in an Innovative Management Approach of the Polana Biosphere Reserve. UNISCAPE En-Route 2015, 1, 27–32. [Google Scholar]
  36. Petrovic, F. The Changes of the Landscape with Dispersed Settlement. Ekologia (Bratislava) 2016, 25, 5–89. Available online: http://publikacie.uke.sav.sk/sites/default/files/EkSup10621petr_0.pdf (accessed on 6 November 2020).
  37. Ira, V.; Huba, M.; Podolak, P. Quality of Life of Population Living in a Protected Area and Its Sustainable Development (Examples of the Protected Landscape Area Polana). Geogr. Slovaca 2008, 25, 97–122. [Google Scholar]
  38. Slovak Environmental Agency. The Ministry of Environment’s Map Service (OGC WMS 1.3.0). 2019. Available online: http://maps.geop.sazp.sk (accessed on 30 September 2020).
  39. Technical University in Zvolen. Historická Ortofotomapa Slovenska Centrum Excelentnosti pre Podporu Rozhodovania v Lese a Krajine, TU Zvolen. 2020. (In Slovak). Available online: http://mapy.tuzvo.sk/hofm/ (accessed on 6 October 2020).
  40. Leica Geosystems. Leica CS10/CS15 & GS SensorsUser Manual. 2020. Available online: https://smithsurveyingequipment.co.uk/wp/wp-content/uploads/2017/09/LEICA-CS10-CS15-GS-SENSOR-USER-MANUAL.pdf (accessed on 11 November 2020).
  41. Menegoni, N.; Giordan, D.; Perotti, C.; Tannant, D.D. Detection and Geometric Characterization of Rock Mass Discontinuities Using a 3D High-Resolution Digital Outcrop Model Generated from RPAS Imagery—Ormea Rock Slope, Italy. Eng. Geol. 2019, 252, 145–163. [Google Scholar] [CrossRef]
  42. Huang, H.; Cui, C.; Cheng, L.; Liu, Q.; Wang, J. Grid Interpolation Algorithm Based on Nearest Neighbor Fast Search. Earth Sci. Inform. 2012, 5, 181–187. [Google Scholar] [CrossRef]
  43. Chaplot, V.; Darboux, F.; Bourennane, H.; Leguédois, S.; Silvera, N.; Phachomphon, K. Accuracy of Interpolation Techniques for the Derivation of Digital Elevation models In Relation to Landform Types and Data Density. Geomorphology 2006, 77, 126–141. [Google Scholar] [CrossRef]
  44. GDAL. GDAL Documentation. 2020. Available online: https://gdal.org/programs/gdal_grid.html (accessed on 22 November 2020).
  45. SAGA System for Automated Geoscientific Analyses. SAGA-GIS Tool Library Documentation (v4.0.1), Tool Simple Filter. Available online: http://www.saga-gis.org/saga_tool_doc/4.0.1/grid_filter_0.html (accessed on 22 November 2020).
  46. SAGA System for Automated Geoscientific Analyses. SAGA-GIS Module Library Documentation (v2.2.5), Module Slope, Aspect, Curvature. Available online: http://www.saga-gis.org/saga_tool_doc/2.2.5/ta_morphometry_0.html (accessed on 22 November 2020).
  47. Zevenbergen, L.W.; Thorne, C.R. Quantitative Analysis of Land Surface Topography. Earth Surf. Process. Landf. 1987, 12, 47–56. [Google Scholar] [CrossRef]
  48. Thorne, C.R.; Zevenbergen, L.W.; Burt, T.P.; Butcher, D.P. Terrain Analysis for Quantitative Description of Zero-Order Basins. In Proceedings of the Corvallis Symposium: Erosion and Sedimentation, Corvallis, OR, USA, 3–7 August 1987; International Association of Hydrological Sciences: Wallingford, UK, 1987; Volume 165, pp. 121–130. [Google Scholar]
  49. ArcGIS for Desktop. Curvature Function. 2020. Available online: https://desktop.arcgis.com/en/arcmap/10.3/manage-data/raster-and-images/curvature-function.htm (accessed on 22 November 2020).
  50. Sancho-Adamson, M.; Trillas, M.I.; Bort, J.; Fernández-Gallego, J.A.; Romanyà, J. Use of RGB Vegetation Indexes in Assessing Early Effects of Verticillium Wilt of Olive in Asymptomatic Plants in High and Low Fertility Scenarios. Remote Sens. 2019, 11, 607. [Google Scholar] [CrossRef] [Green Version]
  51. Hunt, E.R.; Cavigelli, M.; Daughtry, C.S.T.; Mcmurtrey, J.E., III; Walthall, C.L. Evaluation of Digital Photography from Model Aircraft for Remote Sensing of Crop Biomass and Nitrogen Status. Precis. Agric. 2005, 6, 359–378. [Google Scholar] [CrossRef]
  52. Lussem, U.; Bolten, A.; Gnyp, M.L.; Jasper, J.; Bareth, G. Evaluation of RGB-Based Vegetation Indices from UAV Imagery to Estimate Forage Yield in Grassland. ISPRS Int. Arch. Photogram. Remote Sens. Spat. Inf. Sci. 2018, 1215–1219. [Google Scholar] [CrossRef] [Green Version]
  53. Hatari Labs. Vegetation and Biomass Indices Estimation with QGIS 3—Tutorial. 2020. Available online: https://www.hatarilabs.com/ih-en/vegetation-and-biomass-indices-estimation-with-qgis-3-tutorial (accessed on 22 November 2020).
  54. Tucker, C.J. Red and Photographic Infrared Linear Combinations for Monitoring Vegetation. Remote Sens. Environ. 1979, 8, 127–150. [Google Scholar] [CrossRef] [Green Version]
  55. Kubinský, D.; Weis, K.; Fuska, J.; Lehotský, M.; Petrovič, F. Changes in Retention Characteristics of 9 Historical Artificial Water Reservoirs Near Banská Štiavnica, Slovakia. Open Geosci. 2015, 1, 1–8. [Google Scholar] [CrossRef]
  56. Cucchiaro, S.; Fallu, D.J.; Zhang, H.; Walsh, K.; Van Oost, K.; Brown, A.G.; Tarolli, P. Multiplatform-SfM and TLS Data Fusion for Monitoring Agricultural Terraces in Complex Topographic and Landcover Conditions. Remote Sens. 2020, 12, 1946. [Google Scholar] [CrossRef]
  57. Chudá, J.; Hunčaga, M.; Tuček, J.; Mokroš, M. The Handheld Mobile Laser Scanners as a Tool for Accurate Positioning under Forest Canopy. ISPRS Int. Arch. Photogramm. Remote. Sens. Spat. Inf. Sci. 2020, 211–218. [Google Scholar] [CrossRef]
  58. Căteanu, M.; Ciubotaru, A. Accuracy of Ground Surface Interpolation from Airborne Laser Scanning (ALS) Data in Dense Forest Cover. ISPRS Int. J. of Geo Inf. 2020, 9, 224. [Google Scholar] [CrossRef] [Green Version]
  59. Tarolli, P. High-Resolution Topography for Understanding Earth Surface Processes: Opportunities and Challenges. Geomorphology 2014, 216, 295–312. [Google Scholar] [CrossRef]
  60. Walker, S.J.; Wilkinson, S.N.; van Dijk, A.I.J.M.; Hairsine, P.B. A Multi-Resolution Method to Map and Identify Locations of Future Gully and Channel Incision. Geomorphology 2020, 358, 107115. [Google Scholar] [CrossRef]
  61. De Castro, A.I.; Torres-Sánchez, J.; Peña, J.M.; Jiménez-Brenes, F.M.; Csillik, O.; López-Granados, F. An Automatic Random Forest-OBIA Algorithm for Early Weed Mapping between and within Crop Rows Using UAV Imagery. Remote Sens. 2018, 10, 285. [Google Scholar] [CrossRef] [Green Version]
  62. Piragnolo, M.; Masiero, A.; Pirotti, F. Open Source R for Applying Machine Learning to RPAS Remote Sensing Images. Open Geospat. Data Softw. Stand. 2017, 2, 16. [Google Scholar] [CrossRef] [Green Version]
  63. Al-Najjar, H.A.; Kalantar, B.; Pradhan, B.; Saeidi, V.; Abdul Halin, A.; Ueda, N.; Mansor, S. Remote Sensing Land Cover Classification from Fused DSM and UAV Images Using Convolutional Neural Networks. Remote Sens. 2019, 11, 1461. [Google Scholar] [CrossRef] [Green Version]
  64. Roy, S.; Sahu, A.S. Palaeo-Path Investigation of the Lower Ajay River (India) Using Archaeological Evidence and Applied Remote Sensing. Geocarto Int. 2016, 31, 966–984. [Google Scholar] [CrossRef]
  65. Mondini, A.C.; Guzzetti, F.; Reichenbach, P.; Rossi, M.; Cardinali, M.; Ardizzone, F. Semi-Automatic Recognition and Mapping of Rainfall Induced Shallow Landslides Using Optical Satellite Images. Remote Sens. Environ. 2011, 115, 1743–1757. [Google Scholar] [CrossRef]
  66. Jannoura, R.; Brinkmann, K.; Uteau, D.; Bruns, C.; Joergensen, R.G. Monitoring of Crop Biomass Using True Colour Aerial Photographs Taken from a Remote Controlled Hexacopter. Biosyst. Eng. 2015, 129, 341–351. [Google Scholar] [CrossRef]
  67. Belčáková, I.; Pauditšová, E.; Gazzola, P. Methods and Techniques in Landscape Impact Assessment. In Landscape Impact Assessment in Planning Processes; Walter de Gruyter: Berlin, Germany, 2018; pp. 77–111. [Google Scholar] [CrossRef]
  68. Riihimäki, H.; Heiskanen, J.; Luoto, M. The Effect of Topography on Arctic-Alpine Aboveground Biomass and NDVI Patterns. Int. J. Appl. Earth Obs. Geoinf. 2017, 56, 44–53. [Google Scholar] [CrossRef] [Green Version]
  69. Sharma, L.P.; Nilanchal, P.; Ghose, M.K.; Debnath, P. Synergistic Application of Fuzzy Logic and Geo-Informatics for Landslide Vulnerability Zonation—A Case Study in Sikkim Himalayas, India. Appl. Geomat. 2013, 5, 271–284. [Google Scholar] [CrossRef]
  70. Evard, M. Water Meadows: Living Treasures in the English Landscape; Forrest Text: Machynlleth, UK, 2005. [Google Scholar]
  71. Lieskovský, J.; Bezák, P.; Špulerová, J.; Lieskovský, T.; Koleda, P.; Dobrovodská, M.; Bürgi, M.; Gimmi, U. The Abandonment of Traditional Agricultural Landscape in Slovakia—Analysis of Extent and Driving Forces. J. Rural Stud. 2015, 37, 75–78. [Google Scholar] [CrossRef]
  72. Belcakova, I.; Psenakova, Z. Specifics and Landscape Conditions of Dispersed Settlements in Slovakia—A Case of Natural, Historical and Cultural Heritage. In Best Practices in Heritage Conservation and Management: From the World to Pompeii, Proceedings of the 12th International Forum of Studies—The Paths of the Merchants, Aversa, Italy, 12–14 June 2014; Piscitelli, M., Ed.; Scuola Pitagora Editrice: Napoli, Italy, 2014; pp. 261–268. [Google Scholar]
  73. Keenleyside, C.; Oppermann, R. A Farmer-Centred Outlook to Managing and to Maintaining High Nature Value Grasslands in Europe. In Grasslands in Europe of High Nature Value; Veen, P., Jefferson, R., de Smidt, J., van der Straaten, J., Eds.; KNNV Publishing: Zeist, The Netherlands, 2009; pp. 293–303. [Google Scholar] [CrossRef]
  74. Maskell, L.C.; Botham, M.; Henrys, P.; Jarvis, S.; Maxwell, D.; Robinson, D.A.; Rowland, C.S.; Siriwardena, G.; Smart, S.; Skates, J.; Tebbs, E.J.; Tordoff, G.M.; Emmett, B.A. Exploring Relationships between Land Use Intensity, Habitat Heterogeneity and Biodiversity to Identify and Monitor Areas of High Nature Value Farming. Biol. Conserv. 2019, 231, 30–38. [Google Scholar] [CrossRef]
  75. Kozelová, I.; Špulerová, J.; Miklósová, V.; Gerhátová, K.; Izakovičová, Z.; Kalivoda, H.; Kalivodová, M.; Kanka, R. The Role of Artificial Ditches and Their Buffer Zones in Intensively Utilized Agricultural Landscape. Environ. Monit. Assess. 2020, 192, 656. [Google Scholar] [CrossRef] [PubMed]
  76. Cook, B.I.; Shukla, S.P.; Puma, M.J.; Nazarenko, L.S. Irrigation as an Historical Climate Forcing. Clim. Dyn. 2015, 44, 1715–1730. [Google Scholar] [CrossRef] [Green Version]
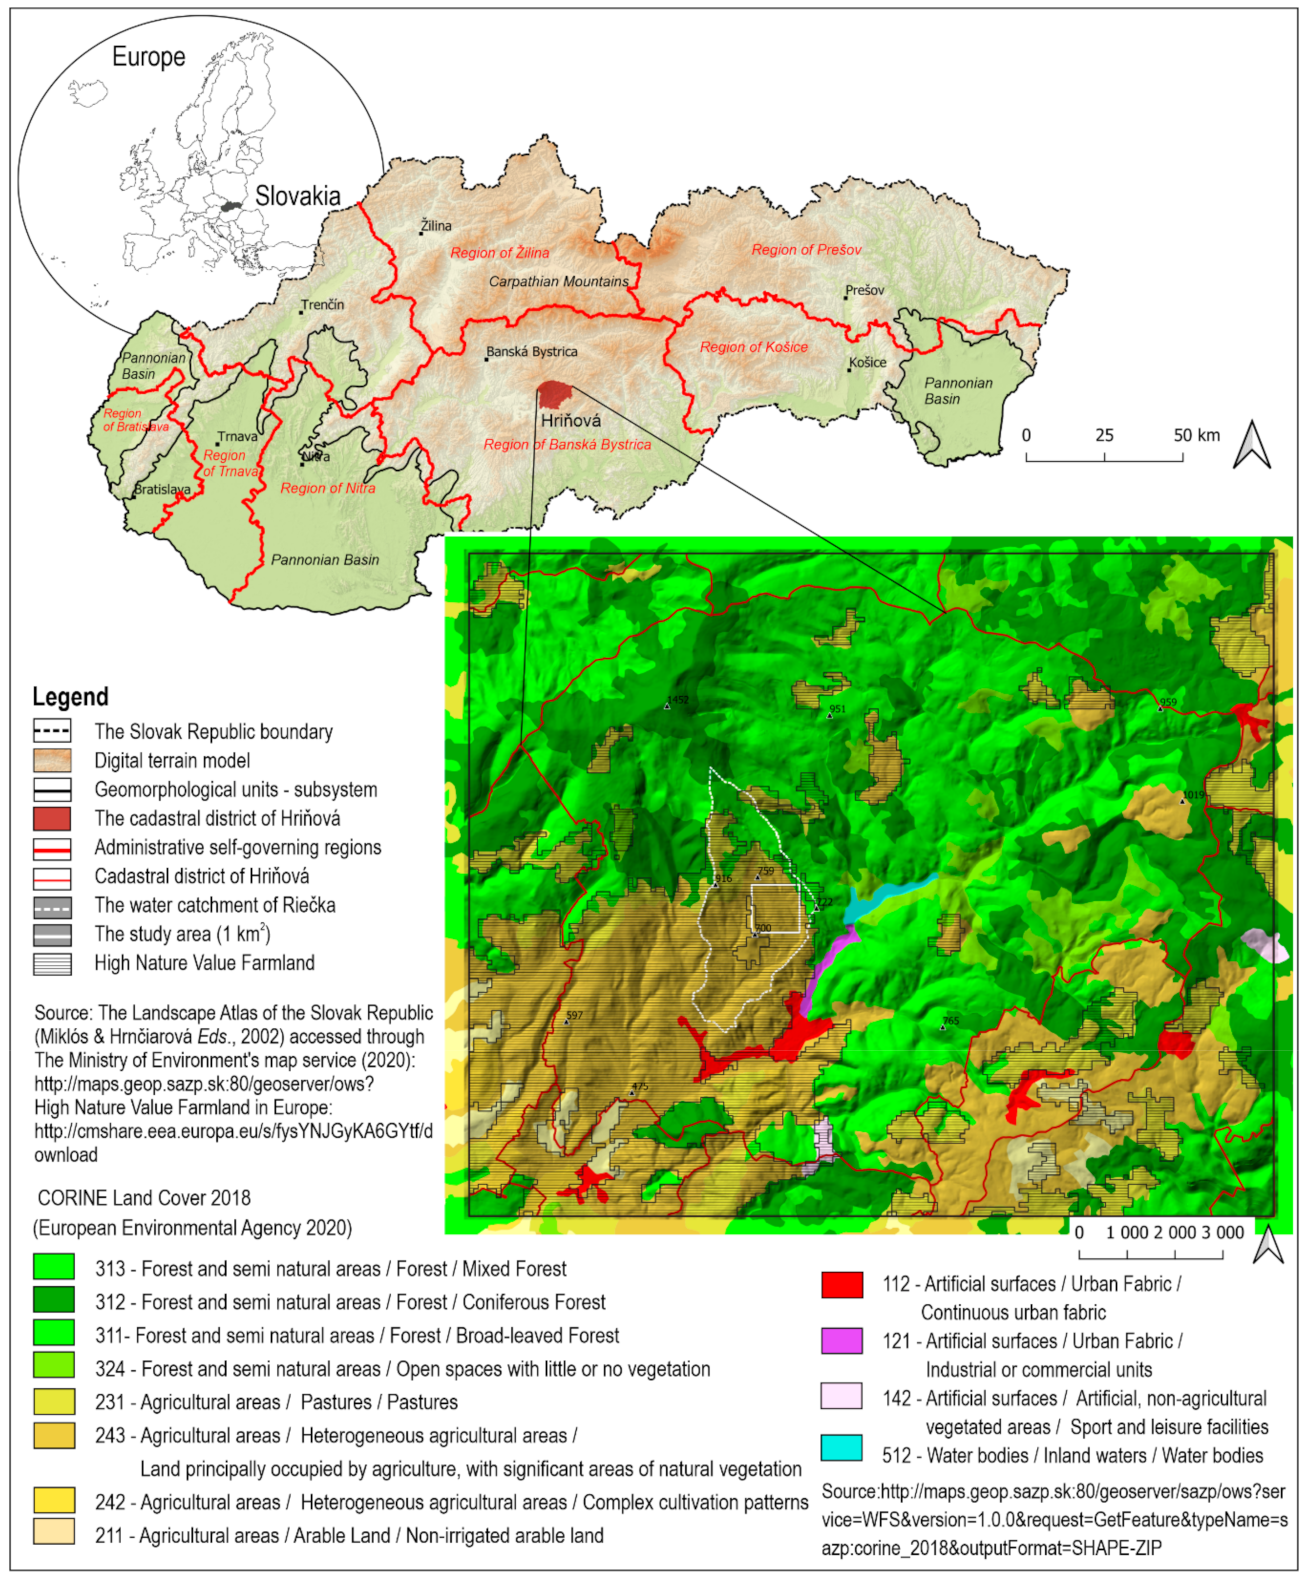
Figure 1. The study area of the Riečka water catchment located in the cadastral district of Hriňová in central Slovakia; Corine Land Cover 2018 and High Nature Value Farmland.
Sustainability 13 01107 g001
Figure 2. Catchworks are shallow channels on mountain slopes: opened water supply from stream (a); closed water supply from stream (b); Catchworks in the digital terrain model show both positions in relation to counter lines—they run in both directions—parallel (I., II., III.) and perpendicular (IV., V.) (c); Catchworks in a photo before sunset (d) and highlighted with white colour (e).
Sustainability 13 01107 g002
Figure 3. Categories of catchworks identified in orthomosaic photos and using break lines and catchworks mapped in the field: categories A and B in the orthomosaic of 2018 (a); categories A and B in the orthomosaic of 2015 (b); categories A and B in the orthomosaic of 2011 (c); category C in the orthomosaic of 2018 (d); category C in the orthomosaic of 2015 (e); category C in the orthomosaic of 2011 (f).
Sustainability 13 01107 g003
Figure 4. Detail of categories of catchworks (AC) identified in orthomosaic and using break lines and catchworks mapped in the field.
Sustainability 13 01107 g004
Figure 5. Validation of catchworks according to the Normalized Green-Red Difference Index (NGRDI) and datasets coincidence. No data coincidence (a); detection according to adjusted orthomosaic and break lines (b); detection according to NGRDI and adjusted orthomosaic photos (c); data coincidence of land cover and terrain datasets (d).
Sustainability 13 01107 g005
Figure 6. Real catchworks mapped in the field (a); real catchworks mapped in the field and potential catchworks identified using terrain and land use geospatial data (b).
Sustainability 13 01107 g006
Figure 7. Catchworks in land use categories and plots: real catchworks on plots of the Cadastre of Real Estate (a); real and potential catchworks on plots of the Cadastre of Real Estate (b).
Sustainability 13 01107 g007
Figure 8. Overgrowing of grasslands with shrubs in the plots of the Cadastre of Real Estate with catchworks during the last 70 years (1950, 2010 and 2018) in the southern part of the study area.
Sustainability 13 01107 g008
Table 1. Parameters of orthomosaic photos.
DateResolution [m/px]Bands R—G—B (Min–Max)
2002500–255—0–255—0–255
20065016–250—26–250—14–250
2009250–250—0–250—0–250
20112511–255—7–255—7–255
20152021–246—28–252—5–255
20182028–236—25–234—22–230
Table 2. GIS software, tools and modules applied in the methodology.
Geospatial Data Origin Processed in Geographic Information System (GIS) ApplicationsAuthorsEUROSENSE Ltd. 2017
Socet Set® software, BAE Systems-Digital terrain model (DTM) as Triangulated Irregular Network (TIN); Orthomosaic photos red (R), green (G), blue (B) (2002, 2006, 2009, 2011, 2015, 2018)
Quantum GIS (QGIS) București 3.12.3 and 3.14 π “Pi”
Raster analysis, GridPixel based DTM gridded data from z co-ordinates of TIN -
Raster calculatorDTM derivatives thresholds-
Raster conversionVectorisation of maximum profile curvature grid cells-
Raster analysis, using a zonal histogramZonal statistics on rasters with vector layers containing zones-
Vector, geoprocessing tools, bufferBuffer zones of break lines from TIN-
Vector, the Global Positioning System (GPS) Tool pluginImport of Global Navigation Satellite System (GNSS) data to QGIS-
QGIS client to access Open Geospatial Consortium (OGC) Web Map Services (WMS) and Web Map Tile Service (WMTS)ZBGIS® Map (Topographic maps, 2019); Plots of the national Cadastre of Real Estate; Historical data: military topographic maps (1952–1957) and orthomosaic photos (1950, 2010, 2018) -
Semi-automatic Classification Plugin (SCP) v.7.2.0 for QGIS
Pre-processing, split raster bandsSplit RGB to separate bands-
SCP raster band calculatorNormalized Green-Red Difference Index (NGRDI)-
System for Automated Geoscientific Analyses (SAGA) GIS 2.3.2
Simple FilterFiltered DTM with sharpened terrain discontinuities-
Terrain Analysis, morphometry, profile curvatureDTM derivative indicating the increasing slope steepness in the downslope direction-
Global Navigation Satellite System (GNSS) Leica GS05
GNSS Leica GS05Field survey of catchworks (2013)-
Table 3. Evaluation of real catchworks (mapped in 2013) in land use categories (2018–2019).
Land Use Categories from ZBGIS *Length of Catchworks (%)Area of ZBGIS Land Use Categories (%)
Forest0.121.85
Forest/grassland and shrubs1.802.09
Meadow69.4165.08
Land with a civil engineering object (road)0.433.16
Meadow/grassland and shrubs3.404.58
Grassland and shrubs24.8423.24
Total sum100.00100.00
* All plots besides “Land with a civil engineering object (road)” also including currently forested plots are registered in the Cadastre of Real Estate (2020) as a category “meadow and pasture permanently covered with grass or land temporarily not used for permanent grassland”. Therefore, detailed classification was adopted from ZBGIS land cover categories. The survey showed data inconsistency between the registration of plots in the Cadastre of Real Estate and maps provided by ZBGIS, which are more precious considering the actual land use of plots.
Publisher’s Note: MDPI stays neutral with regard to jurisdictional claims in published maps and institutional affiliations.