Abstract
Controlling energy consumption to reduce greenhouse gas emissions has become a global consensus in response to the challenge of climate change. Most studies have focused on energy consumption control in a single region; however, high-resolution analysis of energy consumption and personalized energy policy-making, for multiple regions with differentiated development, have become a complicated challenge. Using the logarithmic mean Divisia index I (LMDI) decomposition method based on energy allocation analysis (EAA), this paper aims to establish a standard paradigm for a high-resolution analysis of multi-regional energy consumption and provide suggestions for energy policy-making, taking 29 provinces of China as the sample. The process involved three steps: (1) determination of regional priorities of energy consumption control by EAA, (2) revealing regional disparity among the driving forces of energy consumption growth by LMDI, and (3) deriving policy implications by comparing the obtained results with existing policies. The results indicated that 29 provinces can be divided into four groups, with different priorities of energy consumption control according to the patterns of coal flows. Most provinces have increasing levels of energy consumption, driven by increasing per capita GDP and improving living standards, while its growth is restrained by decreasing end-use energy intensity, improving energy supply efficiency, and optimization of industrial structures. However, some provinces are not following these trends to the same degree. This indicates that policy-makers must pay more attention to the different driving mechanisms of energy consumption growth among provinces.
1. Introduction
To reduce the possibility of serious, universal, and irreversible climate change and the effects it will have on human beings and ecosystems, a substantial and sustained reduction in greenhouse gas (GHG) emissions is necessary [1]. However, global energy consumption is still growing rapidly [2]. According to the latest forecast, global energy consumption will increase by more than half by 2060 [3]. Fossil fuel combustion is the main source of GHG emissions and still dominates global energy consumption, so controlling energy consumption growth is one of the means to effectively reduce GHG emissions globally and promote low-carbon energy transition [4,5]. This is especially significant for developing countries, whose energy consumption is rapidly increasing.
As each region or country is composed of several heterogeneous subregions, it is important to make differentiated policies for them. The formulation of differentiated policies must be based on a clear understanding of multi-regional energy consumption. From the perspective of energy systems, the generation of regional energy consumption involves the complex energy supply chain, and its change is affected by many factors such as population, economy, technology, and so on. Therefore, how to integrate these processes and factors to reveal the mechanism of multiple regional energy consumption growth is a hot topic in scientific research.
Most previous studies on multi-regional energy consumption have been based on multi-regional input–output methods (MRIO) and focused on the analysis of energy consumption and energy-related carbon emissions embodied in cross-regional trade and regional final consumption (see Section 2.1). These studies usually pay more attention to the changes in trade flows over time and the impact of final consumption on energy consumption, while less consideration is given to the status and trends of energy systems and other driving forces of energy consumption growth in various regions.
In addition, the study of energy consumption in a single region or a few regions is also relevant. In previous studies in this area, some scholars adopted econometric methods to analyze the impact of macroeconomic indicators, such as population [6], gross domestic product (GDP) [6,7,8,9,10], industrial structure [9], urbanization rate [7], energy structure [11,12], and energy intensity [11,12], on energy consumption (see Section 2.2). These studies could better explain the causal relationship between macroeconomic indicators and energy consumption. However, few scholars considered the impact of the whole energy supply chain process.
Due to the flexibility of driving factors selection, index decomposition analysis (IDA) has become a popular method to study energy consumption in multiple regions or in a single region (see Section 2.3). Although some previous studies based on IDA considered factors such as energy intensity and energy structure, there was still a deficiency because of the relatively low technical resolution of energy systems. To this end, Chong et al. [13,14,15] developed the logarithmic mean Divisia index I (LMDI) decomposition method based on energy allocation analysis (EAA-LMDI) and proposed that the efficiency of the energy supply chain should be further considered. Using EAA-LMDI, the technical resolution of energy systems was improved by introducing the primary energy consumption responsibility conversion factor (KPECR) derived by EAA into LMDI. Then, the indicator of energy intensity was further decomposed into the energy supply efficiency (primary energy consumed per unit of end-use energy) and end-use energy intensity (end-use energy consumed per GDP). Compared with other IDA methods, EAA-LMDI achieved high resolution analysis of energy system.
However, given that EAA-LMDI was previously only used to analyze the energy consumption of a single region, how to apply this method to a multi-regional analysis remains a challenge. In particular, when conducting a multi-regional analysis by EAA-LMDI, the data volume and heterogeneity of the results increase exponentially, which greatly affects the efficiency of analyzing results and deriving policy implications. If a multi-regional data treatment paradigm is established, the standardization of data treatment can be realized, and the analysis of multi-regional energy consumption can be completed efficiently. Therefore, a new paradigm of data treatment must be created so that EAA-LMDI can be applied to the analysis of multi-regional energy consumption.
This paper aims to establish a standardized paradigm for how to apply EAA-LMDI in the analysis of multi-regional energy consumption and derive policy implications of multi-regional energy consumption control, taking China as a case study. There are three basic steps in this paradigm. First, we illustrate the status quo of energy systems in multiple regions in the form of energy allocation Sankey diagrams, and summarize the similarities and differences of regional energy systems. Secondly, through an analysis of the driving factors of the historical growth of energy consumption in those regions, we summarize the similarities and differences of multi-regional energy consumption growth. On the basis of the above results, compared with existing energy policies, we propose recommendations to improve energy policies in the future.
Choosing China as a case study has the following advantages: (1) China is a typical example of the rapid growth that has been occurring in energy consumption worldwide and is a significant contributor to that trend. In 2019, China’s carbon emissions accounted for 28% of global carbon emissions [16]. (2) China’s regional disparity in terms of energy consumption and growth is obvious [17]. (3) The Chinese government attaches great importance to the control of regional energy consumption. Since the announcement of the 12th Five Year Plan, China has formulated a “dual control” policy to control total energy consumption as well as the energy intensity in various regions [18,19,20,21]. However, it is obvious that the Chinese government needs to further improve its regional energy consumption control policy. At present, while making regional “double control” policies, China’s central government often adopts top-down national goal requirements and uses bottom-up regional independent commitments to determine policy targets [22]. In the context of the implementation effect of these policy targets, the current policy targets for various regions have not been very effective, and more scientific methods are urgently needed to support a policy improvement.
The main contributions of this paper are as follows:
- (1)
- As enabled by the new paradigm, we have achieved the first application of EAA-LMDI to a multi-regional analysis. This paradigm provides a high-resolution way to formulate differentiated policies to control the energy consumption growth of multiple regions.
- (2)
- With high technical resolution, this paper reveals the similarities and differences in energy consumption, the growth of this consumption in China’s provinces, and the reasons behind this growth. For the first time, energy allocation Sankey diagrams of 29 provinces in China are mapped and the LMDI decomposition results that consider the KPECR are presented.
- (3)
- The case study of China indicates a new policy-making model. When making regional energy consumption control targets, this model for determining the targets based on the characteristics of the main energy flow and the driving factors of energy consumption growth will be more effective than the commonly used current model, which directly determines the targets involving energy consumption and its growth.
The paper contents are as follows: a literature review of existing methods to analyze regional energy consumption is provided in Section 2; an introduction of the methodology and data can be found in Section 3; results and discussion are provided in Section 4; a brief discussion of limitations and uncertainties can be found in Section 5; and conclusions and recommendations for future research are available in Section 6.
2. Literature Review
Previous studies of multi-regional energy consumption were mainly based on MRIO. As for the studies of energy consumption in a single region or a few regions, econometric and decomposition analysis methods are common. In particular, the EAA-LMDI method can have high technical resolution, but was only used to study a single region.
2.1. Multi-Regional Input–Output Methods
MRIO is a common method for studies on multi-regional energy consumption. Through MRIO, scholars have calculated the energy consumption, carbon emissions, and other environmental impacts embodied in final consumption and cross-regional energy trade.
Compared with direct energy consumption, the research based on MRIO pays more attention to the indirect energy consumption embodied in final consumption and cross regional trade, as is shown in Table 1. Through the construction of cross-regional embodied energy and a carbon flow network, the multi-regional energy footprint and carbon leakage can be better explained. The analysis of embodied energy in final consumption can explain the change in regional energy consumption from the consumption side. However, these studies rarely consider the status and trends of energy systems in various regions, so their implications for making energy policy are limited.

Table 1.
Studies concerning multi-regional energy consumption based on multi-regional input–output (MRIO) methods.
2.2. Econometric Methods
In the published literature using econometric methods, most focused on the driving factors of energy consumption, fitting the historical data of energy indicators and economic indicators. Only a few studies further predicted future energy consumption based on historical energy and economic data [11,33].
As illustrated by the studies listed in Table 2, econometric methods have an advantage in revealing the interactions among various indicators by testing their causal relationships. However, little consideration is given to the indicators related to the details of energy systems. For example, only a few studies included energy structures [11,12], and studies seldom considered energy supply efficiency. In addition, due to the free choice of driving factors, the factors considered cannot cover the whole process. Therefore, these studies have limited implications for making energy policy, which normally requires a high-resolution understanding of the energy system to determine key energy indicators, including the structure of primary energy, energy supply efficiency, the structure of energy end-use, and their driving factors.

Table 2.
Studies concerning energy consumption growth in China based on econometric methods.
2.3. Decomposition Analysis Method
In the published literature using the decomposition analysis methods, the methods can be divided into Index Decomposition Analysis [38] and Structural Decomposition Analysis (SDA) [39] methods. The fundamental difference between these two methods is a difference in the research objective [40]. IDA focuses on the relationship between commodity production and energy consumption, while SDA focuses on the relationship between final commodity consumption and energy consumption. Moreover, SDA needs to rely on the Input–Output model framework and IDA does not. SDA can better reflect the impact of the final demand structure on energy consumption during economic development. Meanwhile, IDA can better describe the process of physical energy supply and analyze it with technical drivers, which is more useful for energy policy-making. Therefore, IDA is more suitable for the purpose of studying energy policies in this paper.
In early studies, IDA decomposition results usually contained unexplained residuals. To solve this problem, Ang et al. proposed a new decomposition method named LMDI, which proved that the decomposition result does not contain unexplained residuals, and recommended LMDI as the preferred method for using IDA [41,42]. Since then, LMDI has been widely used for studying national and regional energy consumption and carbon emissions. Many scholars have used LMDI to analyze China’s energy consumption at the national and regional levels. In Elsevier ScienceDirect, there are 103 papers on China’s energy consumption and LMDI, most of which involve a LMDI decomposition analysis of energy-related carbon emissions. In the literature on energy consumption, the focus is on energy consumption in the economic sector, high energy-consuming industries, and the building sector. Table 3 surveys the literature on energy consumption in the economic sector.

Table 3.
Studies concerning energy consumption growth in China’s economic sector based on logarithmic mean Divisia index I (LMDI).
According to the above literature, the advantage of LMDI is that it can comprehensively analyze the impact of various driving factors on energy consumption growth, including economic factors and energy factors. Common driving factors include population, GDP per capita, economic structure, energy structure, and energy intensity [54]. Based on the abovementioned driving factors, the research on energy consumption (and energy-related carbon emissions) in specific sectors further considers factors such as the internal structure of the industry [55,56,57,58,59] (and carbon emission factors [60,61,62,63,64]). As these driving factors are usually related to policy-making, LMDI has better policy implications than econometric methods. Therefore, in general, LMDI is suitable for this study, but the technical resolution of energy systems needs to be further improved, and the impact of energy supply efficiency needs to be considered further.
2.4. EAA-LMDI Method
EAA-LMDI is a new advancement of LMDI to improve the technical resolution of energy systems; it originated from the development of the EAA method. Cullen and Allwood [65] are earlier scholars who proposed a high-resolution EAA method to compensate for the energy loss in the energy conversion process to each end-use department, and described the whole process from primary energy exploitation to end-use consumption by a Sankey diagram. Ma et al. [66] further applied this EAA method to China. After that, Chong et al. [13,14,15] proposed the EAA-LMDI method by combining EAA with the LMDI method, which could further improve the technical resolution of the LMDI method to include the impact of energy supply efficiency on energy consumption growth.
The main advantage of the EAA-LMDI method is that it can improve the understanding on the physical change in complex energy systems by mapping energy allocation Sankey diagrams in a time series, which provides whole maps of energy flows to illustrate the mechanism of how energy consumption is generated by the relationships among various sectors in terms of energy end-use, energy conversion, and energy supply. Secondly, by introducing KPECR, which is a reciprocal of the network efficiency from primary energy to end-use energy, the corresponding LMDI method can further disassemble the energy intensity in traditional LMDI research into end-use energy intensity and energy supply efficiency. Thus, the technical resolution of LMDI decomposition analysis is improved, and the impact of energy supply efficiency on energy consumption is reflected.
However, the main disadvantage of EAA-LMDI is the large data volume, as it is based on a time series of energy balance tables containing hundreds of energy data points. When it is applied to a multi-regional study, the volume and diversity of data will increase dramatically, which makes it difficult to pick out useful implications from a huge volume of data results. Therefore, if we want to reap the high-resolution advantages of EAA-LMDI to study multi-regional problems, we must first invent a standard paradigm that can effectively use the advantages of EAA-LMDI to help us enhance the understanding of the growth of multi-regional energy consumption, and easily develop policy recommendations based on it.
3. Methodology and Data
Although the main purpose of this paper was to build an analysis paradigm, this was based on the data treatment and analysis process of EAA-LMDI. Therefore, the basic principles and processes of EAA-LMDI are first introduced in brief, followed by a detailed introduction of the paradigm and a brief introduction of data sources.
3.1. EAA-LMDI Method
3.1.1. Energy Allocation Analysis and Primary Energy Consumption Responsibility
The core idea of energy allocation analysis is to convert the end-use consumption of all secondary energy into the amount of primary energy needed to produce these secondary energies [65,66], which is named the primary energy consumption responsibility. The EAA-LMDI method calculates the primary energy consumption responsibility of the end-use sectors by introducing the primary energy consumption responsibility conversion factor (KPECR), which is defined as the quantity of primary energy needed to generate a unit heat value of secondary energy j in the energy conversion process. KPECR can reflect the impact of secondary energy supply efficiency on regional energy consumption, and ensure that the primary energy consumption responsibility of the end-use sector is strictly equal to the amount of primary energy input into the regional energy system.
The calculation of KPECR and primary energy consumption responsibility can be performed as follows: (1) Obtain energy data from the regional energy balance table and reclassify according to the different energy types. (2) Construct a regional energy input–output table, and calculate the Leontief inverse matrix (Lij) of the input–output table. (3) Calculate KPECR based on the Leontief inverse matrix (Equation (1)) and modify the energy imports (Equation (2)). (4) Calculate the primary energy consumption responsibility of each sector through KPECR (Equation (3)). The detailed calculation process is referred to the references [13,14,15].
L1,J–L4,J represent the quantity of raw coal, crude oil, natural gas, and other energy, respectively, consumed in order to produce one unit of secondary energy j for final demand.
KPECR,j = L1,j + L2,j + L3,j + L4,j
refers to the primary energy quantity conversion factor of the regional secondary energy j after the correction of the import impact, and refers to the primary energy quantity conversion factor of the external secondary energy j.
After calculating the primary energy consumption responsibility of each end-use sector, a Sankey diagram can be used to describe the whole process of energy utilization. Energy allocation Sankey diagrams of each province are divided into three stages: primary energy supply, energy conversion, and end-use sector. As there are many areas involved, the end-use sectors were simplified here. Figure 1 shows the structure of an energy allocation Sankey diagram.

Figure 1.
The structure of energy allocation Sankey diagram. (note: In the energy allocation Sankey diagram, the arrow represents the direction of energy flow, the width of the flow represents the quantity of energy, and the color of the flow represents different energy varieties.)
3.1.2. EAA-LMDI Calculation
After introducing KPECR, the standard quantity of energy was transformed into primary energy consumption responsibility. The primary energy consumption responsibility of the economic sector and the residential sector can be expressed as follows:
where i represents different economic or living sectors (primary, secondary and tertiary industries/town, rural) and j represents different energy types (raw coal, crude oil, natural gas, cleaned coal, coke, coal products, gas, gasoline, diesel, kerosene, oil products, heat, and electricity).
KPECR,j represents the conversion efficiency of secondary energy j in the regional energy system. Accordingly, in Equation (4) represents the efficiency from the secondary energy used by the end-use sector to the final economic output. That is to say, by introducing KPECR,j into the formula, the energy intensity in the traditional energy consumption decomposition formula can be divided into two factors, end-use energy intensity and energy supply efficiency, so as to improve the technical resolution of the LMDI decomposition analysis.
The decomposition results of LMDI can be expressed in the form of addition decomposition or multiplication decomposition. Addition decomposition is in the form of an absolute value, and multiplication decomposition is in the form of a relative value. In order to make a better multi-regional comparison and avoid the impact of regional energy consumption base, this study took LMDI multiplication decomposition as the main form of results display.
3.2. Standard Paradigm for Comparative Analysis of Multi-Regional Energy Consumption
The purpose of establishing the paradigm is to quickly process a large amount of data of EAA-LMDI, and to obtain knowledge about the status quo and historical trends of energy consumption in multiple regions so as to avoid the discussion of each region one by one. The whole paradigm consists of three parts, including a multi-regional energy allocation analysis, the LMDI decomposition analysis of multi-regional energy consumption, and policy implications and limitations of the paradigm, as shown in Figure 2 and explained in detail below.
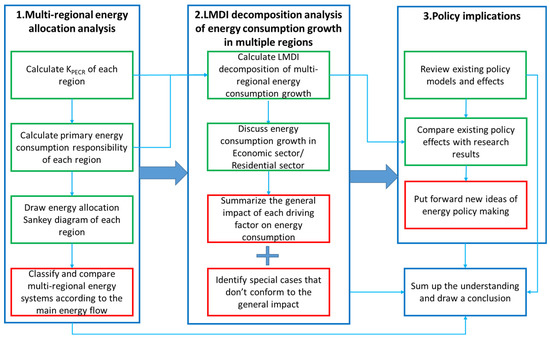
Figure 2.
Flowchart of the multi-regional energy consumption analysis paradigm.
Step 1: Multi-regional EAA
The purpose of this step was to complete energy allocation analysis in multiple regions, and compare the similarities and differences between the status quo of energy systems in different regions with the help of the energy allocation Sankey diagram. First, referring to the steps in Section 3.1.1, an energy input–output table was built for each region, and primary energy consumption responsibility was calculated by deriving KPECR. Second, based on the calculated primary energy consumption responsibilities, an energy allocation Sankey diagram for each region is drawn. Finally, by quickly scanning and comparing the main energy flows in the energy Sankey diagram, the main characteristics of energy systems in different regions were compared.
In this step, to quickly compare multi-regional energy systems, we classify the regions according to the main energy flows in the energy allocation Sankey diagrams, and then discuss the main characteristics of energy systems in different types of regions. For example, in China, coal, as the main energy source, has a far greater impact than other energy sources. At the same time, coal consumption is also a key issue in China’s environmental protection and low-carbon energy development. Consideration of the similar structure of end-use energy consumption in different regions (except Beijing and Shanghai), and the energy conversion stage is relatively complicated, so it is difficult to describe the characteristics of coal consumption in only one or two stages. Therefore, the production, import, and export of coal can be used as the criteria for multi-regional division in China’s case. We named this criterion the “taxonomy of main energy flow characteristics”. This criterion can be changed for various regions. For example, for some countries whose energy consumption is mainly based on oil, the main flow should be changed into oil flows.
Step 2: Multi-regional LMDI decomposition
The purpose of this step was to complete a LMDI decomposition calculation of the energy consumption growth of the economic sector and residential sector in each region, and, through the comparison and discussion of the decomposition results, summarize the general impacts and differences of the multi-regional energy consumption growth mechanism. First, referring to the steps in Section 3.1.2, a LMDI decomposition calculation of energy consumption growth in each region was carried out. Secondly, combining the changes of various driving factors, through the comparison of the LMDI decomposition results of all regions, the impact of driving factors on energy consumption in multiple regions was summarized. Due to the relatively uniform changes in energy consumption in the residential sector, we omitted the discussion of each driver, respectively.
In order to avoid the impact of different energy consumption bases on the multi-regional comparison, this paper mainly discusses the multiplication results of the LMDI decomposition. In the analysis of the economic sector, first of all, the historical trend of total energy consumption and the general impact of energy consumption change in multiple regions were compared. Subsequently, special cases that did not conform to the general impact under each driving factor are discussed one by one. In each discussion, the energy consumption growth rate and the growth are ranked from high to low.
Step 3: Policy implication analysis
Combined with the research results and the existing multi-regional energy policies, the policy implications were further explored. First of all, we reviewed the formulation and actual implementation of the multi-regional energy policy objectives in the selected time period. Secondly, we compared the actual policy-making and completion with the calculation results to find out which factors cause the actual implementation to be inconsistent with the target. Finally, combined with the research in this paper and our understanding of multi-regional energy consumption, a new model of multi-regional energy policy objectives could be proposed.
In the case of China, we reviewed the formulation and actual implementation of China’s multi regional energy policy objectives during the 12th Five-Year Plan period, and compared them with our research results. The actual results show that the current multi-regional energy policy-making in China does not fully consider regional differences and the actual energy situation. Therefore, we tried to propose a more scientific and feasible policy-making model based on the EAA-LMDI method.
3.3. Data Sources
This study selects the energy consumption of China’s provinces in 2011–2016 as the research object. The energy consumption data of each province come from the energy balance table of each province in the China Energy Statistics Yearbook [67]. Population and economic data are from the National Bureau of Statistics [68]. It should be noted that, in addition to a lack of Tibetan statistical data, we found that there were problems with the power data of Guangdong Province in 2016 (the calculated power production efficiency of Guangdong Province in 2016 was 6.5%), so Guangdong was removed from the research.
4. Results and Discussion
4.1. Energy Allocation Sankey Diagram of Each Province in 2016
This study has drawn an energy allocation Sankey diagram for China’s provinces in 2016, as shown in Figure 3. See Supplementary Materials for detailed energy allocation Sankey diagrams. The energy allocation Sankey diagram contains three stages: energy supply, energy conversion, and end-use. The first stage (energy supply) shows the quantity of all primary energy available for local use, including local production and imports. The second stage (energy conversion) shows the quantity of primary energy flowing into the energy conversion and then the derived quantity of energy carriers. The third stage (end-use) shows the quantity of all energy carriers flowing into the end-use sector, and also the distribution of energy consumption responsibilities among different end-use sectors. In all stages, all energy quantities were converted into corresponding primary energy consumption responsibilities, thereby ensuring a balanced energy quantity was maintained throughout the process.
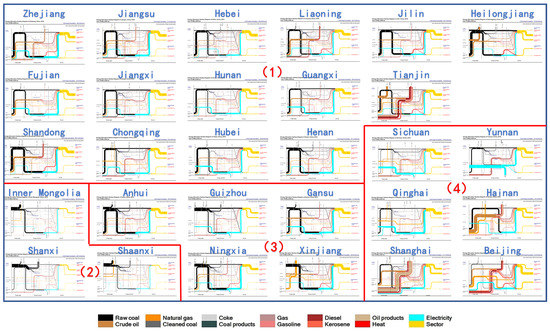
Figure 3.
Energy allocation Sankey diagrams of 29 provinces in 2016.
While most regions in China have similar structures of end-use sectors, the energy conversion process is more complicated. In this study, we mainly classified and discuss multi-regional energy systems based on the characteristics of local energy production, import, and export, which is named the “taxonomy of main energy flow characteristics”.
According to the “taxonomy of main energy flow characteristics”, energy systems in 29 provinces can be divided into four categories. In the first category, the shape of coal flow is similar to “π”—that is, coal supply depends on imports from other regions, and is mainly used in power and heat generation. Most of the provinces’ energy systems can be classified into this category, especially the eastern coastal regions. In the second category, the shape of the coal flow is similar to “┵”—that is, it has a large amount of local coal production and export to other regions. The energy systems of several major coal-producing provinces conform to this pattern, including Shanxi, Shaanxi, and Inner Mongolia. In the third category, the shape of coal flow is similar to “Z”—that is to say, self-sufficiency is basically realized through the local production of coal, and the quantity of coal import and export is relatively small compared with local production and consumption. The energy systems of Anhui, Guizhou, Xinjiang, Ningxia, and Gansu conform to this pattern. In the fourth category, some provinces have only a small quantity of coal production and consumption, and other energy types occupy the main position. For example, Beijing has a larger proportion of natural gas and electricity, Shanghai and Hainan have a larger proportion of oil products, and Sichuan, Yunnan, and Qinghai have a larger proportion of hydropower.
According to this classification, considering that coal is the main source of China’s carbon emissions, energy consumption in regions with a high coal dependence should be given priority. Eight regions in categories (2) and (3) are the main export areas of China’s coal, and also consume a large amount of coal, so they need to be controlled first. Some regions in category (1), such as Hebei, Jilin, Shandong, and Henan, also have high coal dependence, and should also be key areas of energy consumption control. The regions in category (4) have a lower carbon energy structure, which can temporarily reduce the priority of energy consumption control in these areas.
4.2. LMDI Decomposition of Energy Consumption Growth in the Economic Sector
In this section, we calculated the LMDI decomposition results of energy consumption in China’s 29 provinces’ economic sectors from 2011 to 2016. Figure 4 and Figure 5 show the additive decomposition results and multiplicative decomposition results of LMDI, respectively, with different colors indicating the quantitative influence of various driving factors to energy consumption growth. In Figure 4, all provinces are ranked from left to right following the total amount of energy consumption growth, as indicated by the red points. In Figure 5, all provinces are ranked from left to right following the growth rate of energy consumption.
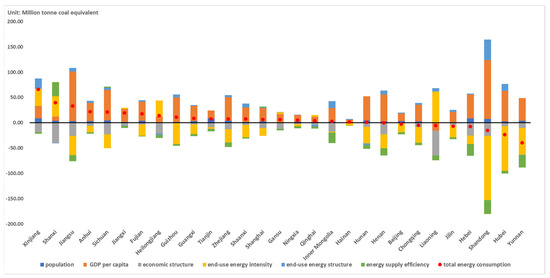
Figure 4.
LMDI additive decomposition results of total energy consumption growth in economic sector of 29 provinces from 2011 to 2016 (unit: Mtce). (note: Each column in the figure represents the amount of energy consumption growth caused by different driving factors. The red dots represent the total quantity of energy consumption growth in the economic sector.)
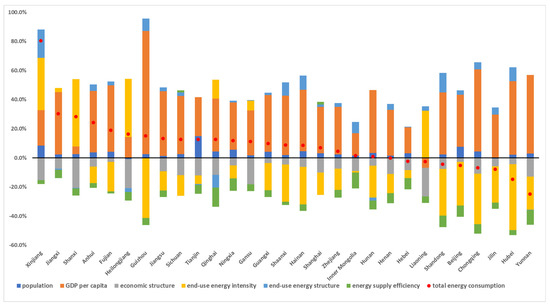
Figure 5.
LMDI multiplicative decomposition results of total energy consumption in economic sector of 29 provinces from 2011 to 2016. (note: Each column in the figure represents the proportion of energy consumption growth caused by different driving factors. The red dots represent the total proportion of energy consumption growth in the economic sector.)
4.2.1. The General Impact of Each Driving Factor
Table 4 shows the general impact of each driving factor on energy consumption growth in the economic sector. The results revealed that, of the 29 regions, there are 20 that have increased their energy consumption in the economic sector. Of all the driving factors, GDP per capita has played the most significant role. Over the past five years, the growth rate of China’s GDP per capita has remained above 6.2% every year. Rapid economic growth has led to a greater energy demand, which is the most important reason for the energy consumption growth of the economic sector in most provinces. Population and end-use energy structure are two other important driving factors of energy consumption growth. In the past five years, China’s population growth rate has remained around 0.5%, which has led to increased energy demand. The adjustment of end-use energy structure mainly refers to the use of electricity and heat in the terminal to replace coal-based primary energy. As the electricity needs to bear more primary energy consumption responsibility, some provinces eventually consume more primary energy. The growth of the population and the economy is inevitable for China, which is still developing, but the adjustment of an end-use energy structure can lead to cleaner energy utilization and less environmental pollution. However, the increase in energy consumption caused by these three driving factors is inevitable.

Table 4.
General impact of each driving factor on energy consumption growth in the economic sector.
On the other hand, most provinces are curbing the growth of energy consumption by improving the economic structure, end-use energy intensity, and energy supply efficiency. China is reducing the proportion of the secondary industry in the economic structure and providing more support for the development of tertiary industry, such as the Internet and the financial industry. As the end-use energy intensity of the tertiary industry is significantly lower than that of secondary industry, this adjustment can effectively reduce energy consumption. At the same time, across both secondary and tertiary industries, China is trying to promote structural adjustment and the upgrading of industry, reduce the production of products with high energy consumption and low added value, and turn to the production of goods with higher economic value, so as to effectively improve end-use energy intensity. Each region is also continuously upgrading technology and equipment to improve the energy supply efficiency of the whole energy system, which also makes a contribution to reducing energy consumption.
4.2.2. The Special Cases of Each Driving Factor
In the vast majority of regions, China’s population is still growing, resulting in the growth of energy consumption, as is shown in Figure 6. However, the population of Northeast China (Heilongjiang, Jilin, and Liaoning) has declined over the past five years, resulting in a decrease in energy consumption, which is not consistent with the overall trend of population growth in China. Due to the sustained low economic growth, the loss of population in Northeast China has become a trend that cannot be ignored, though it actually reduced energy consumption.
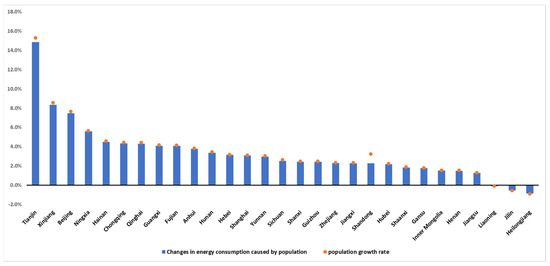
Figure 6.
LMDI multiplication decomposition results of energy consumption growth caused by population in the economic sector in 2011–2016.
The vast majority of regions have maintained rapid economic growth, resulting in a significant increase in energy consumption as is shown in Figure 7. However, similar to the population, the growth rate of GDP per capita in Liaoning Province over these five years was negative, resulting in a reduction in energy consumption. The decline in the region’s population and GDP per capita also reflects the relatively poor development of the region.
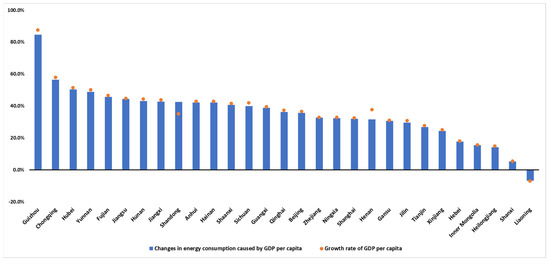
Figure 7.
LMDI multiplication decomposition results of energy consumption growth caused by GDP per capita in the economic sector in 2011–2016.
As is shown in Figure 8, the adjustment of economic structure has reduced energy consumption in most provinces. China is transforming its economic structure from the secondary industry to the tertiary industry. As the tertiary industry has lower energy intensity, this adjustment has greatly reduced energy consumption.
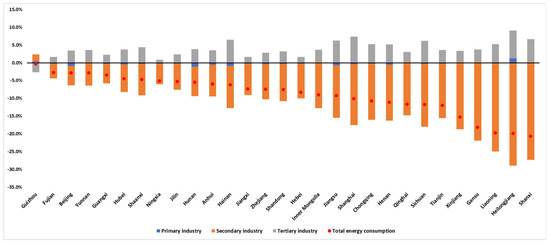
Figure 8.
LMDI multiplication decomposition results of energy consumption growth caused by economic structure in the economic sector in 2011–2016.
The only one that does not conform to the general impact of economic structure is Guizhou. On the one hand, the proportion of the secondary industry in Guizhou has increased, which may be related to industrial transfers; on the other hand, the energy intensity of the secondary industry in Guizhou has declined significantly, which means the increase in the proportion of secondary industry has not caused a major energy consumption increase. Therefore, the comprehensive impact of Guizhou’s economic structure is a slight decline in total energy consumption.
With the continuous industrial restructuring, technological improvement and policy support, most regions have achieved remarkable results in reducing energy intensity, as is shown in Figure 9. The reduction in energy intensity plays a great role in restraining the growth of energy consumption.
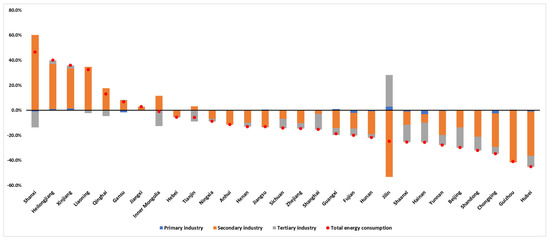
Figure 9.
LMDI multiplication decomposition results of energy consumption growth caused by end-use energy intensity in the economic sector in 2011–2016.
However, the adjustment of end-use energy intensity in seven provinces has restrained the growth of energy consumption. Through analysis and discussion, we think these provinces can be divided into two situations. For the provinces such as Liaoning and Heilongjiang, the decrease in economic benefits leads to an increase in terminal energy intensity (the reduction in product added value per unit end-use energy consumption). In provinces such as Shanxi and Xinjiang, which are relatively rich in minerals and resources, there are some high-energy-consumption industries, resulting in the enhancement of the end-use energy intensity. In other words, the improvement of energy intensity in Shanxi and Xinjiang is mainly due to the influence of national industrial transfer policy.
In most regions, replacing coal with electricity is a major trend due to the country’s clean energy strategy, as is shown in Figure 10. Due to the energy loss in the process of power generation, electricity needs to bear more responsibility for primary energy consumption, which leads to increases in energy consumption. However, the adjustment of end-use energy structure in six provinces has restrained the growth of energy consumption. The decline in the proportion of electric consumption is the most important factor in the decrease in energy consumption, because electric power consumption needs to bear more primary energy consumption responsibility, followed by heat and oil products.
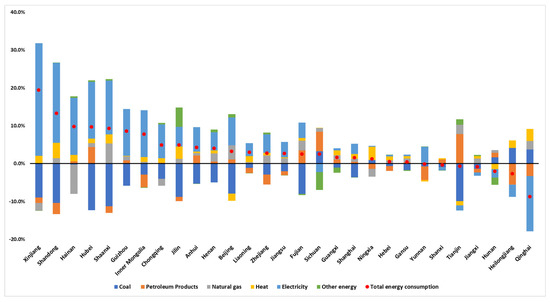
Figure 10.
LMDI multiplication decomposition results of energy consumption growth caused by end-use energy structure in the economic sector in 2011–2016.
As is shown in Figure 11, the improvement in energy supply efficiency mainly comes from electric power production, followed by heat. Shanghai is the only region where electric supply efficiency is reduced. For Shanghai, we do not think that the decrease in efficiency is due to a change of technology or equipment, because the technology and equipment in Shanghai remain at a high level. We believe that the decrease in electric conversion efficiency in Shanghai is due to the shortage of generation hours. The shortage of generation hours means that the high-efficiency capacity cannot be fully utilized and the power generation equipment will start and stop frequently, which leads to a reduction in efficiency.
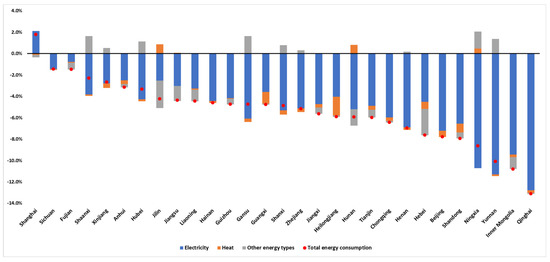
Figure 11.
LMDI multiplication decomposition results of energy consumption growth caused by energy supply efficiency in the economic sector in 2011–2016.
4.3. LMDI Decomposition of Energy Consumption Growth in the Residential Sector
Compared with the economic sector, the impact of energy consumption change in the residential sector is relatively simple. Figure 12 and Figure 13 show the addition decomposition and multiplication decomposition results, respectively, of LMDI.
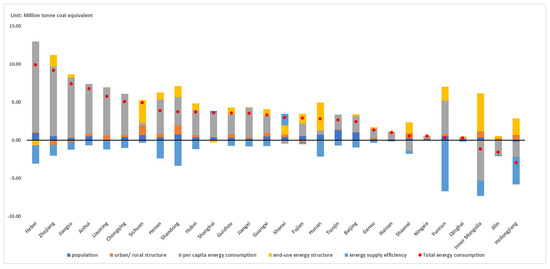
Figure 12.
LMDI additive decomposition results of total energy consumption in the residential sector of 29 provinces from 2011 to 2016 (unit: Mtce). (note: Each column in the figure represents the quantity of energy consumption growth caused by different driving factors. The red dots represent the total quantity of energy consumption growth in the residential sector).
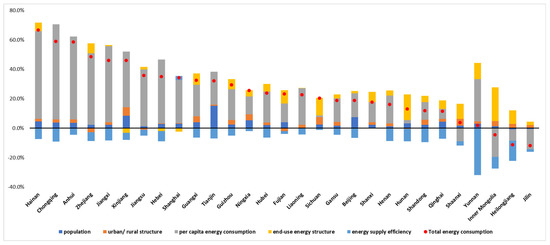
Figure 13.
LMDI multiplicative decomposition results of total energy consumption in the residential sector of 29 provinces from 2011 to 2016 (unit: Mtce). (note: Each column in the figure represents the proportion of energy consumption growth caused by different driving factors. The red dots represent the total proportion of energy consumption growth in the residential sector).
In 26 out of 29 provinces, energy consumption in the residential sector has increased, as is shown in Table 5. After the LMDI addition decomposition, the three provinces with the highest energy consumption growth were found to be Hebei, Zhejiang, and Jiangsu. After the LMDI multiplication decomposition, the three provinces with the fastest growth in energy consumption were found to be Hainan, Chongqing, and Anhui. Among all the driving factors, the impact of per capita energy consumption is the most obvious, which also came from the improvement in living standards over the last five years. In addition, the increase in population, the promotion of urbanization, and the promotion of clean energy utilization also lad to a growth in energy consumption in the residential sector. Only the energy supply efficiency can restrain energy consumption growth.

Table 5.
General impact of each driving factor on energy consumption growth in the residential sector.
Special cases that do not conform to the general impact include the following: (1) The decrease in population in Heilongjiang, Jilin, and Liaoning restrained the growth of energy consumption. (2) The decrease in urbanization rates in Zhejiang and Fujian led to lower energy consumption. The urbanization rate of these two provinces was mainly affected by the national household registration policy. Many migrant workers chose to move their household registration back to the countryside. (3) The per capita energy consumption of Heilongjiang, Jilin, Inner Mongolia, and Shanxi decreased. These areas reduced their per capita energy consumption by promoting central heating instead of bulk coal combustion. (4) The adjustment of end-use energy structure in Xinjiang, Hebei, and Shanghai resulted in a decrease in energy consumption. The share of electricity and heat consumption in these three provinces declined, while the share of fossil energy consumption (Xinjiang’s oil products and natural gas, Hebei’s raw coal, and Shanghai’s oil products) increased. (5) The decrease in electric supply efficiency in Shanghai resulted in more energy consumption.
4.4. Policy Implication Analysis
4.4.1. Formulation and Completion of Existing Policy Objectives
In order to corroborate the results of this study, this article investigates the achievement of energy policy targets in each region during the 12th Five-Year Plan period (2011–2015). The 12th Five-Year Policy targets of each region were primarily concerned with GDP growth rate and energy intensity, as shown in Table 6.

Table 6.
Policy targets and actual implementation of the 12th Five-Year Plan for each province.
Compared with the economic target, the energy intensity target did not fully take into account the actual situation in the region, but it only slightly fluctuated according to the overall national target. Energy intensity reduction targets in 26 provinces were in the range of 15–17%. At the same time, the differences in terms of the actual achievement of the energy intensity targets were significantly greater than the differences in the targets themselves.
According to the actual achievement of economic and energy intensity targets, the provinces can be divided into three categories for discussion:
- (1)
- Simultaneously achieved economic growth and energy intensity reduction targets—15 provinces: Tianjin, Jilin, Zhejiang, Anhui, Fujian, Shandong, Henan, Hubei, Hunan, Guangdong, Guangxi, Chongqing, Guizhou, Yunnan, and Qinghai. According to the decomposition results of LMDI, the decrease in energy intensity in these regions largely offset the increase in energy consumption brought about by economic growth, thus inhibiting the growth of energy consumption.
- (2)
- Achieved energy intensity reduction targets but failed to meet economic targets—15 provinces: Beijing, Hebei, Inner Mongolia, Liaoning, Heilongjiang, Shanghai, Jiangsu, Jiangxi, Hainan, Sichuan, Shaanxi, Gansu, and Ningxia (Ningxia’s energy intensity did not include the coal chemical project in eastern Ningxia). Judging from the decomposition results of LMDI, these regions put more effort into the adjustment of industrial structure, which may have affected the economic growth to a certain extent. In addition, in our calculations, Liaoning and Heilongjiang did not meet their energy intensity reduction targets. After inspection, we found that, from 2015 to 2016, Liaoning’s GDP decreased by 22.4%, and Heilongjiang’s GDP remained basically unchanged, which may be related to changes in the caliber of data statistics. The underlying data issues make our calculations somewhat different from the energy intensity data published by the country.
- (3)
- Unmet energy intensity reduction targets: Shanxi and Xinjiang. Both regions are important energy bases for China. While undertaking energy production tasks, many high-energy-consuming industries have also grown up in these two regions, resulting in high energy intensity. Combined with the results of LMDI decomposition, Xinjiang and Shanxi’s economic sector’s energy consumption growth ranks in the top two in the country, and changes in energy intensity resulted in more energy consumption, which is also consistent with the completion of the target.
Compared with the 12th Five-Year Plan, the 13th Five-Year Plan of each region simultaneously gives the control targets of economic growth, energy intensity reduction, and total energy consumption growth. Among them, the policy targets of most regions are not in strict accordance with the general formula of “energy consumption = GDP * energy intensity”. On the one hand, this shows that each region has a more positive attitude and higher expectations for the “dual control” policy, but on the other hand, it also reflects the lack of a scientific basis to the formulation of regional policy targets. In addition, there are 28 provinces whose energy intensity reduction targets were between 14% and 17%. Therefore, it can be considered that the regional differences in energy intensity reduction targets are still not fully considered.
4.4.2. Suggestions on Scientific Formulation of China’s Multi-Regional “Dual Control” Policy Targets
In this study, we also provide a new idea for how to scientifically formulate China’s multiregional energy “dual control” targets. In this study, population, GDP per capita, economic structure, end-use energy intensity, end-use energy structure, and energy supply efficiency are considered the main driving factors. We can express energy consumption by using the following formula:
energy consumption = population * GDP per capita * economic structure * end-use energy intensity * end-use energy structure * energy supply efficiency
Therefore, each region can take corresponding measures according to its own situation around the above driving factors. For example, in more developed provinces, the number of migrants needs to be controlled. Several important energy bases, such as Xinjiang and Shanxi, need to improve the supply efficiency of the energy system. Provinces with more heavy industry can pay more attention to end-use energy saving and improve their end-use energy intensity. For provinces rich in renewable energy, optimizing the energy consumption structure and increasing the proportion of no fossil energy are important development directions for the energy system.
In addition to the driving factors, another consideration is the taxonomy of main energy flow characteristics. For regions with a higher proportion of coal, such as the eight areas belonging to categories (2) and (3) in Section 4.1, reducing energy consumption will be more helpful for reducing carbon emissions. Therefore, these areas should adopt more stringent energy-saving policies. For regions that have only a small quantity of coal production and consumption, such as the six areas belonging to category (4) in Section 4.1, relatively loose energy consumption control policies can be adopted. In these regions, the proportion of renewable energy is relatively high, and the increase in energy consumption will not significantly increase the carbon emissions. These regions can even encourage energy consumption to stimulate the consumption of renewable energy.
Future energy policy targets can also be set based on these driving factors. Compared with energy consumption, driving factors are better regulated and their future targets are easier to achieve. According to the development of the regional economy and energy, policy targets can be set for each driving factor separately. The “dual control” targets are determined based on the targets of these driving factors. The characteristics of main energy flow can be used as a reference for judging the priority of controlling energy consumption in different regions. If it is necessary to adjust the established targets, we can take appropriate methods and policies for each driving factor and adjust the changes expected in them so as to achieve the adjustment of the “dual control” targets. Compared with the existing policy-making methods, this idea can better reflect the actual situation in each region, and has a more scientific basis.
5. Limitations and Uncertainties
There are still some limitations and uncertainties in this study, including the limitations of the paradigm itself and the particularity of the case of China.
- (1)
- This paradigm is based on the EAA-LMDI method. Although the method has the advantages of high resolution, some factors that need to be considered in policy are not included (resource availability is not considered, policy is not quantitative enough, and no fossil energy proportion factor is not introduced in LMDI).
- (2)
- The method to decide “taxonomy of main energy flow characteristics” is not accurate enough. In China, the problem of coal is prominent, but other countries may not have a similar situation. Therefore, the determination and analysis of this characteristic value may need further improvement.
- (3)
- The resolution of end-use consumption is not high enough. Compared with the continuous growth of China’s energy consumption, energy consumption has remained stable in many countries and regions. Policymakers are more concerned with the distribution of energy consumption in the end-use sector, and need to analyze and discuss a higher resolution of end-use energy consumption.
- (4)
- A few provinces are not included. For example, Guangdong is not included in the research because of data errors, and Tibet lacks sufficient energy data. In the future, we can consider how to deal with an incorrect energy balance table and strengthen the research on Tibet.
- (5)
- The policy analysis section is relatively rough and needs further improvement.
6. Conclusions and Recommendations for Future Research
Based on the EAA-LMDI method, this study established a standard paradigm to analyze the growth mechanism of multi-regional energy consumption, and adopted it to analyze the status quo and historical trend of China’s multi-regional energy system and energy consumption in 2011–2016. By drawing energy allocation Sankey diagrams of 29 provinces in 2016, we showed the status quo of the energy system in each province, and highlighted the main characteristics of the energy system in each province based on the “taxonomy of main energy flow characteristics”. Based on the LMDI method, we decomposed the influence of driving factors on energy consumption of 29 provinces in 2011–2016, and summarized the energy consumption growth mechanism of each driving factor in different regions. We also discussed the existing “dual control” targets, and put forward a new way to formulate the “dual control” objectives of each region in the future.
The results show that this paradigm can be effectively used in China’s multiregional energy consumption research; the main findings include:
- (1)
- According to the shape of coal flow, China’s provinces can be divided into four categories. The shape of coal flow in most provinces is similar to “π”, and provinces with coal flow shape similar to “┵” and “Z” should be priority regions for energy consumption control.
- (2)
- The most important driving factor to promote the growth of energy consumption is GDP per capita, followed by population and end-use energy structure. The main factors that restrain the growth of energy consumption are the economic structure and end-use energy intensity, followed by energy supply efficiency. Compared with the improvement of energy supply efficiency, the decrease in end-use energy intensity has a more obvious effect on reducing energy consumption. The adjustment of the end-use energy structure (mainly by replacing coal with electricity) and the improvement of residents’ living standards lead to more energy consumption.
- (3)
- The energy intensity of the secondary industry in some resource-rich areas and old industrial bases has increased, resulting in a significant increase in energy consumption. Fewer generation hours in some provinces affects the efficiency of electricity conversion, resulting in more energy consumption.
- (4)
- The formulation of China’s regional energy policy targets during the 12th and 13th Five-Year-Plan periods did not fully consider the differences in energy consumption among regions. For the formulation of the multiregional “dual control” target, the development targets of the main driving factors can be determined first, and then the “dual control” policy targets are determined by the targets of the driving factors.
The core value of our work is to establish a framework that can analyze multi-regional energy consumption with high resolution, and provide research ideas for relevant researchers. Although we take China as a case study, this framework can also be applied to other regions in the world. This work can also provide reference for energy policy makers. We put forward the following policy recommendations for the formulation of China’s multi-regional energy policy targets:
- (1)
- Strengthen the linkage between energy policy-making and other policy-making. Energy consumption is deeply affected by population, economic development, industrial structure and other factors. When formulating policies on population, economy and industry, the impact on energy consumption should be fully considered. Meanwhile, it is also necessary to verify whether the formulated energy policy targets can meet the development needs of the main driving factors. Furthermore, the adjustment of the policy targets is necessary when faced with conflict.
- (2)
- The taxonomy of main energy flow characteristics can be used as a reference to determine the priority of controlling regional energy consumption. The regions with a higher proportion of coal production and consumption, such as the eight areas belonging to categories (2) and (3) in Section 4.1, should be the priority regions of energy consumption control and adopt more stringent energy-saving policies. The regions with a small quantity of coal production and consumption, such as the six areas belonging to category (4) in Section 4.1, can, relative to the regions with higher coal use, loosen the control of total energy consumption and encourage the development of non-fossil energy.
There are still some limitations and uncertainties in this paradigm that need to be further improved, as mentioned in Section 5. Moreover, the impact of energy trade between different regions on energy consumption is not fully considered. Therefore, in future research we will try to build a regional energy trade network, and find appropriate methods to analyze the impact of energy trade on regional energy consumption.
Supplementary Materials
The following are available online at https://www.mdpi.com/2071-1050/13/3/1093/s1, Figure S1: The legend of energy varieties in energy allocation Sankey diagrams. Figure S2: Energy allocation Sankey diagram of Zhejiang in 2016. Figure S3: Energy allocation Sankey diagram of Jiangsu in 2016. Figure S4: Energy allocation Sankey diagram of Hebei in 2016. Figure S5: Energy allocation Sankey diagram of Liaoning in 2016. Figure S6: Energy allocation Sankey diagram of Jilin in 2016. Figure S7: Energy allocation Sankey diagram of Heilongjiang in 2016. Figure S8: Energy allocation Sankey diagram of Fujian in 2016. Figure S9: Energy allocation Sankey diagram of Jiangxi in 2016. Figure S10: Energy allocation Sankey diagram of Hunan in 2016. Figure S11: Energy allocation Sankey diagram of Guangxi in 2016. Figure S12: Energy allocation Sankey diagram of Tianjin in 2016. Figure S13: Energy allocation Sankey diagram of Shandong in 2016. Figure S14: Energy allocation Sankey diagram of Chongqing in 2016. Figure S15: Energy allocation Sankey diagram of Hubei in 2016. Figure S16: Energy allocation Sankey diagram of Henan in 2016. Figure S17: Energy allocation Sankey diagram of Inner Mongolia in 2016. Figure S18: Energy allocation Sankey diagram of Shanxi in 2016. Figure S19: Energy allocation Sankey diagram of Shaanxi in 2016. Figure S20: Energy allocation Sankey diagram of Anhui in 2016. Figure S21: Energy allocation Sankey diagram of Guizhou in 2016. Figure S22: Energy allocation Sankey diagram of Gansu in 2016. Figure S23: Energy allocation Sankey diagram of Ningxia in 2016. Figure S24: Energy allocation Sankey diagram of Xinjiang in 2016. Figure S25: Energy allocation Sankey diagram of Sichuan in 2016. Figure S26: Energy allocation Sankey diagram of Yunnan in 2016. Figure S27: Energy allocation Sankey diagram of Qinghai in 2016. Figure S28: Energy allocation Sankey diagram of Hainan in 2016. Figure S29: Energy allocation Sankey diagram of Shanghai in 2016. Figure S30: Energy allocation Sankey diagram of Beijing in 2016.
Author Contributions
Conceptualization, Y.Z. and L.M.; methodology, Y.Z.; software, Y.Z. and C.H.C.; validation, G.K., C.H.C., and L.M.; formal analysis, Y.Z.; investigation, Y.Z.; resources, L.M.; data curation, Y.Z.; writing—original draft preparation, Y.Z.; writing—review and editing, L.M.; visualization, Y.Z.; supervision, Z.L. and W.N.; project administration, G.K. All authors have read and agreed to the published version of the manuscript.
Funding
This research was funded by the National Natural Science Foundation of China (grant number 71690245), and a consulting project of the Chinese Academy of Engineering: “Promoting the revolution of energy production and consumption (2035)” (grant number 2018-ZD-11).
Institutional Review Board Statement
This study did not require ethical approval.
Informed Consent Statement
Not applicable.
Data Availability Statement
All data are available in the public domain.
Acknowledgments
The authors acknowledge the financial support from the Rio Tinto Group in the context of the Tsinghua–Rio Tinto Joint Research Center for Resources, Energy and Sustainable Development, State Key Laboratory of Power Systems, Department of Energy and Power Engineering, Tsinghua-BP Clean Energy Research and Education Centre.
Conflicts of Interest
The authors declare no conflict of interest.
Abbreviations
| LMDI | The logarithmic mean Divisia index I; |
| EAA | Energy allocation analysis; |
| GHG | Greenhouse gas; |
| MRIO | Multi-regional input–output methods; |
| IDA | Index decomposition analysis; |
| EAA-LMDI | The logarithmic mean Divisia index I decomposition method based on energy allocation analysis; |
| KPECR | The primary energy consumption responsibility conversion factor; |
| SDA | Structural Decomposition Analysis; |
| Subscript i | Economic subsector i involved during the LMDI decomposition of energy consumption growth in economic sector, including primary industry, secondary industry and tertiary industry/area i involved during the LMDI decomposition of residential energy consumption growth, including urban areas or rural areas; |
| Subscript j | Energy type j; |
| The primary energy quantity conversion factor of the regional secondary energy j after the correction of the import impact; | |
| The primary energy quantity conversion factor of the external secondary energy j; | |
| Energy expressed in the form of standard quantity; | |
| Energy expressed in the form of primary energy consumption responsibility; | |
| Quantity of energy produced locally in standard quantity; | |
| Quantity of imported energy in standard quantity; | |
| P | Population; |
| GDP | Gross domestic product; |
| GDPi | Value added within economic subsector i; |
| ESQ,i | Total energy consumption of economic subsector i expressed in standard quantity form during the LMDI decomposition of energy consumption growth in economic sector/total energy consumption of area i expressed in standard quantity form during the LMDI decomposition of residential energy consumption growth; |
| ESQ,ij | Energy type j consumption expressed in standard quantity form in the economic subsector i during the LMDI decomposition of energy consumption growth in economic sector/energy type j consumption expressed in standard quantity form of area i during the LMDI decomposition of residential energy consumption growth. |
References
- IPCC Special Report: Global Warming of 1.5 °C. Available online: https://www.ipcc.ch/sr15/chapter/spm/ (accessed on 28 November 2020).
- Sher, F.; Iqbal, S.Z.; Albazzaz, S.; Ali, U.; Mortari, D.A.; Rashid, T. Development of biomass derived highly porous fast adsorbents for post-combustion CO2 capture. Fuel 2020, 282, 118506. [Google Scholar] [CrossRef]
- Abu Hassan, M.H.; Sher, F.; Zarren, G.; Suleiman, N.; Tahir, A.A.; Snape, C.E. Kinetic and thermodynamic evaluation of effective combined promoters for CO2 hydrate formation. J. Nat. Gas Sci. Eng. 2020, 78, 103313. [Google Scholar] [CrossRef]
- Molina-Moreno, V.; Núñez-Cacho Utrilla, P.; Cortés-García, F.J.; Peña-García, A. The Use of Led Technology and Biomass to Power Public Lighting in a Local Context: The Case of Baeza (Spain). Energies 2018, 11, 1783. [Google Scholar] [CrossRef]
- Chen, X.; Wang, G.; Guo, X.; Fu, J. An Analysis Based on SD Model for Energy-Related CO2 Mitigation in the Chinese Household Sector. Energies 2016, 9, 1062. [Google Scholar] [CrossRef]
- Li, H.; Mu, H.; Zhang, M. Analysis of China’s energy consumption impact factors. Procedia Environ. Sci. 2011, 11, 824–830. [Google Scholar] [CrossRef]
- Hao, Y.; Wang, L.; Lee, C. Financial development, energy consumption and China’s economic growth: New evidence from provincial panel data. Int. Rev. Econ. Financ. 2018, 69, 1132–1151. [Google Scholar] [CrossRef]
- Akkemik, K.A.; Göksal, K.; Li, J. Energy consumption and income in Chinese provinces: Heterogeneous panel causality analysis. Appl. Energy 2012, 99, 445–454. [Google Scholar] [CrossRef]
- Wang, S.; Zhou, C.; Li, G.; Feng, K. CO2, economic growth, and energy consumption in China’s provinces: Investigating the spatiotemporal and econometric characteristics of China’s CO2 emissions. Ecol. Indic. 2016, 69, 184–195. [Google Scholar] [CrossRef]
- Nan, Y.; Gao, Y. Statistical and econometric analysis of the impact of China’s energy, environment on the economic development. Energy Procedia 2011, 5, 2358–2362. [Google Scholar]
- Pokharel, S. An econometric analysis of energy consumption in Nepal. Energy Policy 2007, 35, 350–361. [Google Scholar] [CrossRef]
- Du, K.; Lin, B. Understanding the rapid growth of China’s energy consumption: A comprehensive decomposition framework. Energy 2015, 90, 570–577. [Google Scholar] [CrossRef]
- Chong, C.; Ma, L.; Li, Z.; Ni, W.; Song, S. Logarithmic mean Divisia index (LMDI) decomposition of coal consumption in China based on the energy allocation diagram of coal flows. Energy 2015, 85, 366–378. [Google Scholar] [CrossRef]
- Chong, C.; Liu, P.; Ma, L.; Li, Z.; Ni, W.; Li, X.; Song, S. LMDI decomposition of energy consumption in Guangdong Province, China, based on an energy allocation diagram. Energy 2017, 133, 525–544. [Google Scholar] [CrossRef]
- Chong, C.H.; Tan, W.X.; Ting, Z.J.; Liu, P.; Ma, L.; Li, Z.; Ni, W. The driving factors of energy-related CO2 emission growth in Malaysia: The LMDI decomposition method based on energy allocation analysis. Renew. Sustain. Energy Rev. 2019, 115, 109356. [Google Scholar] [CrossRef]
- BP World Energy Statistical Yearbook. Available online: https://www.bp.com/content/dam/bp/country-sites/zh_cn/china/home/reports/statistical-review-of-world-energy/2019/2019srbook.pdf (accessed on 26 November 2020).
- Li, Z.; Pan, L.; Fu, F.; Liu, P.; Ma, L.; Amorelli, A. China’s regional disparities in energy consumption: An input-output analysis. Energy 2014, 78, 426–438. [Google Scholar] [CrossRef]
- Outline of the Thirteenth Five Year Plan for National Economic and Social Development in People’s Republic of China. Available online: http://www.ndrc.gov.cn/zcfb/zcfbghwb/201603/P020160318573830195512.pdf (accessed on 15 November 2020).
- National Development and Reform Commission: 13th Five-Year Plan for Energy Development. Available online: http://www.ndrc.gov.cn/zcfb/zcfbtz/201701/W020170117335278192779.pdf (accessed on 27 November 2020).
- National Development and Reform Commission: Revolutionary Strategy of Energy Production and Consumption (2016–2030). Available online: http://www.ndrc.gov.cn/zcfb/zcfbtz/201704/W020170425509386101355.pdf (accessed on 27 November 2020).
- General Office of the State Council: 2014–2015 Energy Conservation and Emission Reduction Low Carbon Development Action Plan. Available online: http://www.gov.cn/xinwen/2014-05/26/content_2686898.htm (accessed on 26 November 2020).
- Li, Y.; Sun, L.; Zhang, H.; Liu, T.; Fang, K. Does industrial transfer within urban agglomerations promote dual control of total energy consumption and energy intensity? J. Clean. Prod. 2018, 204, 607–617. [Google Scholar] [CrossRef]
- Lan, J.; Malik, A.; Lenzen, M.; McBain, D.; Kanemoto, K. A structural decomposition analysis of global energy footprints. Appl. Energy 2016, 163, 436–451. [Google Scholar] [CrossRef]
- Hong, J.; Shen, G.Q.; Guo, S.; Xue, F.; Zheng, W. Energy use embodied in China’s construction industry: A multi-regional input–output analysis. Renew. Sustain. Energy Rev. 2016, 53, 1303–1312. [Google Scholar] [CrossRef]
- Mi, Z.; Meng, J.; Guan, D.; Shan, Y.; Liu, Z.; Wang, Y.; Feng, K.; Wei, Y. Pattern changes in determinants of Chinese emissions. Environ. Res. Lett. 2017, 12, 074003. [Google Scholar] [CrossRef]
- White, D.J.; Hubacek, K.; Feng, K.; Sun, L.; Meng, B. The Water-Energy-Food Nexus in East Asia: A tele-connected value chain analysis using inter-regional input-output analysis. Appl. Energy 2018, 210, 550–567. [Google Scholar] [CrossRef]
- Duan, C.; Chen, B. Analysis of global energy consumption inequality by using Lorenz curve. Energy Procedia 2018, 152, 750–755. [Google Scholar] [CrossRef]
- Li, Y.L.; Chen, B.; Chen, G.Q. Carbon network embodied in international trade: Global structural evolution and its policy implications. Energy Policy 2020, 139, 111316. [Google Scholar] [CrossRef]
- Xia, X.H.; Chen, B.; Wu, X.D.; Hu, Y.; Liu, D.H.; Hu, C.Y. Coal use for world economy: Provision and transfer network by multi-region input-output analysis. J. Clean. Prod. 2017, 143, 125–144. [Google Scholar] [CrossRef]
- Guo, S.; Li, Y.; Hu, Y.; Xue, F.; Chen, B.; Chen, Z. Embodied energy in service industry in global cities: A study of six Asian cities. Land Use Policy 2020, 91, 104264. [Google Scholar] [CrossRef]
- Chen, B.; Li, J.S.; Wu, X.F.; Han, M.Y.; Zeng, L.; Li, Z.; Chen, G.Q. Global energy flows embodied in international trade: A combination of environmentally extended input–output analysis and complex network analysis. Appl. Energy 2018, 210, 98–107. [Google Scholar] [CrossRef]
- Sun, X.; Li, J.; Qiao, H.; Zhang, B. Energy implications of China’s regional development: New insights from multi-regional input-output analysis. Appl. Energy 2017, 196, 118–131. [Google Scholar] [CrossRef]
- Xiao, H.; Ma, Z.; Mi, Z.; Kelsey, J.; Zheng, J.; Yin, W.; Yan, M. Spatio-temporal simulation of energy consumption in China’s provinces based on satellite night-time light data. Appl. Energy 2018, 231, 1070–1078. [Google Scholar] [CrossRef]
- Wang, X.B.; Shao, Y.F. Urbanization, energy consumption and carbon dioxide emissions in China: Based on 1995–2011 Provincial Panel Data. J. Ind. Technol. Econ. 2014, 4, 115–123. [Google Scholar]
- Liu, Y.; Xiao, H.; Lv, Y.; Zhang, N. The effect of new-type urbanization on energy consumption in China: A spatial econometric analysis. J. Clean. Prod. 2017, 163, S299–S305. [Google Scholar] [CrossRef]
- Sheng, P.; Guo, X. Energy consumption associated with urbanization in China: Efficient- and inefficient-use. Energy 2018, 165, 118–125. [Google Scholar] [CrossRef]
- Si, S.; Lyu, M.; Lawell, C.-Y.C.L.; Chen, S. The effects of energy-related policies on energy consumption in China. Energy Econ. 2018, 76, 202–227. [Google Scholar] [CrossRef]
- Ang, B.W.; Zhang, F.Q. A survey of index decomposition analysis in energy and environmental studies. Energy 2000, 25, 1149–1176. [Google Scholar] [CrossRef]
- Hoekstra, R.; van den Bergh, J.M. Comparing structural decomposition analysis and index. Energy Econ. 2003, 25, 39–64. [Google Scholar] [CrossRef]
- Su, B.; Ang, B.W. Structural decomposition analysis applied to energy and emissions: Some methodological developments. Energy Econ. 2012, 34, 177–188. [Google Scholar] [CrossRef]
- Ang, B.W. The LMDI approach to decomposition analysis: A practical guide. Energy Policy 2005, 33, 867–871. [Google Scholar] [CrossRef]
- Ang, B.W. Decomposition analysis for policymaking in energy: Which is the preferred method? Energy Policy 2004, 32, 1131–1139. [Google Scholar] [CrossRef]
- Wang, W.; Liu, X.; Zhang, M.; Song, X. Using a new generalized LMDI (logarithmic mean Divisia index) method to analyze China’s energy consumption. Energy 2014, 67, 617–622. [Google Scholar] [CrossRef]
- Sun, L.; Dong, H.; Geng, Y.; Li, Z.; Liu, Z.; Fujita, T.; Ohnishi, S.; Fujii, M. Uncovering driving forces on urban metabolism—A case of Shenyang. J. Clean. Prod. 2016, 114, 171–179. [Google Scholar] [CrossRef]
- Wang, Y.; Ge, X.; Liu, J.; Ding, Z. Study and analysis of energy consumption and energy-related carbon emission of industrial in Tianjin, China. Energy Strat. Rev. 2016, 10, 18–28. [Google Scholar] [CrossRef]
- Wang, Q.; Li, R. Drivers for energy consumption: A comparative analysis of China and India. Renew. Sustain. Energy Rev. 2016, 62, 954–962. [Google Scholar] [CrossRef]
- Lima, F.; Nunes, M.L.; Cunha, J.; Lucena, A.F.P. Driving forces for aggregate energy consumption: A cross-country approach. Renew. Sustain. Energy Rev. 2017, 68, 1033–1050. [Google Scholar] [CrossRef]
- Wang, P.; Wang, C.; Hu, Y.; Liu, Z. Analysis of energy consumption in Hunan Province (China) using a LMDI method based LEAP model. Energy Procedia 2017, 142, 3160–3169. [Google Scholar] [CrossRef]
- Lin, B.; Wang, M. Possibilities of decoupling for China’s energy consumption from economic growth: A temporal-spatial analysis. Energy 2019, 185, 951–960. [Google Scholar] [CrossRef]
- Feng, J.; Tang, S.; Yu, Z. Integrated Development of Economic Growth, Energy Consumption, and Environment Protection from Different Regions: Based on City Level. Energy Procedia 2019, 158, 4268–4273. [Google Scholar] [CrossRef]
- Li, Y.; Wang, S.; Chen, B. Driving force analysis of the consumption of water and energy in China based on LMDI method. Energy Procedia 2019, 158, 4318–4322. [Google Scholar] [CrossRef]
- Wang, Q.; Jiang, R.; Zhan, L. Is decoupling economic growth from fuel consumption possible in developing countries?—A comparison of China and India. J. Clean. Prod. 2019, 229, 806–817. [Google Scholar] [CrossRef]
- Wang, Y.; Zhu, Z.; Zhu, Z.; Liu, Z. Analysis of China’s energy consumption changing using the Mean Rate of Change Index and the logarithmic mean divisia index. Energy 2019, 167, 275–282. [Google Scholar] [CrossRef]
- Ang, B.W. LMDI decomposition approach: A guide for implementation. Energy Policy 2015, 86, 233–238. [Google Scholar] [CrossRef]
- Ma, C.; Stern, D.I. China’s changing energy intensity trend: A decomposition analysis. Energy Econ. 2008, 30, 1037–1053. [Google Scholar] [CrossRef]
- Zha, D.; Zhou, D.; Ding, N. The contribution degree of sub-sectors to structure effect and intensity effects on industry energy intensity in China from 1993 to 2003. Renew. Sustain. Energy Rev. 2009, 13, 895–902. [Google Scholar] [CrossRef]
- Zhang, M.; Li, H.; Zhou, M.; Mu, H. Decomposition analysis of energy consumption in Chinese transportation sector. Appl. Energy 2011, 88, 2279–2285. [Google Scholar] [CrossRef]
- Xu, J.; Fleiter, T.; Eichhammer, W.; Fan, Y. Energy consumption and CO2 emissions in China’s cement industry: A perspective from LMDI decomposition analysis. Energy Policy 2012, 50, 821–832. [Google Scholar] [CrossRef]
- Wu, H.; Xu, W. Cargo Transport Energy Consumption Factors Analysis: Based on LMDI Decomposition Technique. IERI Procedia 2014, 9, 168–175. [Google Scholar] [CrossRef]
- Sun, W.; Cai, J.; Mao, H.; Guan, D. Change in Carbon Dioxide (CO2) Emissions from Energy Use in China’s Iron and Steel Industry. J. Iron Steel Res. Int. 2011, 18, 31–36. [Google Scholar] [CrossRef]
- Ren, S.; Fu, X.; Chen, X. Regional variation of energy-related industrial CO2 emissions mitigation in China. China Econ. Rev. 2012, 23, 1134–1145. [Google Scholar] [CrossRef]
- Wang, Y.; Zhu, Q.; Geng, Y. Trajectory and driving factors for GHG emissions in the Chinese cement industry. J. Clean. Prod. 2013, 53, 252–260. [Google Scholar] [CrossRef]
- Jiao, J.; Qi, Y.; Cao, Q.; Liu, L.; Liang, Q. China’s targets for reducing the intensity of CO2 emissions by 2020. Energy Strategy Rev. 2013, 2, 176–181. [Google Scholar] [CrossRef]
- Lin, B.; Ouyang, X. Analysis of energy-related CO2 (carbon dioxide) emissions and reduction potential in the Chinese non-metallic mineral products industry. Energy 2014, 68, 688–697. [Google Scholar] [CrossRef]
- Cullen, J.M.; Allwood, J.M. The efficient use of energy: Tracing the global flow of energy from fuel to service. Energy Policy 2010, 38, 75–81. [Google Scholar] [CrossRef]
- Ma, L.; Allwood, J.M.; Cullen, J.M.; Li, Z. The use of energy in China: Tracing the flow of energy from primary source to demand drivers. Energy 2012, 40, 174–188. [Google Scholar] [CrossRef]
- Department of Energy Statistics, National Bureau of Statistics, People’s Republic of China. China Energy Statistical Yearbook, 1st ed.; China Statistics Press: Beijing, China, 2017.
- National Bureau of Statistics of China. Available online: http://data.stats.gov.cn/ (accessed on 20 March 2020). (In Chinese)
Publisher’s Note: MDPI stays neutral with regard to jurisdictional claims in published maps and institutional affiliations. |
© 2021 by the authors. Licensee MDPI, Basel, Switzerland. This article is an open access article distributed under the terms and conditions of the Creative Commons Attribution (CC BY) license (http://creativecommons.org/licenses/by/4.0/).