Abstract
This research assessed the shrinkage behavior of mortar containing recycled sand generated from aerated blocks and clay bricks by replacing natural sand with a volume ratio of 30%. Five mix proportions were prepared to cast mortar plate specimens. They were named as the control, ABs1, ABs2, CBs1 and CBs2. Among them, ABs1 and CBs1, containing recycled sand from aerated blocks and clay bricks respectively, have the same water/cement ratio as the control. ABs2 and CBs2 had the same workability as the control by adjusting the required amount of water. Digital image correlation (DIC) was adopted to determine the strain distribution during the plastic shrinking period. The results showed that, when no extra water was added, the mortar containing the aerated blocks sand had a lower risk of cracking, because of the internal curing effects brought by the low–weight fine aggregates. However, when the extra water was added to ensure the same fluidity with the control, there were obvious visible cracks in group ABs2, and the average distance between cracks reached 25 mm. On the contrary, the brick sand has no obviously higher water requirement, as a result, it did not lead to higher risk of cracking. The aerated block sand particles contain 2–50 μm pores, which is the reason why aerated block sand tremendously reduced the fluidity of the mortar.
1. Introduction
Because of the rapid infrastructure construction, the building materials are in great demand for the whole world. In 2017, the global construction industry consumed 40 billion tons of sand and aggregate. The consumption and exploitation of such enormous natural resources have caused irreversible damage to the environment. On the other hand, the amount of construction and demolished waste (C&D waste) reaches 8 billion tons in 2018. The dumping and landfilling for C&D waste will result in a secondary pollution [1,2].
A promising way to utilize the C&D waste is to produce aggregates from them and to replace natural stone and sand. Recycling C&D waste in the form of fine aggregates is a challenge compared to coarse aggregates because fine aggregates may pose more effects on the workability and shrinkage behavior [3,4]. Recycled sand is one of the additional supplementary cementitious materials, therefore, many researchers are incorporating recycled sand for enhancing properties of mortars and concrete [5,6].
It is even more difficult to utilize porous materials as recycled fine aggregates, such as aerated blocks and sintered clay bricks. It was reported that the waste bricks sand required a large amount of water, which implied a tremendous reduction of the workability and mechanical properties [7,8]. Researches also showed that the saturation state of the recycled sand poses a significant influence on the workability of the mortar [9,10]. Moreover, in the hardened state, the strength of the mortar is reduced due to the connected porosity, which is because the paste fractions become more porous with increased w/c ratio [11].
However, the porous lightweight aggregates can be used as an internal curing agent as they can absorb water during mixing and then gradually release the reserved water for curing purposes during the hardening process [12,13,14,15]. In addition, the rough surface of light–weight aggregates can contribute to an interlocking behavior, leading to an improvement in mechanical properties and shrinkage behavior [16]. This can be useful in influencing the material behavior during the mixing and drying process [17].
Based on the previous research mentioned in the literature, this study focuses on the utilization of recycled fine aggregates from C&D waste and provides a one step closer to the sustainable future. It also promotes the use of the recycled fine aggregates in concrete production in order to reduce the consumption of natural materials which are non–renewable and also provides quantitative information to understand the shrinkage and its crack behaviors.
When the recycled sand is used as a replacement for natural sand in cementitious materials, it may pose effects on the effective water binder ratio and the bleeding speed. Therefore, the actual trigger mechanism of plastic cracking in case of the highly porous materials is unknown. Motivated by this, current researches to explore the use of the recycled sand from aerated blocks and clay bricks attracts increasing interests. There are few studies on the influence of aerated blocks sand and clay bricks sand on the shrinking performance of cement–based composites. The results found in this study provide quantitative information to understand the shrinkage and its trigger mechanisms.
2. Materials and Methods
2.1. Materials
An impact crusher was adopted for the production of the recycled sand from waste aerated blocks (ABs) and clay bricks (CBs). Then, standard sieves, including 0.075, 0.15, 0.3, 0.6, 1.18, 2.36 and 4.75 mm, were used to separate the recycled sand into different grain sizes. The grain size distribution of the recycled sand used in the mixes was adjusted the same as the river sand, whose grain size distribution is shown in Figure 1. The basic physical properties of ABs sand and CBs sand are shown in Table 1. It can be seen from Table 1 that the bulk density of the CBs sand is almost twice that of the ABs sand. A small difference can be seen in the apparent density, whereas the water absorption of ABs sand is 34.64%, which is about 17 times of that of the river sand, showing the ABs sand possess higher voids in the micro–structure of the grains. This higher porosity is responsible for a higher water absorption.
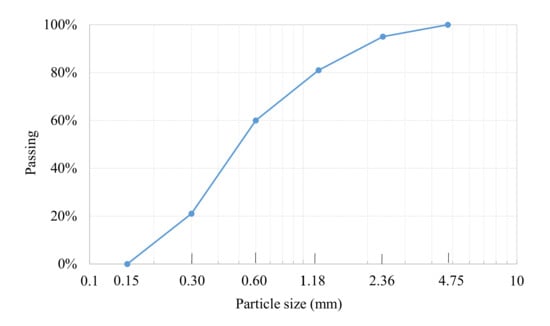
Figure 1.
Grain size distribution of river sand and recycled sand.

Table 1.
Physical properties of ABs sand, CBs sand and river sand.
A standard Type–42.5 cement confirming to Chinese standard GB175–2007 [18] was used to cast mortar with ABs sand and CBs sand. The sieved dry river sand along with tap water was also used for the production of the mortar.
In order to understand the chemical composition of the ABs and CBSs sand, X-ray Fluorescence tests (XRF) were conducted and the obtained results are shown in Table 2. From Table 2, it can be observed that ABs sand and CBs sand have similar chemical composition. Natural sand has a higher content of silica, which is 70.09%.
Table 2.
Chemical composition (wt, %).
2.2. Experimental Design
Five mix proportions (Table 3) were obtained in two groups with one control and four mixes with the ABs and CBs sand. The natural sand was replaced with the ABs and CBs sand at 30% in all the four mixes by using the volume replacement method. It is seen the recycled sand has a great different bulk density with the natural sand, as shown in Table 1. It can be seen from Table 3 that, in ABs1, the same water/cement (w/c) ratio of 0.65 was adopted, which lead to a lower fluidity of 95 mm. In case of CBs1, the fluidity recorded was 110 mm, which is also lower than the control. This reduction in the fluidity is attributed to the higher porosity of ABs and CBs. In case of ABs2 and CBs2, efforts were made to maintain the fluidity the same as that of the control. The water content in ABs2 and CBs2 was increased to 160 and 135 g, respectively. The higher amount of water is required for two purposes, first to compensate the absorbed water, and second to provide enough of a layer of water around particles to maintain the fluidity [19].
Table 3.
Mix proportions.
2.3. Workability Test
A mortar mixer was used to mix various groups of mortar and the fresh mortar was immediately tested for the fluidity by using a jumping table test, also known as the cement mortar fluidity tester, confirming to the code GB/T2419–2005 [20]. The cone was filled with fresh mortar in two layers with tamping and then the cone was removed. The flow table was jerked 25 times and the final diameter of the mortar was recorded by the average of two perpendicular directions.
2.4. Shrinkage Test
Digital image correlation (DIC) is a non–destructive robust technique to evaluate the deformation characterization of materials [21]. The surface images are used to calculate the local displacement, which are then used to calculate the strain on the surface of the sample (by using software VIC-2D). DIC is the most widely used technique because of its low requirement regarding the machines and instruments and great visibility. The capability of DIC for calculating the strain during the plastic shrinkage stage is mentioned in the following.
The fresh mortar was cast into a plate specimen of 200 × 200 × 8 mm3. To make the mold, two Polymethyl methacrylate plates of 300 × 300 × 8 mm3 were used. The upper plate was produced with a square cavity of 200 × 200 mm2. The surface of the lower plate was made rough by sanding for fixing the bottom of the mortar. Screws were fixed in the inner sides of the cavity of the upper plate in order to secure the sides of the mortar. After pouring the fresh mortar into the mold, the specimens were placed at room temperature of 23 ± 2 °C and humidity of 60% for three hours. A total time of 3.5 h was spent from pouring to finishing the specimen for DIC, which includes the spraying of white emulsion paint and then the spraying of black paint for speckles. The purpose of the experiment design is to simulate the cracking behavior of mortar when it is used as plastering mortar. The arrangement of the mortar casting and taking pictures is shown in Figure 2.
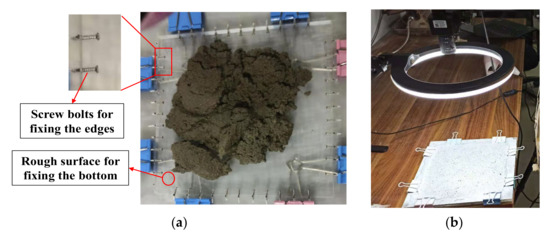
Figure 2.
Experimental testing setup: (a) Casting, (b) taking pictures.
For DIC image capturing, as shown in Figure 2b, hot air at a wind speed of 3.3 m/s and at a temperature of 45 °C was used to catalyze the cracking on the surface of the mortar specimens. An industrial camera (model jhsm300f from Shenzhen Jinghang Ltd.) was used to take pictures for the first one hour after blowing hot air. During the image capturing process, the whole arrangement was not moved. A commercially available software Vic–2d was used for the image correlation and the strain distribution field analyzing, which is then used to analyze the occurrence and propagation of cracks.
2.5. Scanning Electron Microscopy (SEM) Test
For further understanding the effect of the ABs sand and CBs sand on the plastic shrinkage of mortars, scanning electron microscopy (SEM) was used to capture the micro–structure of the recycled sand and the adjacent hardened cement paste, and the interfaces between them. The mortar containing recycled sand particles was selected and polished for the SEM analyzing. The samples were dried in an oven at 103 + 2 °C then sputtered with gold. To accurately locate the recycled sand particles, the samples were first captured as photos with an optical microscope before being sputtered with gold. The morphology of recycled sand and the combination between recycled sand and cement hydration products can be observed using the SEM equipment (Hitachi S5500).
3. Results
It should be noted that the graphs in Figure 3, Figure 4, Figure 5, Figure 6, Figure 7, Figure 8, Figure 9, Figure 10, Figure 11 and Figure 12 are presenting the variation of the strain distribution along the length of each of the reference lines, L0, L1 and L2, in each corresponding direction.
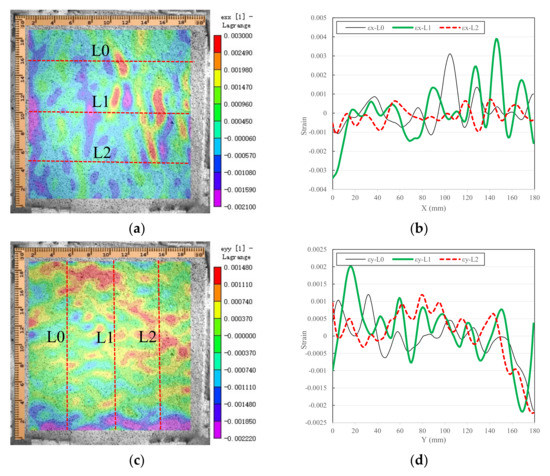
Figure 3.
Strain distribution of the control: (a) εx distribution, (b) εx along L0, L1 and L2, (c) εy distribution, (d) εy along L0, L1 and L2.
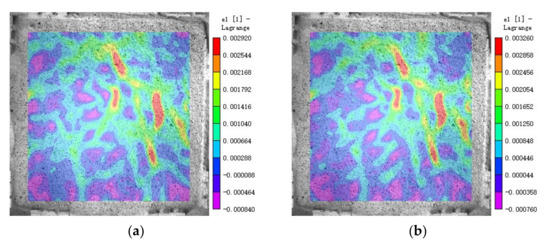
Figure 4.
The first principal strain distribution (ε1) of the control: (a) ε1 after 0.5 h, (b) ε1 after 1 h.
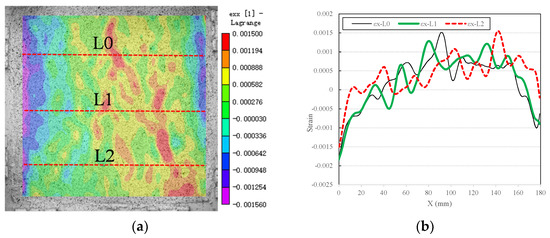
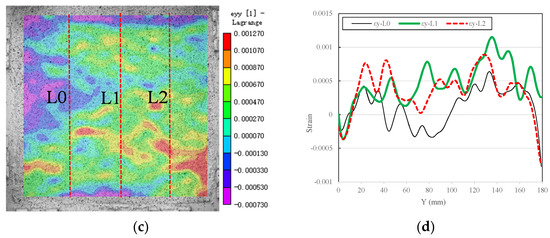
Figure 5.
Strain distribution of ABs1: (a) εx distribution, (b) εx along L0, L1 and L2, (c) εy distribution, (d) εy along L0, L1 and L2.
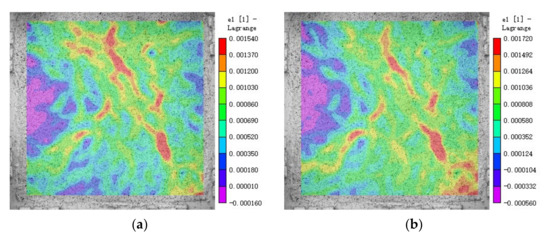
Figure 6.
The first principal strain distribution (ε1) of ABs1: (a) ε1 after 0.5 h, (b) ε1 after 1 h.
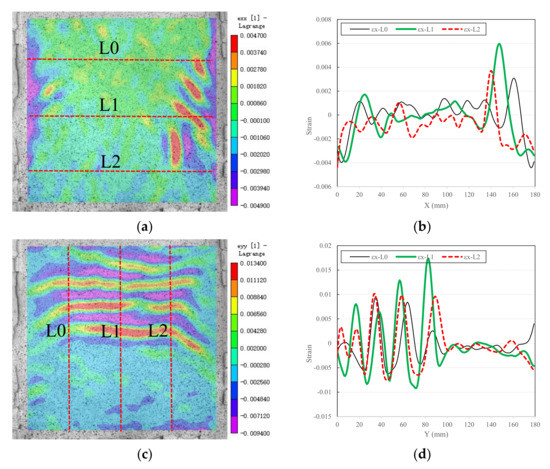
Figure 7.
Strain distribution of ABs2: (a) εx distribution, (b) εx along L0, L1 and L2, (c) εy distribution, (d) εy along L0, L1 and L2.
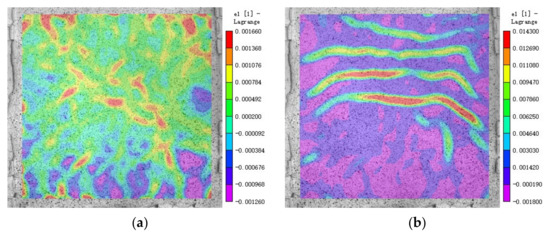
Figure 8.
The first principal strain distribution (ε1) of ABs2: (a) ε1 after 0.5 h, (b) ε1 after 1 h.
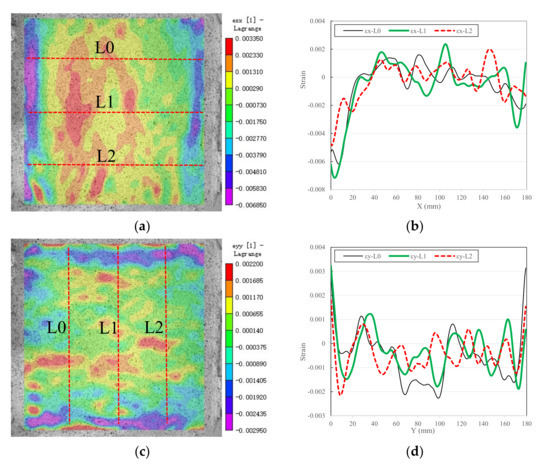
Figure 9.
Strain distribution of CBs1: (a) εx distribution, (b) εx along L0, L1 and L2, (c) εy distribution, (d) εy along L0, L1 and L2.
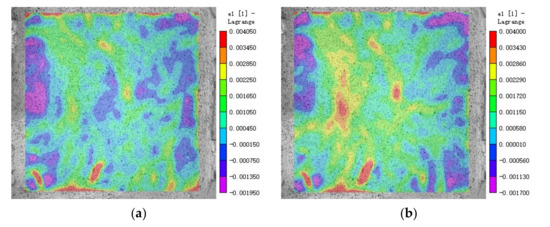
Figure 10.
The first principal strain distribution (ε1) of CBs1: (a) ε1 after 0.5 h, (b) ε1 after 1 h.
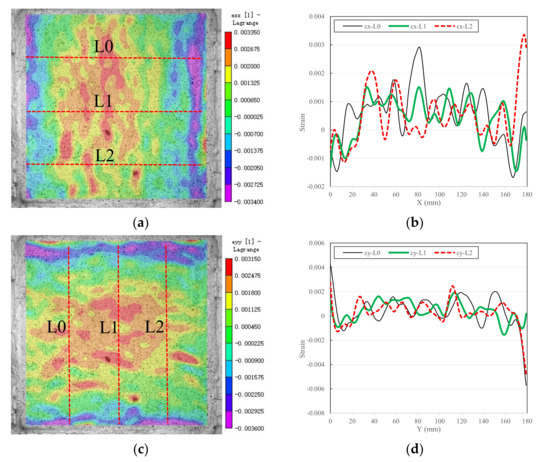
Figure 11.
Strain distribution of CBs2: (a) εx distribution, (b) εx along L0, L1 and L2, (c) εy distribution, (d) εy along L0, L1 and L2.
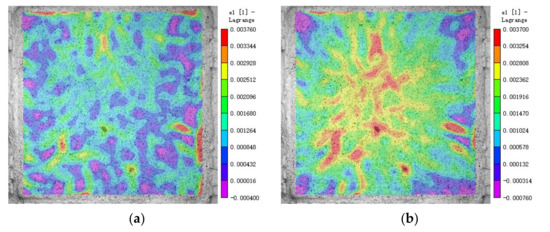
Figure 12.
The first principal strain distribution (ε1) of CBs2: (a) ε1 after 0.5 h, (b) ε1 after 1 h.
3.1. Strain Distribution in CONTROL
The strain in X–direction is shown in Figure 3a with a distribution contour, and the strain values along three lines (L0, L1 and L2) are shown in Figure 3b. From the figures, the positive and negative values show the tension and compression strain, respectively. After one hour of hot air blowing, the control mortar specimen has an uneven shrinkage. The largest strain of X–direction (horizontal), εx, is 0.0039, which is found on the line of L1.
Similarly, the strain of Y–direction (vertical), εy, is shown in Figure 3c. The strain values along the three lines L0, L1 and L2 are shown in Figure 3d. It shows that the strain values fluctuate within ±0.002, and the highest strain value occurs at the middle upper position of the specimen.
The first principal strain fields are shown in Figure 4a,b for half an hour and one hour of hot air blowing, respectively. The first principal strain shows the possible crack propagation on the surface of the specimen. While comparing Figure 4a,b, a similar strain concentration pattern can be found, and the highest value increased from 0.0026 to 0.0033. However, no visible cracks are seen on the surface of the specimen.
3.2. Strain Distribution in ABs1
When the ABs sand was used and the same w/c ratio with the control was adopted, the strain of X–direction is as shown in Figure 5a,b. The curves show a fluctuation, and the highest strain value of 0.0015 was observed at the center of the specimen. The strain distribution in Y–direction is shown in Figure 5c,d, and an obvious strain concentration band can be seen with a maximum strain value of 0.0012. The highest value of strain concentrations are less than that of the control. This may result from the internal curing effect, which is caused by the absorbed water in pores of ABs sand [22]. With the evaporation of free water, pore water plays a supplementary role. This reduces the evaporation rate and the strain concentration [23], as illustrated by the experimental results mentioned above.
Figure 6 shows the first principal strain concentration of the specimen at half an hour and one hour of blowing hot air. It can be seen from Figure 6a,b that the principal strain develops slowly. The addition of the ABs sand may decrease the possibility of cracking, which is caused by the internal curing of the high water absorption of ABs sand particles.
3.3. Strain Distribution in ABs2
In ABs2, the fluidity was maintained the same as that of the control by additional water being introduced, and the higher water consumption may increase the risk of cracking. The strain distribution in X–direction and Y–direction is shown in the Figure 7. In X–direction, four possible cracks are observed with the highest strain concentration value of 0.006, whereas in Y–direction, four major cracks on the surface of the specimen are observed. The maximum strain at the crack is 0.017 and the crack spacing is about 25 mm.
From the first principal strain distribution in Figure 8a, no crack is visible at half an hour. Whereas, when the time reaches one hour, four obvious cracks are visible on the surface of specimens with a distinctive map–crack pattern. The highest strain value and the distinct cracking can be attributed to the additional water [24].
3.4. Strain Distribution in CBs1
When the CBs sand was used to replace natural sand and the w/c ratio was kept constant with the control, Figure 9a,b illustrates the strain distribution of X–direction of CBs1 specimen. From the figures, it can be found that the strain value varies between –0.006 and 0.003. The strain of CBs1 in Y–direction is shown in Figure 9c,d, and the strain values fluctuate between −0.003 and 0.003. In total, the mortar containing recycled bricks sand has similar plastic shrinkage performance as the control.
It can also be demonstrated with the first principal strain distribution in Figure 10 that the CBs sand does not pose an obvious effect on the plastic shrinkage of the mortar. This should result from the fact that the CBs sand has a similar water requirement as the natural river sand.
3.5. Strain Distribution in CBs2
For CBs2, the fluidity was maintained with additional water, and a small amount of water was needed to adjust the fluidity of the mortar to the same as the control. Random strain concentration zones can be seen in strain distribution of εx and εy, as shown in Figure 11. The strain concentration is mostly seen at the center of the specimen when checked in both directions. The strain fluctuates within ±0.004, which is slightly higher than the control.
From the first principal strain concentration distribution in Figure 12, no visible crack was observed on the surface of the specimen. A developing pattern in the first principal strain distribution was observed from half an hour to one hour of hot air blowing.
4. Discussion
4.1. Comparison Analysis
The number of strain concentration zones along L0, L1 and L2 was obtained by counting the peaks alone the curves, and it is summarized in Table 4 for comparison. According to Table 4, it is found that the control has about 8 strain concentration zones along L0, L1 or L2. It can be roughly found that ABs2 has fewer strain concentration zones and CBs2 has more. The reason will be analyzed in the following part by comparing the number of strain concentration zones, and the highest strain concentration values as well.
Table 4.
Number of strain concentration zones.
The highest strain concentration values of each group were picked and shown in Table 5, according to which, it can be seen that ABs2 has much higher strain concentration values. This results from the obvious cracks on the specimen of ABs2.
Table 5.
The greatest strain concentration.
In order to compare the number of strain concentration zones and the greatest strain concentration of five groups, the average of six values of each group is obtained and shown in Figure 13. From Figure 13, it can be easily found that ABs1 has fewer number of strain concentration zones and lower strain concentration values compared to the control. This means a lower risk of cracking, which is due to the internal curing effects of recycled sand. For ABs2, the strain concentration zones developed into cracks, which can be observed during testing. CBs1 has similar values to the control for both the number of strain concentration zones and the highest strain concentration values. CBs2 should have higher risk to crack because there are more strain concentration zones and higher strain concentration.
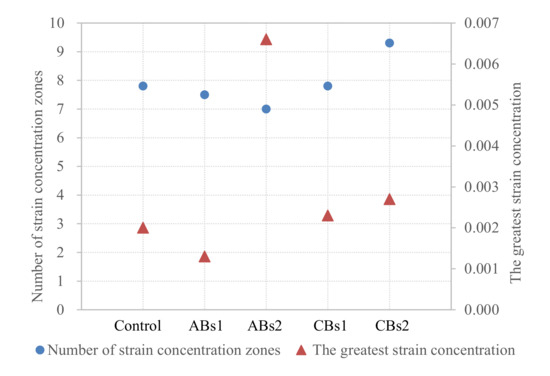
Figure 13.
Average number of the strain concentration zones and average of the greatest strain concentration.
In summary, more strain concentration zones and higher strain concentration values always means that the mortar has a higher risk to crack due to the plastic shrinkage. On the contrary, less strain concentration zones and lower strain concentration values are also always related to a lower risk of cracking.
4.2. Micro–Structures
To grasp the micro–structures of the ABs and CBs sand in mortar, the SEM technique was adopted to understand the influence of the sand particles on the shrinkage behavior.
From Figure 14a, it can be seen that ABs sand particles contain micro–pores that are responsible for the higher water consumption needed to maintain the flow of the fresh mortar. In Figure 14b, the pores are clearly visible in the upper part of the picture, and it is convenient to tell the size of the micro–pores, which are as small as a few microns and as big as 50 microns. The micro–pores are the reason why the mortar containing ABs sand has an extremely higher water requirement.
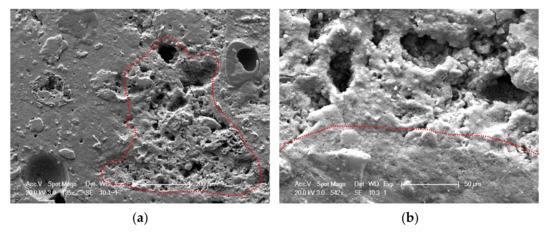
Figure 14.
Micro–structure of ABs sand particles in mortar: (a) Zoomed in 1000 times, (b) zoomed in 5000 times.
However, the recycled sand can also serve as the internal curing agent to provide curing water once the free water evaporates [25]. Therefore, the mortar ABs1 had lower shrinkage cracking risk. On the contrary, if the same workability was maintained by adding additional water, the mortar ABs2 had particularly higher risk of cracks. It is also because the pores in ABs sand can reduce the particles’ stiffness, thus reducing the ability of the particles to resist shrinkage pressure [14].
The CBs sand particles are easy to be found in the optical observation because it is in orange color. In Figure 15, a CBs sand particle is clearly visible in the center of the picture and the surface of the brick sand particle is uneven. The recycled CBs sand particle can be seen in the lower corner in Figure 15b, which contains fine pores, and hence more water is required for maintaining a proper fluidity of the fresh mortar. Although the CBs sand has higher water consumption, it does not lead to an extremely higher plastic shrinkage.
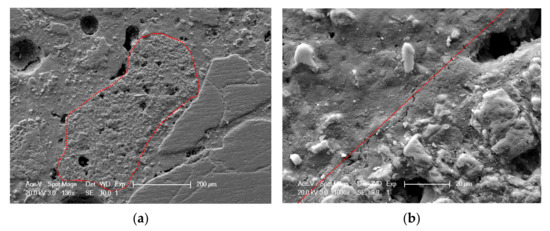
Figure 15.
Micro–structure of CBs sand particles in mortar: (a) Zoomed in 1000 times, (b) zoomed in 10,000 times.
4.3. Additional Analysis on ABs2
According to the above analysis, it can be seen that the use of ABs sand can cause large shrinkage. For ABs2, after blowing hot air for half an hour, there were only randomly distributed strain concentration zones on the surface of the specimen, and no cracks were found. Then, several cracks had appeared in the specimen after one hour of blowing. How the crack was propagating is still unclear. In order to observe the crack developing process more clearly, the first principal strain distribution field was illustrated every 5 min after half an hour of hot air blowing, as shown in Figure 16.
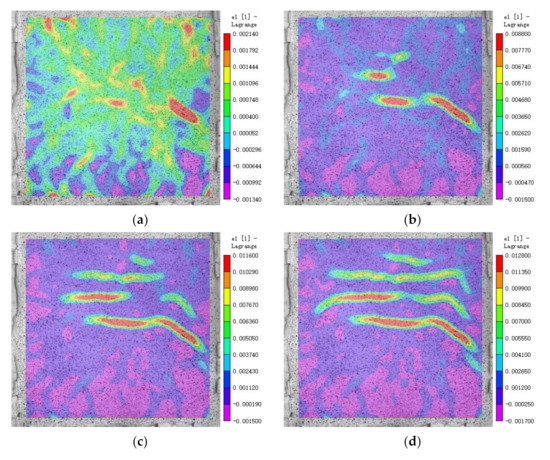
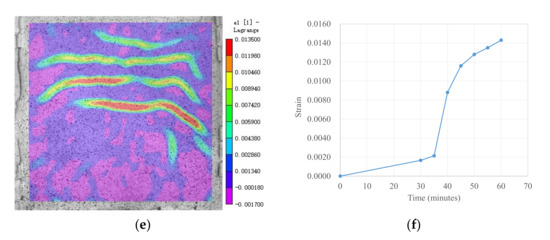
Figure 16.
Principal strain distribution of ABs2: (a) ε1 after 35 min, (b) ε1 after 40 min, (c) ε1 after 45 min, (d) ε1 after 50 min, (e) ε1 after 55 min. (f) Maximum ε1 along time.
At 35 min, see Figure 16a, the strain concentration distribution is relatively uniform, and no visible cracks were found. At 40 min, there are two obvious strain concentration zones in the strain distribution field, and the maximum strain value suddenly increases from 0.0021 to 0.0088. According to the degree of strain concentration, there should be visible cracks, which can be seen in the experiment observation. As the time of blowing hot air continues to increase, the crack propagates further, as shown in Figure 16c. Furthermore, from Figure 16d,e, it can be seen that the cracks gradually increase, and the maximum strain concentration value also gradually increases.
In order to understand the development of plastic shrinkage crack with time, the curve of maximum strain at cracks with time is drawn in Figure 16f. According to the curve, the maximum strain of the specimen increases relatively slowly before 35 min. At 40 min, the maximum strain has a sudden growth, and then slows down after that. The results show that the cracks appear for the first time in ABs2 when the hot air blows for 40 min, and then the cracks gradually propagate and new cracks appears continuously. Most of the cracks propagate horizontally and a few vertically.
5. Conclusions
According to the investigation on the plastic shrinkage of mortar containing recycled sand obtained from waste aerated blocks and sintered bricks, the following conclusions can be drawn:
- The fluidity of mortar was reduced by using recycled sand from aerated blocks and clay bricks. In order to keep the same fluidity with the control, additional water is required, and the aerated blocks sand needs more.
- The pore water in ABs sand particles works as an internal curing agent, which results in a lower strain concentration compared with the control. However, when extra water was added to keep the same fluidity as the control mortar, this led to obviously visible cracks in the sample of ABs2, and the average distance between cracks reached 25 mm.
- The micro–structure morphology of the mortar containing recycled sands showed that there were a great amount of pores that ranged from 2 to 50 microns in aerated blocks sand particles. However, a relatively small amount of pores were found in the red brick sand particles. Therefore, the addition of the aerated blocks sand showed a higher influence on the plastic shrinkage rather than clay bricks sand.
- More strain concentration zones and higher strain concentration values always means that the mortar has a higher risk to crack due to the plastic shrinkage. On the contrary, less strain concentration zones and lower strain concentration values are also always related to a lower risk of cracking.
Author Contributions
Conceptualization, Q.L. and J.X.; methodology, Q.L. and J.X.; data curation, Q.L.; writing—original draft preparation, Q.L. and A.S.; writing—review and editing, J.X. and A.S.; project administration, Q.L. and J.X.; funding acquisition, Q.L. and J.X. All authors have read and agreed to the published version of the manuscript.
Funding
This study is financially supported by National Natural Science Foundation (NSFC) of PR China (No. 51778463, 52078358), China Postdoctoral Science Foundation (No. 2018M642079) and Shanghai Jianfeng Yichang Engineering Technology Co., Ltd.
Institutional Review Board Statement
Not applicable.
Informed Consent Statement
Not applicable.
Data Availability Statement
Not applicable.
Conflicts of Interest
The authors declare no conflict of interest.
References
- Xiao, J.; Li, W.; Fan, Y.; Huang, X. An overview of study on recycled aggregate concrete in China (1996–2011). Constr. Build. Mater. 2012, 31, 364–383. [Google Scholar] [CrossRef]
- Tam, V.W.Y.; Soomro, M.; Evangelista, A.C.J. A review of recycled aggregate in concrete applications (2000–2017). Constr. Build. Mater. 2018, 172, 272–292. [Google Scholar] [CrossRef]
- Zega, C.J.; Di Maio, A.A. Use of recycled fine aggregate in concretes with durable requirements. Waste Manag. 2011, 31, 2336–2340. [Google Scholar] [CrossRef] [PubMed]
- Shi, C.; Li, Y.; Zhang, J.; Li, W.; Chong, L.; Xie, Z. Performance enhancement of recycled concrete aggregate—A review. J. Clean. Prod. 2016, 112, 466–472. [Google Scholar] [CrossRef]
- Liu, Q.; Singh, A.; Xiao, J. Workability and mechanical properties of mortar containing recycled sand from aerated concrete blocks and sintered. Resour. Conserv. Recy. 2020, 157, 104728. [Google Scholar] [CrossRef]
- Ulsen, C.; Kahn, H.; Hawlitschek, G.; Masini, E.; Ângulo, S.C.; John, V.M. Production of recycled sand from construction and demolition waste. Constr. Build. Mater. 2013, 40, 1168–1173. [Google Scholar] [CrossRef]
- Naceri, A.; Hamina, M.C. Use of waste brick as a partial replacement of cement in mortar. Waste Manag. 2009, 29, 2378–2384. [Google Scholar] [CrossRef]
- Stefanidou, M.; Anastasiou, E.; Filikas, K.G. Recycled sand in lime–based mortars. Waste Manag. 2014, 34, 2595–2602. [Google Scholar] [CrossRef]
- Le, T.; Remond, S.; Le Saoût, G.; Garcia–Diaz, E. Fresh behavior of mortar based on recycled sand—Influence of moisture condition. Constr. Build. Mater. 2016, 106, 35–42. [Google Scholar] [CrossRef]
- Zhao, Z.; Remond, S.; Damidot, D.; Xu, W. Influence of hardened cement paste content on the water absorption of fine recycled concrete aggregates. J. Sustain. Cem. Mater. 2013, 2, 186–203. [Google Scholar] [CrossRef]
- Abousnina, R.; Manalo, A.; Ferdous, W.; Lokuge, W.; Benabed, B.; Al–Jabri, K.S. Characteristics, strength development and microstructure of cement mortar containing oil–contaminated sand. Constr. Build. Mater. 2020, 252, 119155. [Google Scholar] [CrossRef]
- Zhang, J.; Hou, D.; Sun, W. Experimental study on the relationship between shrinkage and interior humidity of concrete at early age. Mag. Concr. Res. 2010, 62, 191–199. [Google Scholar] [CrossRef]
- Zhang, J.; Han, Y.D.; Gao, Y.; Luosun, Y. Integrative Study on the Effect of Internal Curing on Autogenous and Drying Shrinkage of High–Strength Concrete. Dry. Technol. 2013, 31, 565–575. [Google Scholar] [CrossRef]
- Lee, N.K.; Abate, S.Y.; Kim, H.-K. Use of recycled aggregates as internal curing agent for alkali–activated slag system. Constr. Build. Mater. 2018, 159, 286–296. [Google Scholar] [CrossRef]
- Chen, F.; Wu, K.; Ren, L.; Xu, J.; Zheng, H. Internal Curing Effect and Compressive Strength Calculation of Recycled Clay Brick Aggregate Concrete. Materials 2019, 12, 1815. [Google Scholar] [CrossRef] [PubMed]
- Weber, S.; Reinhardt, H.W. New generation of high performance concrete: Concrete with autogeneous curing. Adv. Cem. Based Mater. 1997, 6, 59–68. [Google Scholar] [CrossRef]
- Siddika, A.; Mamun, M.D.; Ferdous, W.; Saha, A.K.; Alyousef, R. 3D–printed concrete: Applications, performance, and challenges. J. Sustain. Cem.–Based Mater. 2020, 9, 127–164. [Google Scholar] [CrossRef]
- GB175–2007. Cement, Common Portland; China National Standardization Management Committee: Beijing, China, 2007. [Google Scholar]
- Lo, T.Y.; Cui, H.Z.; Li, Z.G. Influence of aggregate prewetting and fly ash on mechanical properties of lightweight concrete. Waste Manag. 2004, 24, 333–338. [Google Scholar] [CrossRef]
- GB/T2419–2005. Test method for fluidity of cement mortar; China National Standardization Management Committee: Beijing, China, 2005. [Google Scholar]
- Corr, D.; Accardi, M.; Graham–Brady, L.; Shah, S.P. Digital image correlation analysis of interfacial debonding properties and fracture behavior in concrete. Eng. Fract. Mech. 2007, 74, 109–121. [Google Scholar] [CrossRef]
- Liu, M.J.; Tian, Q.; Miao, C. Investigation on the plastic shrinkage of cementitious materials under drying conditions: Mechanism and theoretical model. Mag. Concr. Res. 2012, 64, 551–561. [Google Scholar] [CrossRef]
- Cohen, M.D.; Olek, J.; Dolch, W.L. Mechanism of plastic shrinkage cracking in Portland cement and Portland cement–silica fume paste and mortar. Cem. Concr. Res. 1990, 20, 103–119. [Google Scholar] [CrossRef]
- Dao, V.; Dux, P.; Morris, P.; O’Moore, L. Plastic shrinkage cracking of concrete. Aust. J. Struct. Eng. 2010, 10, 207–214. [Google Scholar]
- Holt, E.; Leivo, M. Cracking risks associated with early age shrinkage. Cem. Concr. Res. 2004, 26, 521–530. [Google Scholar] [CrossRef]


Publisher’s Note: MDPI stays neutral with regard to jurisdictional claims in published maps and institutional affiliations. |
© 2021 by the authors. Licensee MDPI, Basel, Switzerland. This article is an open access article distributed under the terms and conditions of the Creative Commons Attribution (CC BY) license (http://creativecommons.org/licenses/by/4.0/).