Empirical Design, Construction, and Experimental Test of a Small-Scale Bubbling Fluidized Bed Reactor


Abstract
1. Introduction
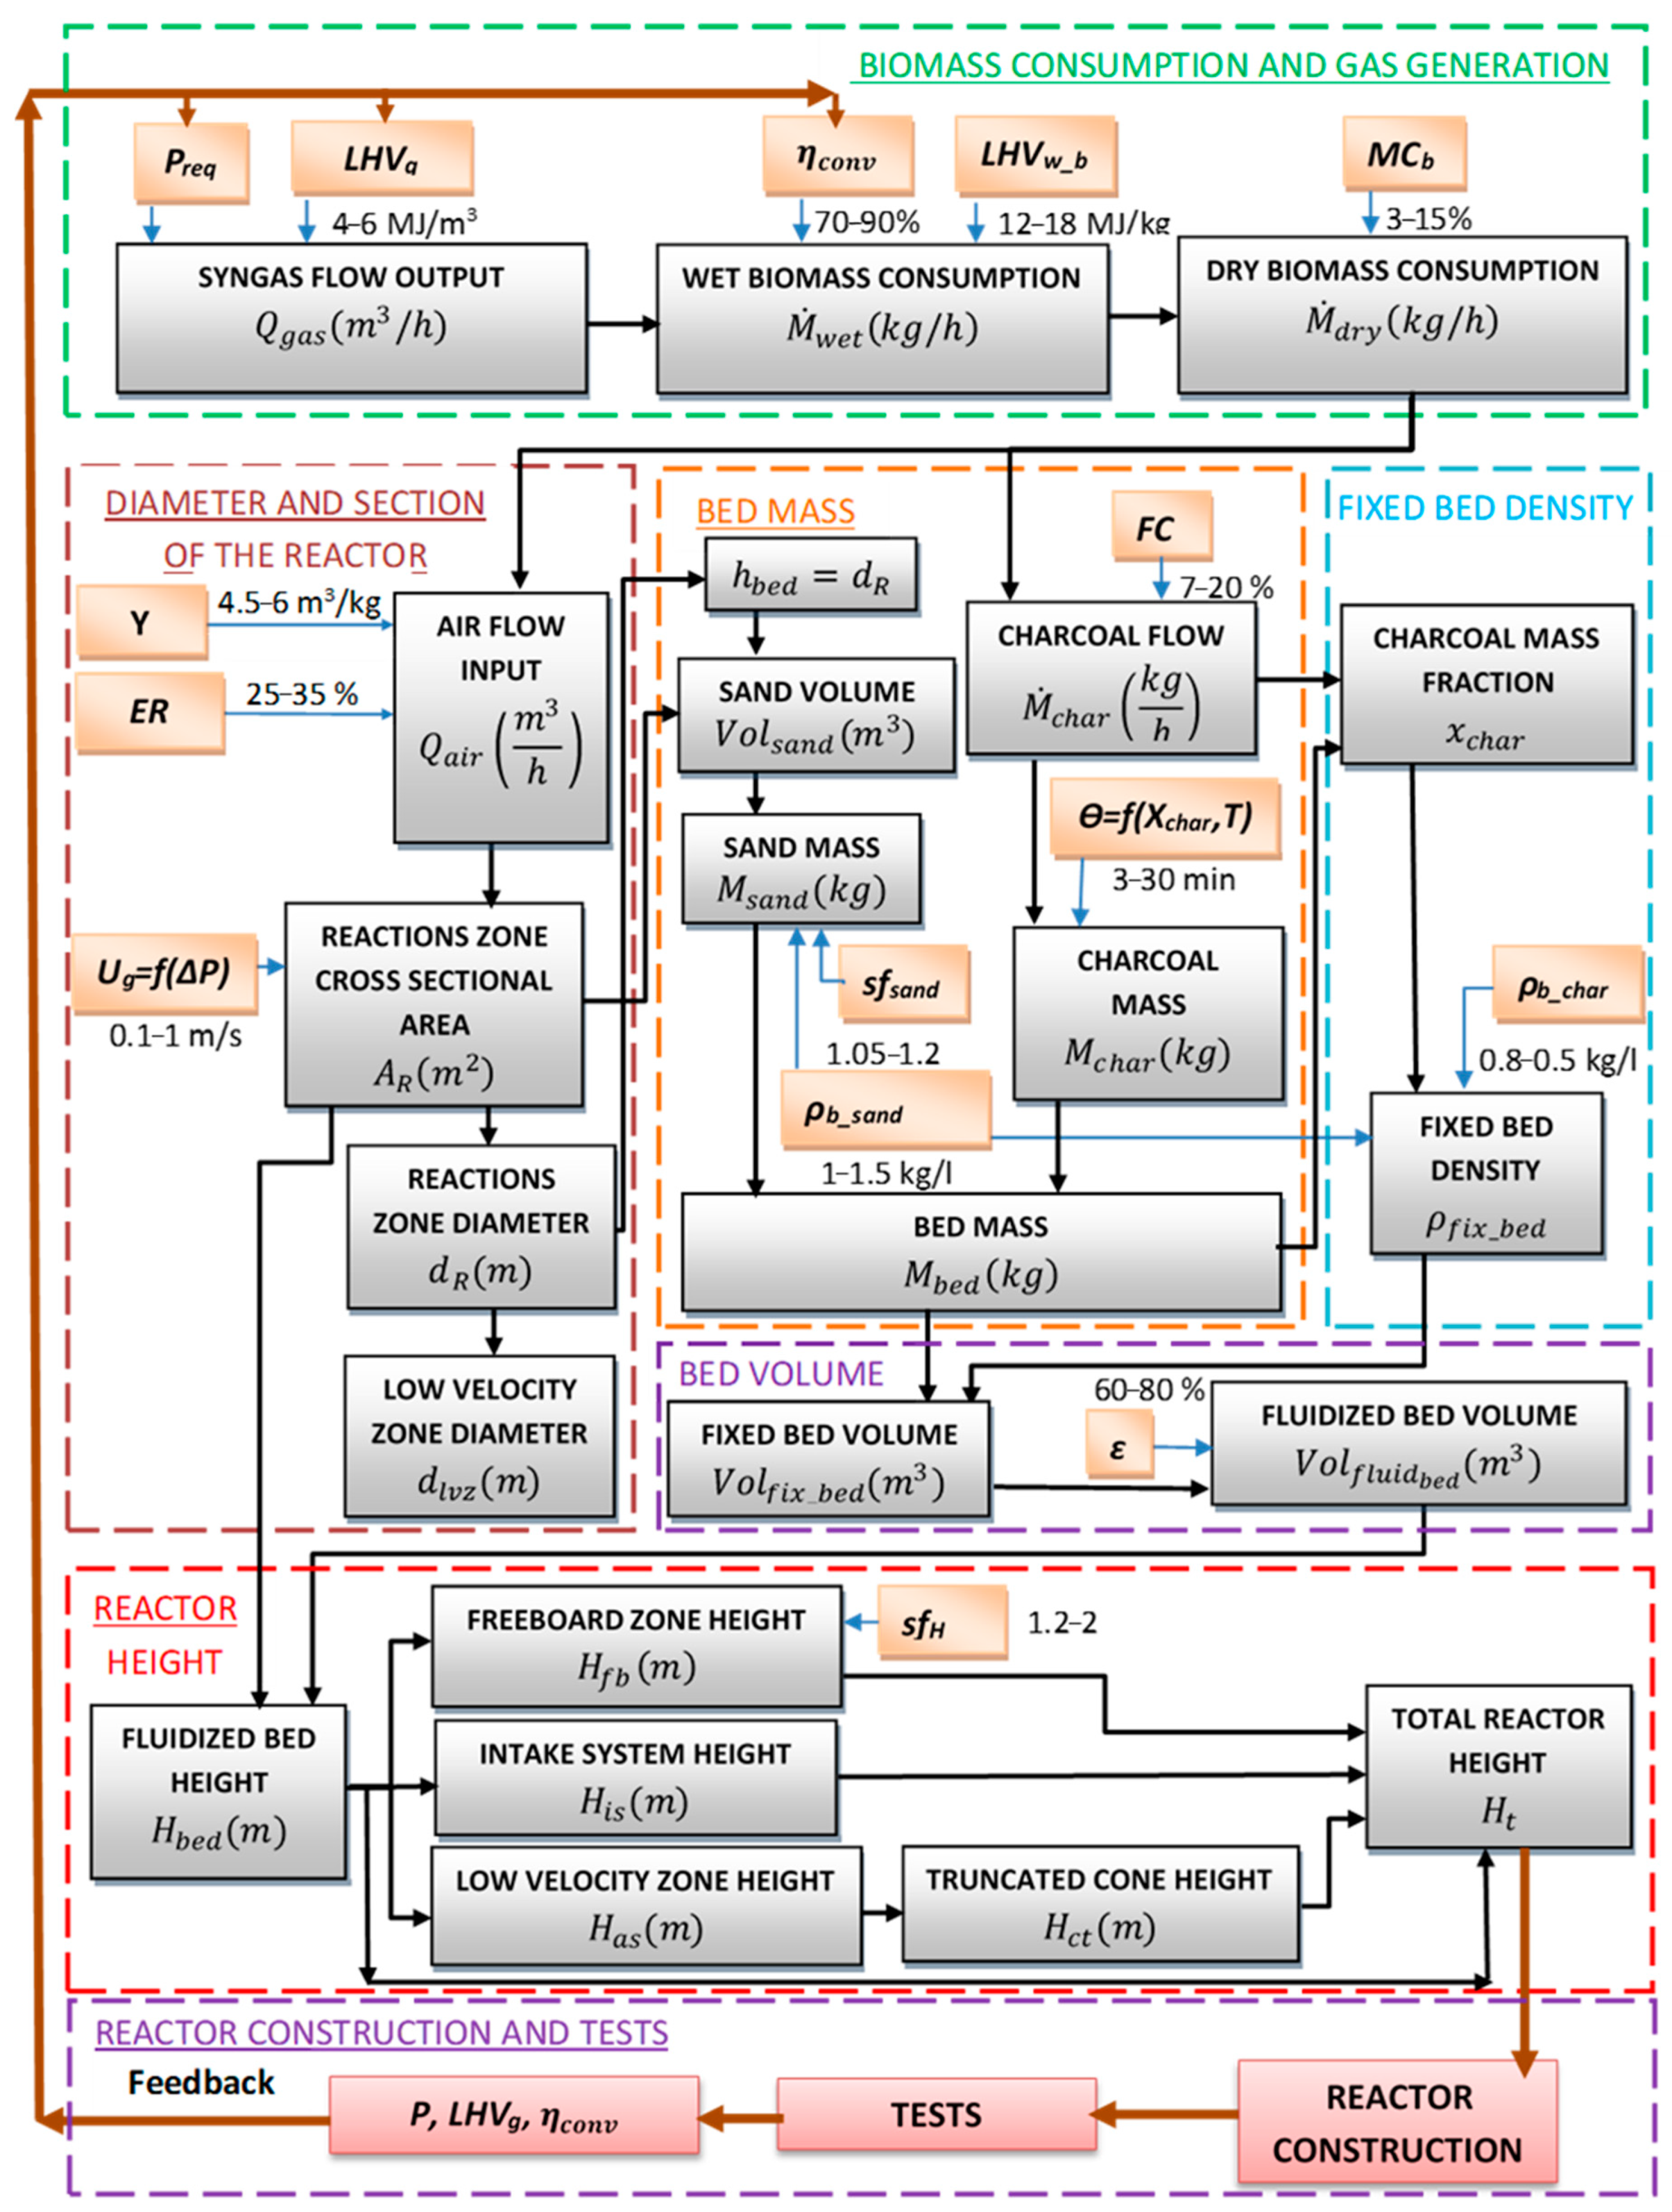
2. Methodology
2.1. Inputs
2.2. Biomass Consumption and Syngas Output
2.3. Diameter and Cross-Section Calculation
2.3.1. Airflow Required for the Fluidization Process
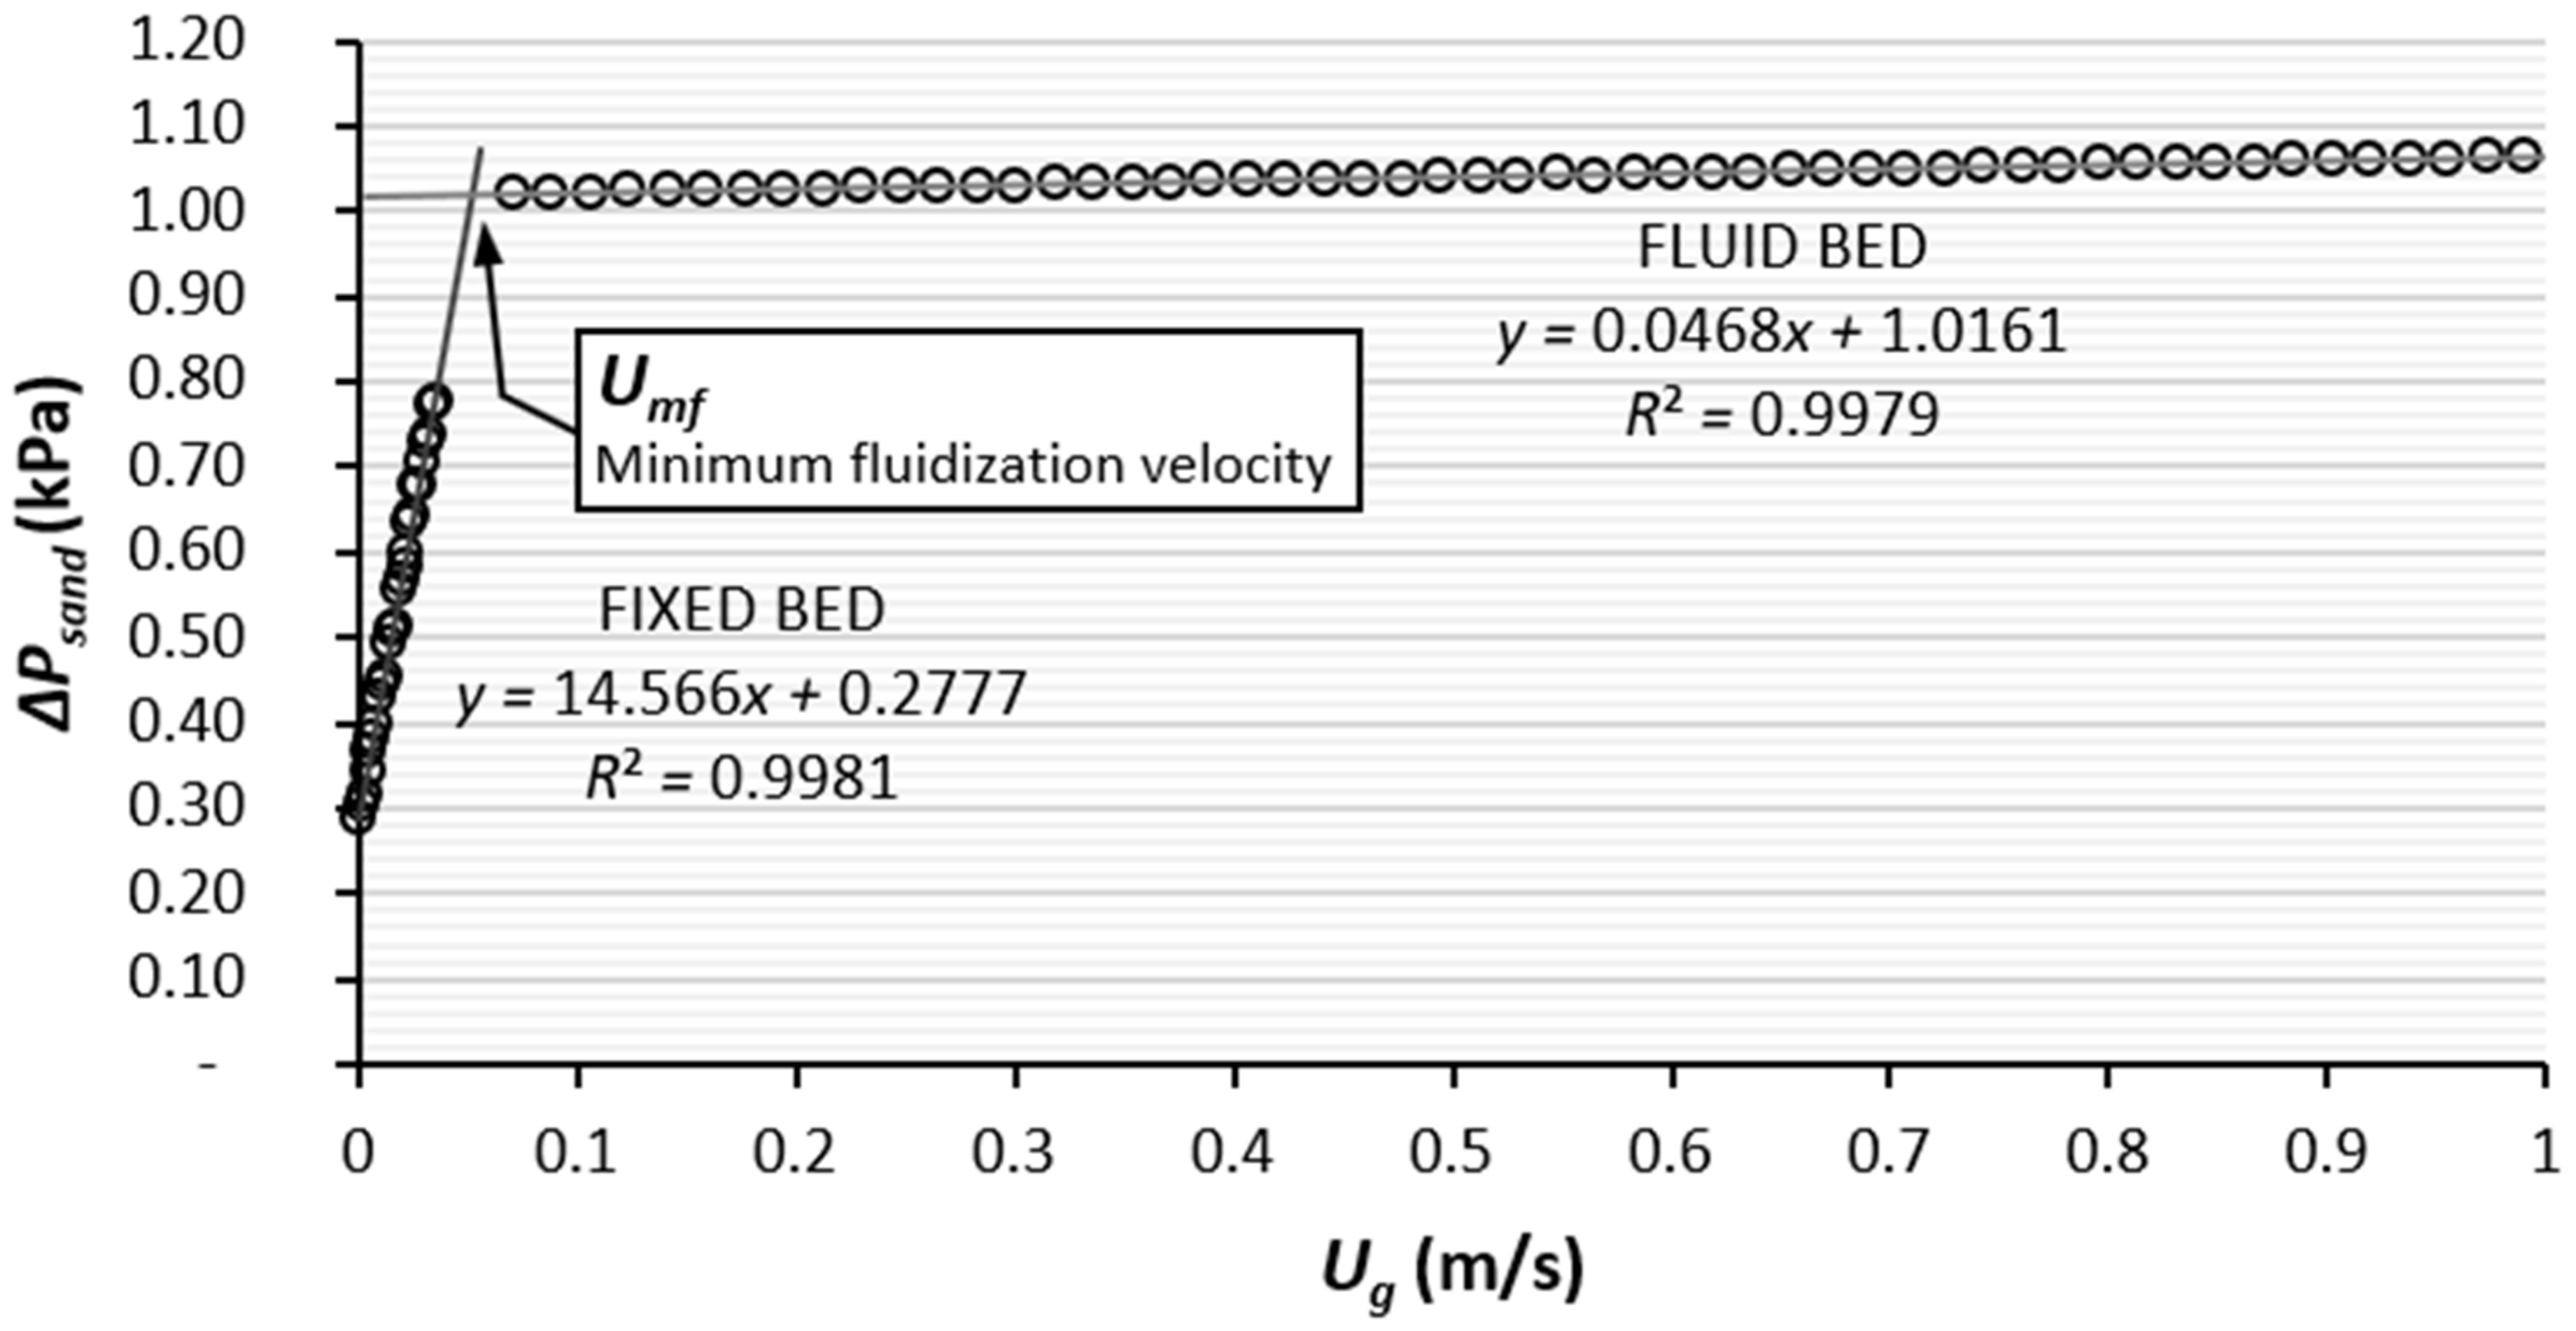
2.3.2. Fluidization
2.3.3. Fluidization Diameter and Cross-Section Determination
2.4. Fluidized-Bed Volume Calculation
2.4.1. Bed Mass
2.4.2. Fixed Bed Density
2.4.3. Fixed and Fluidized Bed Volume
2.5. Reactor Height Calculation
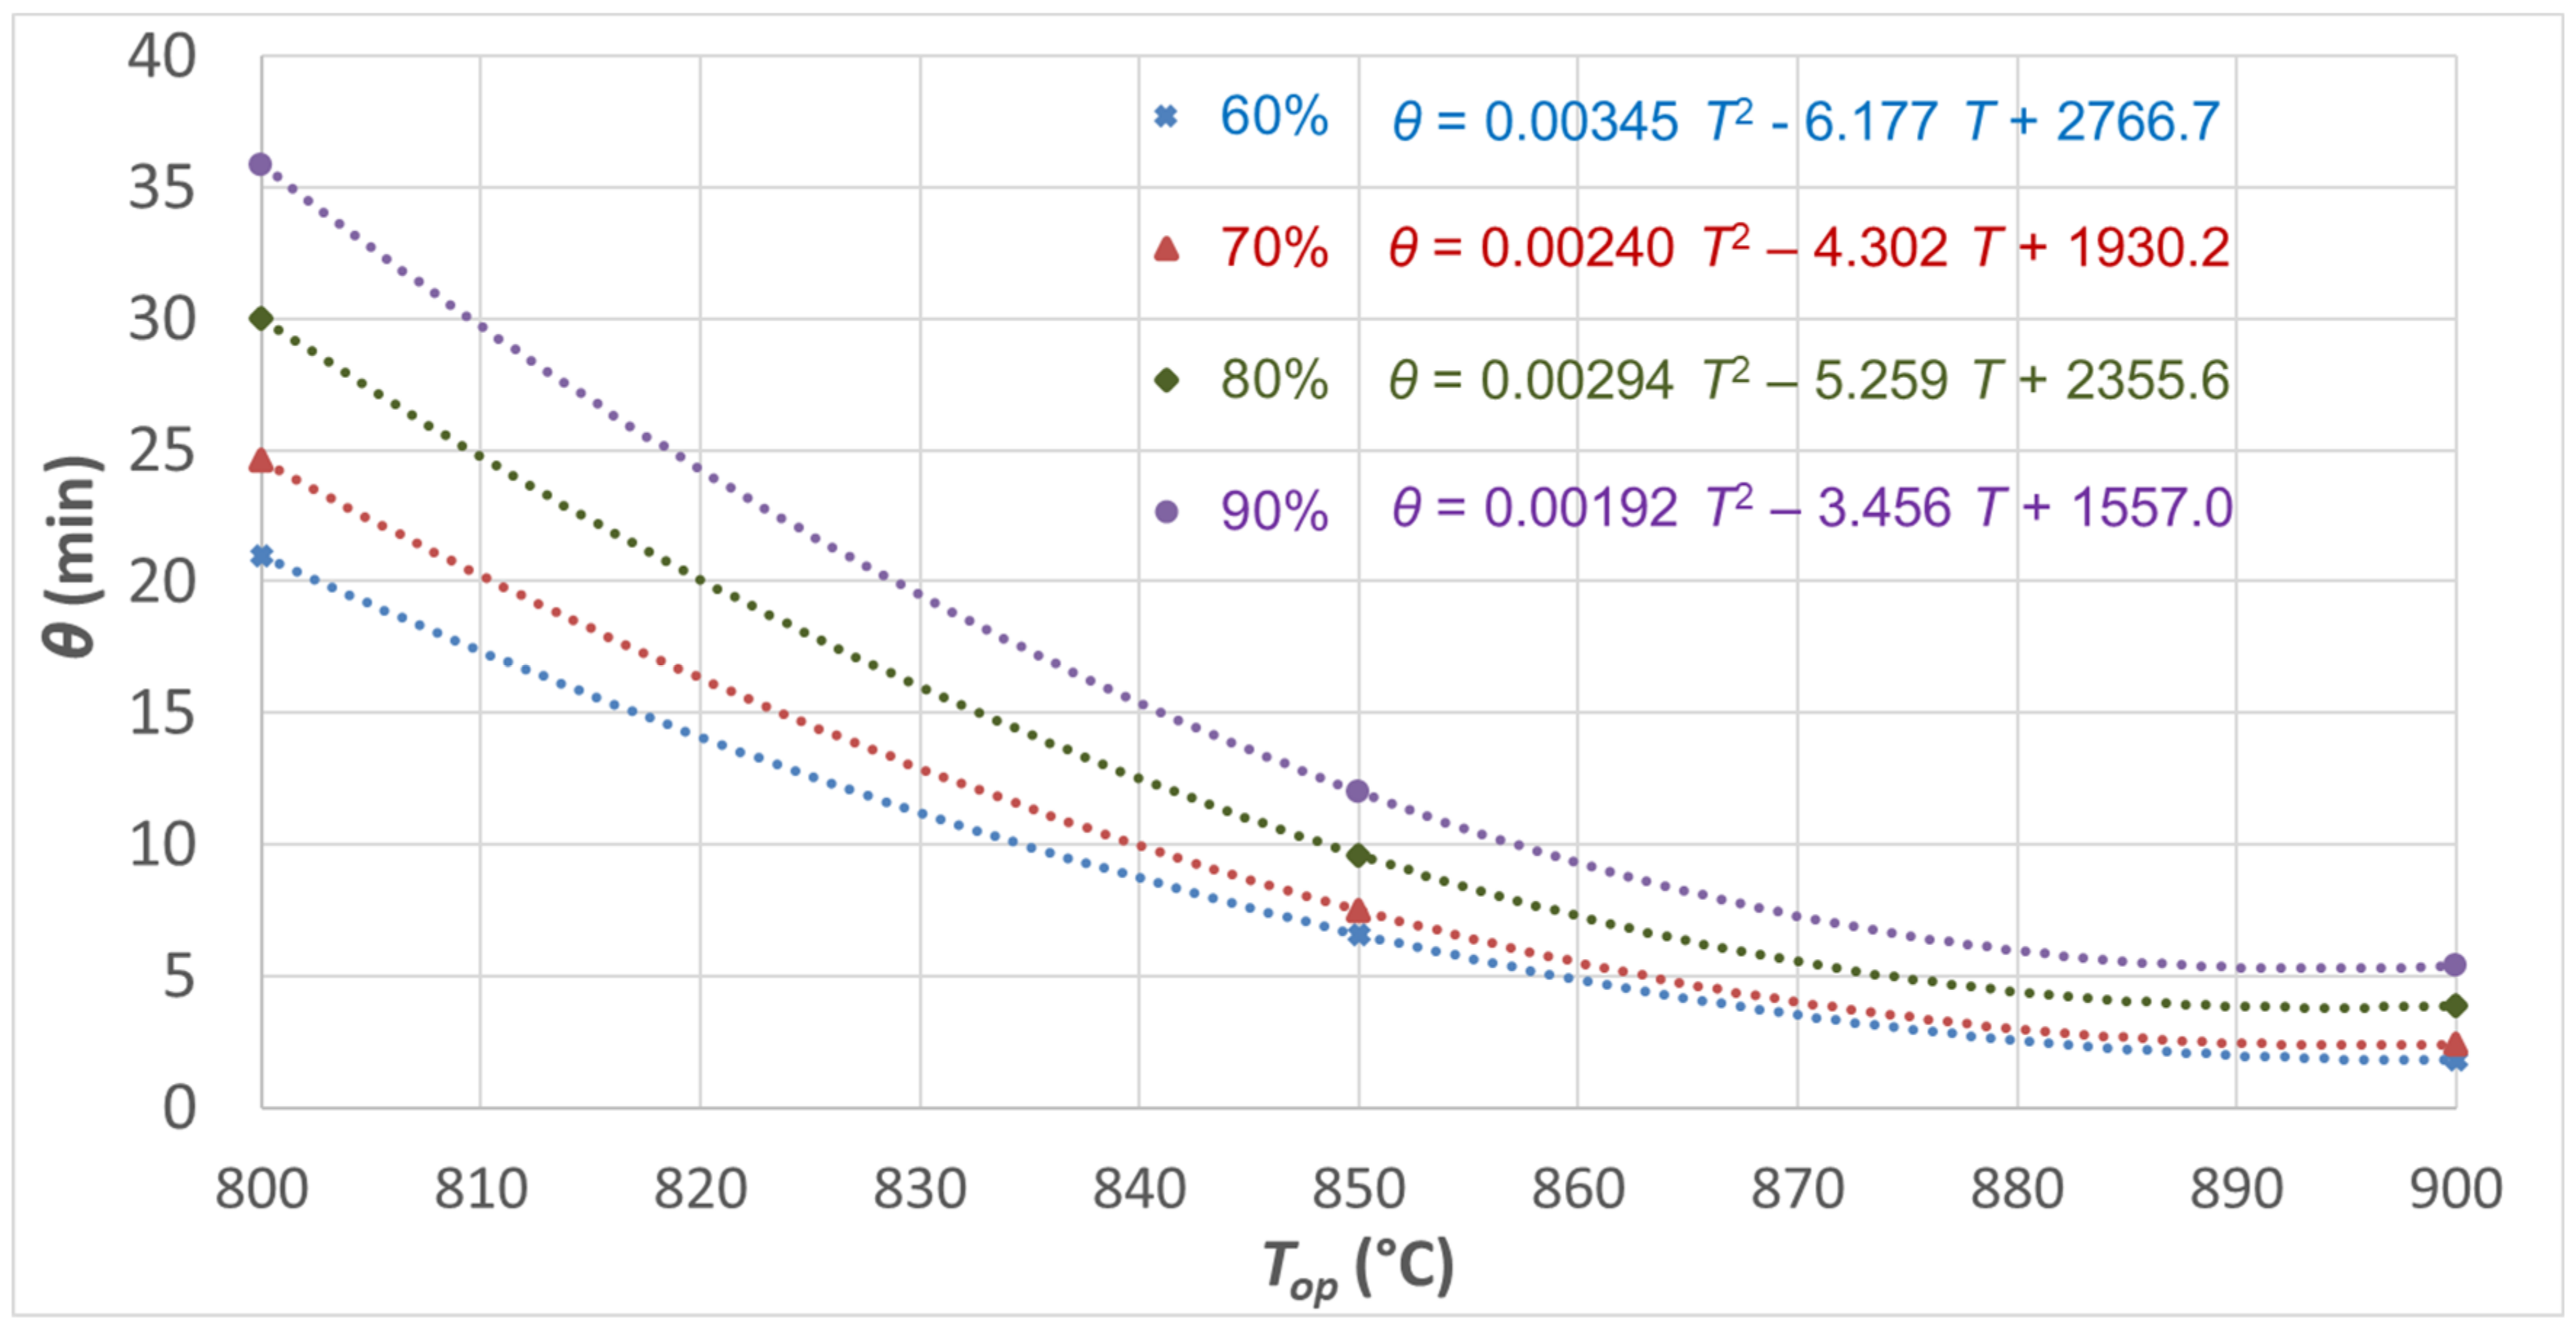
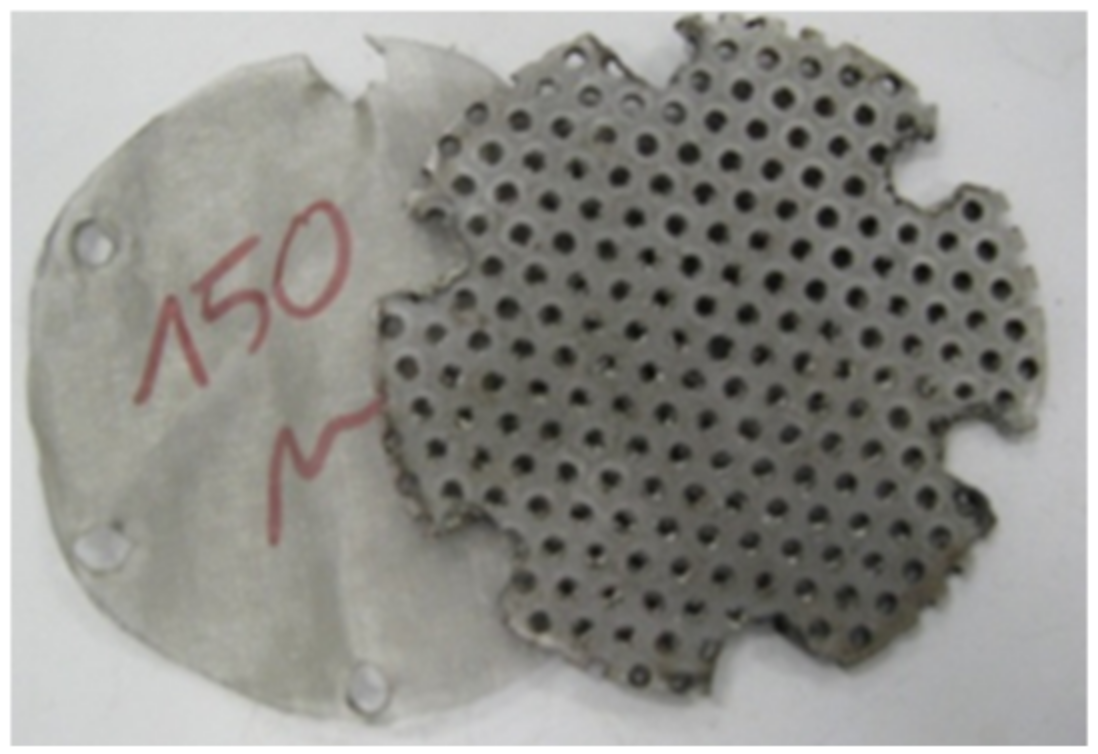
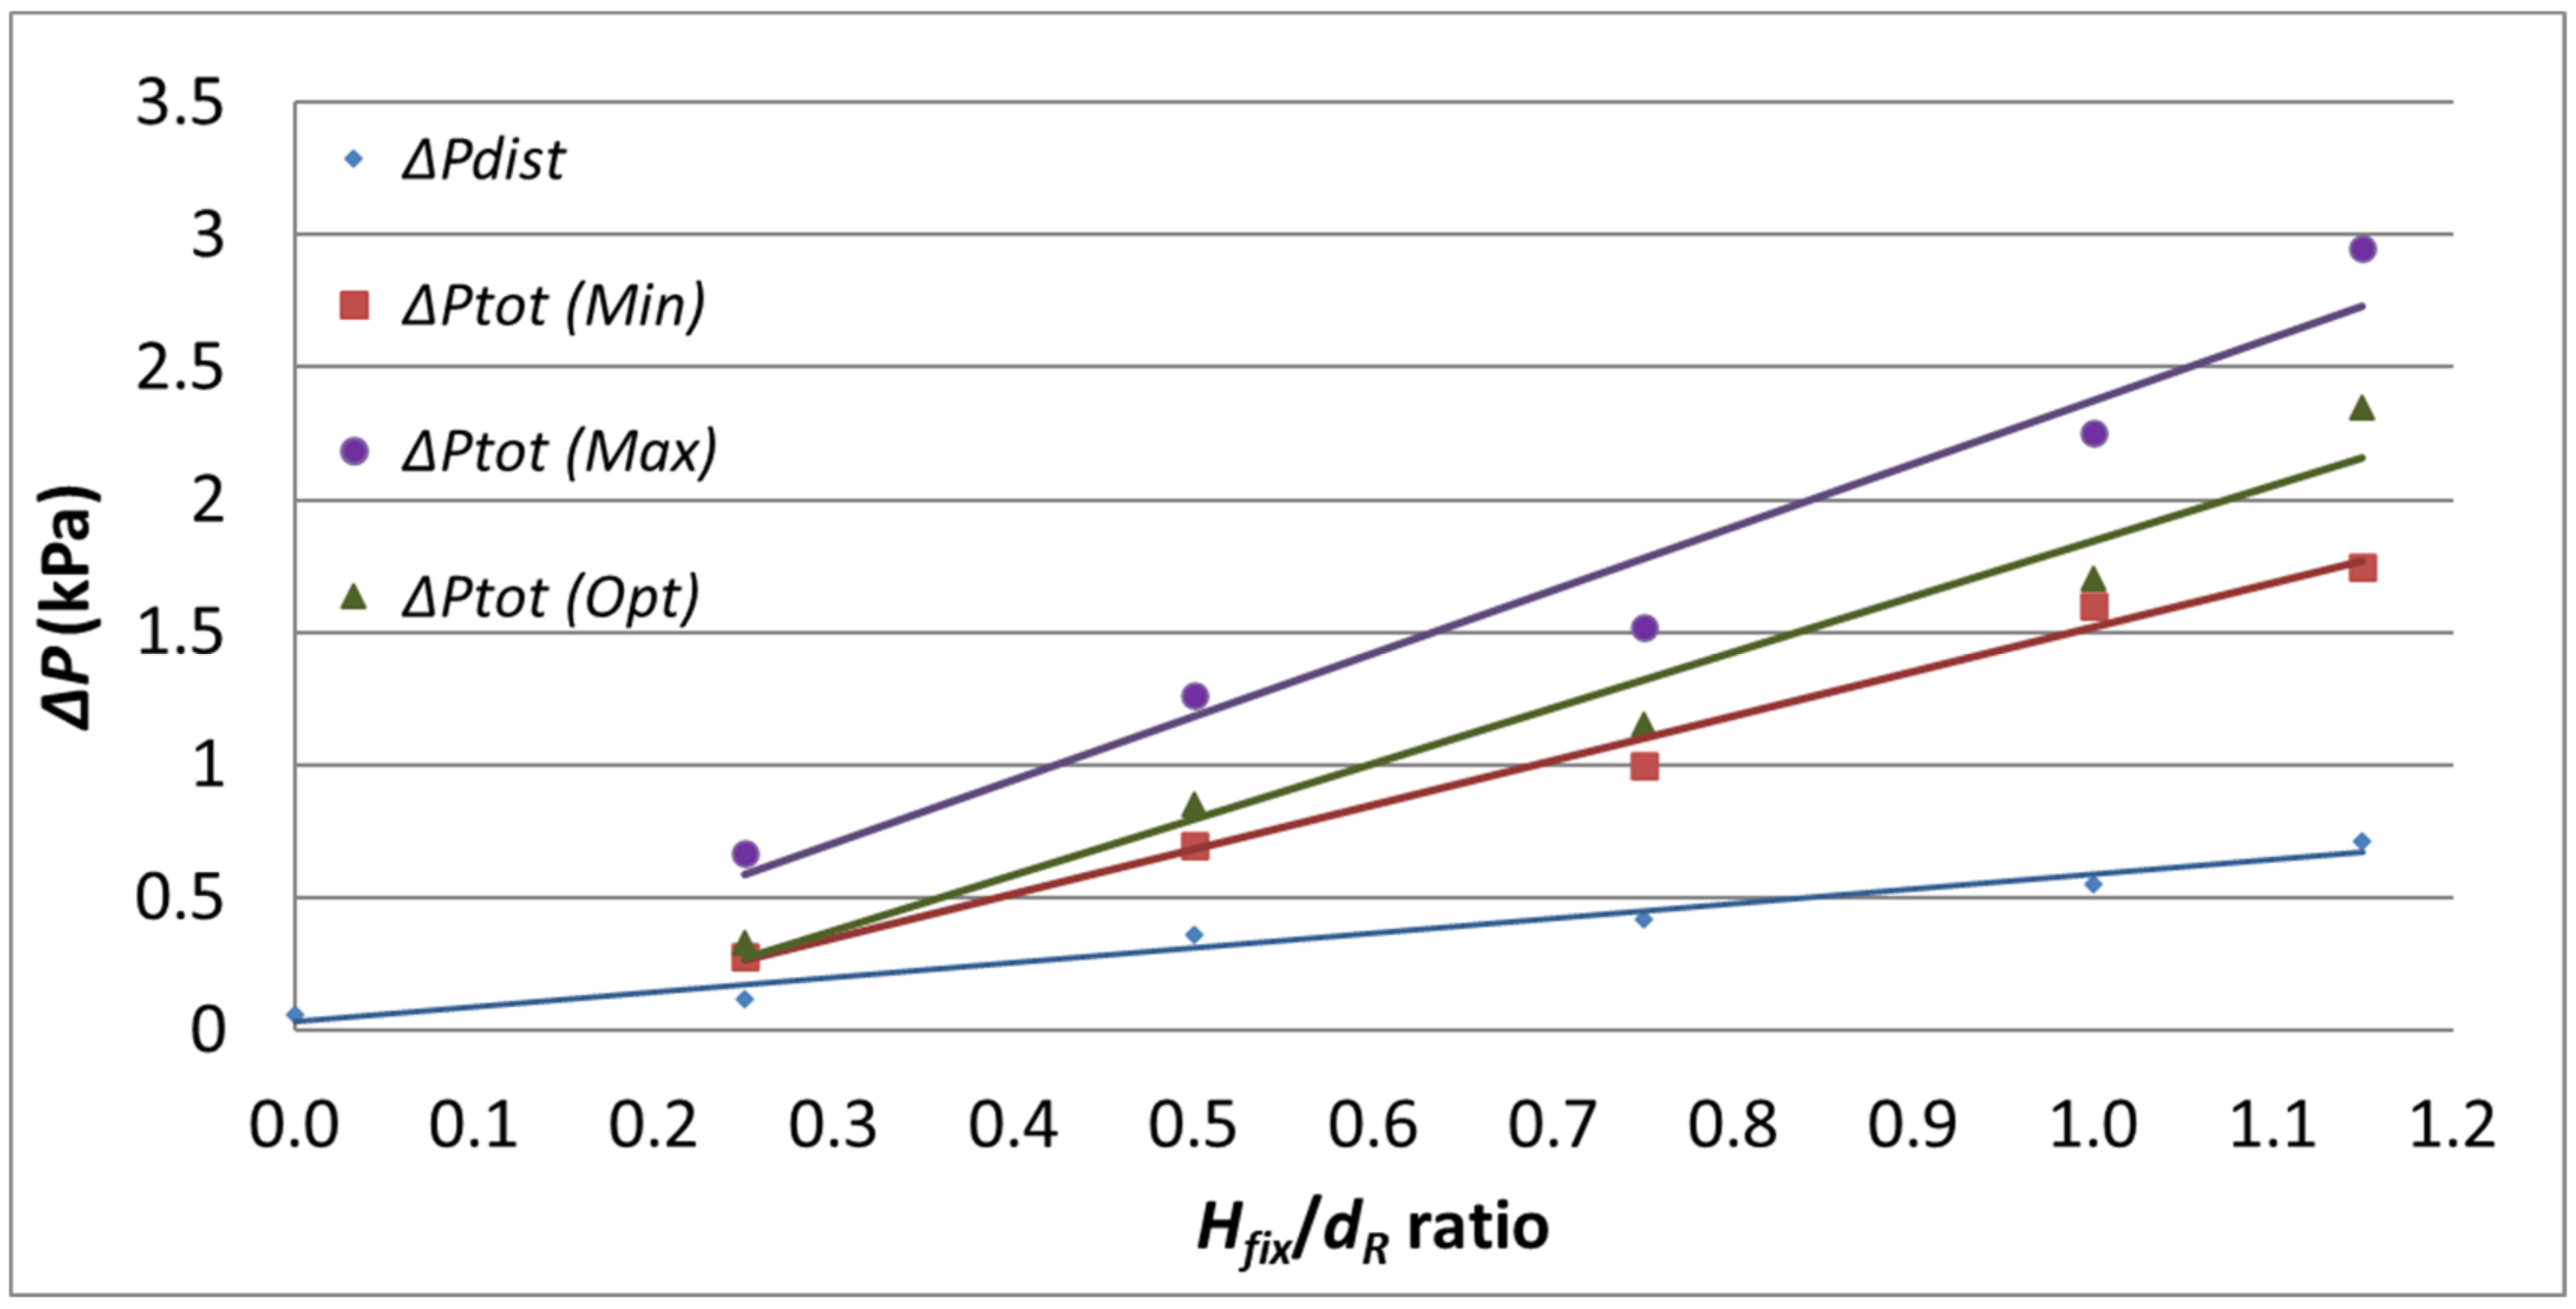
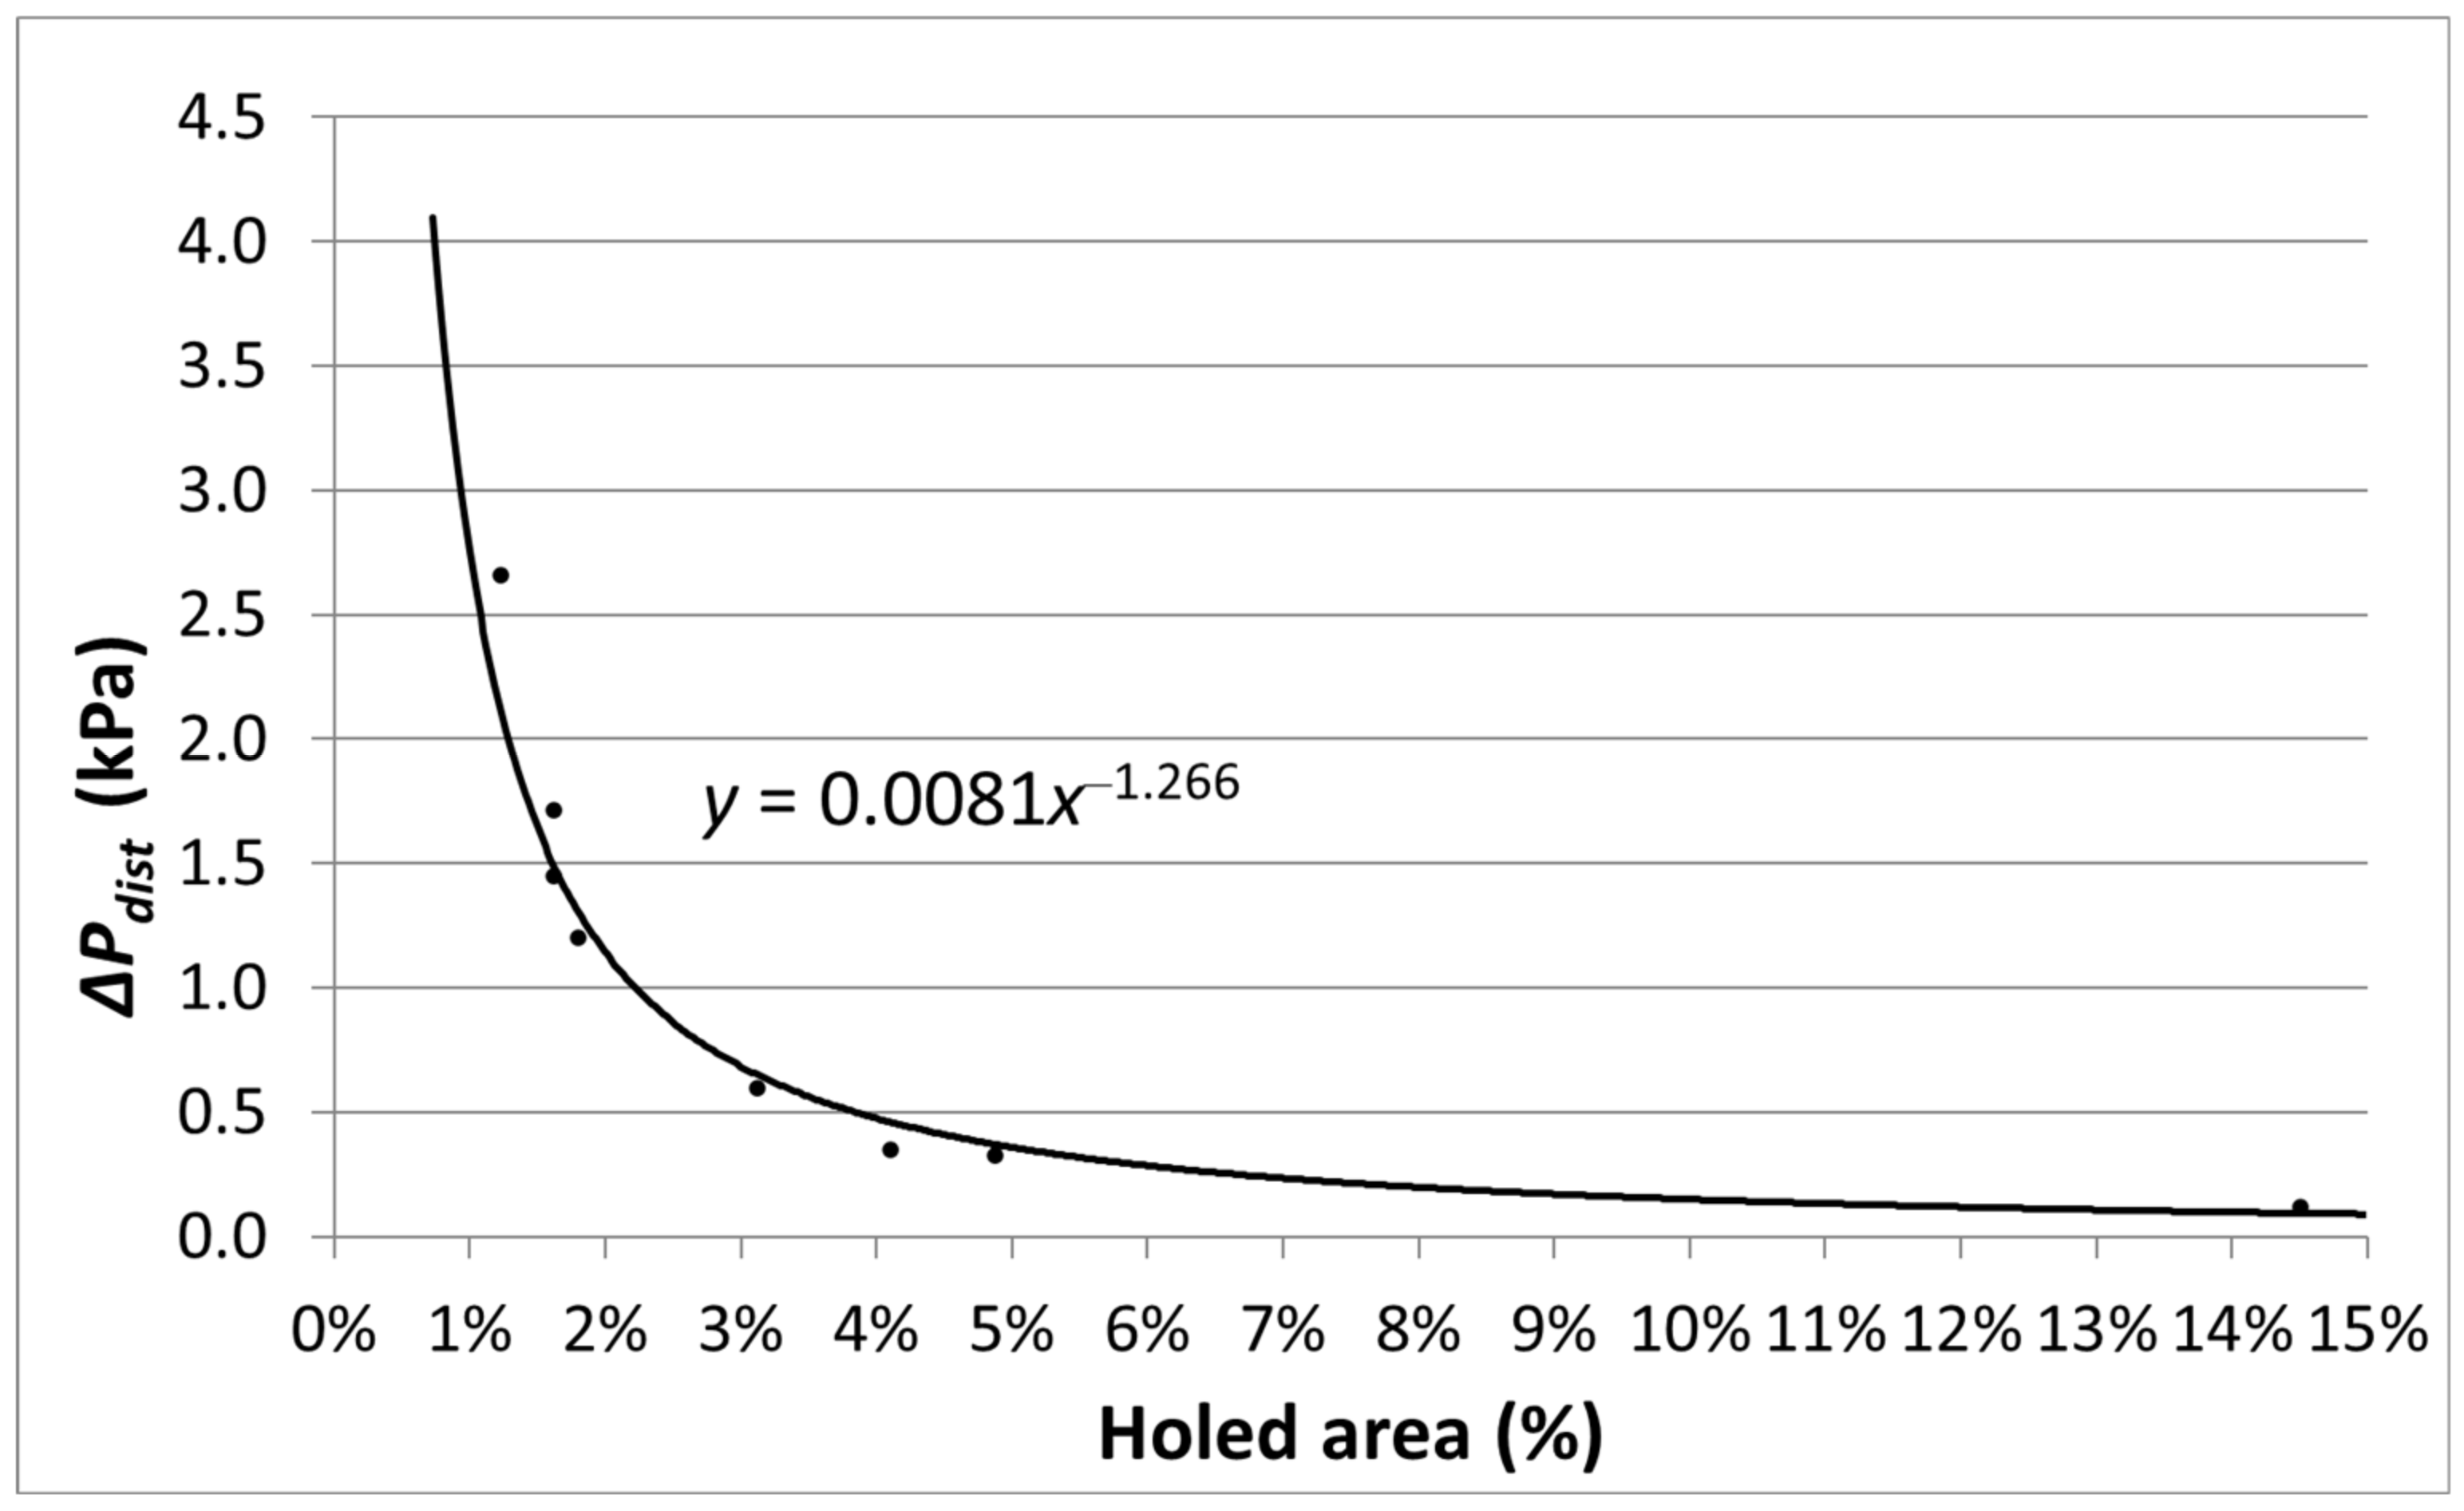
2.6. Distributor Design
3. Results
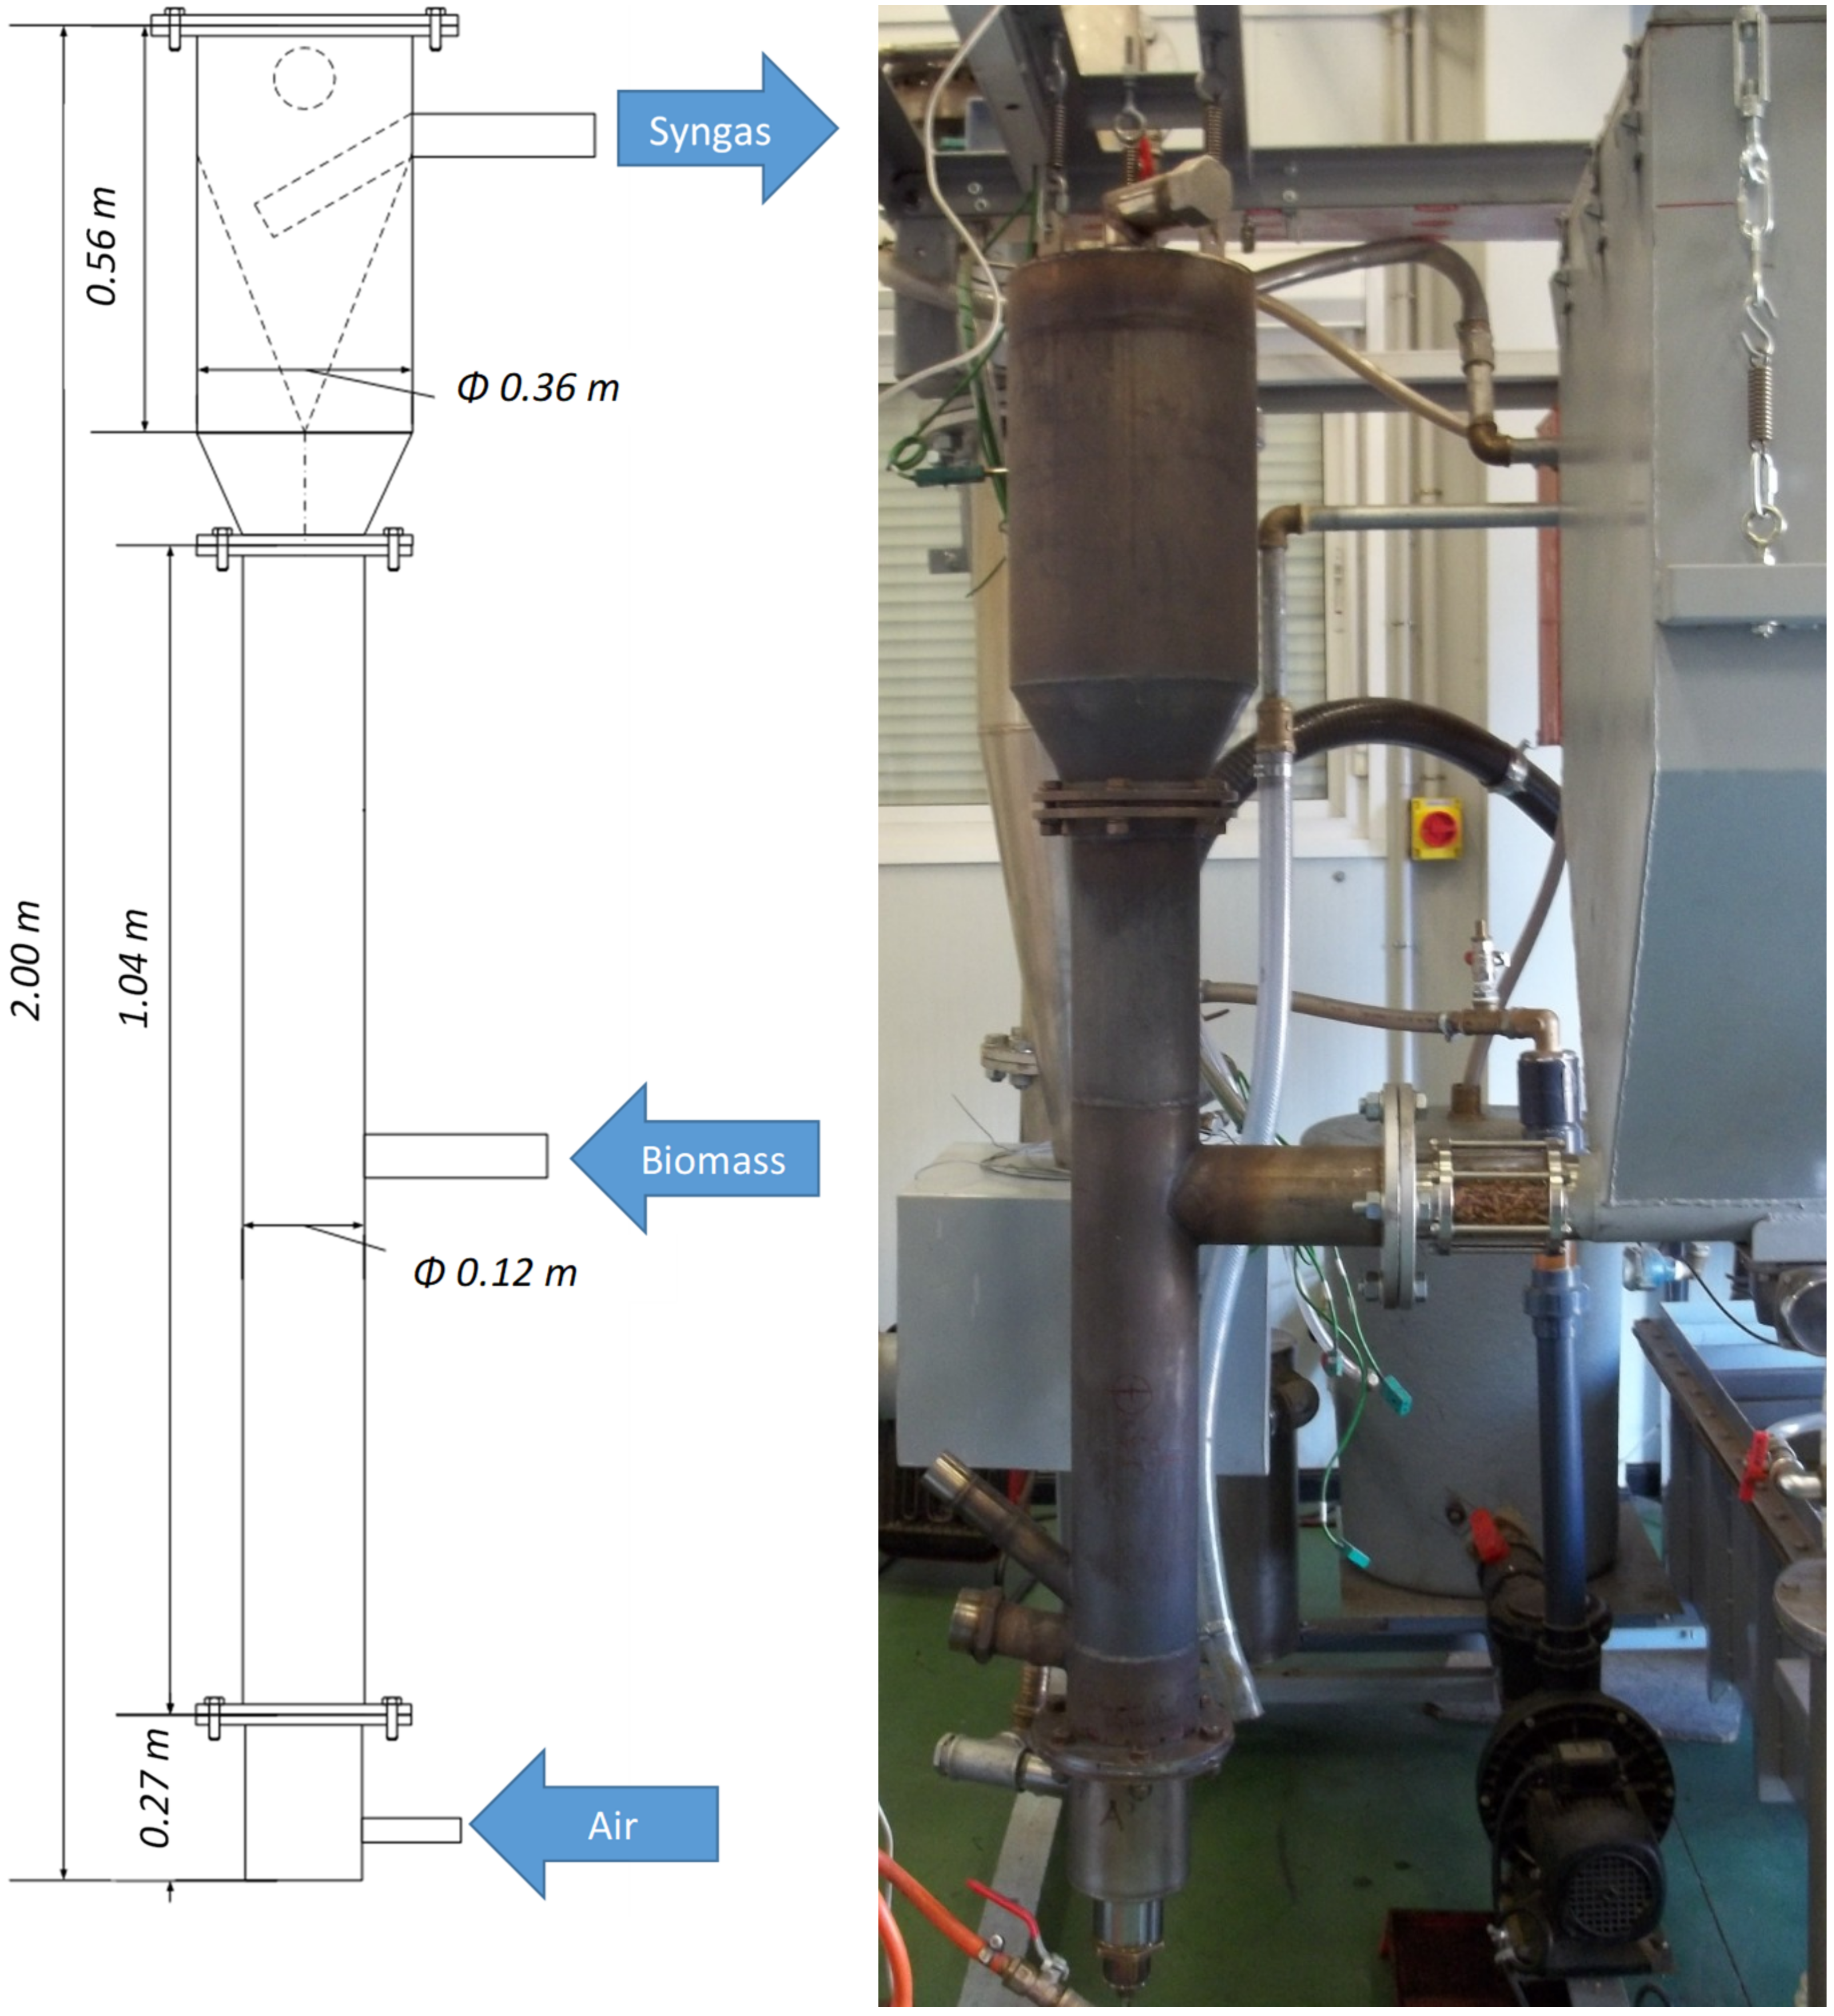
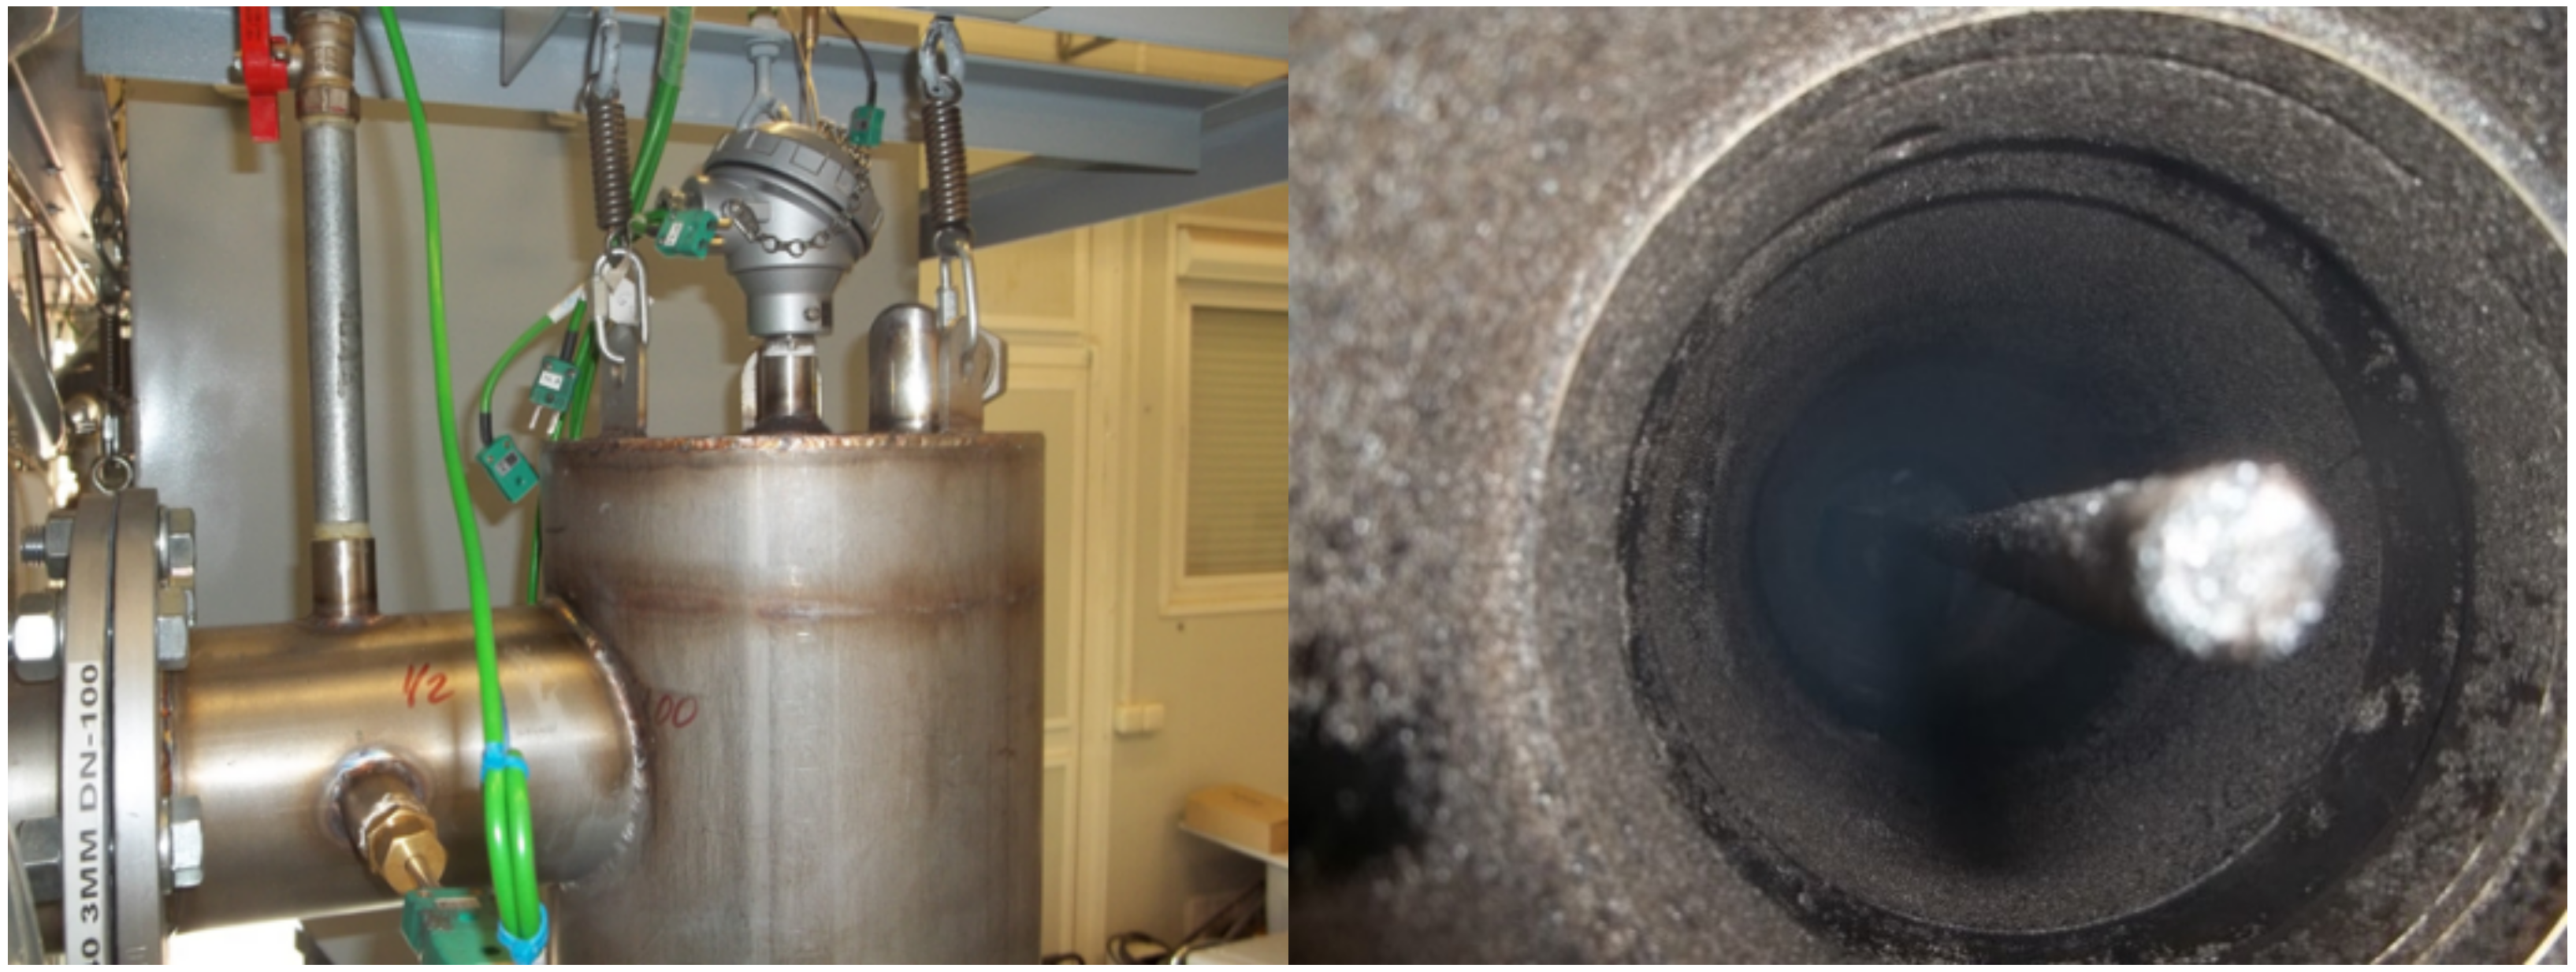
3.1. Construction
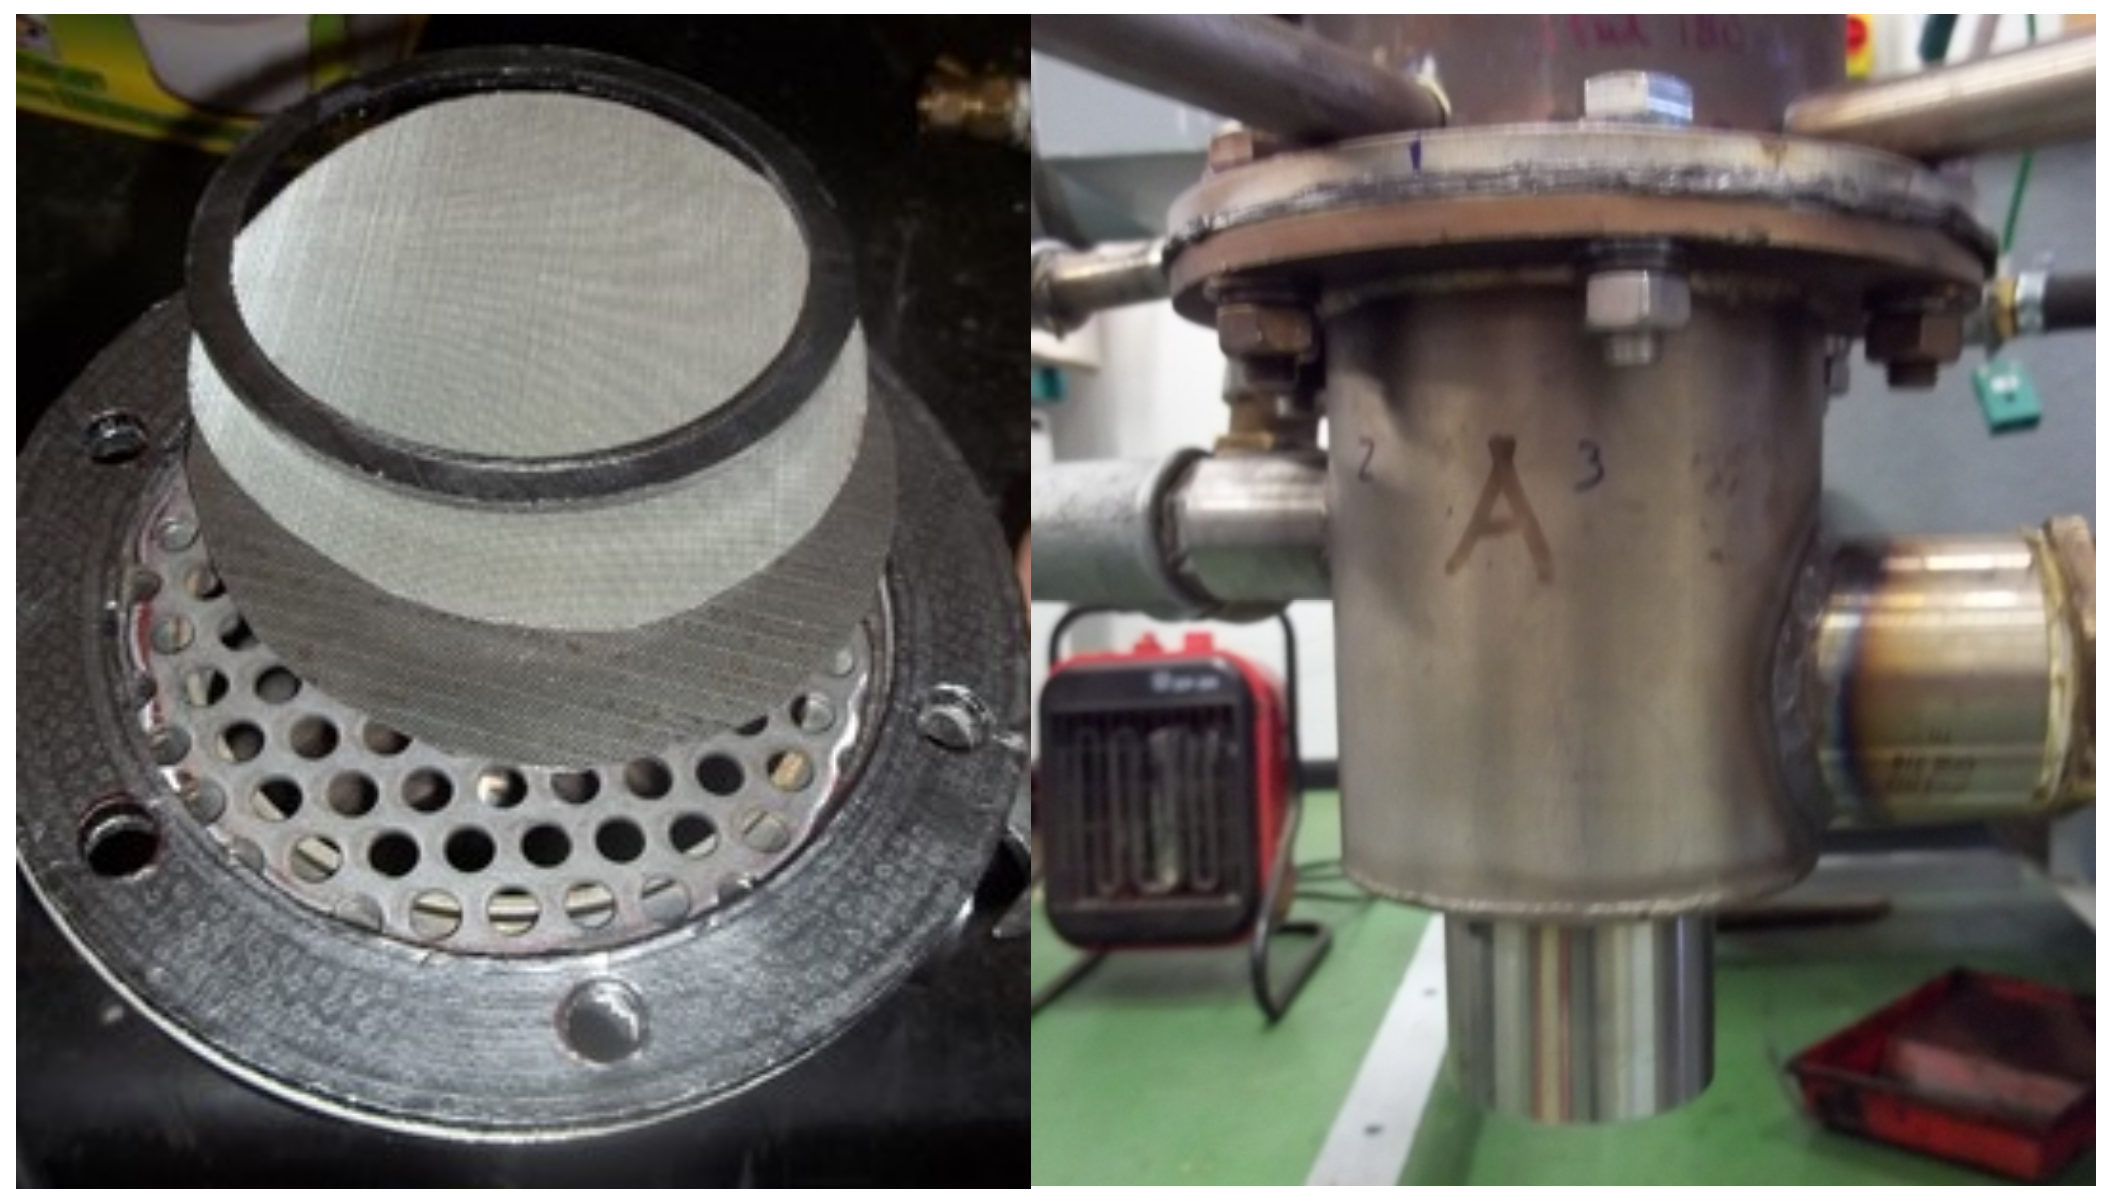
3.2. Air Intake System
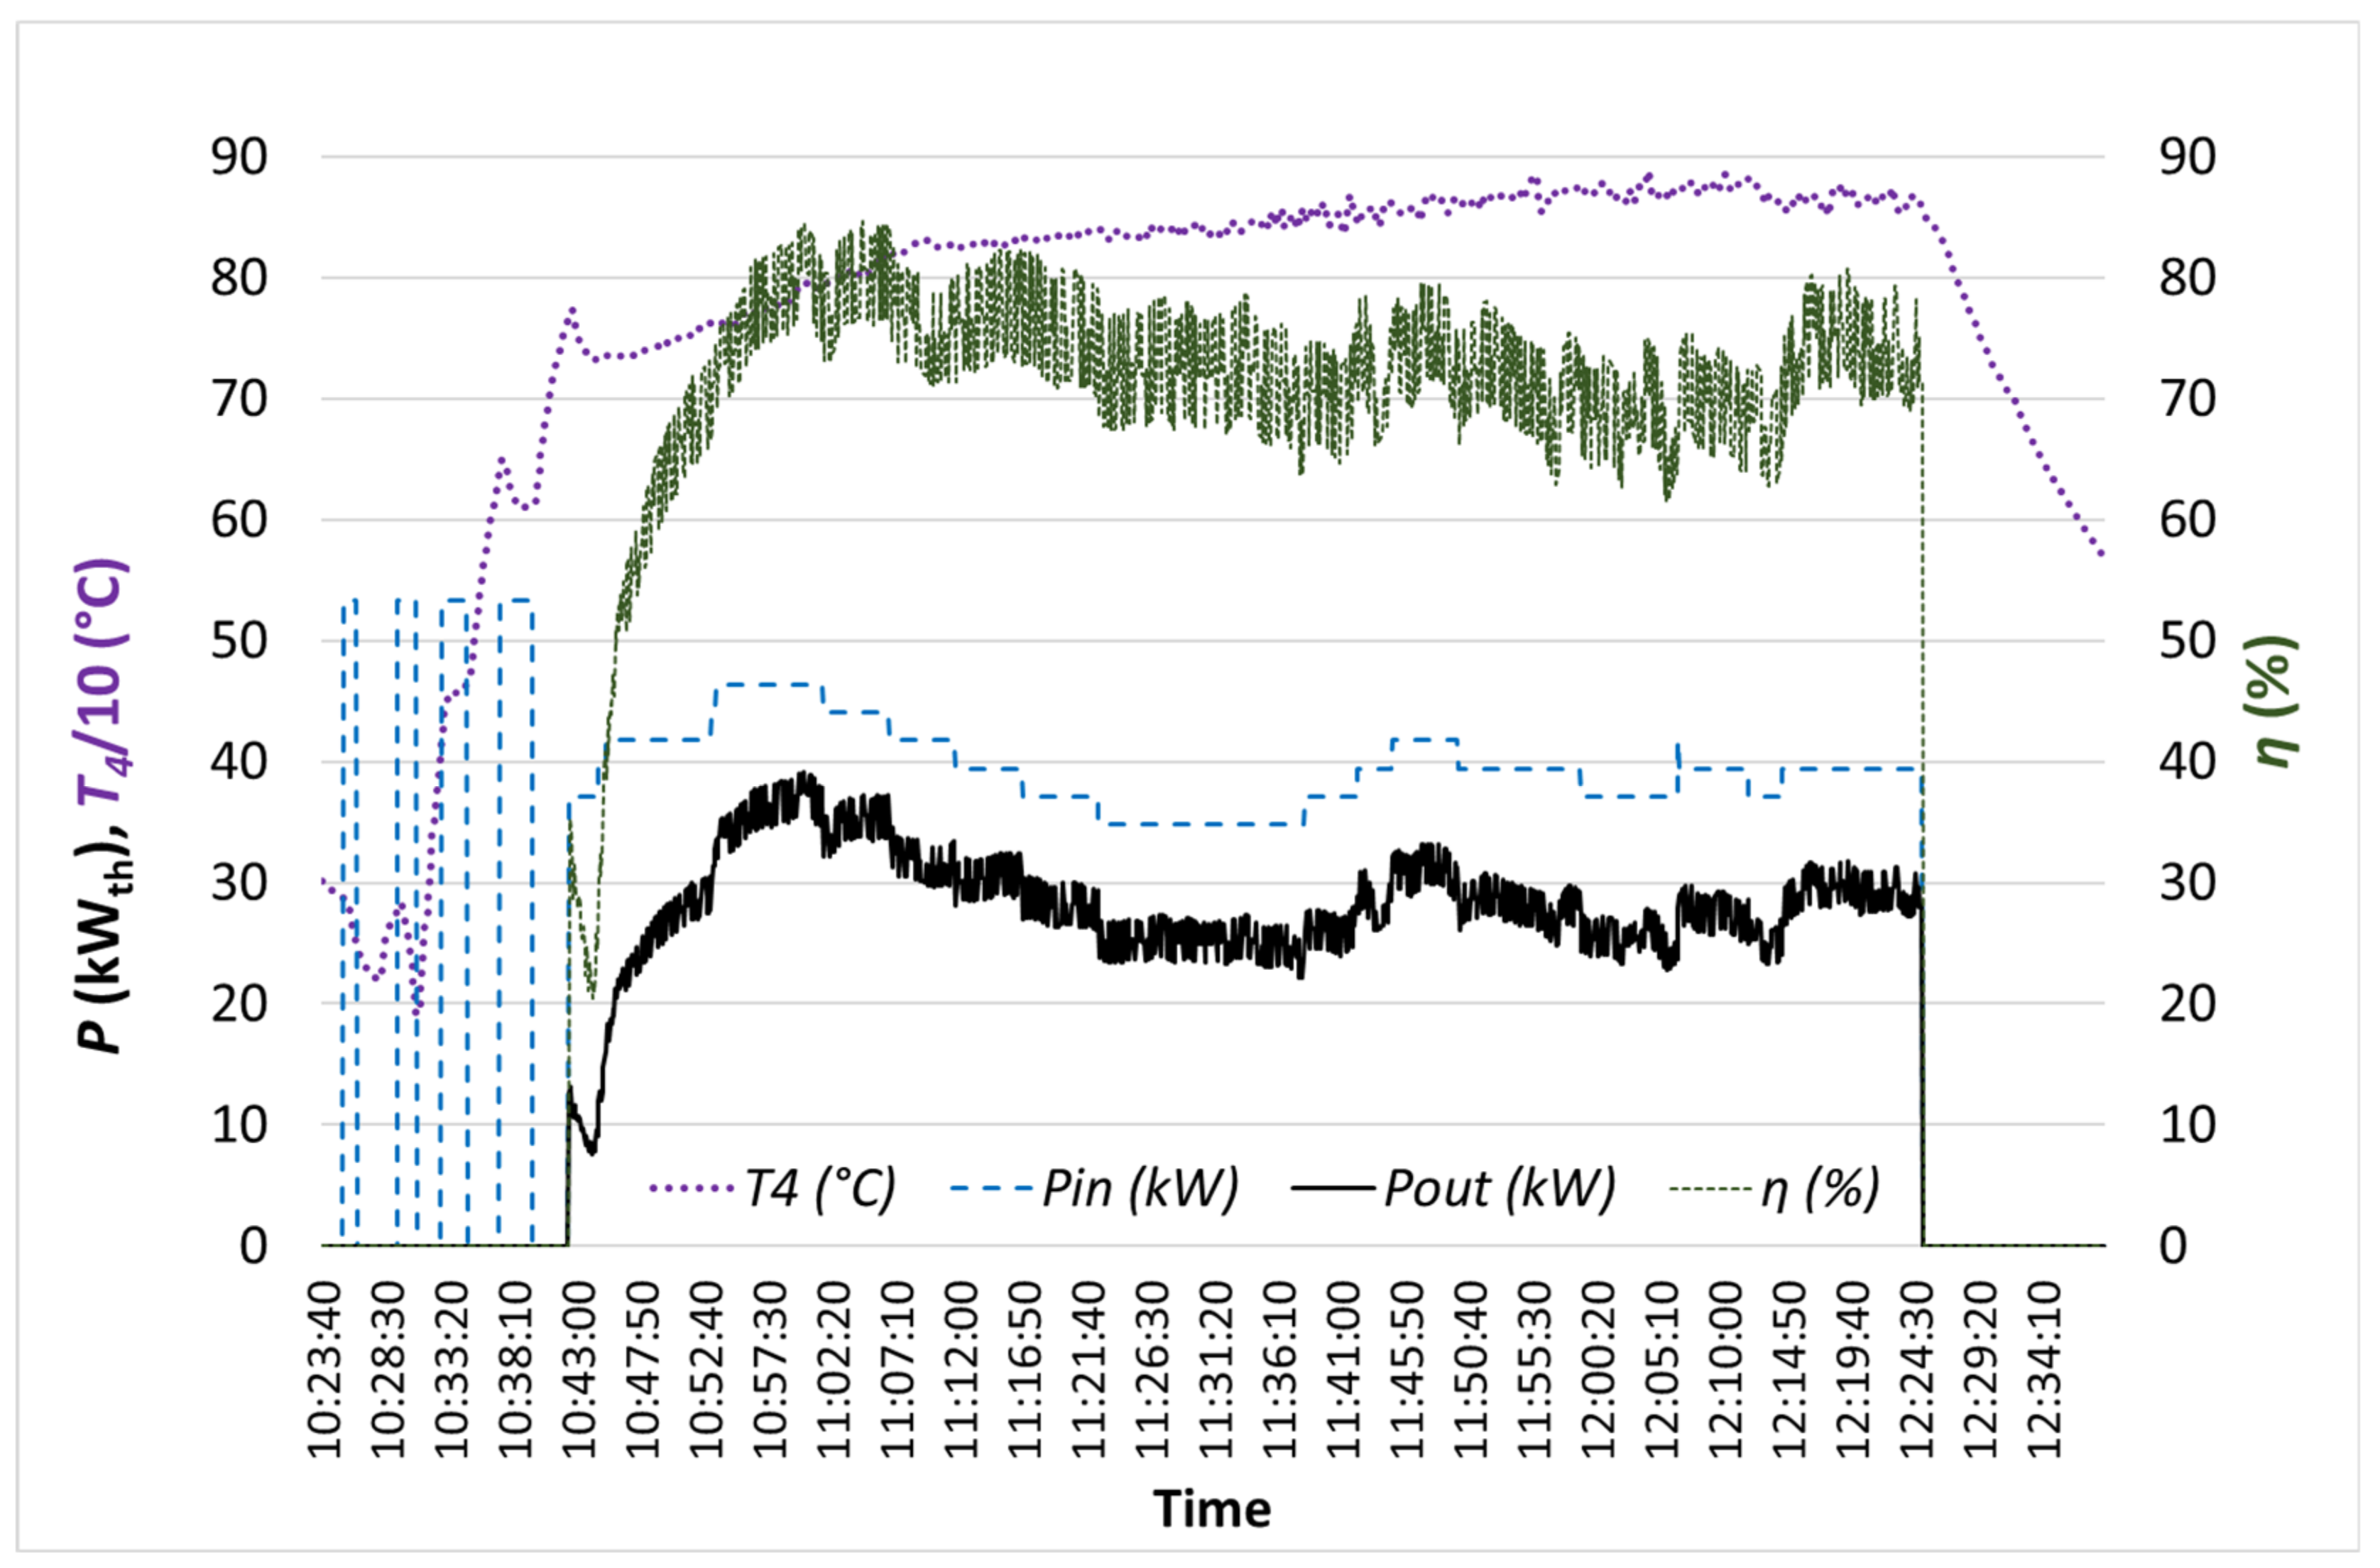
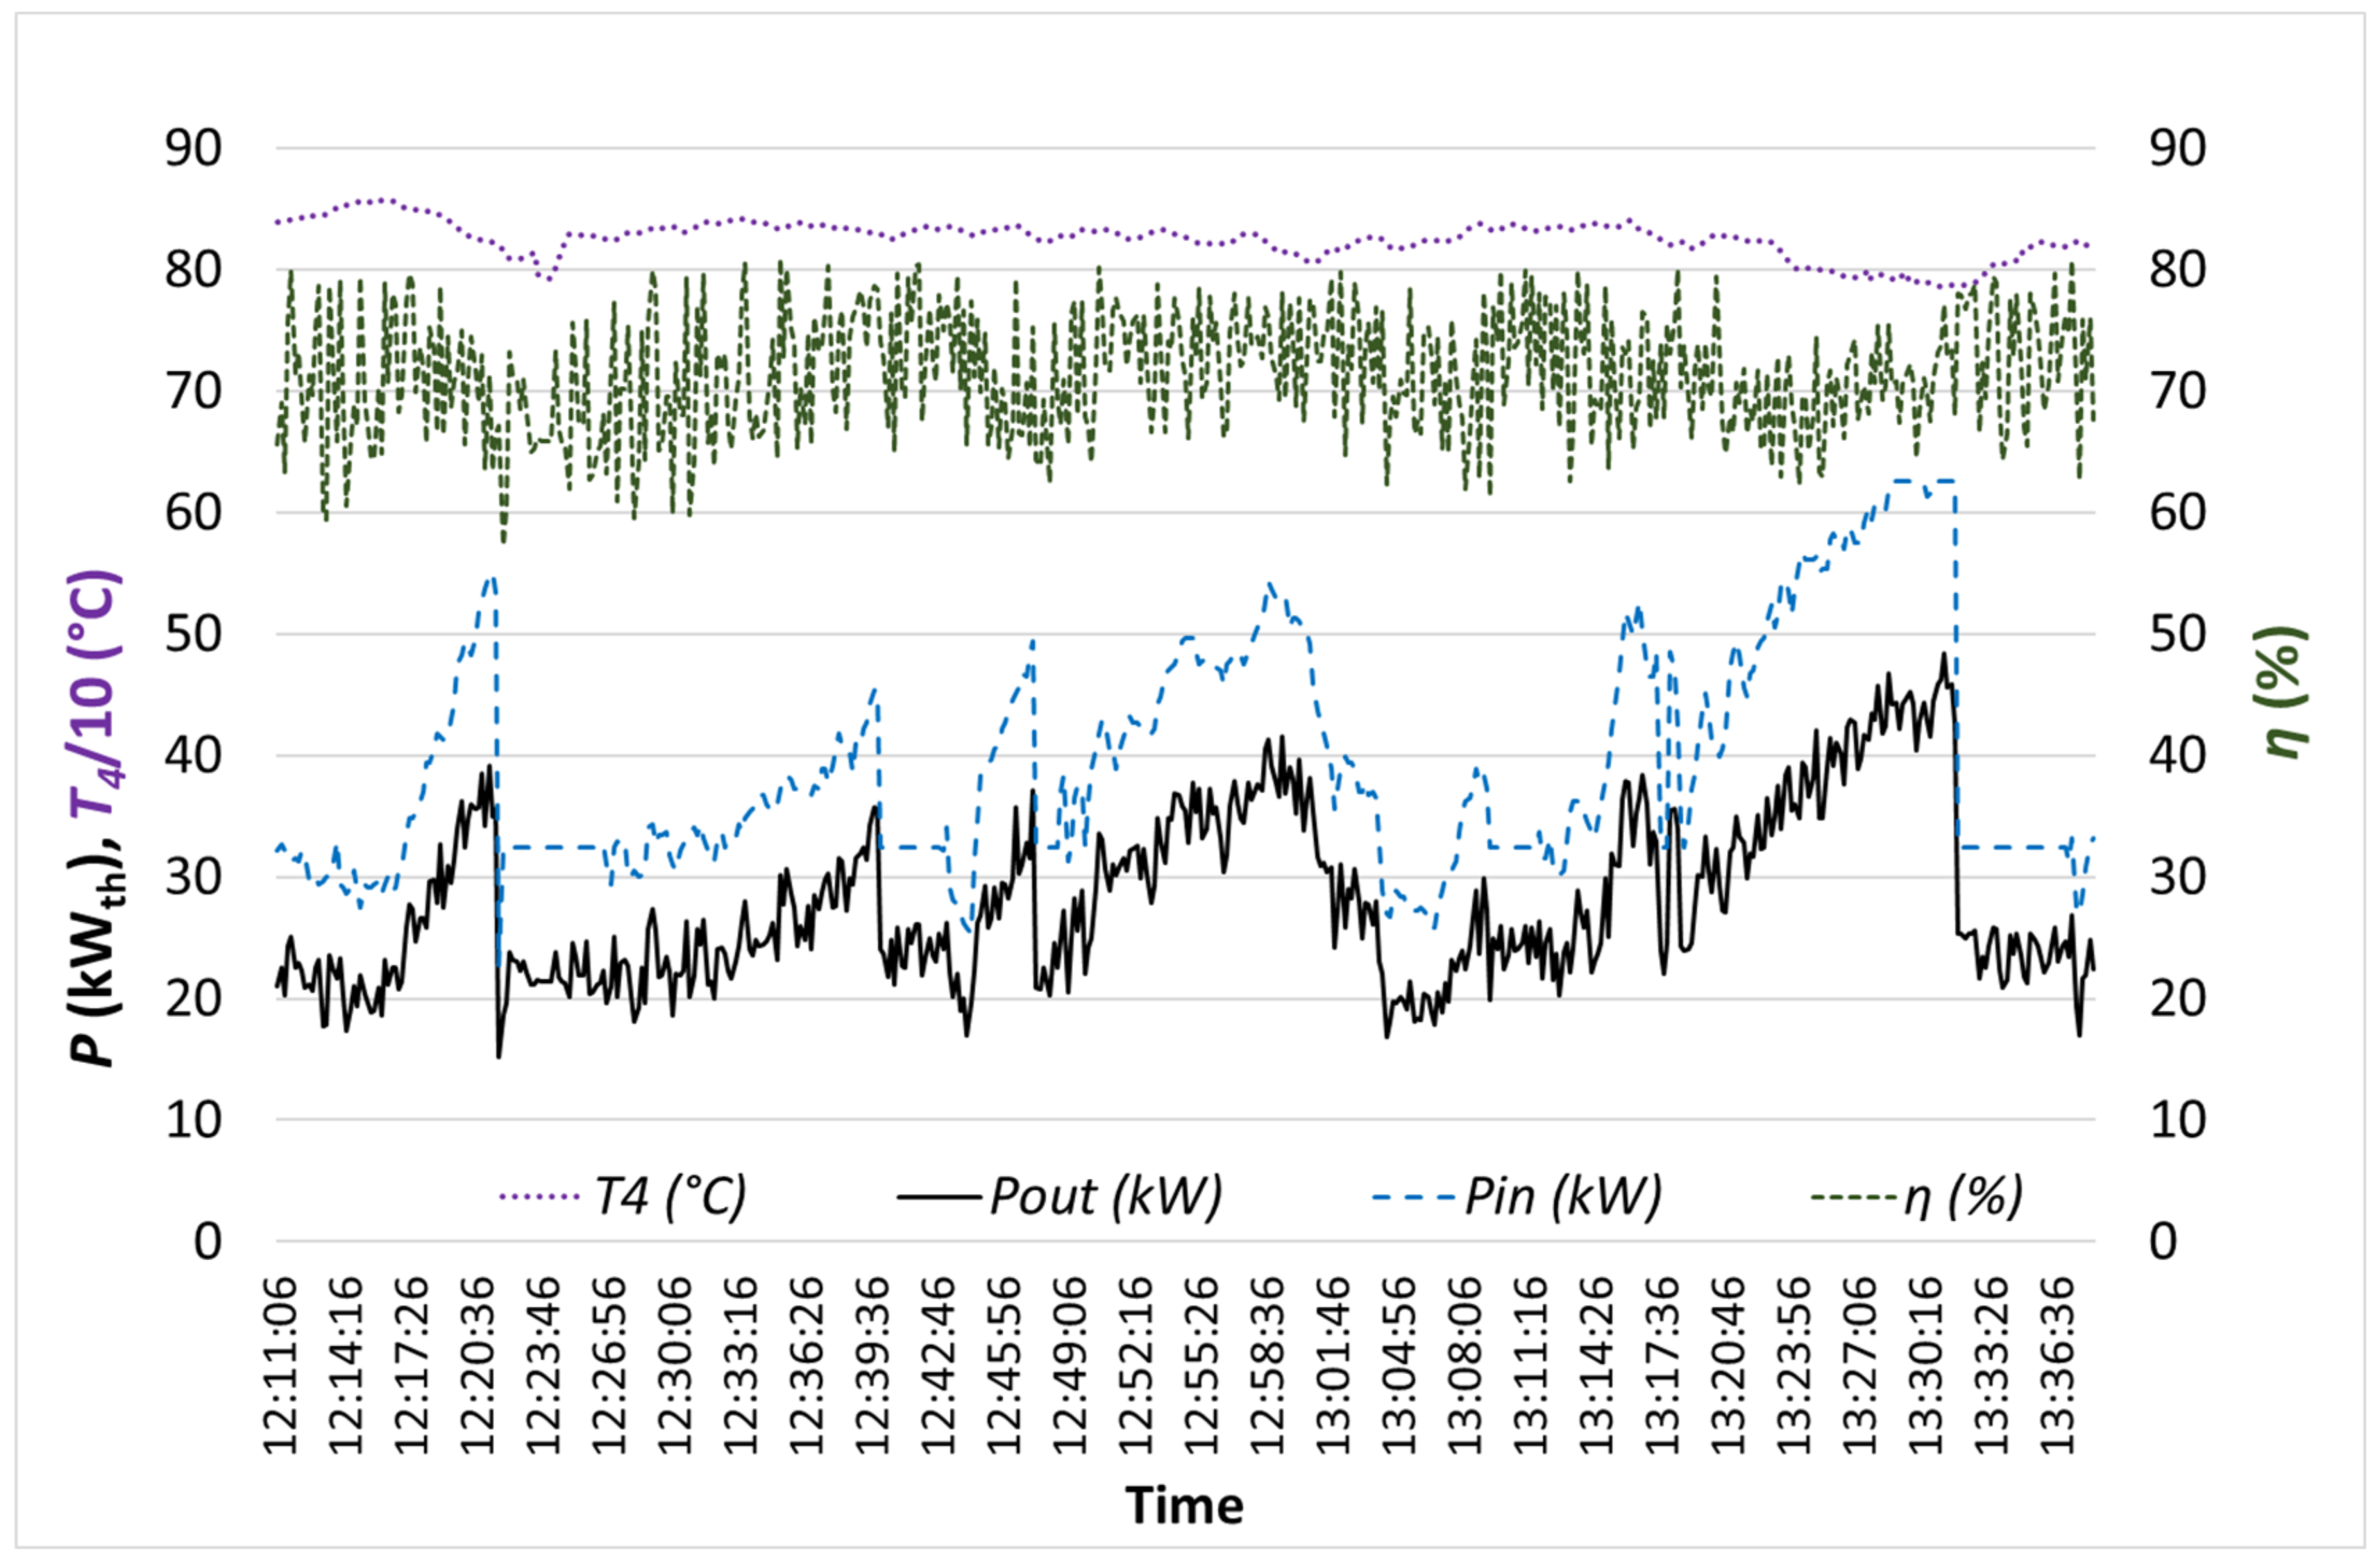
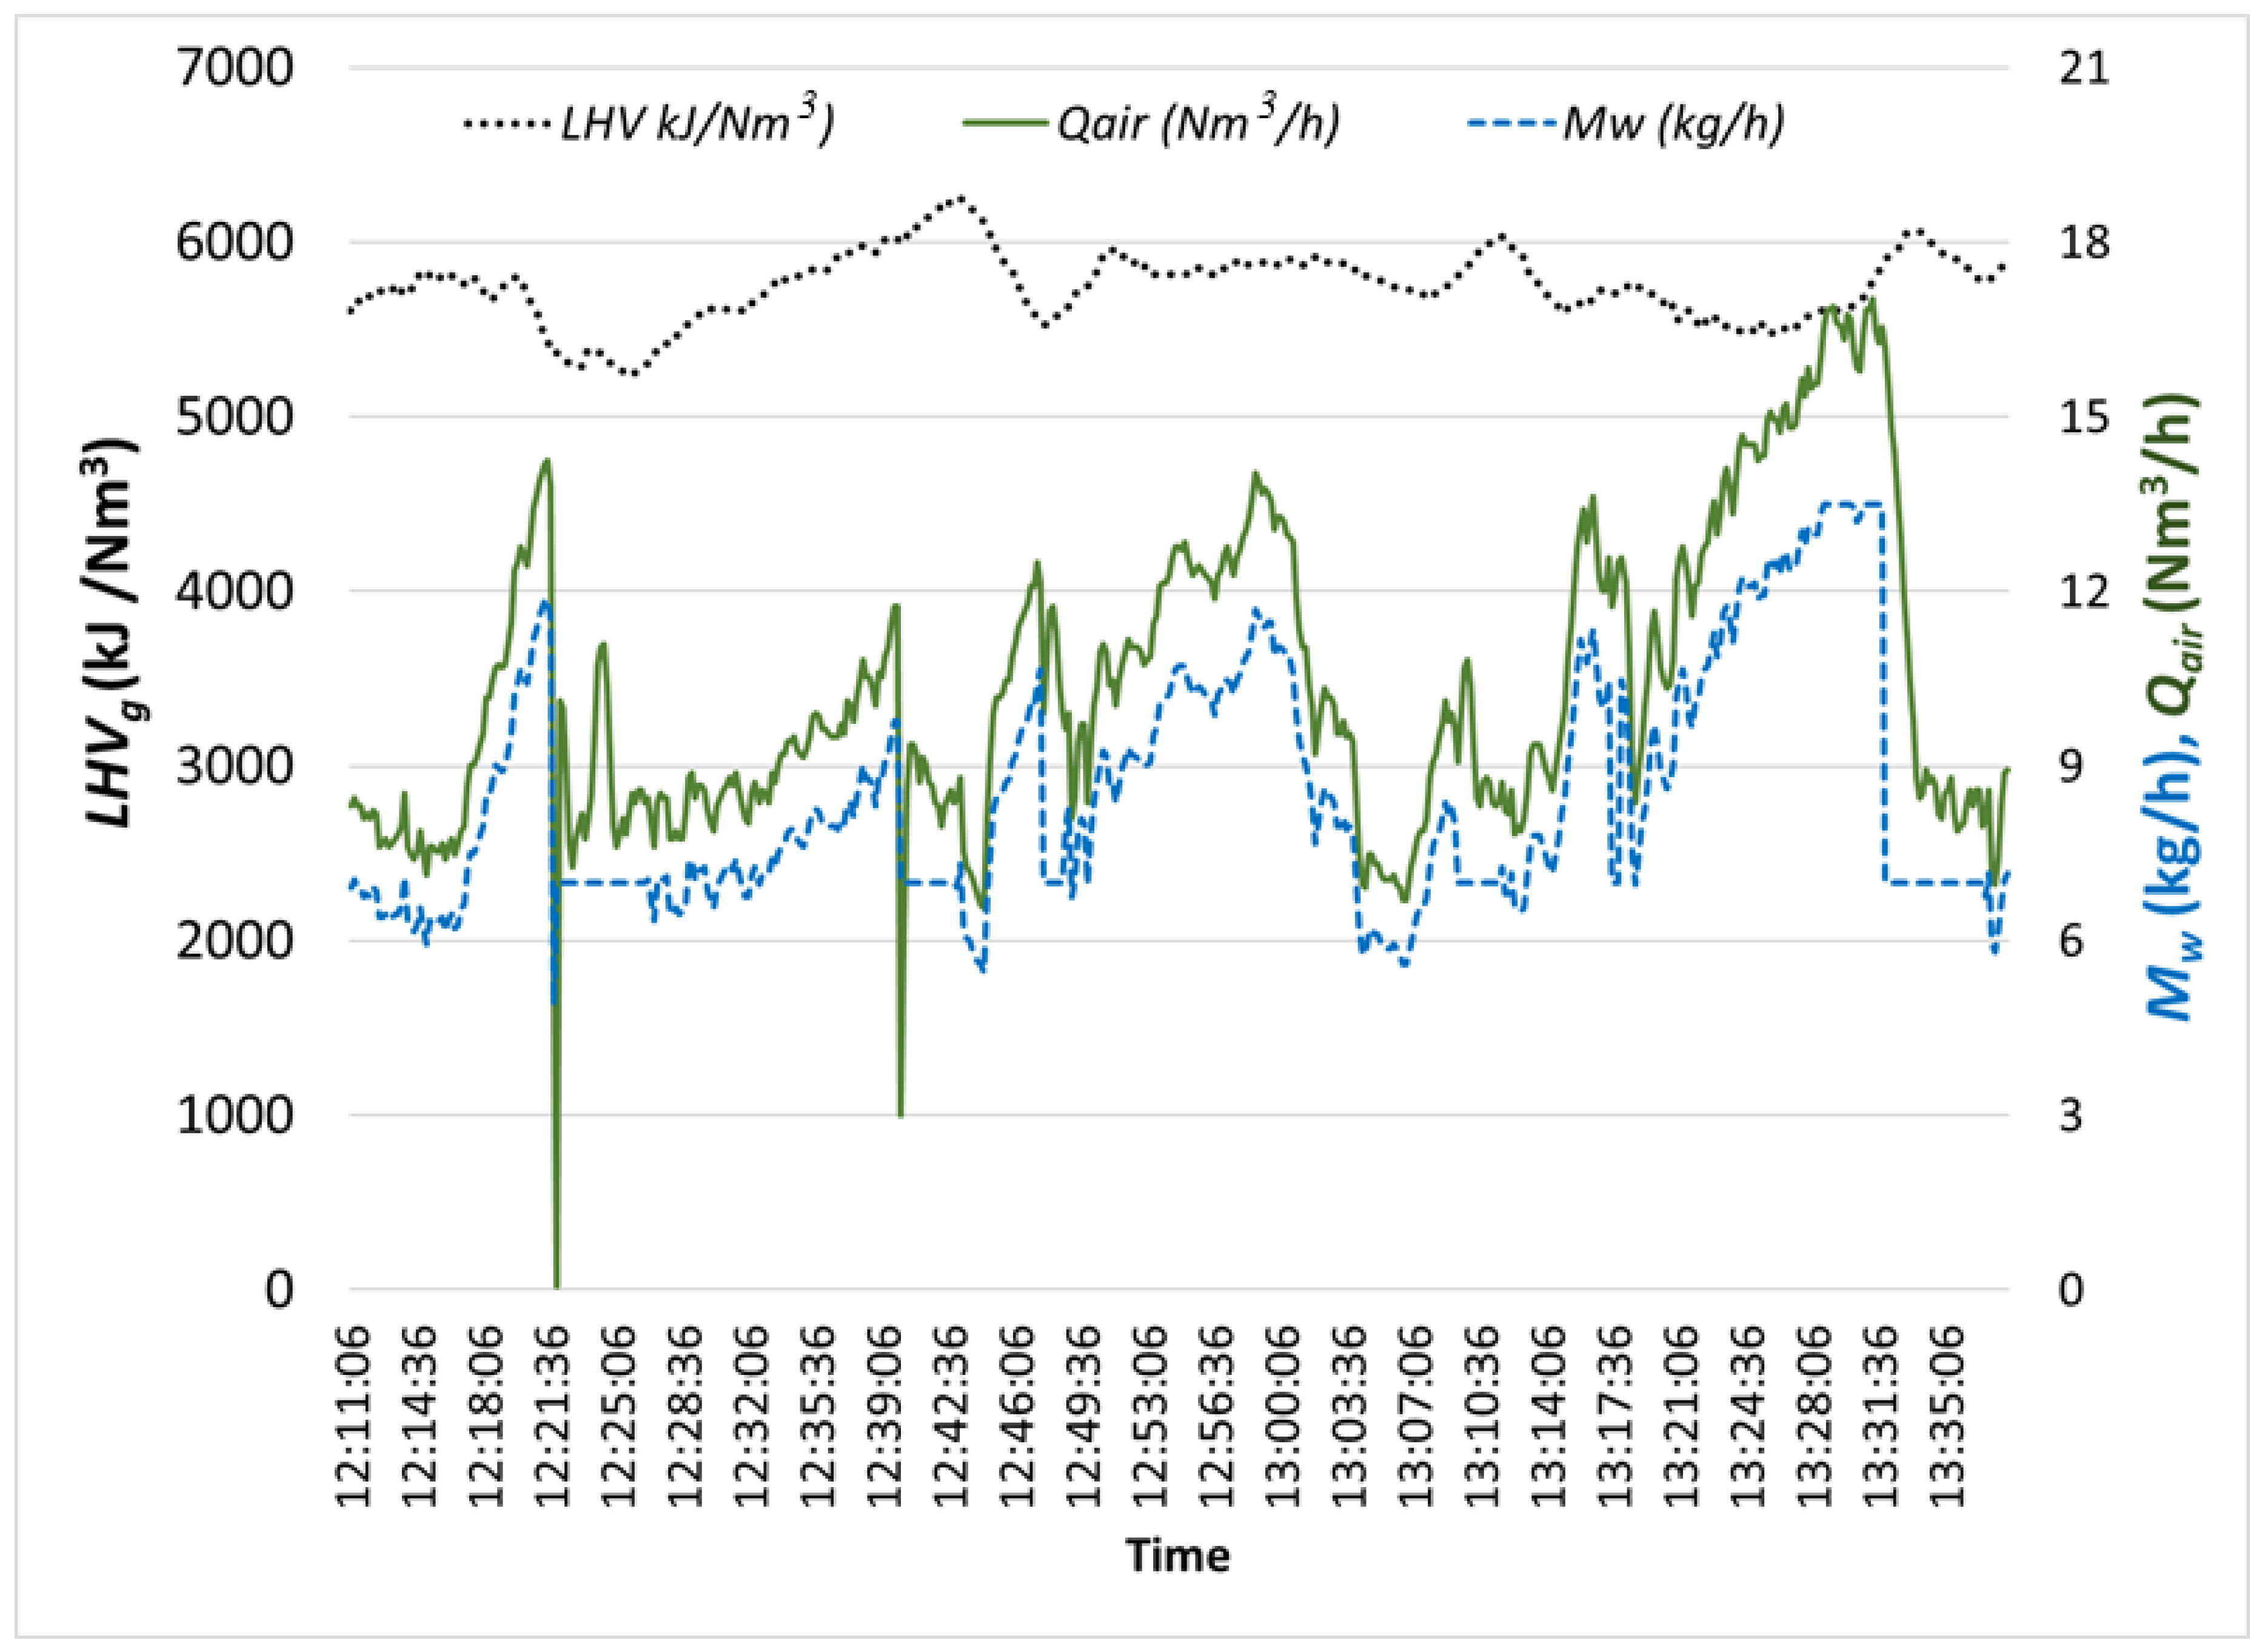
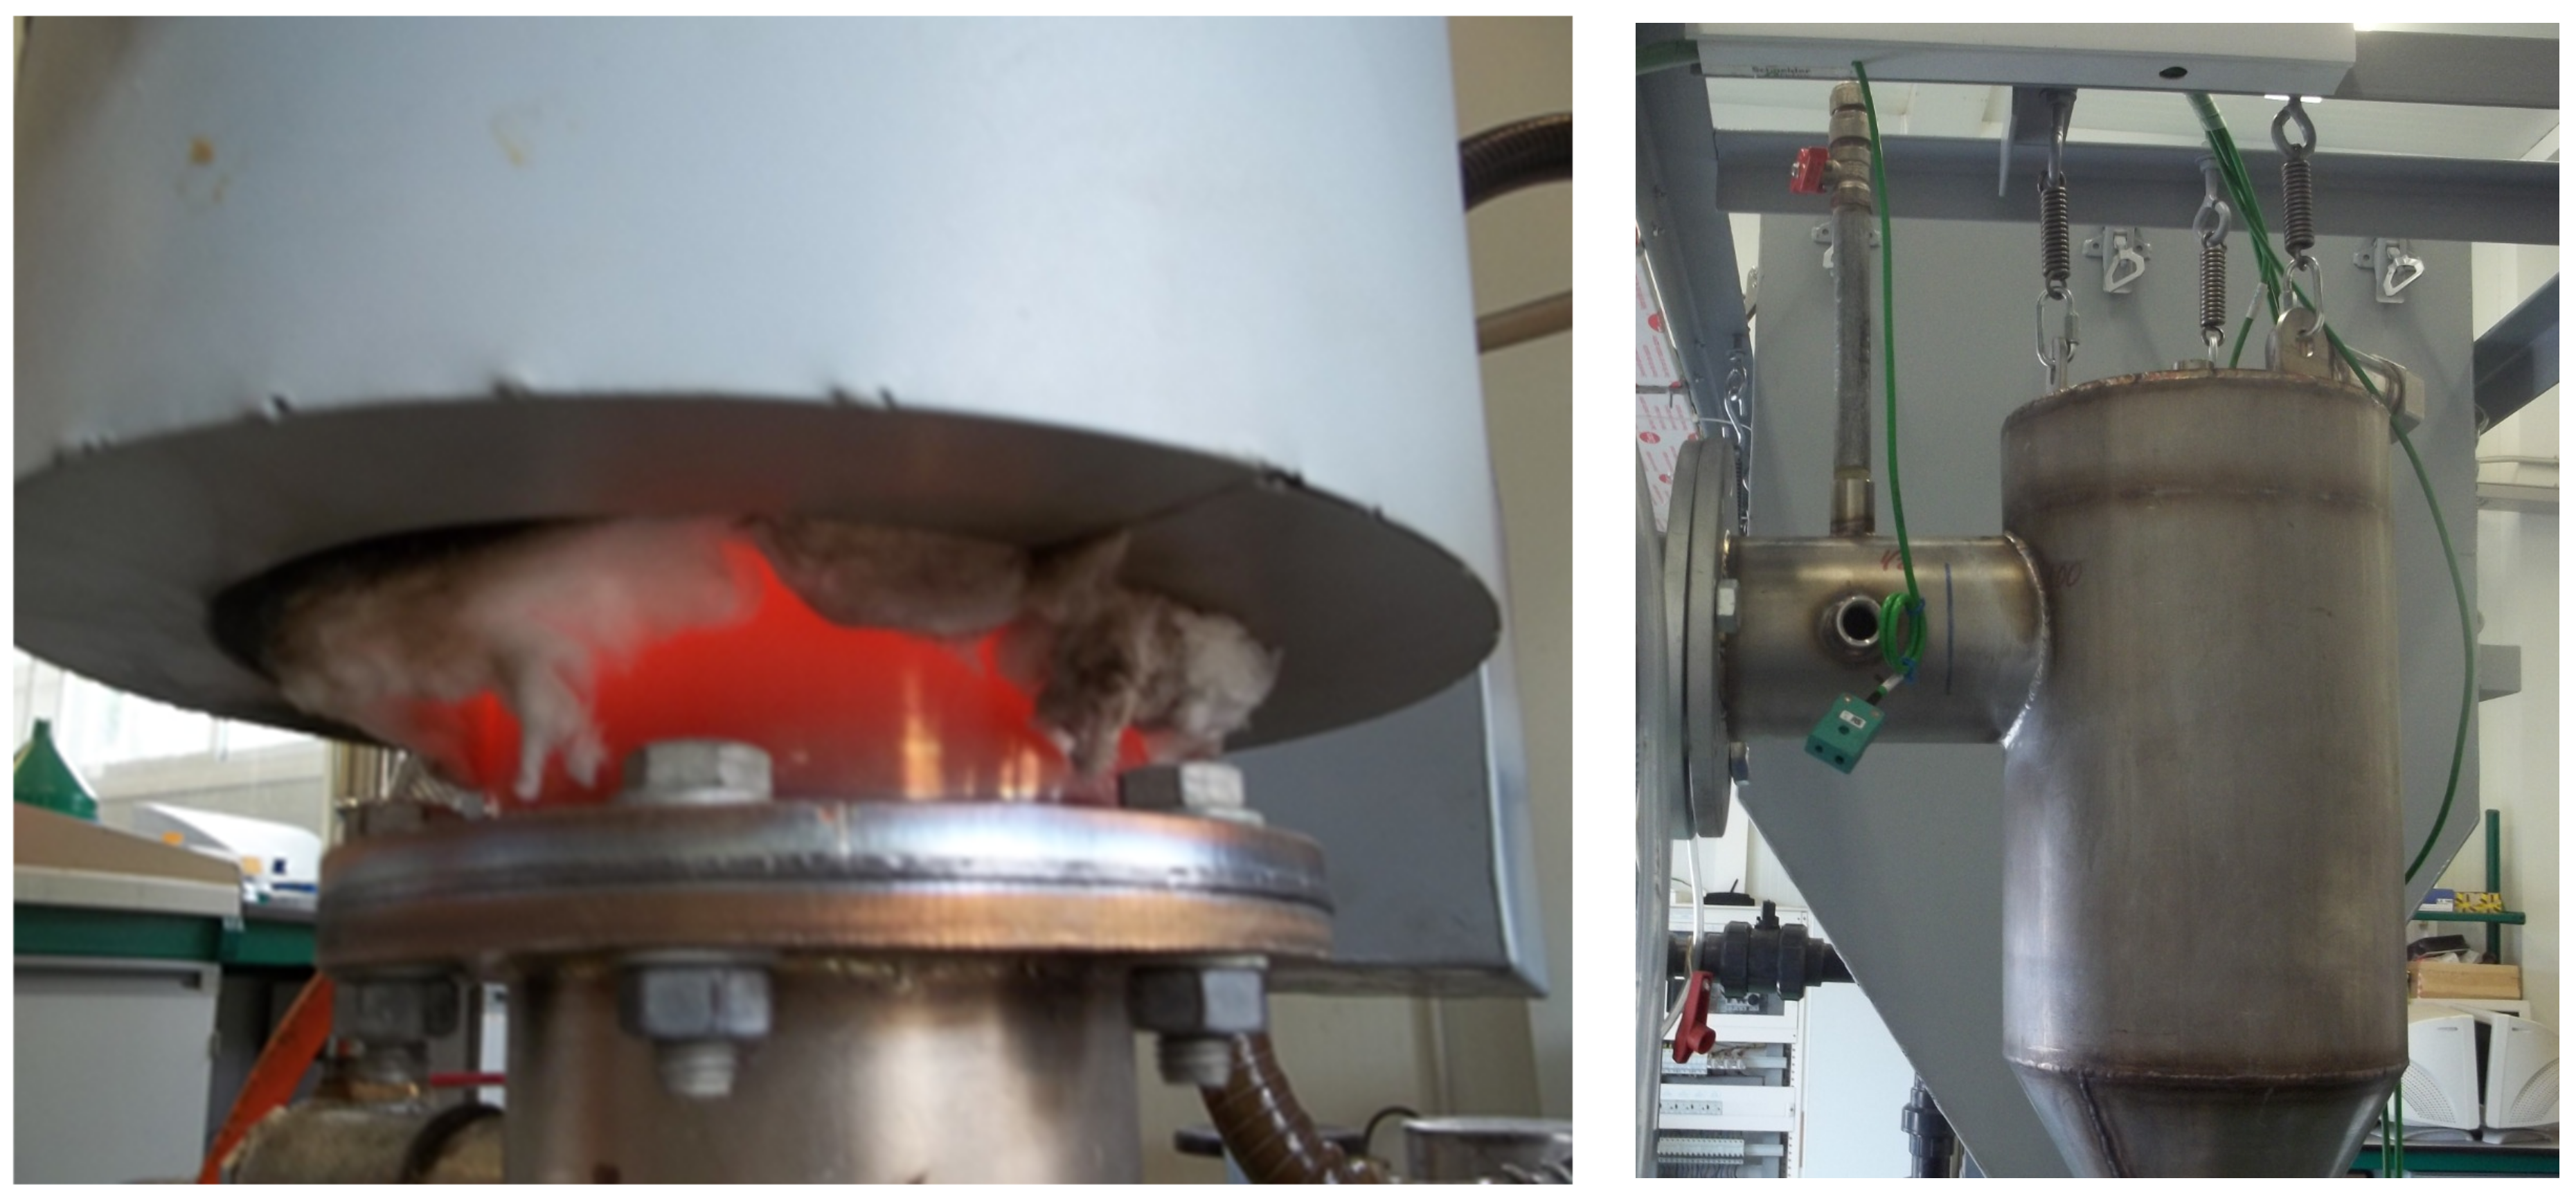
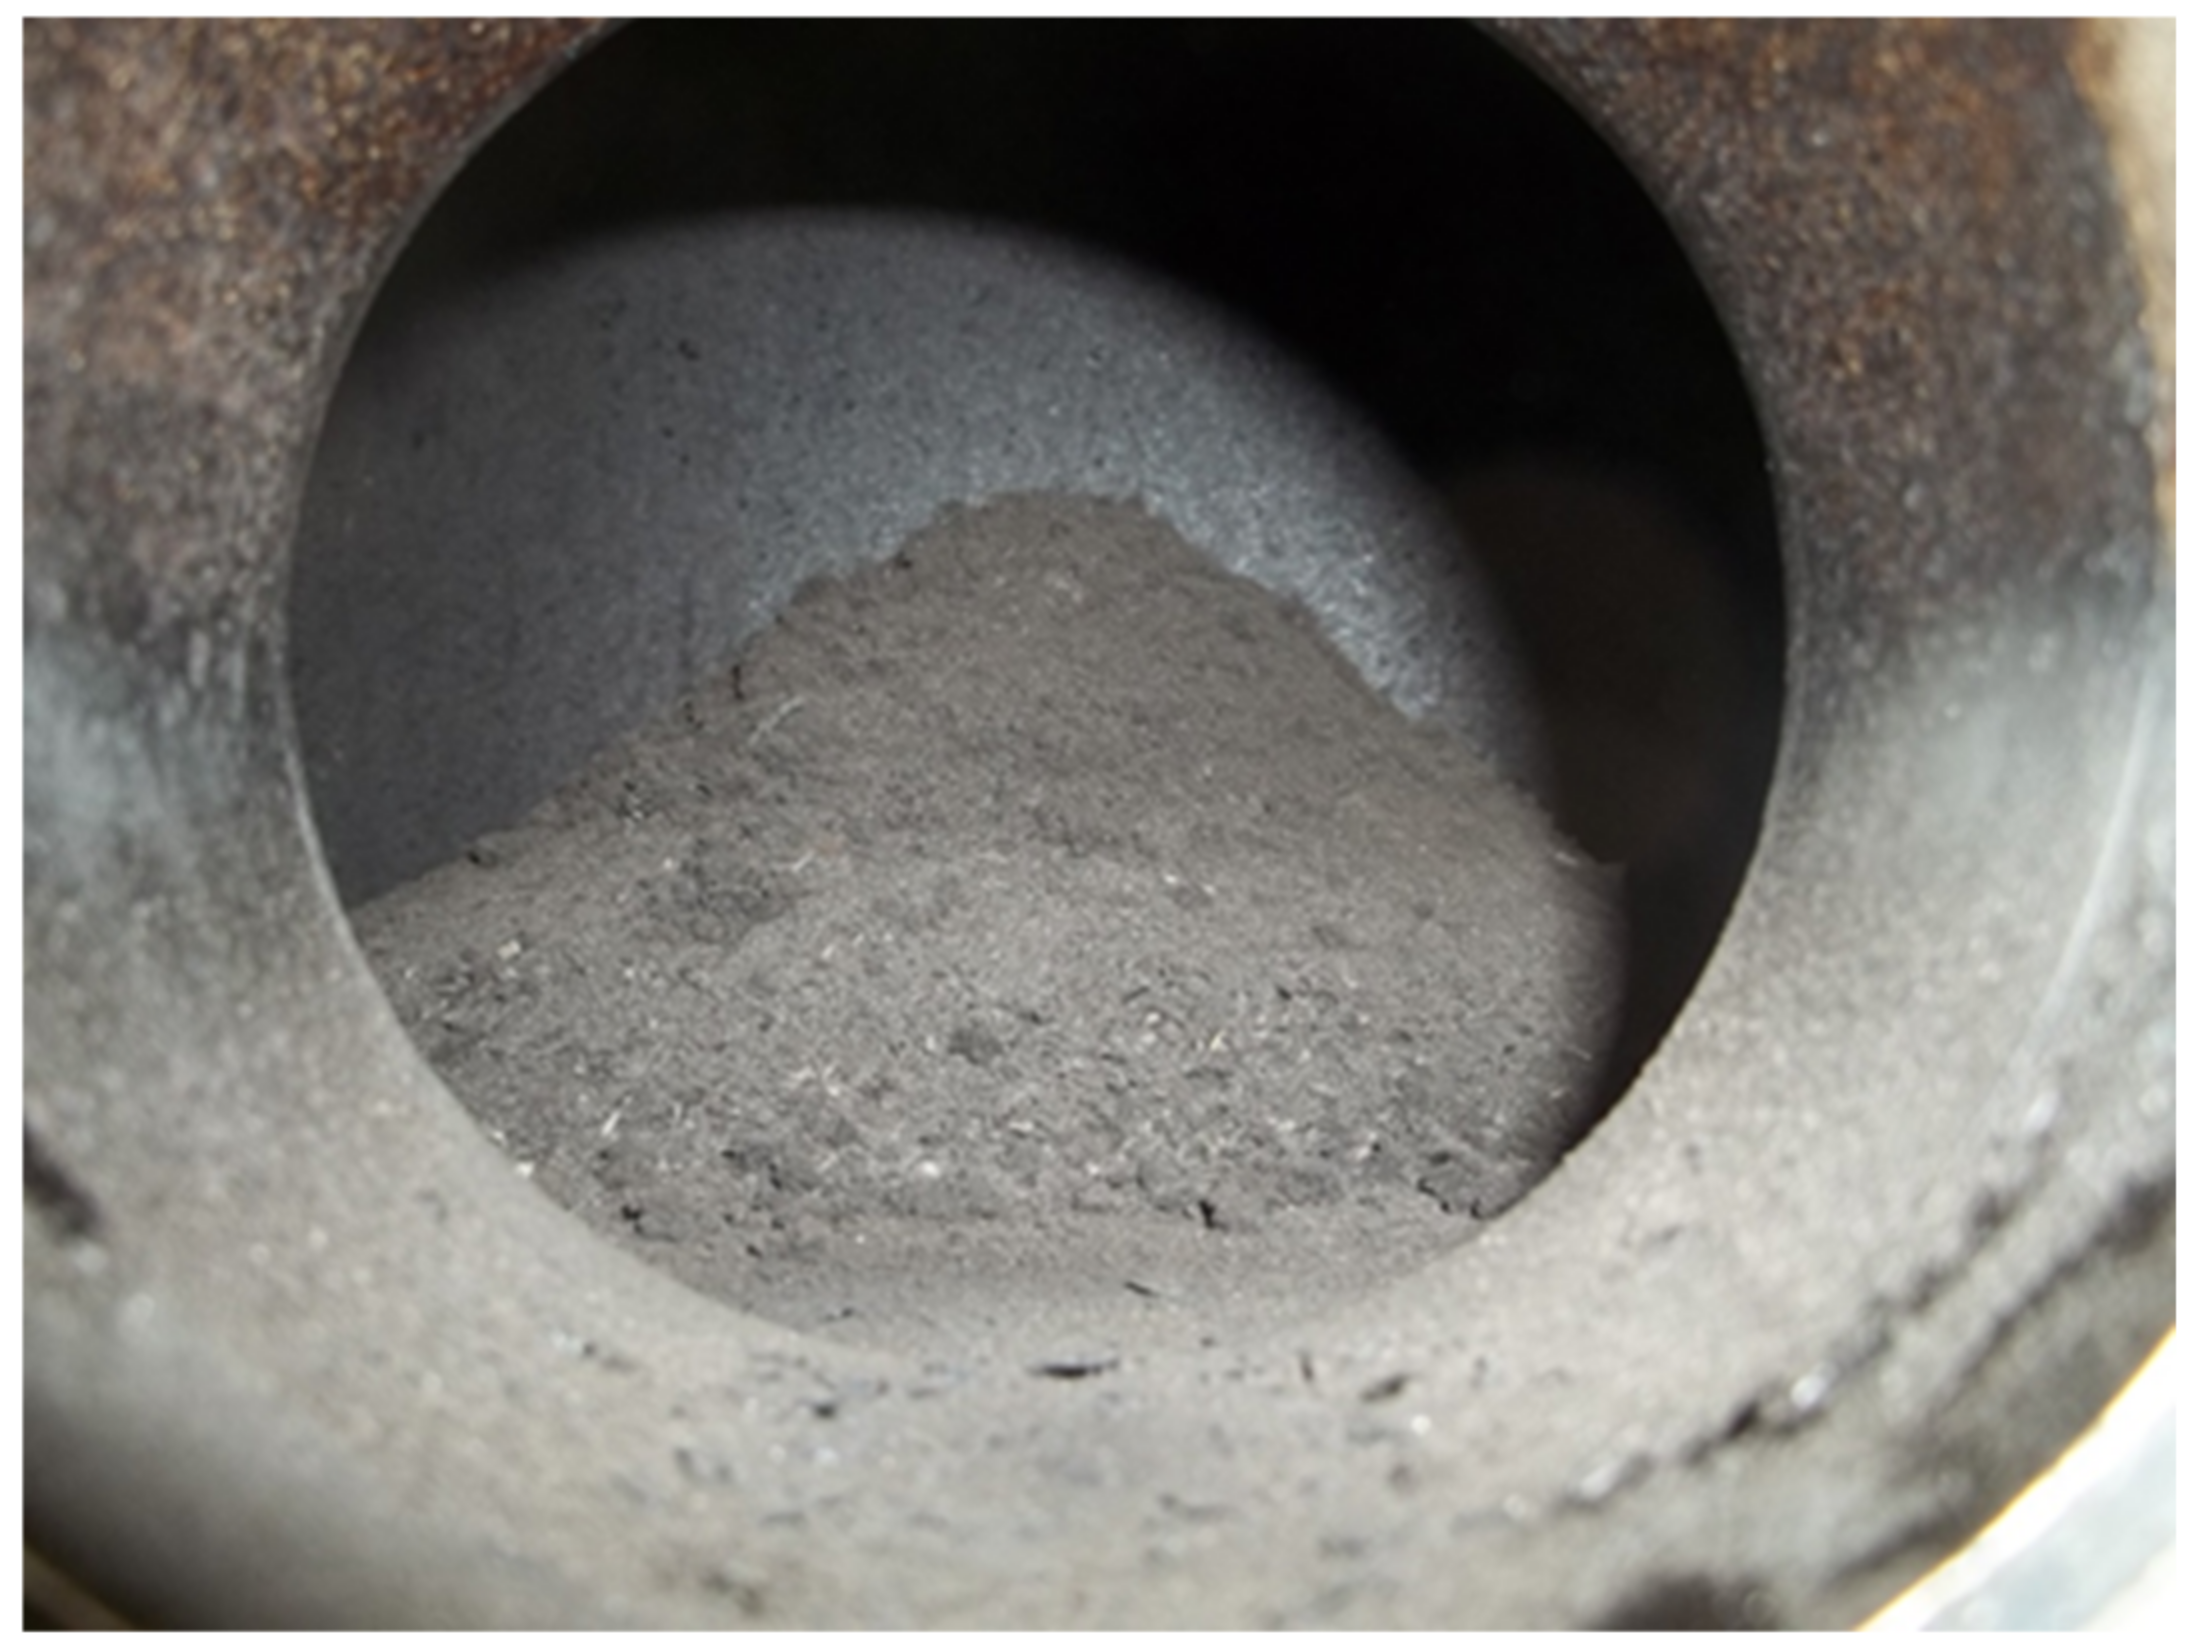
3.3. Experimental Tests
3.4. Performance
4. Conclusions
Author Contributions
Funding
Acknowledgments
Conflicts of Interest
Nomenclature
| AR | Definitive cross-sectional area (m2) |
| Ar | Initial cross-sectional area (m2) |
| Ar | Archimedes number |
| dR | Definitive inner diameter of the reactor [m) |
| dp | Average sand particle diameters, calculated by laboratory test (m) |
| dlvz | Diameter of the low-velocity zone (m) |
| ER | Actual biomass/air ratio respect to the stoichiometric biomass/air ratio. |
| FC | Weight percentage of fixed carbon (%) |
| Hbed | Bubbling bed height (m) |
| Hfb | Reactor freeboard height (m) |
| Hfix | Static or settle height bed (m) |
| Hrz | Reactions zone height (m) |
| Hlvz | Low-velocity zone height (m) |
| Htc | Truncated cone height (m) |
| His | Intake system height (m) |
| Ht | Total height (m) |
| ICE | Internal combustion engine |
| LHVw_b | Wet (without drying) biomass Lower Heating Value (kJ/kg) |
| LHVD_b | Dry biomass Lower Heating Value (kJ/kg) |
| LHVg | Syngas Lower Heating Value (kJ/kg) |
| Mbed | Bed mass (sand + char) (kg) |
| Mchar | Char mass into the reactor (kg) |
| Msand | Sand mass into the reactor (kg) |
| Ṁdry | Dry biomass consumption rate (kg/h) |
| Ṁchar | Mass flow char (kg/h) |
| Ṁw | Wet (without drying) biomass consumption rate (kg/h) |
| MCb | Biomass moisture content (%) |
| Preq | Required electrical power (kW) |
| Qair | Flow of air (Nm3/h) |
| Qgas | Flow of syngas (Nm3/h) |
| r | ratio air/biomass for the gasification process (Nm3/kg) |
| Remf | Reynolds number at minimum fluidization velocity |
| sfa | Area safety factor |
| sfsand | Sand safety factor |
| Top | Operating temperature (°C) |
| Ug | fluidization velocity (m/s) |
| Umf | minimum velocity (m/s) |
| Umf | transport velocity (m/s) |
| Volsand | Sand volume in fixed bed (m3) |
| Volfix_bed | Fixed bed volume (m3) |
| Volfluid_bed | Fluidized bed volume (m3) |
| xchar | Reacting char mass respect to mass bed (%) |
| Y | air/biomass ratio for complete combustion (m3 air/kg biomass) |
| ΔPtotal | Total pressure drop (kPa) |
| ΔPsand | Sand pressure drop (kPa) |
| ΔPdist | Distributor pressure drop (kPa) |
| ρair | Air density (kg/m3) |
| ρsyng | Syngas density (kg/m3) |
| ρd_bio | Dry biomass density (kg/m3) |
| ρfix_bed | Fixed bed density (sand + char) (kg/m3) |
| ρfluid_bed | Fluidized bed density (sand + char) (kg/m3) |
| ρb_char | Char bulk density (kg/m3) |
| ρb_sand | Sand bulk density (kg/m3) |
| ρsand | Sand density (kg/m3) |
| ρchar | Char density (kg/m3) |
| µair | dynamic viscosity air (kg/m s) |
| ε | Voidage of the fluidized bed (%) |
| εmf | Voidage of the bed at minimum fluidization velocity (%) |
| ηconv | Cold gas efficiency conversion from biomass into syngas (%) |
| ηconv_desir | Desired efficiency conversion from char into syngas (%) |
| ηice | Efficiency conversion from syngas to electricity in the internal combustion engine (%) |
| Ө | Char residence time (min) |
| [C] | Weight percentage of Carbon (%) |
| [H] | Weight percentage of Hydrogen (%) |
| [O2] | Weight percentage of Oxygen (%) |
References
- Anukam, A.; Goso, B.P.; Okoh, O.O.; Mamphweli, S.N. Studies on Characterization of Corn Cob for Application in a Gasification Process for Energy Production. J. Chem. 2017, 2017, 1–9. [Google Scholar] [CrossRef]
- Yang, S.; Wang, H.; Wei, Y.; Hu, J.; Chew, J. Numerical Investigation of Bubble Dynamics during Biomass Gasification in a Bubbling Fluidized Bed. ACS Sustain. Chem. Eng. 2019, 7, 12288–12303. [Google Scholar] [CrossRef]
- Prabir, B. Biomass Gasification and Pyrolysis. Practical Design and Theory, 1st ed.; Elsevier Inc.: Amsterdam, The Netherlands, 2010. [Google Scholar]
- Basu, P. Combustion and Gasification in Fluidized Beds. In Combustion and Gasification in Fluidized Beds; CRC Press: Boca Raton, FL, USA, 2006. [Google Scholar]
- Sharma, A.; Wang, S.; Pareek, V.; Yang, H.; Zhang, D. CFD modeling of mixing/segregation behavior of biomass and biochar particles in a bubbling fluidized bed. Chem. Eng. Sci. 2014, 106, 264–274. [Google Scholar] [CrossRef]
- Nilsson, S.; Gómez-Barea, A.; Fuentes-Cano, D.; Campoy, M. Gasification kinetics of char from olive tree pruning in fluidized bed. Fuel 2014, 125, 192–199. [Google Scholar] [CrossRef]
- Fotovat, F.; Abbasi, A.; Spiteri, R.J.; De Lasa, H.; Chaouki, J. A CPFD model for a bubbly biomass–sand fluidized bed. Powder Technol. 2015, 275, 39–50. [Google Scholar] [CrossRef]
- Sant’Anna, M.C.S.; Cruz, W.R.D.S.; Da Silva, G.F.; Medronho, R.; Lucena, S. Analyzing the fluidization of a gas-sand-biomass mixture using CFD techniques. Powder Technol. 2017, 316, 367–372. [Google Scholar] [CrossRef]
- Yang, S.; Fan, F.; Wei, Y.; Hu, J.; Wang, H.; Wu, S. Three-dimensional MP-PIC simulation of the steam gasification of biomass in a spouted bed gasifier. Energy Convers. Manag. 2020, 210, 112689. [Google Scholar] [CrossRef]
- Qi, T.; Lei, T.; Yan, B.; Zhou, Z.; Li, Z.; Fatehi, H.; Wang, Z.; Bai, X.-S. Biomass steam gasification in bubbling fluidized bed for higher-H2 syngas: CFD simulation with coarse grain model. Int. J. Hydrogen Energy 2019, 44, 6448–6460. [Google Scholar] [CrossRef]
- Lim, Y.-I.; Lee, U.-D. Quasi-equilibrium thermodynamic model with empirical equations for air–steam biomass gasification in fluidized-beds. Fuel Process. Technol. 2014, 128, 199–210. [Google Scholar] [CrossRef]
- Xie, J.; Zhong, W.; Jin, B.; Shao, Y.; Liu, H. Simulation on gasification of forestry residues in fluidized beds by Eulerian–Lagrangian approach. Bioresour. Technol. 2012, 121, 36–46. [Google Scholar] [CrossRef]
- Agu, C.E.; Pfeifer, C.; Eikeland, M.; Tokheim, L.-A.; Moldestad, B.M.E. Detailed One-Dimensional Model for Steam-Biomass Gasification in a Bubbling Fluidized Bed. Energy Fuels 2019, 33, 7385–7397. [Google Scholar] [CrossRef]
- Kang, P.; Hu, X.E.; Lu, Y.; Wang, K.; Zhang, R.; Han, L.; Yuan, H.; Chen, H.; Luo, X.; Zhou, Y. Modeling and Optimization for Gas Distribution Patterns on Biomass Gasification Performance of a Bubbling Spout Fluidized Bed. Energy Fuels 2020, 34, 1750–1763. [Google Scholar] [CrossRef]
- Serrano, D.; Von Berg, L.; Anca-Couce, A.; Hochenauer, C.; Scharler, R.; Anca-Couce, A. Effect of bed material density on the performance of steam gasification of biomass in bubbling fluidized beds. Fuel 2019, 257, 116118. [Google Scholar] [CrossRef]
- Bhaird, S.T.M.A.; Hemmingway, P.; Walsh, E.; Maglinao, A.L.; Capareda, S.C.; McDonnell, K. Bubbling fluidised bed gasification of wheat straw–gasifier performance using mullite as bed material. Chem. Eng. Res. Des. 2015, 97, 36–44. [Google Scholar] [CrossRef]
- Zaccariello, L.; Mastellone, M.L. Fluidized-Bed Gasification of Plastic Waste, Wood, and Their Blends with Coal. Energies 2015, 8, 8052–8068. [Google Scholar] [CrossRef]
- Bhaird, S.T.M.A.; Walsh, E.; Hemmingway, P.; Maglinao, A.L.; Capareda, S.C.; McDonnell, K. Analysis of bed agglomeration during gasification of wheat straw in a bubbling fluidised bed gasifier using mullite as bed material. Powder Technol. 2014, 254, 448–459. [Google Scholar] [CrossRef]
- Kuo, J.-H.; Wey, M.-Y.; Lian, Y.-H.; Samaksaman, U. Gaseous organic emissions during air gasification of woody waste: Effect of bed agglomeration/defluidization. Fuel Process. Technol. 2014, 128, 104–110. [Google Scholar] [CrossRef]
- Serrano, D.; Sánchez-Delgado, S.; Sobrino, C.; Marugán-Cruz, C. Defluidization and agglomeration of a fluidized bed reactor during Cynara cardunculus L. gasification using sepiolite as a bed material. Fuel Process. Technol. 2015, 131, 338–347. [Google Scholar] [CrossRef]
- Kittivech, T.; Fukuda, S. Investigating Agglomeration Tendency of Co-Gasification between High Alkali Biomass and Woody Biomass in a Bubbling Fluidized Bed System. Energies 2019, 13, 56. [Google Scholar] [CrossRef]
- Fanelli, E. CFD Hydrodynamics Investigations for Optimum Biomass Gasifier Design. Processes 2020, 8, 1323. [Google Scholar] [CrossRef]
- Karatas, H.; Akgun, F. Experimental results of gasification of walnut shell and pistachio shell in a bubbling fluidized bed gasifier under air and steam atmospheres. Fuel 2018, 214, 285–292. [Google Scholar] [CrossRef]
- Meng, F.; Ma, Q.; Wang, H.; Liu, Y.; Wang, D. Effect of gasifying agents on sawdust gasification in a novel pilot scale bubbling fluidized bed system. Fuel 2019, 249, 112–118. [Google Scholar] [CrossRef]
- Kumar, K.V.; Bharath, M.; Raghavan, V.; Prasad, B.; Chakravarthy, S.; Sundararajan, T. Gasification of high-ash Indian coal in bubbling fluidized bed using air and steam – An experimental study. Appl. Therm. Eng. 2017, 116, 372–381. [Google Scholar] [CrossRef]
- Aydar, E.; Gül, S.; Unlu, N.; Akgün, F.; Livatyali, H. Effect of the type of gasifying agent on gas composition in a bubbling fluidized bed reactor. J. Energy Inst. 2014, 87, 35–42. [Google Scholar] [CrossRef]
- Ren, J.; Cao, J.-P.; Zhao, X.-Y.; Yang, F.-L.; Wei, X.-Y. Recent advances in syngas production from biomass catalytic gasification: A critical review on reactors, catalysts, catalytic mechanisms and mathematical models. Renew. Sustain. Energy Rev. 2019, 116, 109426. [Google Scholar] [CrossRef]
- Koppatz, S.; Pfeifer, C.; Hofbauer, H. Comparison of the performance behaviour of silica sand and olivine in a dual fluidised bed reactor system for steam gasification of biomass at pilot plant scale. Chem. Eng. J. 2011, 175, 468–483. [Google Scholar] [CrossRef]
- Zhang, K.; Yu, B.; Chang, J.; Wu, G.; Wang, T.; Wen, D. Hydrodynamics of a fluidized bed co-combustor for tobacco waste and coal. Bioresour. Technol. 2012, 119, 339–348. [Google Scholar] [CrossRef]
- Yang, S.; Zhou, T.; Wei, Y.; Hu, J.; Wang, H. Influence of size-induced segregation on the biomass gasification in bubbling fluidized bed with continuous lognormal particle size distribution. Energy Convers. Manag. 2019, 198. [Google Scholar] [CrossRef]
- Ku, X.; Jin, H.; Lin, J. Comparison of gasification performances between raw and torrefied biomasses in an air-blown fluidized-bed gasifier. Chem. Eng. Sci. 2017, 168, 235–249. [Google Scholar] [CrossRef]
- Rasmussen, N.B.; Aryal, N. Syngas production using straw pellet gasification in fluidized bed allothermal reactor under different temperature conditions. Fuel 2020, 263, 116706. [Google Scholar] [CrossRef]
- Xue, G.; Kwapinska, M.; Horvat, A.; Kwapinski, W.; Rabou, L.; Dooley, S.; Czajka, K.; Kwapinski, W. Gasification of torrefied Miscanthus×giganteus in an air-blown bubbling fluidized bed gasifier. Bioresour. Technol. 2014, 159, 397–403. [Google Scholar] [CrossRef] [PubMed]
- Sarker, S.; Bimbela, F.; Sanchez, J.L.; Nielsen, H.K. Characterization and pilot scale fluidized bed gasification of herbaceous biomass: A case study on alfalfa pellets. Energy Convers. Manag. 2015, 91, 451–458. [Google Scholar] [CrossRef]
- Zhou, T.; Yang, S.; Wei, Y.; Hu, J.; Wang, H. Impact of wide particle size distribution on the gasification performance of biomass in a bubbling fluidized bed gasifier. Renew. Energy 2020, 148, 534–547. [Google Scholar] [CrossRef]
- González-Vázquez, M.P.; García, C.P.; Pevida, C.; Rubiera, F. Optimization of a Bubbling Fluidized Bed Plant for Low-Temperature Gasification of Biomass. Energies 2017, 10, 306. [Google Scholar] [CrossRef]
- Prins, M.J.; Ptasinski, K.J.; Janssen, F.J. More efficient biomass gasification via torrefaction. Energy 2006, 31, 3458–3470. [Google Scholar] [CrossRef]
- Muvhiiwa, R.; Kuvarega, A.; Llana, E.M.; Muleja, A.A. Study of biochar from pyrolysis and gasification of wood pellets in a nitrogen plasma reactor for design of biomass processes. J. Environ. Chem. Eng. 2019, 7, 103391. [Google Scholar] [CrossRef]
- Pio, D.; Tarelho, L.; Tavares, A.; Matos, M.; E Silva, V.B.R. Co-gasification of refused derived fuel and biomass in a pilot-scale bubbling fluidized bed reactor. Energy Convers. Manag. 2020, 206, 112476. [Google Scholar] [CrossRef]
- Aznar, M.P.; Caballero, M.A.; Sancho, J.A.; Francés, E. Plastic waste elimination by co-gasification with coal and biomass in fluidized bed with air in pilot plant. Fuel Process. Technol. 2006, 87, 409–420. [Google Scholar] [CrossRef]
- Cerone, N.; Zimbardi, F.; Contuzzi, L.; Baleta, J.; Cerinski, D.; Skvorčinskienė, R. Experimental investigation of syngas composition variation along updraft fixed bed gasifier. Energy Convers. Manag. 2020, 221, 113116. [Google Scholar] [CrossRef]
- Khezri, R.; Ghani, W.A.W.A.K.; Biak, D.R.A.; Yunus, R.; Silas, K. Experimental Evaluation of Napier Grass Gasification in an Autothermal Bubbling Fluidized Bed Reactor. Energies 2019, 12, 1517. [Google Scholar] [CrossRef]
- Ge, H.; Zhang, H.; Guo, W.; Song, T.; Shen, L. System simulation and experimental verification: Biomass-based integrated gasification combined cycle (BIGCC) coupling with chemical looping gasification (CLG) for power generation. Fuel 2019, 241, 118–128. [Google Scholar] [CrossRef]
- Kim, Y.D.; Yang, C.W.; Kim, B.J.; Kim, K.S.; Lee, J.W.; Moon, J.H.; Yang, W.; Yu, T.U.; Lee, U.D. Air-blown gasification of woody biomass in a bubbling fluidized bed gasifier. Appl. Energy 2013, 112, 414–420. [Google Scholar] [CrossRef]
- Arnavat, M.P.; Tora, E.; Bruno, J.C.; Coronas, A. State of the art on reactor designs for solar gasification of carbonaceous feedstock. Sol. Energy 2013, 97, 67–84. [Google Scholar] [CrossRef]
- Baruah, D. Modeling of biomass gasification: A review. Renew. Sustain. Energy Rev. 2014, 39, 806–815. [Google Scholar] [CrossRef]
- Susastriawan, A.; Saptoadi, H. Purnomo Small-scale downdraft gasifiers for biomass gasification: A review. Renew. Sustain. Energy Rev. 2017, 76, 989–1003. [Google Scholar] [CrossRef]
- Marchelli, F.; Curti, M.; Tognin, M.; Rovero, G.; Moliner, C.; Arato, E.; Bosio, B. Experimental Study on the Solids Residence Time Distribution in Multiple Square-Based Spouted Beds. Energies 2020, 13, 4694. [Google Scholar] [CrossRef]
- Guran, S. Thermochemical Conversion of Biomass. Electr. Veh. 2020, 159–194. [Google Scholar] [CrossRef]
- Hernández, J.J.; Lapuerta, M.; Barba, J.; Hernández, J.J. Separate effect of H2, CH4 and CO on diesel engine performance and emissions under partial diesel fuel replacement. Fuel 2016, 165, 173–184. [Google Scholar] [CrossRef]
- Pérez-Navarro, Á.; Alfonso, D.S.; Ariza, H.; Cárcel-Carrasco, F.-J.; Correcher, A.; Escrivaescriva, G.; Hurtado, E.; Ibanez, F.; Peñalvo, E.; Roig, R.; et al. Experimental verification of hybrid renewable systems as feasible energy sources. Renew. Energy 2016, 86, 384–391. [Google Scholar] [CrossRef]
- Montuori, L.; Vargas-Salgado, C.; Alcázar-Ortega, M. Impact of the throat sizing on the operating parameters in an experimental fixed bed gasifier: Analysis, evaluation and testing. Renew. Energy 2015, 83, 615–625. [Google Scholar] [CrossRef]
- Alfonso-Solar, D.; Vargas-Salgado, C.; Sánchez-Díaz, C.; Hurtado-Pérez, E. Small-Scale Hybrid Photovoltaic-Biomass Systems Feasibility Analysis for Higher Education Buildings. Sustainability 2020, 12, 9300. [Google Scholar] [CrossRef]
- Narváez, I.; Orío, A.; Aznar, M.P.; Corella, J. Biomass Gasification with Air in an Atmospheric Bubbling Fluidized Bed. Effect of Six Operational Variables on the Quality of the Produced Raw Gas. Ind. Eng. Chem. Res. 1996, 35, 2110–2120. [Google Scholar] [CrossRef]
- Vargas Salgado, C.A. Estudio Comparativo de la Utilización de las Tecnologías de Gasificación Downdraft y Lecho Fluidizado Burbujeante Para la Generación de Energía Eléctrica en Aplicaciones de Baja Potencia; Universitat Politècnica de Va-lència: Valencia, Spain, 2012. [Google Scholar]
- Centro de estudios de la Energía. Manuales Técnicos y de Instrucción Para la Conservación de la Energía; Combustibles y su com-bustión: Madrid, Spain, 1983. [Google Scholar]
- Bermudez, J.; Fidalgo, B. Production of bio-Syngas and bio-hydrogen via gasification. In Handbook of Biofuels Production, 2nd ed.; Woodhead Publishing: Cambridge, UK, 2016; pp. 431–494. [Google Scholar]
- Siedlecki, M.; De Jong, W.; Verkooijen, A.H. Fluidized Bed Gasification as a Mature And Reliable Technology for the Production of Bio-Syngas and Applied in the Production of Liquid Transportation Fuels—A Review. Energies 2011, 4, 389–434. [Google Scholar] [CrossRef]
- Kunii, D.; Levenspiel, O. Fluidization Engineering, 2nd ed.; Butterworth-Heinemann: Oxford, UK, 1991. [Google Scholar]
- Geldart, D. Types of Gas Fhidization. Powder Technol. 1973, 7, 285–292. [Google Scholar] [CrossRef]
- Kumar, A.; Jones, D.D.; Hanna, M. Thermochemical Biomass Gasification: A Review of the Current Status of the Technology. Energies 2009, 2, 556–581. [Google Scholar] [CrossRef]
- Imerys Refractory Minerals. “IMERYS”. Available online: https://imerys-refractoryminerals.com/europe-cis-mena/products/molochite/ (accessed on 7 October 2019).
- Goo, J.H.; Seo, M.W.; Kim, S.D.; Song, B.H. Effects of Temperature and Particle Size on Minimum Fluidization and Transport Velocities in a Dual Fluidized Bed. In Proceedings of the 20th International Conference on Fluidized Bed Combustion, Xi’an, China, 18–21 May 2009; Springer Science and Business Media LLC: Berlin, Germany, 2009; pp. 305–310. [Google Scholar]
- Wen, C.Y.; Yu, Y.H. A generalized method for predicting the minimum fluidization velocity. AIChE J. 1966, 12, 610–612. [Google Scholar] [CrossRef]
- Chirone, R.; Poletto, M.; Barletta, D.; Lettieri, P. The effect of temperature on the minimum fluidization conditions of industrial cohesive particles. Powder Technol. 2020, 362, 307–322. [Google Scholar] [CrossRef]
- Lim, M.T.; Alimuddin, Z. Bubbling fluidized bed biomass gasification—Performance, process findings and energy analysis. Renew. Energy 2008, 33, 2339–2343. [Google Scholar] [CrossRef]
- Gómez-Barea, A.; Ollero, P.; Leckner, B. Optimization of char and tar conversion in fluidized bed biomass gasifiers. Fuel 2013, 103, 42–52. [Google Scholar] [CrossRef]
- Gómez-Barea, A.; Leckner, B. Modeling of biomass gasification in fluidized bed. Prog. Energy Combust. Sci. 2010, 36, 444–509. [Google Scholar] [CrossRef]
- Shi, L.; Northwood, D. The mechanical behavior of an aisi type 310 stainless steel. Acta Met. Mater. 1995, 43, 453–460. [Google Scholar] [CrossRef]
- Lao, C.; Chungpaibulpatana, S. Techno-economic analysis of hybrid system for rural electrification in Cambodia. Energy Procedia 2017, 138, 524–529. [Google Scholar] [CrossRef]


| Required Output | 40 kWth |
|---|---|
| Syngas Lowe Heating value | 5000 kJ/Nm3 |
| The efficiency of dry biomass conversion into syngas | 70% |
| Type of Biomass | Pellets | |
|---|---|---|
| Length (mm) | 10–20 | |
| Diameter (mm) | 6 | |
| Density | Dry biomass (kg/m3) | 1379 |
| Stored biomass (kg/m3) | 1470 | |
| Bulk density | Dry biomass (kg/m3) | 655 |
| Stored biomass (kg/m3) | 699 | |
| Char (kg/m3) | 304 | |
| LHV (kJ/kg) | Dry biomass (kJ/kg) | 17,800 |
| Stored biomass (kJ/kg) | 16,700 | |
| Ultimate analysis % | C | 51.9% |
| H | 6.2% | |
| O | 41.7% | |
| Proximate analysis % | Fixed carbon (FC) | 15.5% |
| Volatile | 80.5% | |
| Ash | 1.3% | |
| Moisture (MC) | 6.2% |
| Composition | Value | Unit |
|---|---|---|
| Aluminum oxide—Al2O3 | 42 | % |
| Silicon dioxide—SiO2 | 55 | % |
| Iron oxide—Fe2O3 | 1.3 | % |
| Properties | ||
| Density | 2700 | kg/m3 |
| Bulk density | 1210 | kg/m3 |
| Porosity of sand grain | 0 | % |
| Color | Grey | |
| Maximum use temperature | >1700 | °C |
| Thermal expansion coefficient | 4.4 × 10⁻⁶ | 1/°C |
| Average Particle Diameter | dp | 0.000247 m |
|---|---|---|
| Minimum fluidization velocity for Molochite | Umf | 0.051 m/s |
| Fluidization velocity for design purposes | Ug | 0.44 m/s |
| The inner diameter of the reactions zone | dR | 0.12 m |
| The cross-sectional area of the reactions zone | AR | 0.0113 m2 |
| The inner diameter of the low-velocity zone (Upper part) | dlvz | 0.34 m |
| Bubbling fluidized bed height | Hbed | 0.8 m |
| Reaction zone freeboard height | Hfb | 0.24 m |
| Reactions zone height (Sum of two previous) | Hrz | 1.04 m |
| Low-velocity zone height | Hlvz | 0.56 m |
| Truncated cone height | Htc | 0.14 m |
| Intake system height | His | 0.27 m |
| Height of the reactor | HR | 2 m |
| Power Output Range | Prange | 15–42 kWth |
|---|---|---|
| Gas lower heating value | LHVg | 5–6 MJ/Nm3 |
| Wet biomass lower heating value | LHVw_b | 16.7 MJ/kg |
| Syngas flow output | Qgas | 10–28 Nm3/h |
| Wet biomass consumption | Ṁw | 5–13 kg/h |
| Biomass moisture | MCb | 6.2% |
| Airflow needed for the gasification process | Qair | 6–17.6 Nm3/h |
| Units | Operating Range—Experimental Test | Range According Scientific Works | Sources | ||
|---|---|---|---|---|---|
| Lower heating value | LHVg | MJ/Nm3 | 5.2–6.2 | 4.5–6.6 | [26,33,44,54] |
| Equivalence ratio | ER | - | 0.26–0.3 | 0.15–0.35 | [33,42,44,66,70] |
| Syngas yield/biomass | Nm3/kg | 1.9–2.3 | 1.7–2.5 | [33,54] | |
| Bed temperature | Top | °C | 792–860 | 650–950 | [26,33,42,44] |
| Efficiency | ηconv | % | 59–82 | 55–88.28 | [16,26,33,42,54] |
Publisher’s Note: MDPI stays neutral with regard to jurisdictional claims in published maps and institutional affiliations. |
© 2021 by the authors. Licensee MDPI, Basel, Switzerland. This article is an open access article distributed under the terms and conditions of the Creative Commons Attribution (CC BY) license (http://creativecommons.org/licenses/by/4.0/).
Share and Cite
Vargas-Salgado, C.; Hurtado-Pérez, E.; Alfonso-Solar, D.; Malmquist, A. Empirical Design, Construction, and Experimental Test of a Small-Scale Bubbling Fluidized Bed Reactor. Sustainability 2021, 13, 1061. https://doi.org/10.3390/su13031061
Vargas-Salgado C, Hurtado-Pérez E, Alfonso-Solar D, Malmquist A. Empirical Design, Construction, and Experimental Test of a Small-Scale Bubbling Fluidized Bed Reactor. Sustainability. 2021; 13(3):1061. https://doi.org/10.3390/su13031061
Chicago/Turabian StyleVargas-Salgado, Carlos, Elías Hurtado-Pérez, David Alfonso-Solar, and Anders Malmquist. 2021. "Empirical Design, Construction, and Experimental Test of a Small-Scale Bubbling Fluidized Bed Reactor" Sustainability 13, no. 3: 1061. https://doi.org/10.3390/su13031061
APA StyleVargas-Salgado, C., Hurtado-Pérez, E., Alfonso-Solar, D., & Malmquist, A. (2021). Empirical Design, Construction, and Experimental Test of a Small-Scale Bubbling Fluidized Bed Reactor. Sustainability, 13(3), 1061. https://doi.org/10.3390/su13031061