
Interactive Effects of Organic Fertilizers and Drought Stress on Growth and Nutrient Content of Brassica juncea at Vegetative Stage

 ,
,
Abstract
:1. Introduction
2. Material and Methods
2.1. Plant Material and Growth Conditions
2.2. Measurement of Growth
2.3. Physiological Traits
2.4. Leaf Macro- and Micronutrient Analysis
2.5. Statistical Analysis of the Data
3. Results and Discussion
3.1. Interactive Effects of Drought and Organic Fertilizers on Growth and Physiological Traits
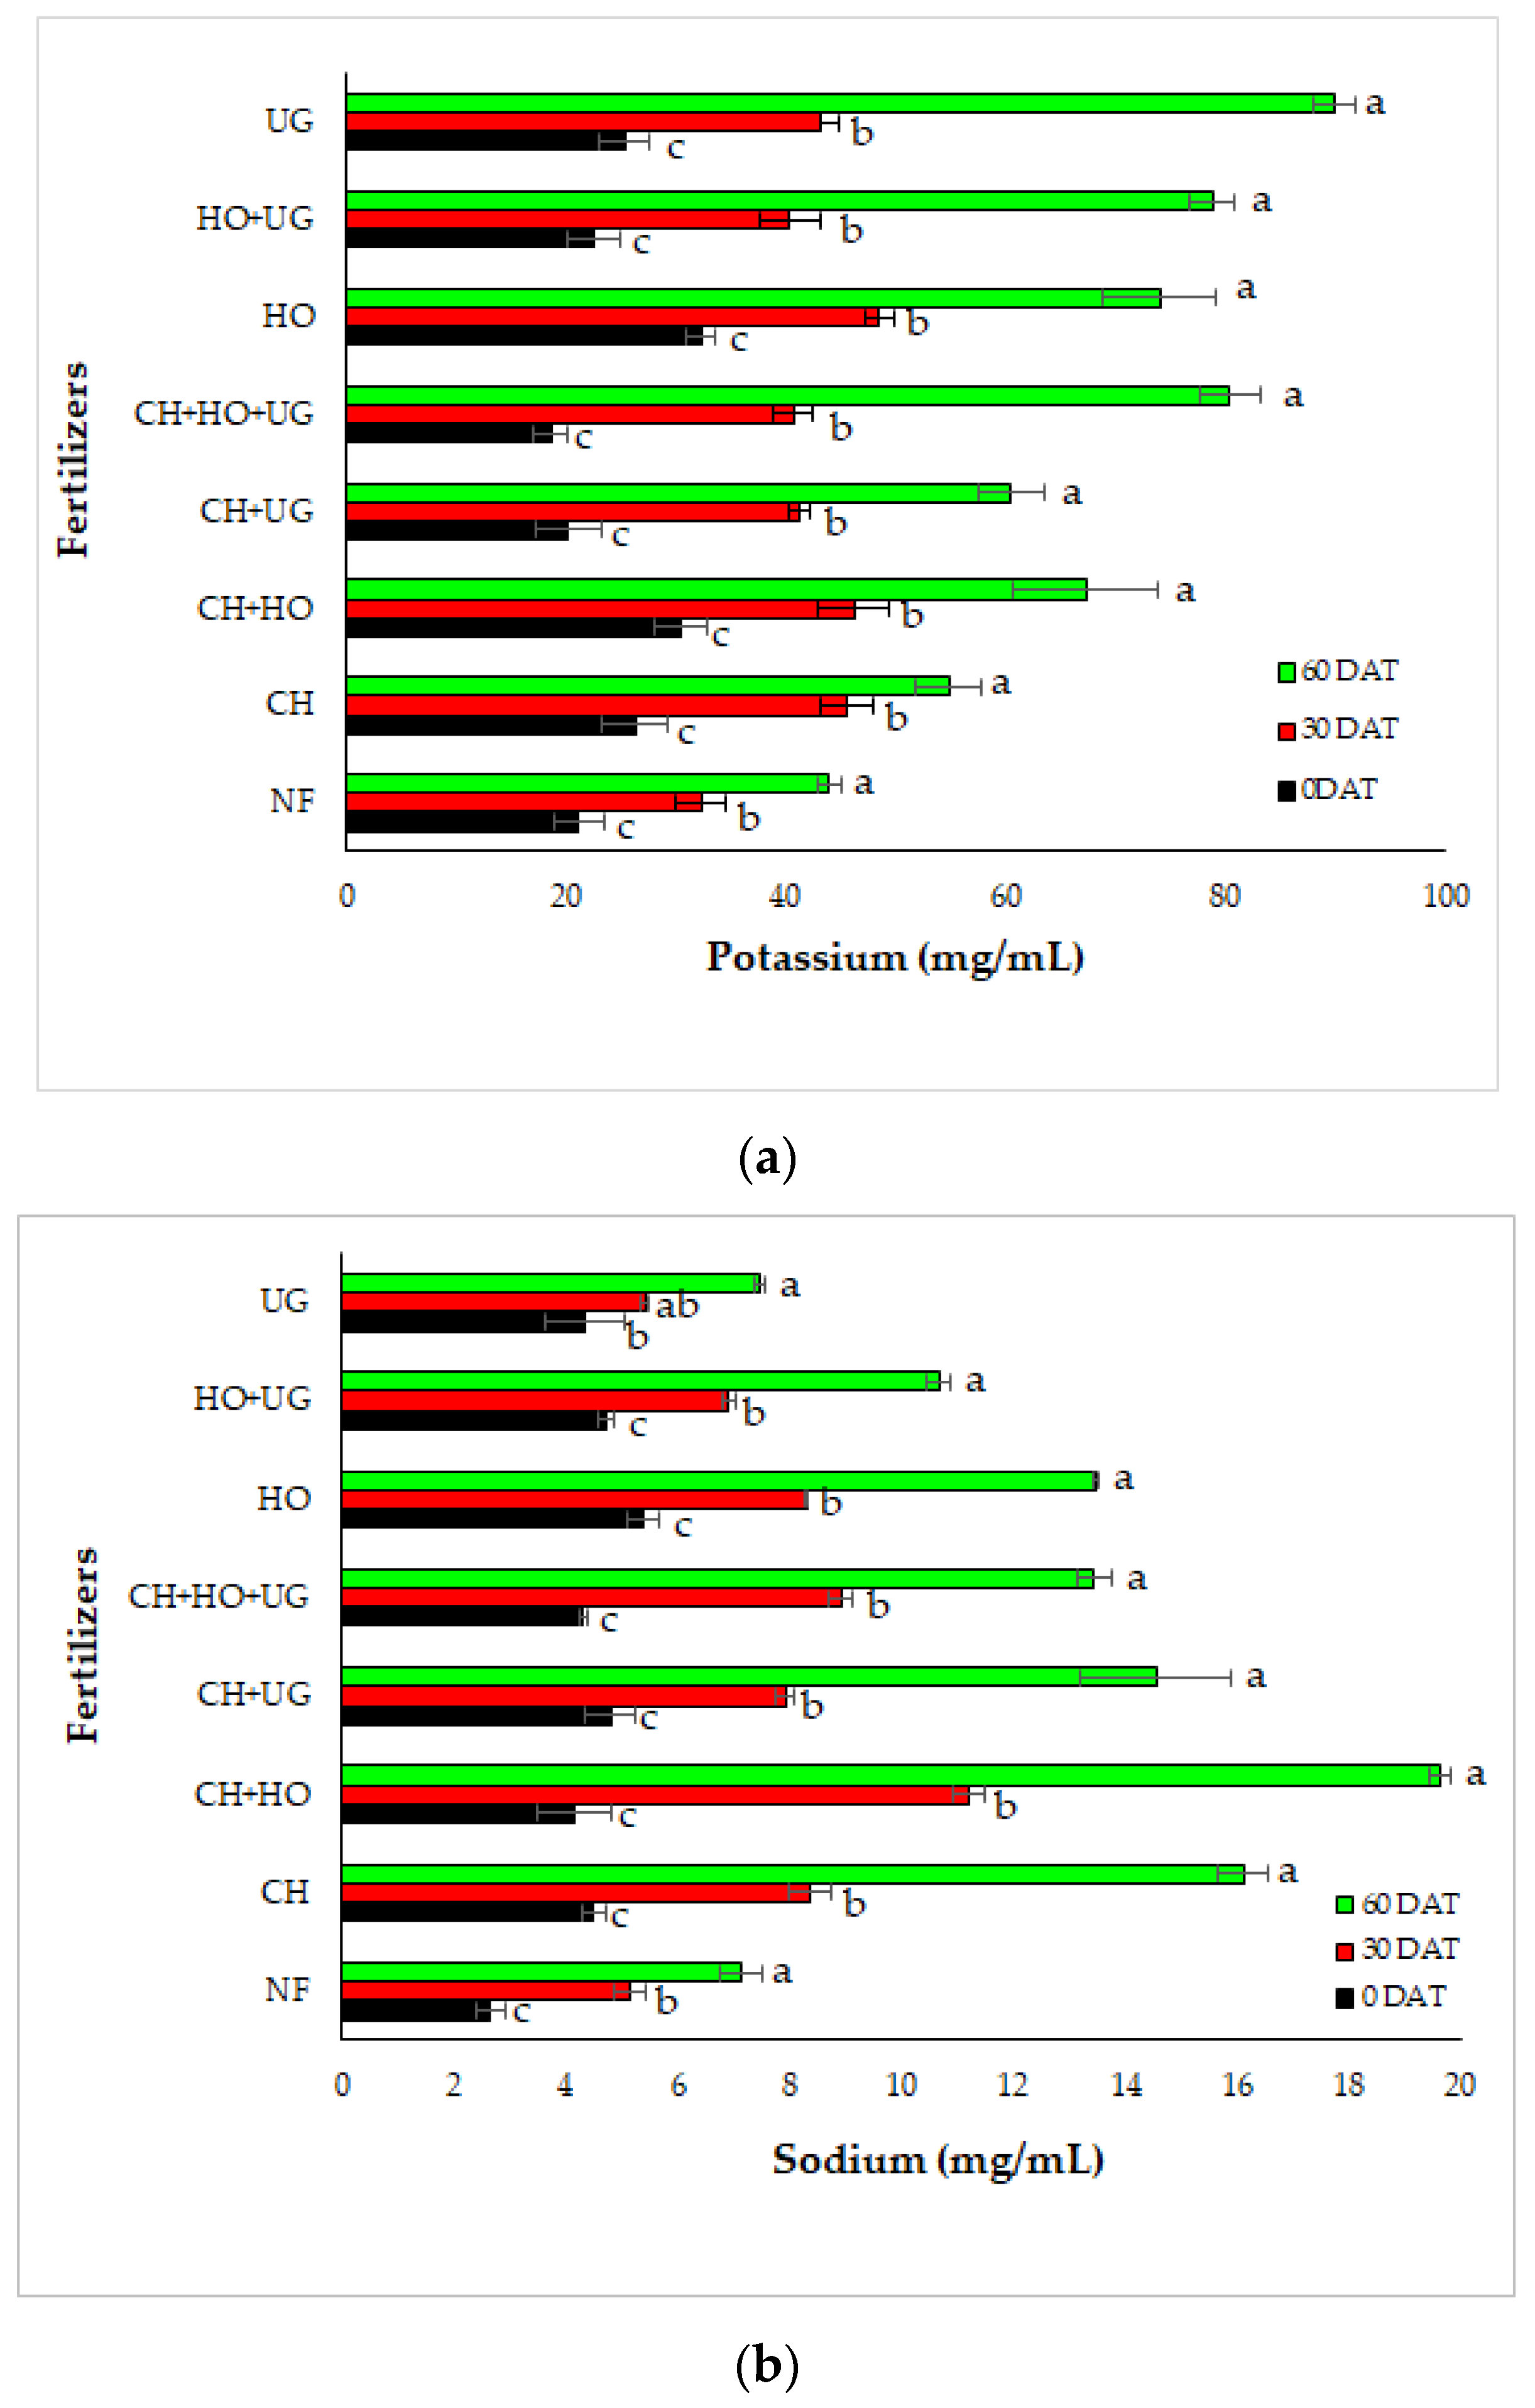
3.2. Interactive Effects of Drought and Organic Fertilizer on Nutrients Content
3.3. Relationships between Traits
4. Conclusions
Supplementary Materials
Author Contributions
Funding
Data Availability Statement
Conflicts of Interest
References
- Sharma, A.; Kumar, V.; Kanwar, M.K.; Thukral, A.K.; Bhardwajm, R. Phytochemical profiling of the leaves of Brassica juncea L. using GC-MS. J. Int. Food Res. 2017, 24, 547–551. [Google Scholar]
- Sharma, A.; Rai, P.K.; Prasad, S. GC-MS detection and determination of major volatile compounds in Brassica juncea L. leaves and seeds. J. Microchem. 2018, 138, 488–493. [Google Scholar] [CrossRef]
- Majdoub, Y.Q.; Alibrando, F.; Cacciola, F.; Arena, K.; Pagnotta, E.; Matteo, R.; Micalizzi, G.; Dugo, L.; Dugo, P.; Mondello, L. Chemical Characterization of Three Accessions of Brassica juncea L. Extracts from Deferent Plant Tissues. Molecules 2020, 25, 5421. [Google Scholar] [CrossRef] [PubMed]
- Chauhan, J.S.; Tyagi, M.K.; Kumar, A.; Nashaat, N.I.; Singh, M.; Singh, N.B.; Welham, S.J. Drought effects on yield and its components in Indian mustard (Brassica juncea L.). Plant Breed. 2007, 126, 399–402. [Google Scholar] [CrossRef]
- Mahrookashani, A.; Siebert, S.; Heuging, H.; Ewert, F. Independent and combined effects of high temperature and drought stress around anthesis on wheat. J. Agron. Crop Sci. 2017, 203, 453–463. [Google Scholar] [CrossRef]
- Bandeppa, S.; Paul, S.; Kumar, J.; Chandrashekar, T.N.; Umesh, D.K.; Aggarwal, C.; Asha, A.D. Antioxidant, physiological and biochemical responses of drought susceptible and drought tolerant mustard (Brassica juncea L.) genotypes to rhizobacterial inoculation under water deficit stress. Plant Physiol. Biochem. 2019, 143, 19–28. [Google Scholar] [CrossRef]
- Chauhan, J.S.; Singh, K.H.; Singh, V.V.; Kumar, S. Hundred years of rapeseed mustard breeding in India: Accomplishments and future strategies. Indian J. Agric. Sci. 2011, 81, 1093–1109. [Google Scholar]
- Mirzaei, A.; Naseri, R.; Moghadam, A.; Esmailpour-Jahromi, M. The effects of drought stress on seed yield and some agronomic traits of canola cultivars at different growth stages. Bull. Environ. Pharmacol. Life Sci. 2013, 2, 115–121. [Google Scholar]
- Kapoor, D.; Bhardwaj, S.; Landi, M.; Sharma, A.; Ramakrishnan, M.; Sharma, A. The Impact of Drought in plant metabolism: How to exploit tolerance mechanisms to increase crop production. Appl. Sci. 2020, 10, 5692. [Google Scholar] [CrossRef]
- Matiu, M.; Ankerst, D.P.; Menzel, A. Interactions between temperature and drought in global and regional crop yield variability during 1961–2014. PLoS ONE 2017, 12, e0178339. [Google Scholar]
- Bistgani, Z.E.; Siadat, S.A.; Bakhshandeh, A.; Pirbalouti, A.G.; Hashemi, M. Interactive effects of drought stress and chitosan application on physiological characteristics and essential oil yield of Thymus daenensis Celak. Crop J. 2017, 5, 407–415. [Google Scholar] [CrossRef]
- Pandey, P.; Irulappan, V.; Bagavathiannan, M.V.; Senthil-Kumar, M. Impact of combined abiotic and biotic stresses on plant growth and avenues for crop improvement by exploiting physio-morphological traits. Front. Plant Sci. 2017, 8, 537. [Google Scholar] [CrossRef] [Green Version]
- Fahad, S.; Bajwa, A.A.; Nazir, U.; Anjum, S.A.; Farooq, A.; Zohaib, A.; Sadia, S.; Nasim, W.; Adkins, S.; Saud, S.; et al. Crop production under drought and heat stress: Plant responses and management options. Front. Plant Sci. 2017, 8, 1147. [Google Scholar] [CrossRef] [Green Version]
- Wang, P.; Su, L.; Gao, H.; Jiang, X.; Wu, X.; Wang, Y.; Ren, F. Genome-wide characterization of bHLH genes in grape and analysis of their potential relevance to abiotic stress tolerance and secondary metabolite biosynthesis. Front Plant Sci. 2018, 9, 64. [Google Scholar] [CrossRef] [PubMed] [Green Version]
- Hussain, F.; Hussain, I.; Khan, A.H.A.; Muhammad, Y.S.; Iqbal, M.; Soja, G.; Reichenauer, T.G.; Zeshan; Yousaf, S. Combined application of biochar, compost, and bacterial consortia with Italian ryegrass enhanced phytoremediation of petroleum hydrocarbon contaminated soil. Environ. Exp. Bot. 2018, 153, 80–88. [Google Scholar] [CrossRef]
- Tadayyon, A.; Nikneshan, P.; Pessarakli, M. Effects of drought stress on concentration of macro and micronutrients in castor (Ricinus communis L.) plant. J. Plant Nutr. 2018, 41, 304–310. [Google Scholar] [CrossRef]
- Hu, Y.; Schmidhalter, U. Drought and salinity: A comparison of their effects on mineral nutrition of plants. J. Plant Nutr. Soil Sci. 2005, 168, 541–549. [Google Scholar] [CrossRef]
- Bista, D.R.; Heckathorn, S.A.; Jayawardena, D.M.; Mishra, S.; Boldt, J.K. Effects of drought on nutrient uptake and the levels of nutrient-uptake proteins in roots of drought-sensitive and -tolerant grasses. Plants 2018, 7, 28. [Google Scholar] [CrossRef] [Green Version]
- Ghandilyan, A.; Barboza, L.; Tisné, S.; Granier, C.; Reymond, M.; Koornneef, M.; Schat, H.; Aarts, M.G.M. Genetic analysis identifies quantitative trait loci controlling rosette mineral concentrations in Arabidopsis thaliana under drought. N. Phytol. 2009, 184, 180–192. [Google Scholar] [CrossRef]
- Masclaux-Daubresse, C.; Daniel-Vedele, F.; Dechorgnat, J.; Chardon, F.; Gaufichon, L.; Suzuki, A. Nitrogen uptake, assimilation and remobilization in plants: Challenges for sustainable and productive agriculture. Ann. Bot. 2010, 105, 1141–1157. [Google Scholar] [CrossRef] [PubMed] [Green Version]
- Etienne, P.; Diquelou, S.; Prudent, M.; Salon, C.; Maillard, A.; Ourry, A. Macro and micronutrient storage in plants and their remobilization when facing scarcity: The case of drought. Agriculture 2018, 8, 14. [Google Scholar] [CrossRef] [Green Version]
- Alsafar, M.S.; Al-Hassan, Y.M. Effect of nitrogen and phosphorus fertilizers on growth and oil yield of indigenous Mint (Mentha longifolia L.). Biotechnology 2009, 8, 380–384. [Google Scholar] [CrossRef] [Green Version]
- Dong, W.; Qin, J.; Li, J.; Zhao, Y.; Nie, L.; Zhang, Z. Interactions between soil water content and fertilizer on growth characteristics and biomass yield of Chinese white poplar (Populus tomentosa Carr) seedlings. Soil Sci. Plant Nutr. 2011, 57, 303–312. [Google Scholar] [CrossRef] [Green Version]
- Bindraban, P.S.; Dimkpa, C.O.; Pandey, R. Exploring phosphorus fertilizers and fertilization strategies for improved human and environmental health. Biol. Fertil. Soils 2020, 56, 299–317. [Google Scholar] [CrossRef] [Green Version]
- Rezaei, R.; Valadabadi, S.A.; Rad, S.A.H.; Sayfzadeh, S.; Masouleh, H.E. The effects of application of biological fertilizers and different amounts of urea fertilizer sources under low water stress conditions on physiological traits of medicinal plant (Calendula officinalis L.). Appl. Ecol. Environ. Res. 2018, 16, 4813–4827. [Google Scholar] [CrossRef]
- Azab, E. Effect of water stress and biological fertilization on maize growth, chemical composition and productivity in calcareous. Am. J. Plant Physiol. 2016, 11, 1–11. [Google Scholar] [CrossRef] [Green Version]
- Ghosh, M.; Devi, A. Assessment of crop growth, soil properties and crop yield in an upland acidic soil with inorganic fertilizer blended with organic amendments in summer rice cropping seasons. Int. J. Recycl. Org. Waste Agricult. 2019, 8, 3647. [Google Scholar] [CrossRef] [Green Version]
- Guan, Y.; Jin Hu, J.; Wang, X.; Shao, C. Seed priming with chitosan improves maize germination and seedling growth in relation to physiological changes under low temperature stress. J. Zhejiang Univ. Sci. 2009, 10, 427–433. [Google Scholar] [CrossRef] [Green Version]
- Pokorska-Niewiada, K.; Rajkowska-Mysliwiec, M.; Protasowicki, M. Acute lethal toxicity of heavy metals to the seeds of plants of high importance to humans. Bull. Environ. Contam. Toxicol. 2018, 101, 222–228. [Google Scholar] [CrossRef] [Green Version]
- Kebrom, T.H.; Douglas, R.; Bandara, S.; Woldesenbet, S.; Carson, L.; Kidane, N. Identification of phytotoxic levels of copper and nickel in commercial organic soil amendments recycled from poultry farms and municipal wastes. Bull. Environ. Contam. Toxicol. 2020, 105, 921–926. [Google Scholar] [CrossRef]
- Bardhan, K.; York, L.M.; Hasanuzzaman, M.; Parekh, V.; Jena, S.; Pandya, M.N. Can smart nutrient applications optimize the plant’s hidden half to improve drought resistance? Physiol. Plant. 2021, 172, 1007–1015. [Google Scholar] [CrossRef]
- Fan, Y.; Massey, R.; Park, S.C. Multi-crop production decisions and economic irrigation water use efficiency: The effects of water costs, pressure irrigation adoption, and climatic determinants. Water 2018, 10, 1637. [Google Scholar] [CrossRef] [Green Version]
- Neugart, S.; Baldermann, S.; Hanschen, F.S.; Klopsch, R.; Wiesner-Reinhold, M.; Schreiner, M. The intrinsic quality of brassicaceous vegetables: How secondary plant metabolites are affected by genetic, environmental, and agronomic factors. Sci. Hortic. 2018, 233, 460–478. [Google Scholar] [CrossRef]
- González-Chavira, M.M.; Herrera-Hernández, M.G.; Guzmán-Maldonado, H.; Pons-Hernández, J.L. Controlled water deficit as abiotic stress factor for enhancing the phytochemical content and adding-value of crops. Sci. Hortic. 2018, 234, 354–360. [Google Scholar] [CrossRef]
- Vimala, P.; Roff, M.N.; Shokri, A.O.; Lim, A.H. Effect of organic fertilizer on the yield and nutrient content of leaf-mustard (Brassica juncea) organically grown under shelter. J. Trop. Agric. Food Sci. 2010, 38, 153–160. [Google Scholar]
- Reganold, J.P.; Wachter, J.M. Organic agriculture in the twenty-first century. Nat. Plants 2016, 2, 15221. [Google Scholar] [CrossRef]
- Wortman, S.E.; Holmes, A.A.; Miernicki, E.; Knoche, K.; Pittelkow, C.M. First-season crop yield response to organic soil amendments: A meta- analysis. J. Agron. 2017, 109, 1210–1217. [Google Scholar] [CrossRef] [Green Version]
- Bouyoucos, C. Les Proprie éte és Physiques du sol de éPendent de sa Texture Etde sa Structure, Les Bases de la Production Vegetale, Tome 1; Collectionsciences et Techniques Agricoles: Bressuire, France, 1983; pp. 67–87. [Google Scholar]
- Ramil, N.H.; Sulaiman, Z.A. Effects of different fertilizers formulas on the growth and development of leaf mustard. Brassica Juncea J. Acad. 2021, 9, 145–152. [Google Scholar]
- Barrs, H.D.; Weatherley, P.E. A re-examination of the relative turgidity technique for estimating water deficits in leaves. Aust. J. Biol. Sci. 1962, 15, 413–428. [Google Scholar] [CrossRef] [Green Version]
- Sairam, R.K. Effect of moisture stress on physiological activities of two contrasting wheat genotypes. Indian J. Exp. Biol. 1994, 32, 584–593. [Google Scholar]
- R Core Team. R: A Language and Environment for Statistical Computing; R Foundation for Statistical Computing: Vienna, Austria, 2013; Available online: http://www.R-project.org/ (accessed on 29 August 2021).
- Mendiburu, F. Agricolae: Statistical Procedures for Agricultural Research. R Package Version 1.1-4. 2013. Available online: https://CRAN.R-project.org/package=agricolae (accessed on 5 June 2021).
- Hosseini, S.M.; Hassibi, P. Effects of water deficit stress on several quantitative and qualitative characteristics of canola (Brassica napus L.) cultivars. Not. Sci. Biol. 2011, 3, 120–125. [Google Scholar] [CrossRef] [Green Version]
- Mbatha, T.P.; Modi, A.T. Response of local mustard germplasm to water stress. S. Afr. J. Plant Soil 2010, 27, 328–330. [Google Scholar] [CrossRef]
- Maseko, I.; Ncube, B.; Tesfay, S.; Fessehazion, M.; Modi, A.T.; Mabhaudhi, T. Productivity of selected African leafy vegetables under varying water regimes. Agronomy 2020, 10, 916. [Google Scholar] [CrossRef]
- Larkunthod, P.; Nounjan, N.; Siangliw, J.L.; Toojinda, T.; Sanitchon, J.; Jongdee, B.; Theerakulpisut, P. Physiological responses under drought stress of improved drought-tolerant rice lines and their parents. Not. Bot. Horti Agrobot. 2018, 46, 679–687. [Google Scholar] [CrossRef] [Green Version]
- Bangar, P.; Chaudhury, A.; Tiwari, B.; Kumar, S.; Kumari, R.; Bhat, K.V. Morphophysiological and biochemical response of mungbean [Vigna radiata (L.) Wilczek] varieties at different developmental stages under drought stress. Turk. J. Biol. 2019, 43, 58–69. [Google Scholar] [CrossRef]
- Kaya, M.D.; Okcub, G.; Ataka, M.; Cikilic, Y.; Kolsaricia, O. Seed treatments to overcome salt and drought stress during germination in sunflower (Helianthus annus L.). Eur. J. Agron. 2006, 24, 291–295. [Google Scholar] [CrossRef]
- Guo, X.; Li, S.; Wang, D.; Huang, Z.; Sarwar, N.; Mubeen, K.; Shakeel, M.; Hussain, M. Effects of water and fertilizer coupling on the physiological characteristics and growth of rabbiteye blueberry. PLoS ONE 2021, 16, e0254013. [Google Scholar] [CrossRef]
- Husen, A.; Iqbal, M.; Aref, I.M. Growth, water status, and leaf characteristics of Brassica carinata under drought and rehydration conditions. Braz. J. Bot. 2014, 37, 217–227. [Google Scholar] [CrossRef]
- Brunetti, G.; Traversa, A.; De Mastro, F.; Cocozza, C. Short term effects of synergistic inorganic and organic fertilization on soil properties and yield and quality of plum tomato. Sci. Hortic. 2019, 252, 342–347. [Google Scholar] [CrossRef]
- Li, Z.; Zhang, Y.; Zhang, X.; Merewitz, E.; Peng, Y.; Ma, X.; Yan, Y. Metabolic pathways regulated by chitosan contributing to drought resistance in white clover. J. Proteome Res. 2017, 16, 3039–3052. [Google Scholar] [CrossRef]
- Dimkpa, C.O.; Fugice, J.; Singh, U.; Lewis, T.D. Development of fertilizers for enhanced nitrogen use efficiency—Trends and perspectives. Sci. Total Environ. 2020, 731, 139113. [Google Scholar] [CrossRef] [PubMed]
- Moreno-Jiménez, E.; Plaza, C.; Saiz, H.; Manzano, R.; Flagmeier, M.; Maestre, F.T. Aridity and reduced soil micronutrient availability in global drylands. Nat. Sustain. 2019, 2, 371–377. [Google Scholar] [CrossRef] [PubMed]
- Farouk, S.; Amany, A.R. Improving growth and yield of cowpea by foliar application of chitosan under water stress. Egypt J. Biol. 2012, 14, 14–16. [Google Scholar] [CrossRef] [Green Version]
- Pirbalouti, A.G.; Malekpoor, F.; Salimi, A.; Golparvar, A. Exogenous application of chitosan on biochemical and physiological characteristics, phenolic content and antioxidant activity of two species of basil (Ocimum ciliatum and Ocimum basilicum) under reduced irrigation. Sci. Hortic. 2017, 217, 114–122. [Google Scholar] [CrossRef]
- Ghassemi-Golezani, K.; Afkhami, N. Changes in some morpho-physiological traits of safflower in response to water deficit and nano-fertilizers. J. Bus. Econ. Stat. 2018, 12, 391–398. [Google Scholar]
- Deka, D.; Singh, A.K.; Singh, A.K. Effect of Drought Stress on Crop Plants with Special Reference to Drought Avoidance and Tolerance Mechanisms: A Review. Int. J. Curr. Microbiol. Appl. Sci. 2018, 7, 2703–2721. [Google Scholar] [CrossRef]
- Haworth, M.; Marino, G.; Brunetti, C.; Killi, D.; Carlo, A.; Centritto, M. The impact of heat stress and water deficit on the photosynthetic and stomatal physiology of olive (Olea europaea L.)—A case study of the 2017 heatwave. Plants 2018, 7, 76. [Google Scholar] [CrossRef] [PubMed] [Green Version]
- Beykkhormizi, A.; Abrishamchi, P.; Ganjeali, A.; Parsa, M. Effect of vermicompost on some morphological, physiological and biochemical traits of bean (Phaseolus vulgaris L.) under salinity stress. J. Plant Nutr. 2016, 39, 883–893. [Google Scholar] [CrossRef]
- Ratnasekera, D.P.; Subhashi, A.P.T. Morpho-physiological response of selected Sri Lankan mungbean (Vigna radiata L.) genotypes to drought stress. J. AgriSearch. 2015, 2, 62–66. [Google Scholar]
- Ahmadizadeh, M.; Nori, A.; Shahbazi, H.; Habibpour, M. Effects of drought stress on some agronomic and morphological traits of durum wheat (Triticum durum Desf.) landraces under greenhouse condition. Afr. J. Biotechnol. 2011, 10, 14097–14107. [Google Scholar]
- Hosseinzadeh, S.R.; Amiri, H.; Ismaili, A. Evaluation of photosynthesis, physiological, and biochemical responses of chickpea (Cicer arietinum L. cv. Pirouz) under water deficit stress and use of vermicompost fertilizer. J. Integr. Agric. 2018, 17, 2426–2437. [Google Scholar] [CrossRef] [Green Version]
- Gurumurthy, S.; Sarkar, B.; Vanaja, M.; Lakshmi, J.; Yadav, S.; Maheswari, M. Morpho-physiological and biochemical changes in black gram (Vigna mungo L. Hepper) genotypes under drought stress at flowering stage. Acta Physiol. Plant 2019, 41, 42. [Google Scholar] [CrossRef]
- Malerba, M.; Cerana, R. Chitosan Effects on Plant Systems. Int. J. Mol. Sci. 2016, 17, 996. [Google Scholar] [CrossRef] [PubMed]
- Chowdhury, J.; Karim, M.; Khaliq, Q.; Ahmed, A. Effect of drought stress on bio-chemical change and cell membrane stability of soybean genotypes. Bangladesh J. Agric. Res. 2017, 42, 475–485. [Google Scholar] [CrossRef] [Green Version]
- Majidi, M.M.; Rashidi, F.; Sharafi, Y. Physiological traits related to drought tolerance in Brassica. Int. J. Parallel Progr. 2015, 9, 541–560. [Google Scholar]
- Kazeminasab, A.; Yarnia, M.; Lebaschy, M.H.; Mirshekari, B.; Rejali, F. The effect of vermicompost and PGPR on physiological traits of lemon balm (Melissa officinalis L.) plant under drought stress. JMPB 2016, 2, 135–144. [Google Scholar]
- Tekaya, M.; El-Gharbi, S.; Mechri, B.; Chehab, H.; Bchir, A.; Chraief, I.; Ayachi, M.; Boujnah, D.; Attia, F.; Hammami, M. Improving performance of olive trees by the enhancement of key physiological parameters of olive leaves in response to foliar fertilization. Acta Physiol. Plant. 2016, 38, 101–109. [Google Scholar] [CrossRef]
- Akram, M.S.; Ashraf, M. Alleviation of adverse effects of salt stress on sunflower (Helianthus annuus L.) by exogenous application of potassium nitrate. J. Appl. Bot. Food Qual. 2009, 83, 19–27. [Google Scholar]
- Sanaullah, M.; Rumpel, C.; Charrier, X.; Chabbi, A. How does drought stress influence the decomposition of plant litter with contrasting quality in a grassland ecosystem? Plant Soil 2012, 352, 277–288. [Google Scholar] [CrossRef]
- Lambers, H.; Chapin, F.S.; Pons, T.L. Ecosystem and Global Processes: Ecophysiological Controls. In Plant Physiological Ecology, 2nd ed.; Springer: New York, NY, USA, 2008; p. 559. [Google Scholar]
- Egilla, J.N.; Davies, F.T.; Boutton, T.W. Drought stress influences leaf water content, photosynthesis, and water-use efficiency of hibiscus rosa-sinensis at three potassium concentrations. Photosynthetica 2005, 43, 135–140. [Google Scholar] [CrossRef]
- Cakmak, I. The role of potassium in alleviating detrimental effects of abiotic stresses in plants. J. Plant Nutr. Soil Sci. 2005, 168, 521–530. [Google Scholar] [CrossRef]
- Sucre, B.; Suarez, N. Effect of salinity and PEG-induced water stress on water status, gas exchange, solute accumulation, and leaf growth in Ipomoea Pescaprae. Environ. Exp. Bot. 2011, 70, 192–203. [Google Scholar] [CrossRef]
- Shaul, O. Magnesium transport and function in plants: The tip of the iceberg. Biometals 2002, 15, 309–323. [Google Scholar] [CrossRef]
- Chatelain, P.G.; Pintado, M.E.; Vasconcelos, M.W. Evaluation of chitooligosaccharide application on mineral accumulation and plant growth in Phaseolus vulgaris. Plant Sci. 2014, 215, 134–140. [Google Scholar] [CrossRef]
- Yang, H.; Jie, Y. Uptake and Transport of Calcium in Plants. J. Plant Physiol. Mol. Biol. 2005, 31, 227–234. [Google Scholar]
- Waraich, E.A.; Ahmad, R.; Saifullah, M.Y.; Ashraf, E. Role of mineral nutrition in alleviation of drought stress in plants. Aust. J. Crop Sci. 2011, 5, 764–777. [Google Scholar]
- Adhikary, S. Vermicompost, the story of organic gold: A review. Agric. Sci. 2012, 3, 905–917. [Google Scholar] [CrossRef] [Green Version]
- Filek, M.; Walas, S.; Mrowiec, H.; Rudolphy-Skorska, E.; Sieprawska, A.; Biesaga-Koscielniak, J. Membrane permeability and micro- and macroelement accumulation in spring wheat cultivars during the short-term effect of salinity- and PEG-induced water stress. Acta Physiol. Plant 2012, 34, 985–995. [Google Scholar] [CrossRef] [Green Version]
- Peng, H.; Chen, Y.; Yan, Z.; Han, W. Stage-dependent stoichiometric homeostasis and responses of nutrient resorption in Amaranthus mangostanus to nitrogen and phosphorus addition. Sci. Rep. 2016, 6, 37219. [Google Scholar] [CrossRef] [Green Version]
- Chen, Y.E.; Yuan, S.; Liu, H.M.; Chen, Z.Y.; Zhang, Y.H.; Zhang, H.Y. A combination of chitosan and chemical fertilizers improves growth and disease resistance in Begonia hiemalis Fotsch. Hortic. Environ. Biotechnol. 2016, 57, 1–10. [Google Scholar] [CrossRef]
- Maillard, A.; Etienne, P.; Diquélou, S.; Trouverie, J.; Billard, V.; Yvin, J.C.; Ourry, A. Nutrient deficiencies modify the ionomic composition of plant tissues: A focus on crosstalk between molybdenum and other nutrients in Brassica napus. J. Exp. Bot. 2016, 67, 5631–5641. [Google Scholar] [CrossRef] [PubMed] [Green Version]
- Sosa, A.; Padilla, J.; Ortiz, J.; Etchevers, J.D. Biomass Accumulation and its Relationship with the Demand and Concentration of Nitrogen, Phosphorus, and Potassium in Lettuce. Commun. Soil Sci. Plant Anal. 2012, 43, 121–133. [Google Scholar] [CrossRef]
- Fernández-Escobar, R.; Antonaya-Baena, M.F.; Sánchez-Zamora, M.A.; Molina-Soria, C. The amount of nitrogen applied and nutritional status of olive plants affect nitrogen uptake efficiency. Sci. Hortic. 2014, 167, 1–4. [Google Scholar] [CrossRef]
- Ahmad, A.; Selim, M.M.; Alderfasi, A.A.; Afzal, M. Effect of drought stress on mung bean (Vigna radiata L.) under arid climatic conditions of Saudi Arabia. In Ecosystem and Sustainable Development; Miralles Garcia, J.L., Brebbia, C.A., Eds.; WIT Press: Southampton, UK, 2015; pp. 185–193. [Google Scholar]
- Hawkesford, M.; Horst, W.; Kichey, T.; Lambers, H.; Schjoerring, J.; Møller, I.S. Functions of macronutrients. In Marschner’s Mineral Nutrition of Higher Plants, 3rd ed.; Academic Press: Waltham, MA, USA; Elsevier: Amsterdam, The Netherlands, 2012; pp. 135–189. [Google Scholar]
- Cakmak, I.; Kirkby, E.A. Role of magnesium in carbon partitioning and alleviating photooxidative damage. Physiol. Plant. 2008, 133, 692–704. [Google Scholar] [CrossRef]
- Ding, Y.; Xu, G. Low magnesium with high potassium supply changes sugar partitioning and root growth pattern prior to visible magnesium deficiency in leaves of Rice (Oryza sativa L.). Am. J. Plant Sci. 2011, 2, 601–608. [Google Scholar] [CrossRef] [Green Version]
- Marschner, H. Mineral Nutrition of Higher Plants, 3rd ed.; Academic Press: London, UK, 2012; pp. 315–330. [Google Scholar]


| Fertilizer | Soil Moisture | SPAD | RWC (%) | Height (cm) | LA (cm2) | MSI (%) | Shoot Biomass (g) | Root Biomass (g) | RSR |
|---|---|---|---|---|---|---|---|---|---|
| Control | WW | 46.82 a | 50.44 a | 59.13 a | 50.09 a | 75.09 a | 22.44 a | 19.12 a | 0.85 a |
| MS | 38.19 b | 45.53 b | 57.40 a | 38.16 b | 62.95 b | 15.09 b | 11.66 b | 0.78 a | |
| SS | 21.75 c | 32.57 c | 40.91 b | 31.82 c | 37.37 c | 5.34 c | 4.8 c | 0.91 a | |
| CH | WW | 58.82 a | 90.49 a | 59.88 a | 47.09 a | 69.11 a | 34.96 a | 17.78 a | 0.51 b |
| MS | 43.74 b | 48.52 b | 57.06 ab | 38.16 b | 61.03 b | 23.84 b | 13.91 b | 0.59 b | |
| SS | 36.64 c | 35.39 c | 54.69 b | 32.1 c | 40.59 c | 12.51 c | 18.59 a | 1.51 a | |
| HO | WW | 52.26 a | 97.18 a | 59.38 a | 51.08 a | 89.88 a | 25.08 a | 7.73 b | 0.31 b |
| MS | 41.95 b | 76.75 b | 55.65 b | 46.97 b | 70.21 b | 16.12 b | 4.64 c | 0.29 b | |
| SS | 30.93 c | 53.84 c | 52.45 c | 33.15 c | 53.86 c | 8.66 c | 13.52 a | 1.58 a | |
| UG | WW | 60.13 a | 88.51 a | 59.79 a | 64.56 a | 53.17 a | 28.72 a | 13.68 b | 0.48 b |
| MS | 53.78 b | 66.81 b | 57.05 b | 52.77 b | 46.17 b | 19.07 b | 20.48 a | 1.08 a | |
| SS | 39.95 c | 49.01 c | 55.97 c | 47.35 c | 40.62 c | 12.25 c | 5.98 c | 0.49 b | |
| CH + HO | WW | 65.87 a | 86.74 a | 61.53 a | 55.39 a | 74.12 a | 30.44 a | 4.92 c | 0.16 c |
| MS | 55.76 b | 64.31 b | 58.63 b | 45.85 b | 64.84 b | 19.71 b | 9.44 b | 0.48 b | |
| SS | 46.68 c | 42.64 c | 54.47 c | 39.51 c | 40.92 c | 10.32 c | 13.94 a | 1.35 a | |
| CH + UG | WW | 59.64 a | 96.46 a | 69.46 a | 52.01 a | 84.75 a | 27.15 a | 10.96 a | 0.41 a |
| MS | 44.36 b | 70.85 b | 59.77 b | 45.92 b | 65.63 b | 21.02 b | 3.26 c | 0.16 b | |
| SS | 31.58 c | 43.86 c | 45.29 c | 38.88 c | 54.09 c | 13.51 c | 7.34 b | 0.55 a | |
| HO + UG | WW | 65.54 a | 83.03 a | 60.44 a | 53.19 a | 66.34 a | 26.45 a | 17.09 a | 0.65 b |
| MS | 54.56 b | 60.88 b | 59.93 b | 42.37 b | 50.82 b | 16.42 b | 11.94 b | 0.73 b | |
| SS | 39.59 c | 46.78 c | 53.00 b | 36.63 c | 41.04 c | 14.05 c | 5.98 c | 1.48 a | |
| CH + UG + HO | WW | 76.66 a | 92.59 a | 77.44 a | 68.62 a | 85.18 a | 35.53 a | 26.28 a | 0.74 b |
| MS | 61.74 b | 78.58 b | 61.47 b | 58.58 b | 74.31 b | 24.52 b | 12.75 b | 0.52 c | |
| SS | 50.04 c | 41.82 c | 55.35 c | 44.53 c | 61.93 c | 12.92 c | 14.14 b | 1.09 a |
| Parameters | Sources of Variation | ||||||||
|---|---|---|---|---|---|---|---|---|---|
| Fertilizers | Soil Moisture | Fertilizers * Soil Moisture | |||||||
| DF | SS | Prob > F | DF | SS | Prob > F | DF | SS | Prob > F | |
| SPAD | 7 | 905.744 | <0.0001 ** | 2 | 6458.04 | <0.0001 ** | 14 | 255.85 | <0.0001 ** |
| RWC | 7 | 4731.75 | <0.0001 ** | 2 | 21617.94 | <0.0001 ** | 14 | 2228.57 | <0.0001 ** |
| Height | 7 | 917.51 | <0.0001 ** | 2 | 1741.39 | <0.0001 ** | 14 | 908.06 | <0.0001 ** |
| LA | 7 | 633.25 | <0.0001 ** | 2 | 3629.51 | <0.0001 ** | 14 | 185.23 | <0.0001 ** |
| MSI | 7 | 2769.62 | <0.0001 ** | 2 | 9428.19 | <0.0001 ** | 14 | 810.53 | <0.0001 ** |
| Shoot biomass | 7 | 445.41 | <0.0001 ** | 2 | 4286.30 | <0.0001 ** | 14 | 137.36 | 0.0014 ** |
| Root biomass | 7 | 2404.56 | 0.002 ** | 2 | 662.95 | 0.031 * | 14 | 1771.81 | 0.1784 |
| RSR | 7 | 2.141 | 0.007 ** | 2 | 4.59 | <0.0001 ** | 14 | 5.02 | 0.0003 ** |
| Fertilizers | Soil Moisture | Macronutrients (mg/mL) | Micronutrients (mg/mL) | |||||||
|---|---|---|---|---|---|---|---|---|---|---|
| Ca | K | Mg | Na | P | Cu | Fe | Mn | Zn | ||
| Control | WW | 31.35 a | 33.51 c | 11.52 a | 10.95 b | 9.81 a | 0.07 a | 1.78 a | 0.42 a | 0.50 a |
| MS | 24.81 b | 43.84 b | 7.63 b | 15.03 a | 7.25 b | 0.04 b | 1.26 a | 0.29 b | 0.414 b | |
| SS | 11.03 c | 54.47 a | 4.55 c | 7.12 c | 3.38 c | 0.03 c | 0.56 b | 0.23 c | 0.23 c | |
| CH | WW | 25.35 a | 63.09 a | 13.83 a | 4.32 c | 14.58 a | 0.07 a | 3.90 a | 0.08 a | 0.94 a |
| MS | 16.13 b | 57.83 a | 7.98 b | 12.07 b | 11.32 b | 0.06 ab | 1.47 b | 0.37 ab | 0.69 a | |
| SS | 12.11 c | 43.69 c | 4.24 c | 16.11 a | 6.96 c | 0.05 b | 0.92 b | 0.23 b | 0.58 a | |
| HO | WW | 26.17 a | 94.62 a | 26.79 a | 13.48 a | 13.17 a | 0.09 a | 7.19 a | 0.51 a | 0.82 a |
| MS | 21.12 b | 68.24 b | 15.13 b | 9.34 b | 11.00 b | 0.06 ab | 1.43 b | 0.32 a | 0.74 ab | |
| SS | 15.76 c | 59.06 c | 10.11 c | 4.07 c | 8.69 c | 0.05 b | 0.96 b | 0.22 a | 0.65 b | |
| UG | WW | 31.35 a | 91.51 b | 33.08 a | 17.82 a | 15.07 a | 0.09 a | 1.95 a | 0.39 a | 0.72 a |
| MS | 24.81 b | 83.94 b | 23.21 b | 12.47 b | 9.65 b | 0.07 ab | 1.64 a | 0.35 ab | 0.65 a | |
| SS | 11.03 c | 104.14 a | 13.47 c | 7.45 c | 6.76 c | 0.06 b | 1.45 a | 0.28 b | 0.49 b | |
| CH + HO | WW | 18.53 a | 46.84 c | 14.18 a | 8.59 c | 12.53 a | 0.87 a | 3.90 a | 0.38 a | 0.92 a |
| MS | 16.56 b | 63.0 b | 8.23 b | 12.84 b | 12.19 a | 0.06 b | 1.82 b | 0.29 ab | 0.59 b | |
| SS | 13.26 c | 92.08 a | 5.75 c | 19.62 a | 4.63 b | 0.05 b | 0.78 b | 0.19 b | 0.47 b | |
| CH + UG | WW | 35.68 a | 71.09 a | 16.90 a | 14.54 a | 13.55 a | 0.11 a | 4.42 a | 0.54 a | 0.54 b |
| MS | 26.23 b | 56.40 b | 9.33 b | 9.31 b | 11.28 b | 0.01 b | 2.91 ab | 0.41 ab | 0.67 ab | |
| SS | 16.19 c | 53.89 b | 6.09 c | 5.13 c | 10.29 b | 0.06 b | 1.23 b | 0.25 b | 0.88 a | |
| HO + UG | WW | 29.27 a | 82.61 a | 28.63 a | 16.26 a | 14.60 a | 0.07 b | 3.82 a | 0.43 a | 0.57 b |
| MS | 21.79 b | 81.89 a | 14.29 b | 10.67 b | 11.63 b | 0.26 a | 1.53 ab | 0.28 ab | 0.64 a | |
| SS | 15.84 c | 71.84 b | 7.97 c | 10.61 b | 7.57 c | 0.04 b | 0.66 b | 0.21 b | 0.68 a | |
| CH + UG + HO | WW | 29.42 a | 70.72 c | 13.95 a | 18.95 a | 13.09 a | 0.09 a | 5.28 a | 0.42 a | 0.69 a |
| MS | 19.31 b | 81.36 b | 7.62 b | 8.81 b | 11.63 ab | 0.06 a | 2.02 b | 0.34 b | 0.59 b | |
| SS | 14.44 c | 88.95 a | 4.23 c | 3.44 c | 10.74 b | 0.06 a | 0.76 c | 0.23 c | 0.54 b | |
| Fertilizers | Soil Moisture | % Nutrient Content | Ratio | ||
|---|---|---|---|---|---|
| N (%) | C (%) | S (%) | C/N | ||
| Control | WW | 4.68 a | 41.90 b | 1.66 a | 9.05 b |
| MS | 3.18 b | 53.32 a | 1.09 b | 17.46 a | |
| SS | 1.56 c | 30.52 c | 0.68 c | 19.97 a | |
| CH | WW | 6.01 a | 67.90 a | 1.97 a | 11.3 b |
| MS | 4.40 b | 53.32 b | 1.45 a | 12.16 b | |
| SS | 1.71 c | 33.19 c | 0.78 b | 19.45 a | |
| HO | WW | 8.99 a | 64.58 a | 3.22 a | 7.42 b |
| MS | 6.24 b | 57.50 b | 1.27 b | 10.4 b | |
| SS | 2.53 c | 34.99 c | 0.79 b | 24.81 a | |
| UG | WW | 8.14 a | 67.68 a | 2.21 a | 5.53 b |
| MS | 5.11 b | 43.86 b | 1.35 ab | 6.51 b | |
| SS | 2.08 c | 33.98 c | 1.12 b | 16.98 a | |
| CH + HO | WW | 9.04 a | 66.56 a | 1.90 a | 7.19 b |
| MS | 4.30 b | 44.10 b | 1.81 a | 11.19 ab | |
| SS | 1.49 c | 34.44 c | 1.76 a | 17.4 a | |
| CH + UG | WW | 8.02 a | 44.28 a | 1.83 a | 7.23 b |
| MS | 5.50 b | 34.89 b | 1.33 b | 9.23 ab | |
| SS | 1.92 c | 31.62 b | 0.83 c | 13.94 a | |
| HO + UG | WW | 8.03 a | 68.51 a | 3.59 a | 8.72 b |
| MS | 4.52 b | 45.82 b | 2.19 ab | 10.32 b | |
| SS | 1.73 c | 35.99 c | 0.86 b | 21.27 a | |
| CH +UG + HO | WW | 7.80 a | 55.41 a | 2.38 a | 8.34 b |
| MS | 3.82 b | 41.64 b | 1.20 b | 8.88 b | |
| SS | 2.07 b | 35.85 b | 0.72 c | 17.27 a | |
| Parameters | Source of Variation | ||||||||
|---|---|---|---|---|---|---|---|---|---|
| Fertilizers | Soil Moisture | Fertilizers * Soil Moisture | |||||||
| DF | SS | Prob>F | DF | SS | Prob>F | DF | SS | Prob>F | |
| K | 7 | 9826.61 | <0.0001 ** | 2 | 1060.73 | <0.0001 ** | 14 | 7264.58 | <0.0001 ** |
| Mg | 7 | 1445.49 | <0.0001 ** | 2 | 2019.11 | <0.0001 ** | 14 | 325.93 | <0.0001 ** |
| Na | 7 | 706.64 | <0.0001 ** | 2 | 50.44 | <0.0001 ** | 14 | 1307.22 | <0.0001 ** |
| Ca | 7 | 709.38 | <0.0001 ** | 2 | 2561.68 | <0.0001 ** | 14 | 357.51 | <0.0001 ** |
| Fe | 7 | 55.04 | 0.0044 * | 2 | 30.33 | 0.0027 ** | 14 | 138.71 | <0.0001 ** |
| N | 7 | 47.17 | <0.0001 ** | 2 | 390.75 | <0.0001 ** | 14 | 25.89 | <0.0001 ** |
| C | 7 | 2557.41 | <0.0001 ** | 2 | 7974.41 | <0.0001 ** | 14 | 2023.37 | <0.0001 ** |
| S | 7 | 10.49 | <0.0001 ** | 2 | 23.28 | <0.0001 ** | 14 | 9.33 | <0.0001 ** |
| P | 7 | 57.80 | <0.0001 ** | 2 | 422.49 | <0.0001 ** | 14 | 83.49 | <0.0001 ** |
| Cu | 7 | 0.004 | 0.997 | 2 | 0.02 | 0.129 | 14 | 0.08 | 0.370 |
| Mn | 7 | 0.07 | 0.0495 * | 2 | 0.55 | <0.0001 ** | 14 | 0.05 | 0.691 |
| Zn | 7 | 0.63 | <0.0001 ** | 2 | 0.05 | 0.0475 * | 14 | 0.94 | <0.0001 ** |
| SPAD | RWC | Height | LA | SBM | RBM | RSR | K | Mg | Na | Ca | Fe | N | C | S | MSI | P | Cu | Mn | Zn | |
|---|---|---|---|---|---|---|---|---|---|---|---|---|---|---|---|---|---|---|---|---|
| SPAD | ** | ** | ** | ** | ** | ** | ns | ** | ns | ** | ** | ** | ** | ** | ** | ** | ns | ** | * | |
| RWC | 0.84 | ** | ** | ** | ns | ** | ns | ** | ns | ** | ** | ** | ** | ** | ** | ** | * | ** | ** | |
| Height | 0.79 | 0.72 | ** | ** | * | * | ns | ** | ns | ** | ns | ** | ** | ** | ** | ** | ns | ** | * | |
| LA | 0.83 | 0.82 | 0.67 | ** | ns | ** | ns | ** | ns | ** | * | ** | ** | ** | ** | ** | * | ** | ns | |
| SBM | 0.85 | 0.82 | 0.76 | 0.78 | ** | ** | ns | ** | ns | ** | ns | ** | ** | ** | ** | ** | * | ** | * | |
| RBM | 0.30 | 0.16 | 0.24 | 0.125 | 0.32 | ** | ns | ns | ns | * | ns | ns | * | ns | ns | * | ns | * | ns | |
| RSR | −0.34 | −0.46 | −0.29 | −0.50 | −0.45 | 0.61 | ns | * | ns | ** | ns | ** | ** | ** | ** | ** | * | * | ns | |
| K | 0.08 | 0.141 | 0.19 | 0.03 | 0.04 | 0.01 | 0.01 | ** | ns | ns | ns | ns | ns | * | * | ns | ns | ns | ns | |
| Mg | 0.84 | 0.73 | 0.78 | 0.66 | 0.69 | 0.23 | −0.28 | 0.38 | ns | ** | ns | ** | ** | ** | ** | ** | ns | ** | ns | |
| Na | −0.16 | −0.06 | 0.18 | −0.13 | −0.08 | −0.17 | −0.04 | −0.05 | −0.03 | ** | ns | ns | ns | ns | ** | ns | ns | ** | ns | |
| Ca | 0.83 | 0.68 | 0.75 | 0.85 | 0.78 | 0.28 | −0.32 | −0.01 | 0.74 | −0.01 | * | ** | ** | ** | ** | ** | ns | ** | ns | |
| Fe | 0.32 | 0.38 | 0.22 | 0.29 | 0.21 | −0.06 | −0.09 | −0.18 | 0.17 | 0.03 | 0.25 | ** | ns | ** | ** | ** | ns | ** | * | |
| N | 0.91 | 0.88 | 0.70 | 0.81 | 0.80 | 0.17 | −0.43 | 0.01 | 0.75 | −0.16 | 0.73 | 0.33 | ** | ** | ** | ** | ns | ** | * | |
| C | 0.76 | 0.76 | 0.70 | 0.52 | 0.78 | 0.25 | −0.35 | 0.05 | 0.70 | −0.09 | 0.55 | 0.22 | 0.80 | ** | ** | ** | ns | ** | * | |
| S | 0.66 | 0.73 | 0.59 | 0.57 | 0.65 | 0.07 | −0.35 | 0.24 | 0.68 | 0.03 | 0.54 | 0.13 | 0.68 | 0.67 | ** | ** | ns | ** | ns | |
| MSI | 0.70 | 0.60 | 0.38 | 0.71 | 0.58 | 0.09 | −0.37 | −0.28 | 0.36 | −0.32 | 0.58 | 0.33 | 0.77 | 0.59 | 0.53 | ** | ns | ** | ns | |
| P | 0.81 | 0.81 | 0.74 | 0.80 | 0.79 | 0.24 | −0.40 | 0.08 | 0.61 | −0.17 | 0.64 | 0.33 | 0.79 | 0.71 | 0.57 | 0.64 | * | ** | ** | |
| Cu | 0.18 | 0.24 | 0.19 | 0.24 | 0.24 | −0.06 | −0.25 | 0.05 | 0.18 | 0.06 | 0.18 | 0.04 | 0.16 | 0.11 | 0.22 | 0.09 | 0.25 | ns | ns | |
| Mn | 0.77 | 0.65 | 0.52 | 0.70 | 0.71 | 0.25 | −0.29 | −0.06 | 0.53 | −0.31 | 0.68 | 0.33 | 0.74 | 0.57 | 0.46 | 0.74 | 0.65 | 0.12 | ns | |
| Zn | 0.28 | 0.34 | 0.28 | 0.23 | 0.26 | 0.07 | −0.11 | 0.04 | 0.14 | −0.09 | 0.04 | 0.29 | 0.26 | 0.30 | 0.06 | 0.14 | 0.49 | 0.09 | 0.14 |
Publisher’s Note: MDPI stays neutral with regard to jurisdictional claims in published maps and institutional affiliations. |
© 2021 by the authors. Licensee MDPI, Basel, Switzerland. This article is an open access article distributed under the terms and conditions of the Creative Commons Attribution (CC BY) license (https://creativecommons.org/licenses/by/4.0/).
Share and Cite
Geremew, A.; Carson, L.; Woldesenbet, S.; Carpenter, C.; Peace, E.; Weerasooriya, A. Interactive Effects of Organic Fertilizers and Drought Stress on Growth and Nutrient Content of Brassica juncea at Vegetative Stage. Sustainability 2021, 13, 13948. https://doi.org/10.3390/su132413948
Geremew A, Carson L, Woldesenbet S, Carpenter C, Peace E, Weerasooriya A. Interactive Effects of Organic Fertilizers and Drought Stress on Growth and Nutrient Content of Brassica juncea at Vegetative Stage. Sustainability. 2021; 13(24):13948. https://doi.org/10.3390/su132413948
Chicago/Turabian StyleGeremew, Addisie, Laura Carson, Selamawit Woldesenbet, Charles Carpenter, Elisha Peace, and Aruna Weerasooriya. 2021. "Interactive Effects of Organic Fertilizers and Drought Stress on Growth and Nutrient Content of Brassica juncea at Vegetative Stage" Sustainability 13, no. 24: 13948. https://doi.org/10.3390/su132413948
APA StyleGeremew, A., Carson, L., Woldesenbet, S., Carpenter, C., Peace, E., & Weerasooriya, A. (2021). Interactive Effects of Organic Fertilizers and Drought Stress on Growth and Nutrient Content of Brassica juncea at Vegetative Stage. Sustainability, 13(24), 13948. https://doi.org/10.3390/su132413948