
Fermentation of Washed Rice Water Increases Beneficial Plant Bacterial Population and Nutrient Concentrations


Abstract
:1. Introduction
2. Materials and Methods
2.1. Chemical Analyses
2.2. Culture Media Preparation and Bacterial Population
2.3. N Fixation, Phosphate, and Potassium Solubilization Ability of the WRW Culture
2.4. Production of Indole Acetic Acid (IAA)
2.5. Catalase Test
2.6. Bacterial Isolations
2.7. Bacterial Identification Using 16S rRNA Gene Sequence
2.8. Sequence Submission and Phylogenetic Analyses
2.9. Data Analysis
3. Results
3.1. Microbial Analyses
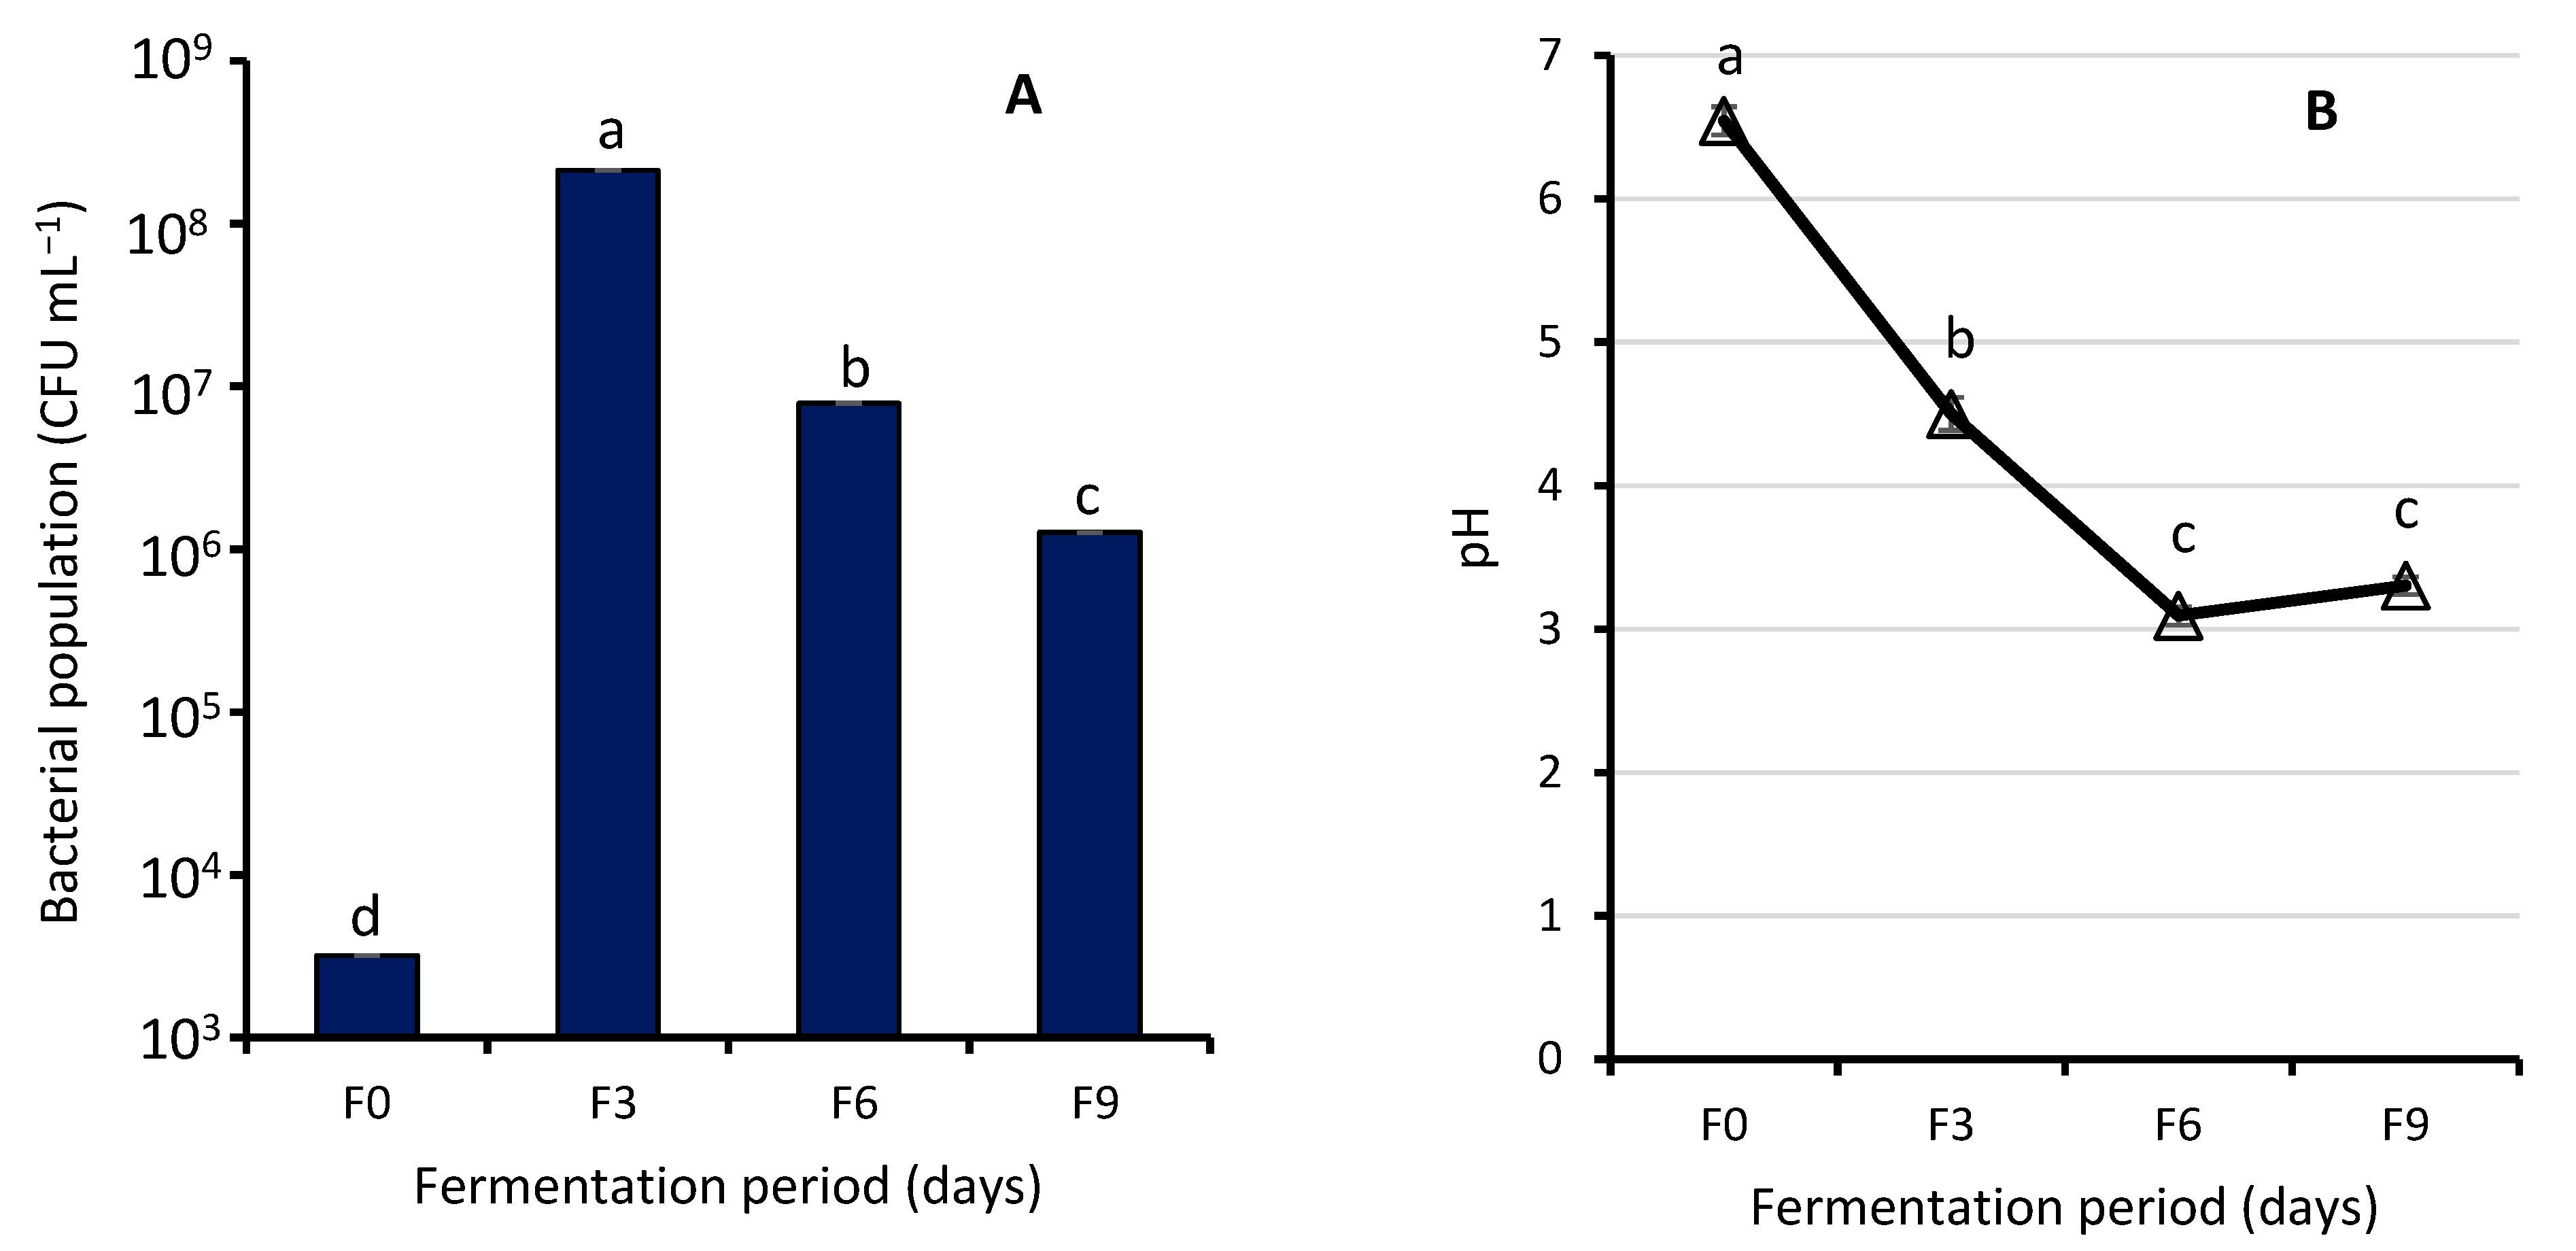
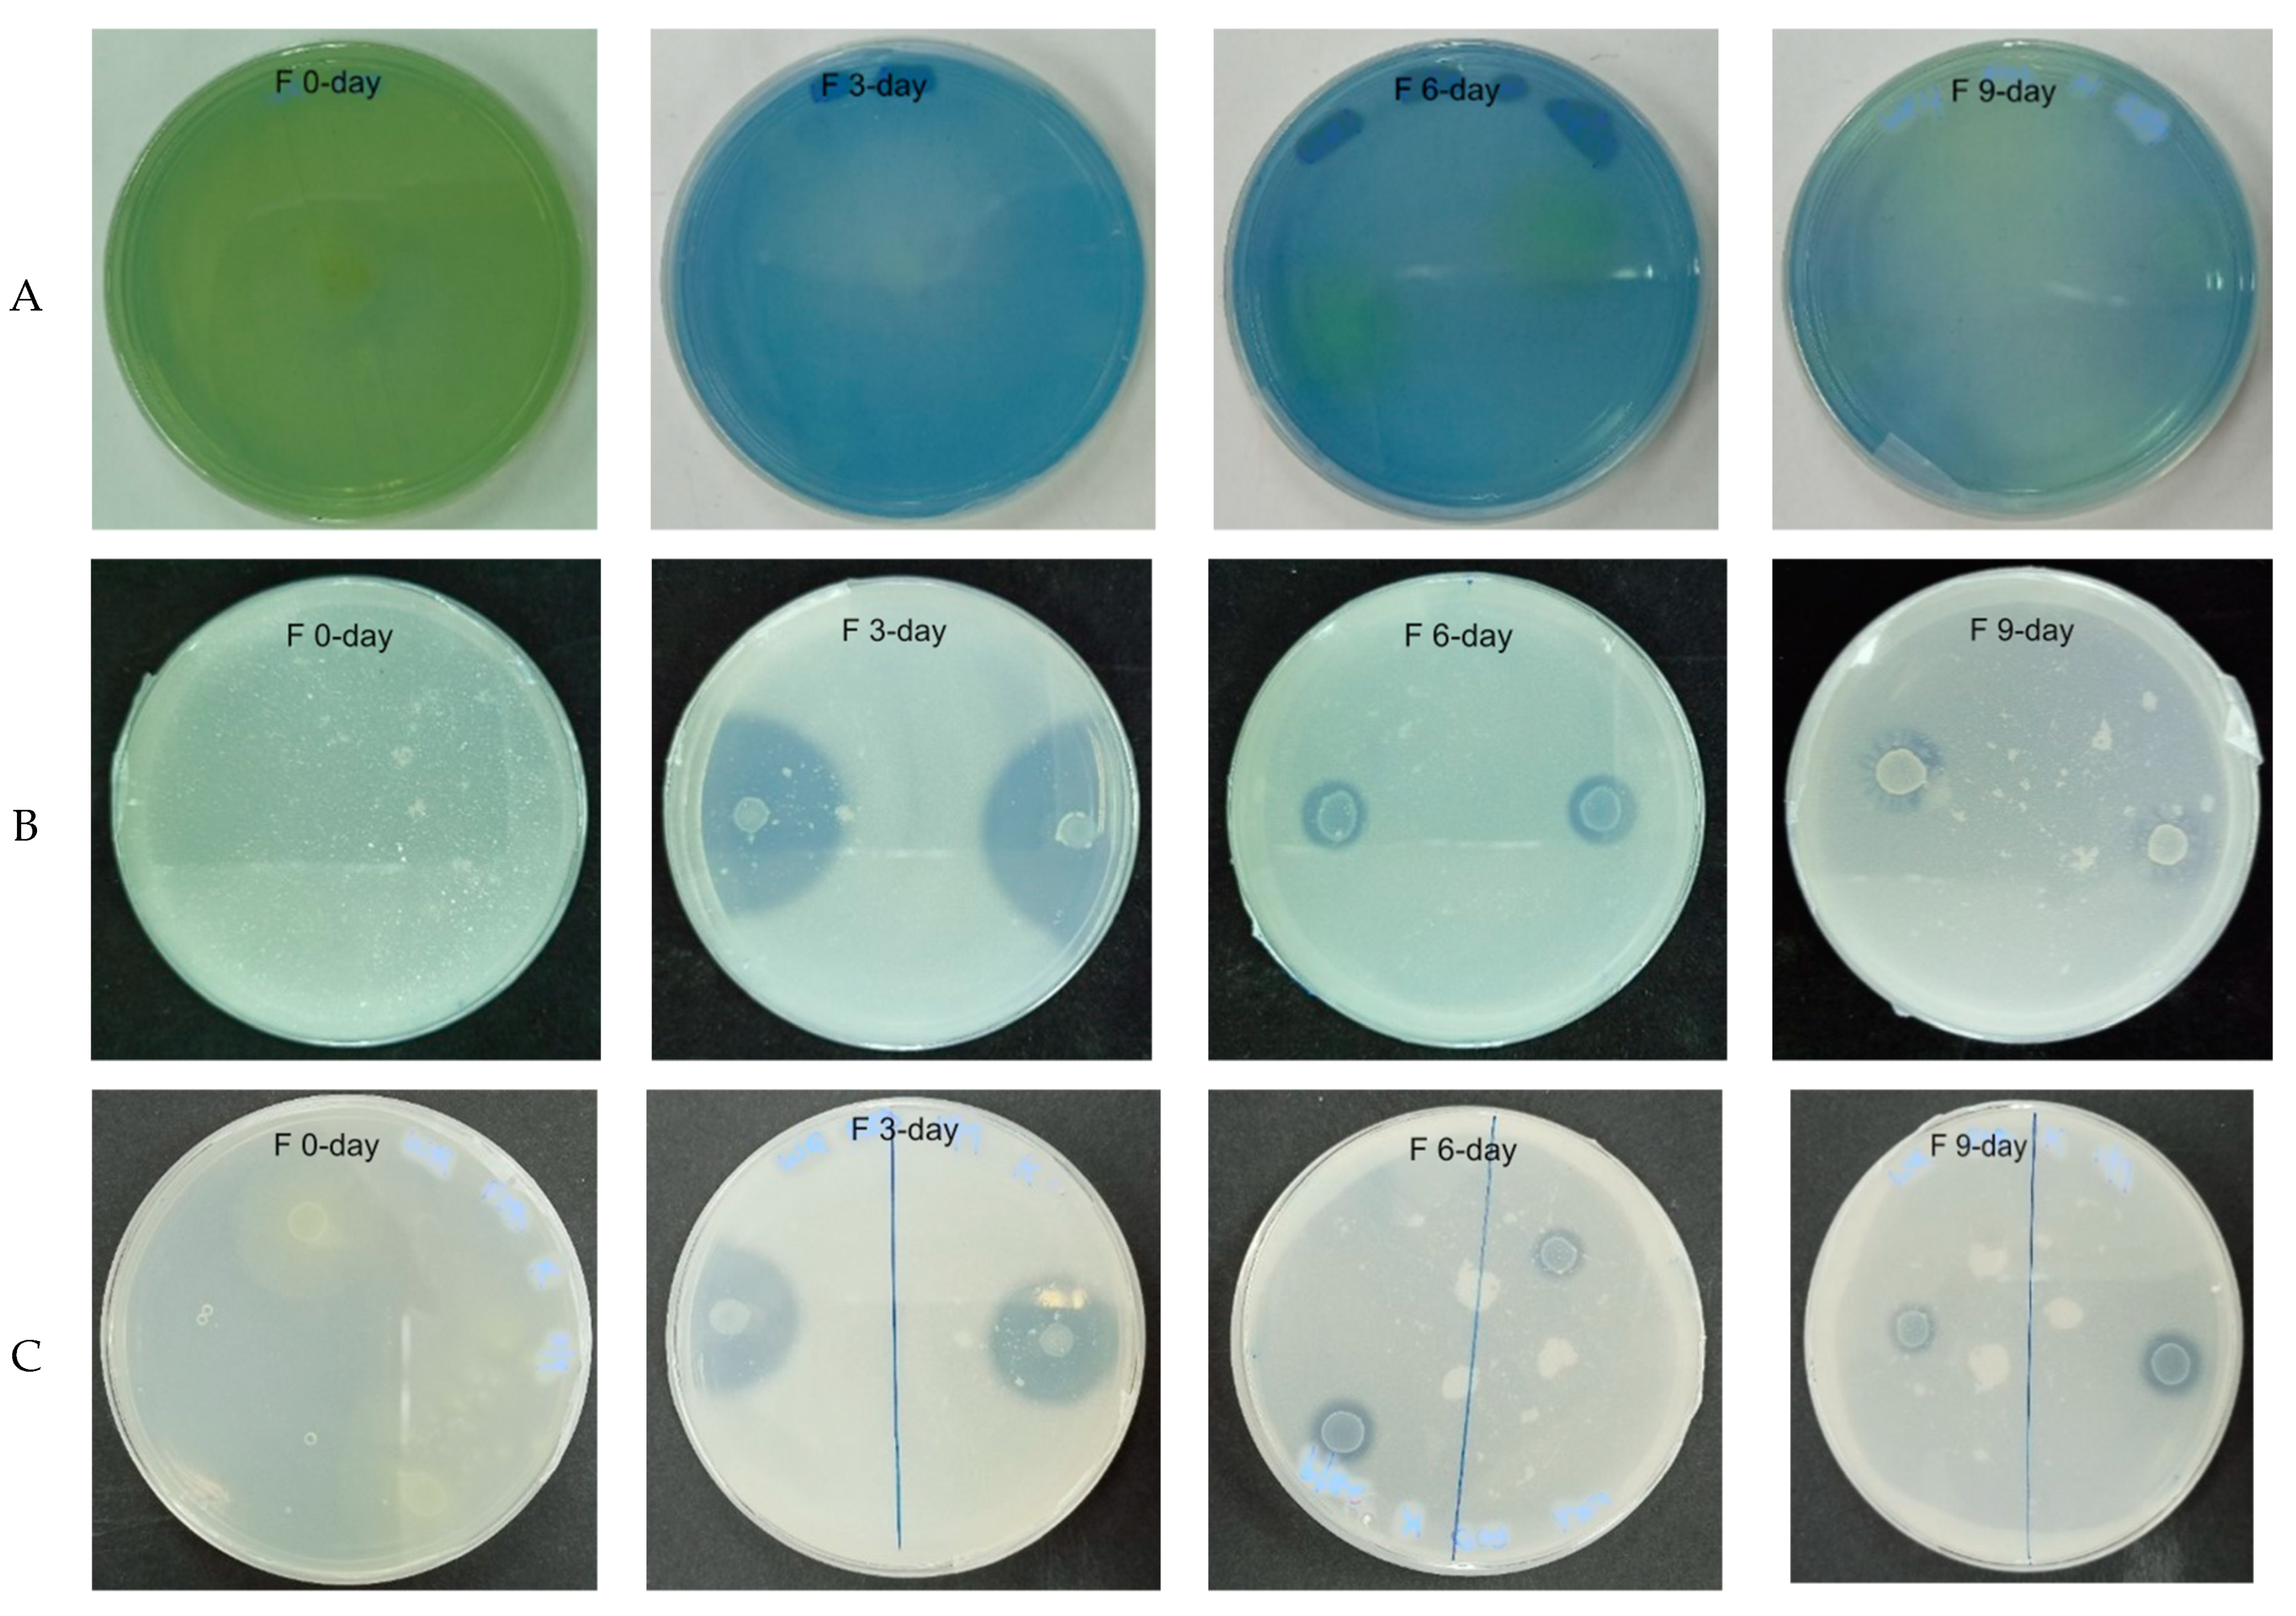
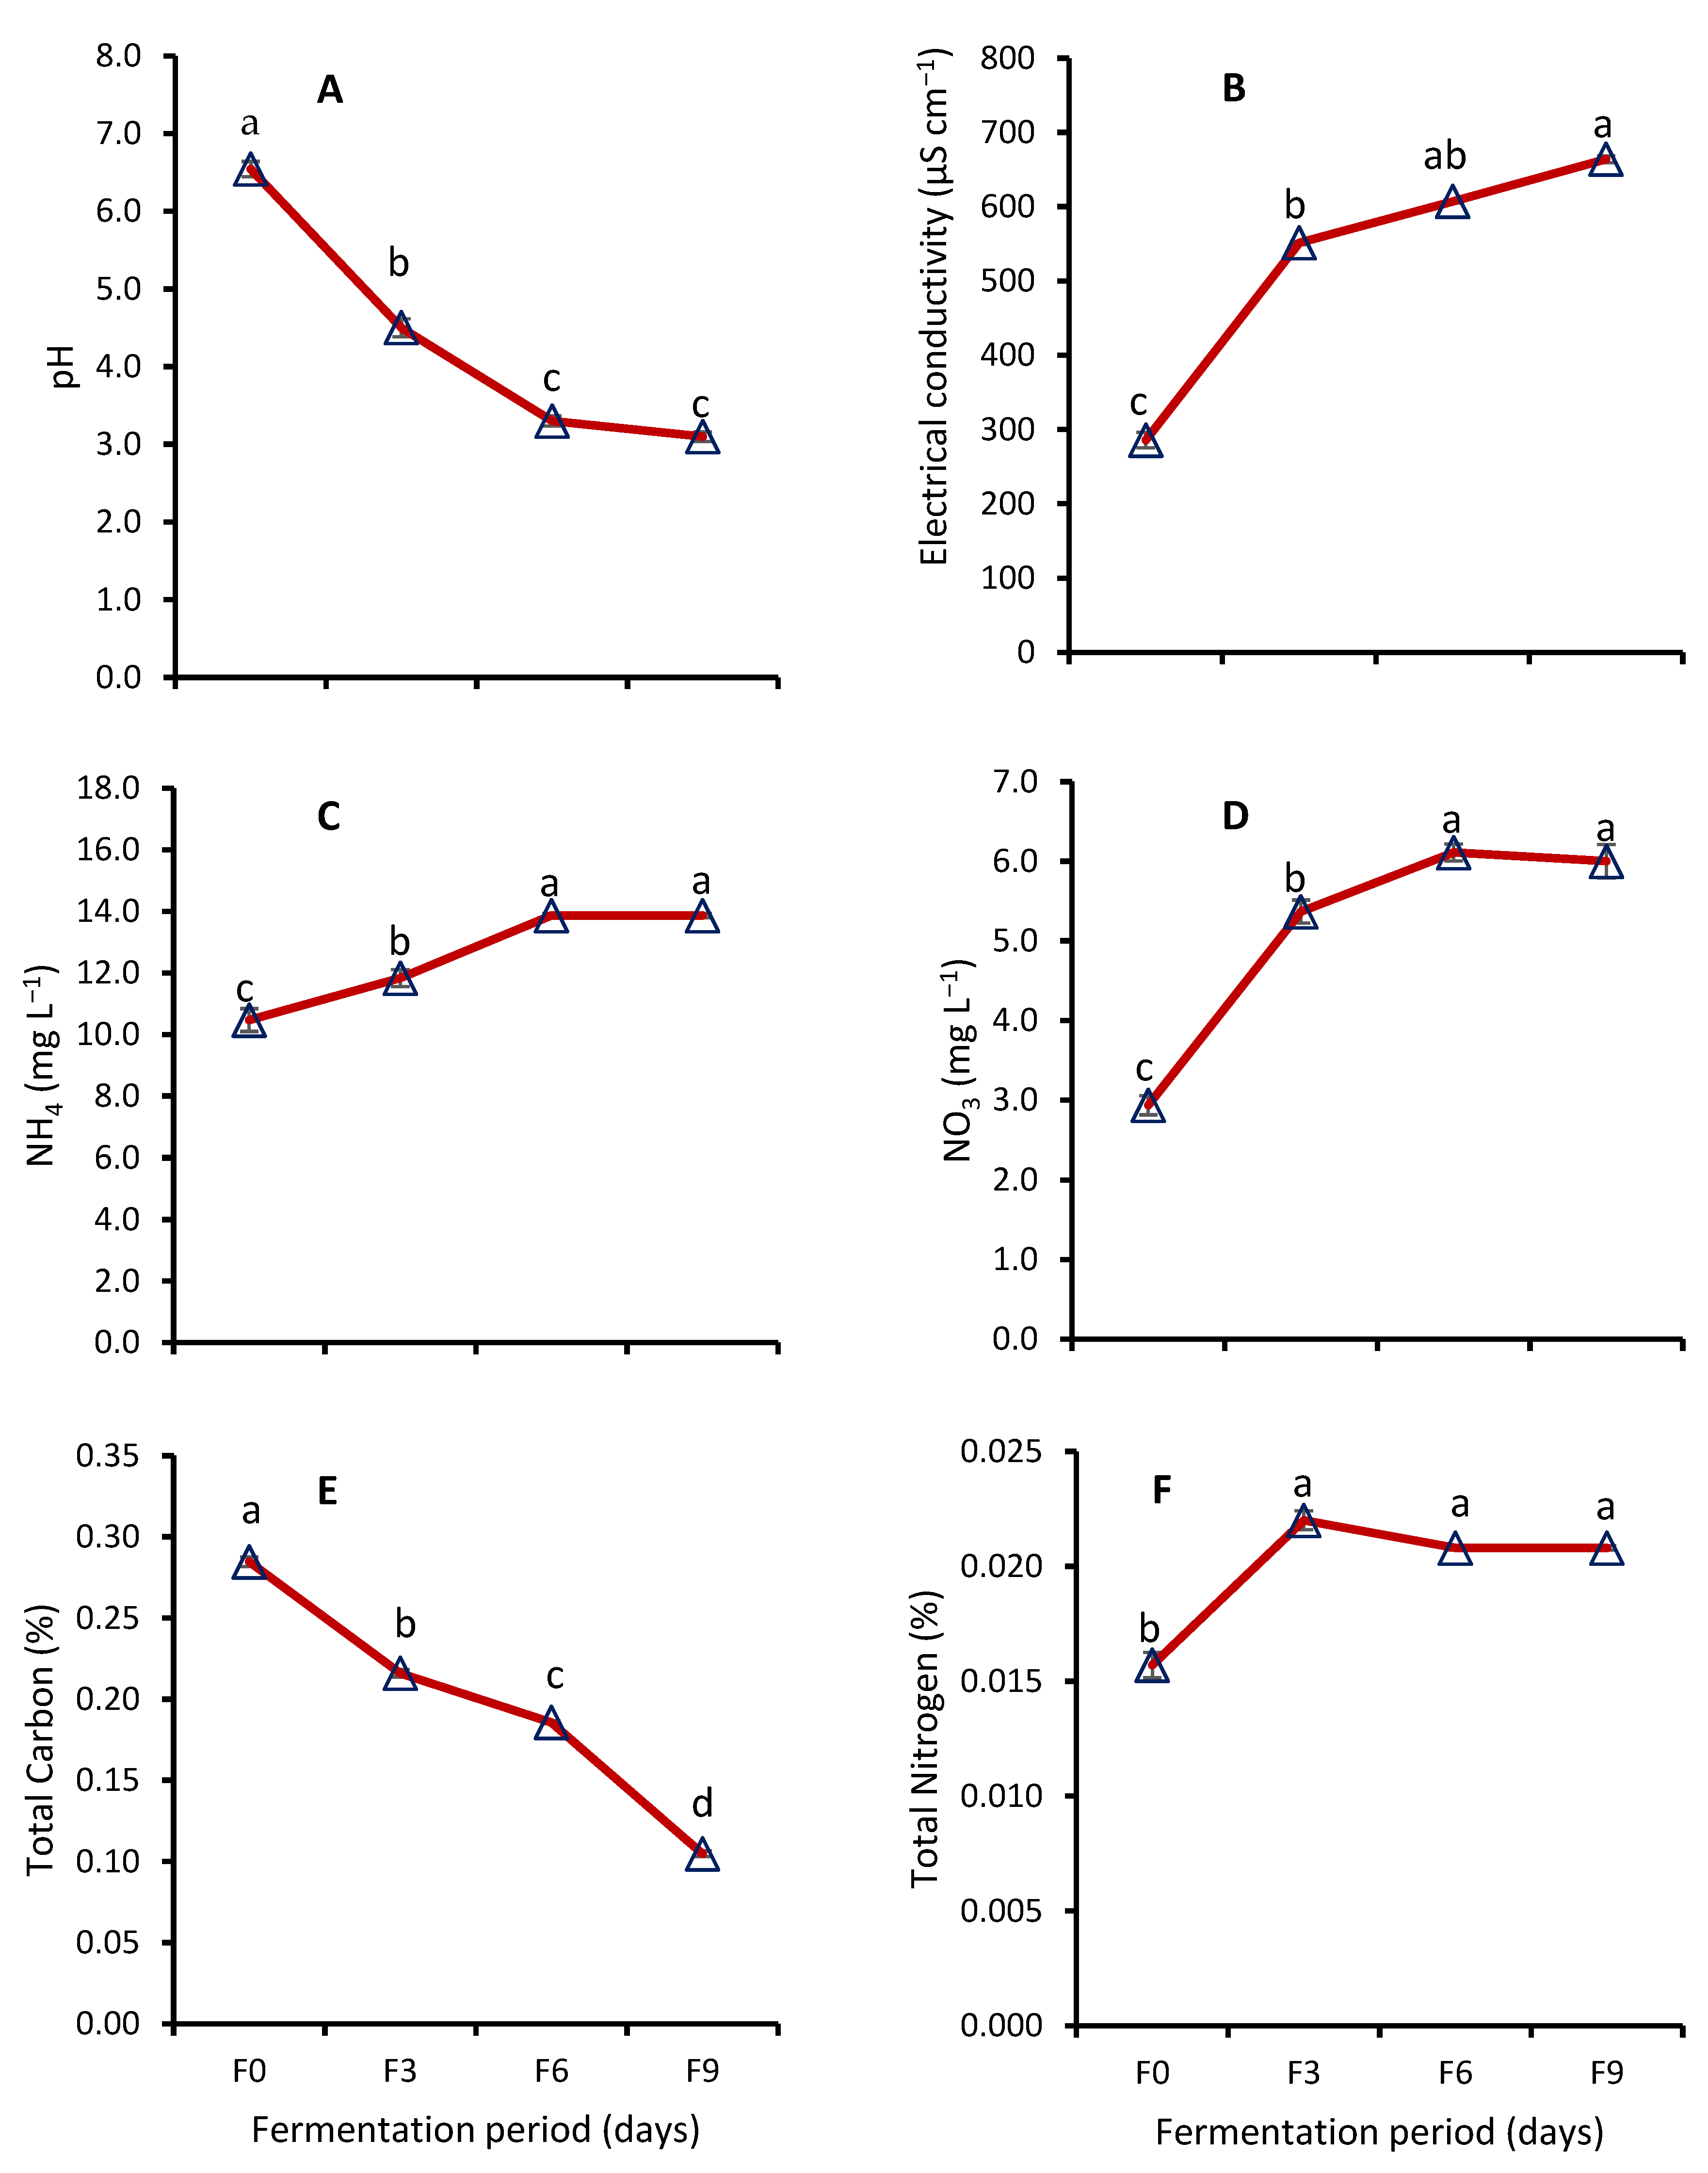
3.1.1. Effect of Fermentation on Bacterial Population and Biochemical Tests of WRW
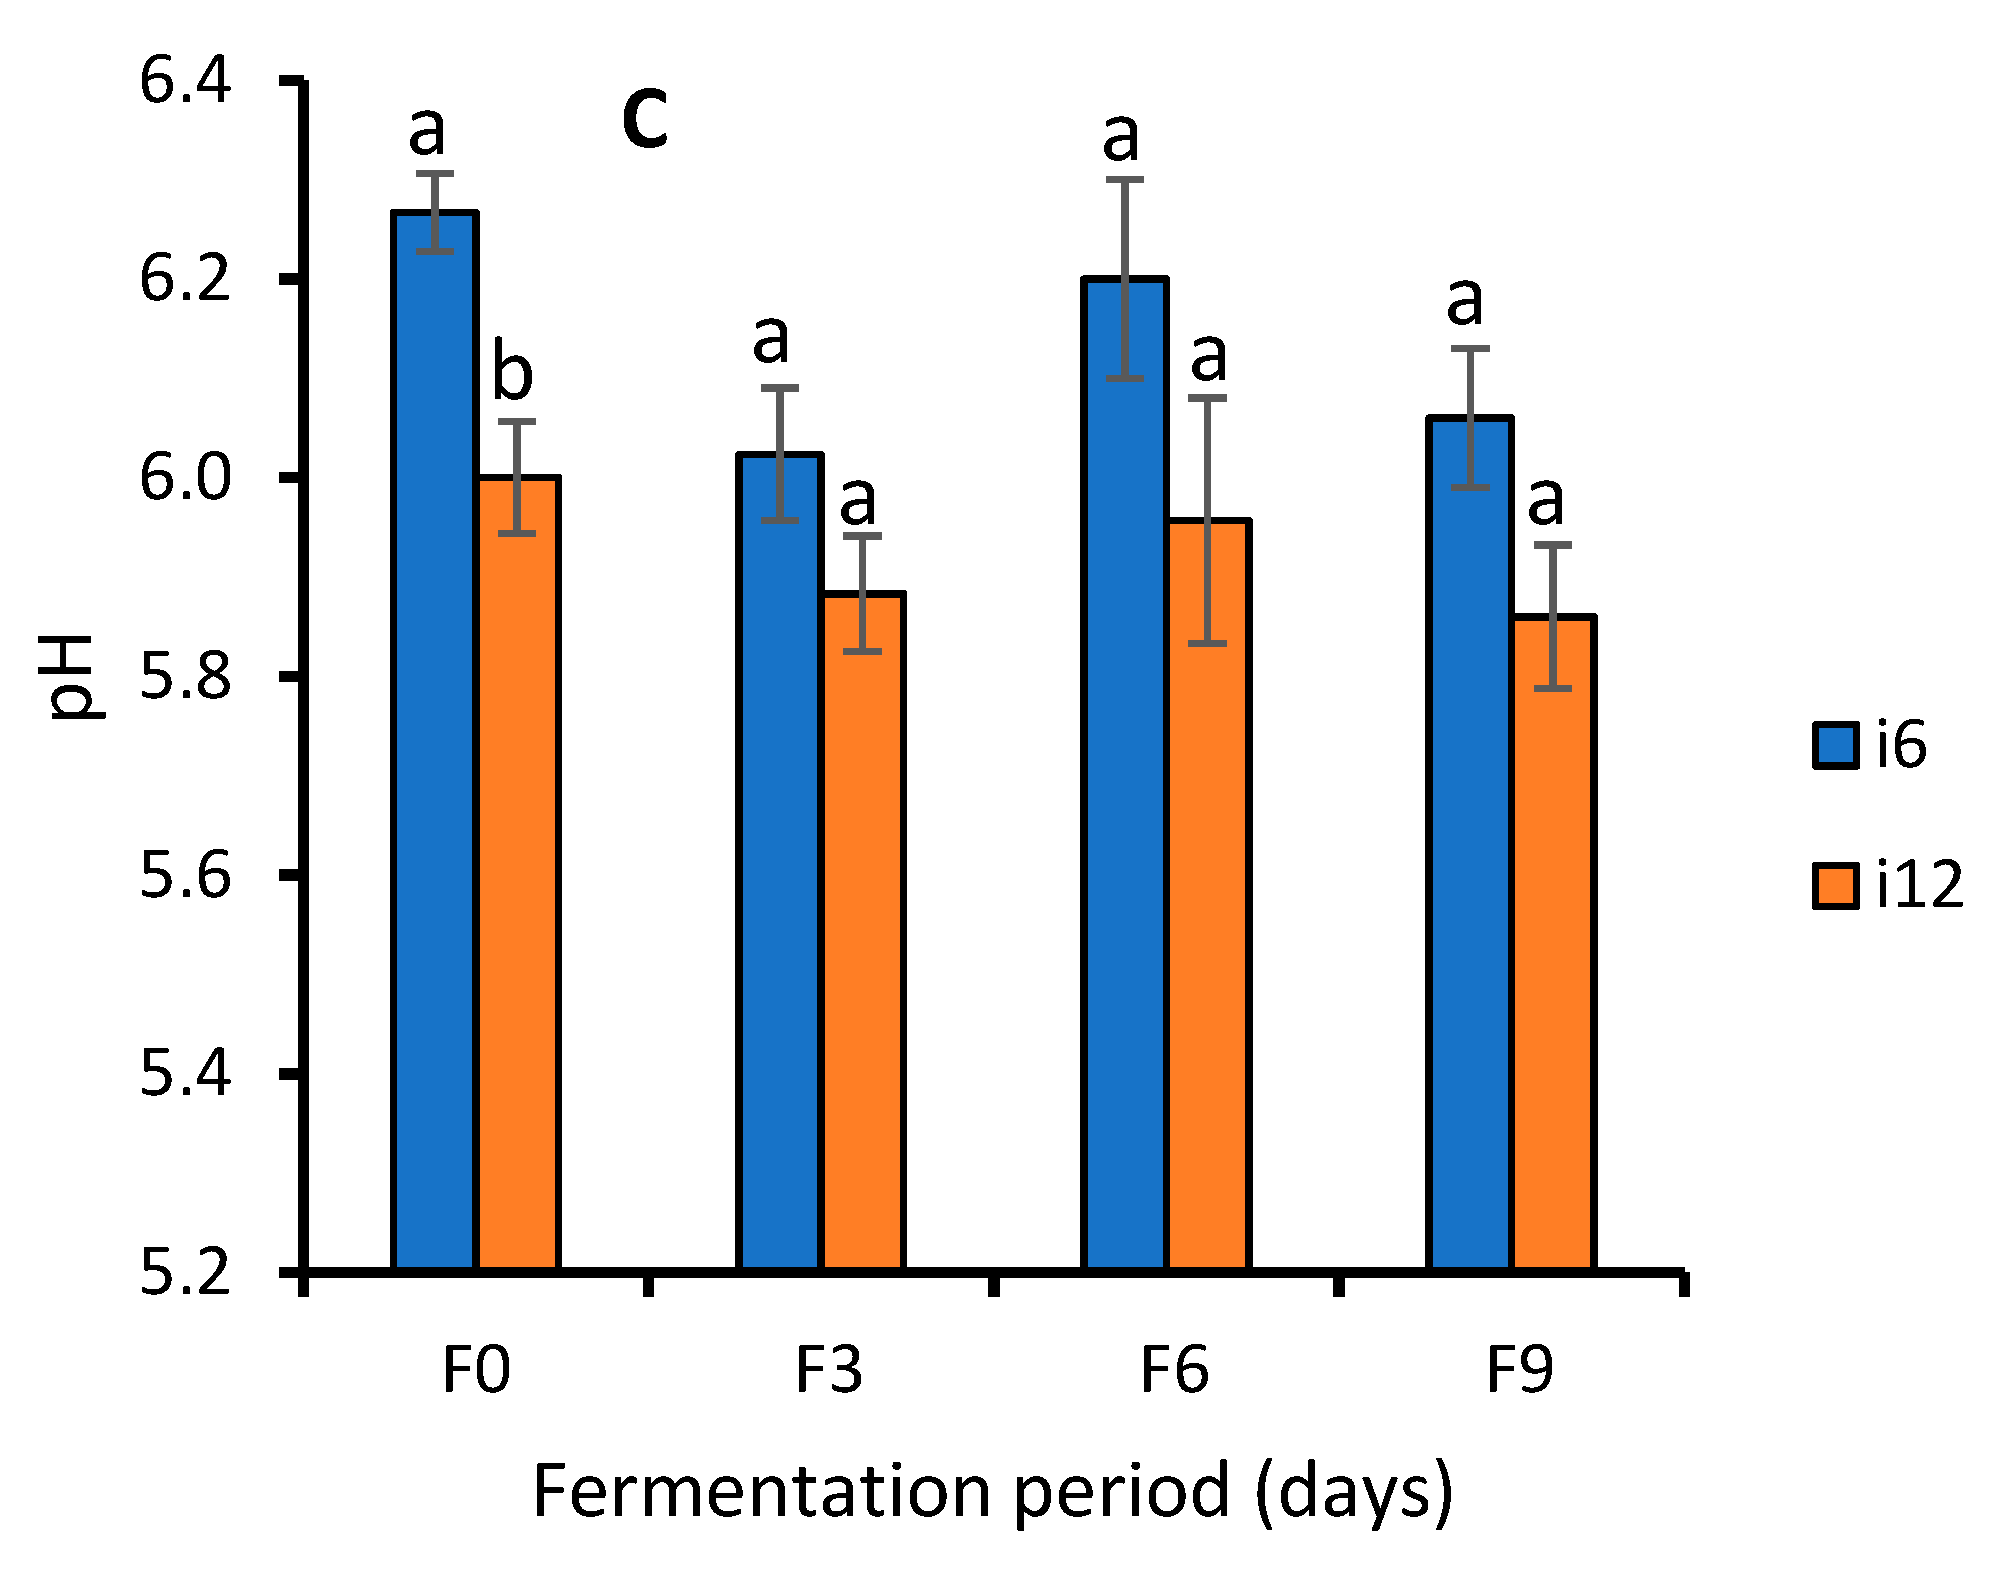
3.1.2. Biochemical Test of WRW Fermented at Different Periods
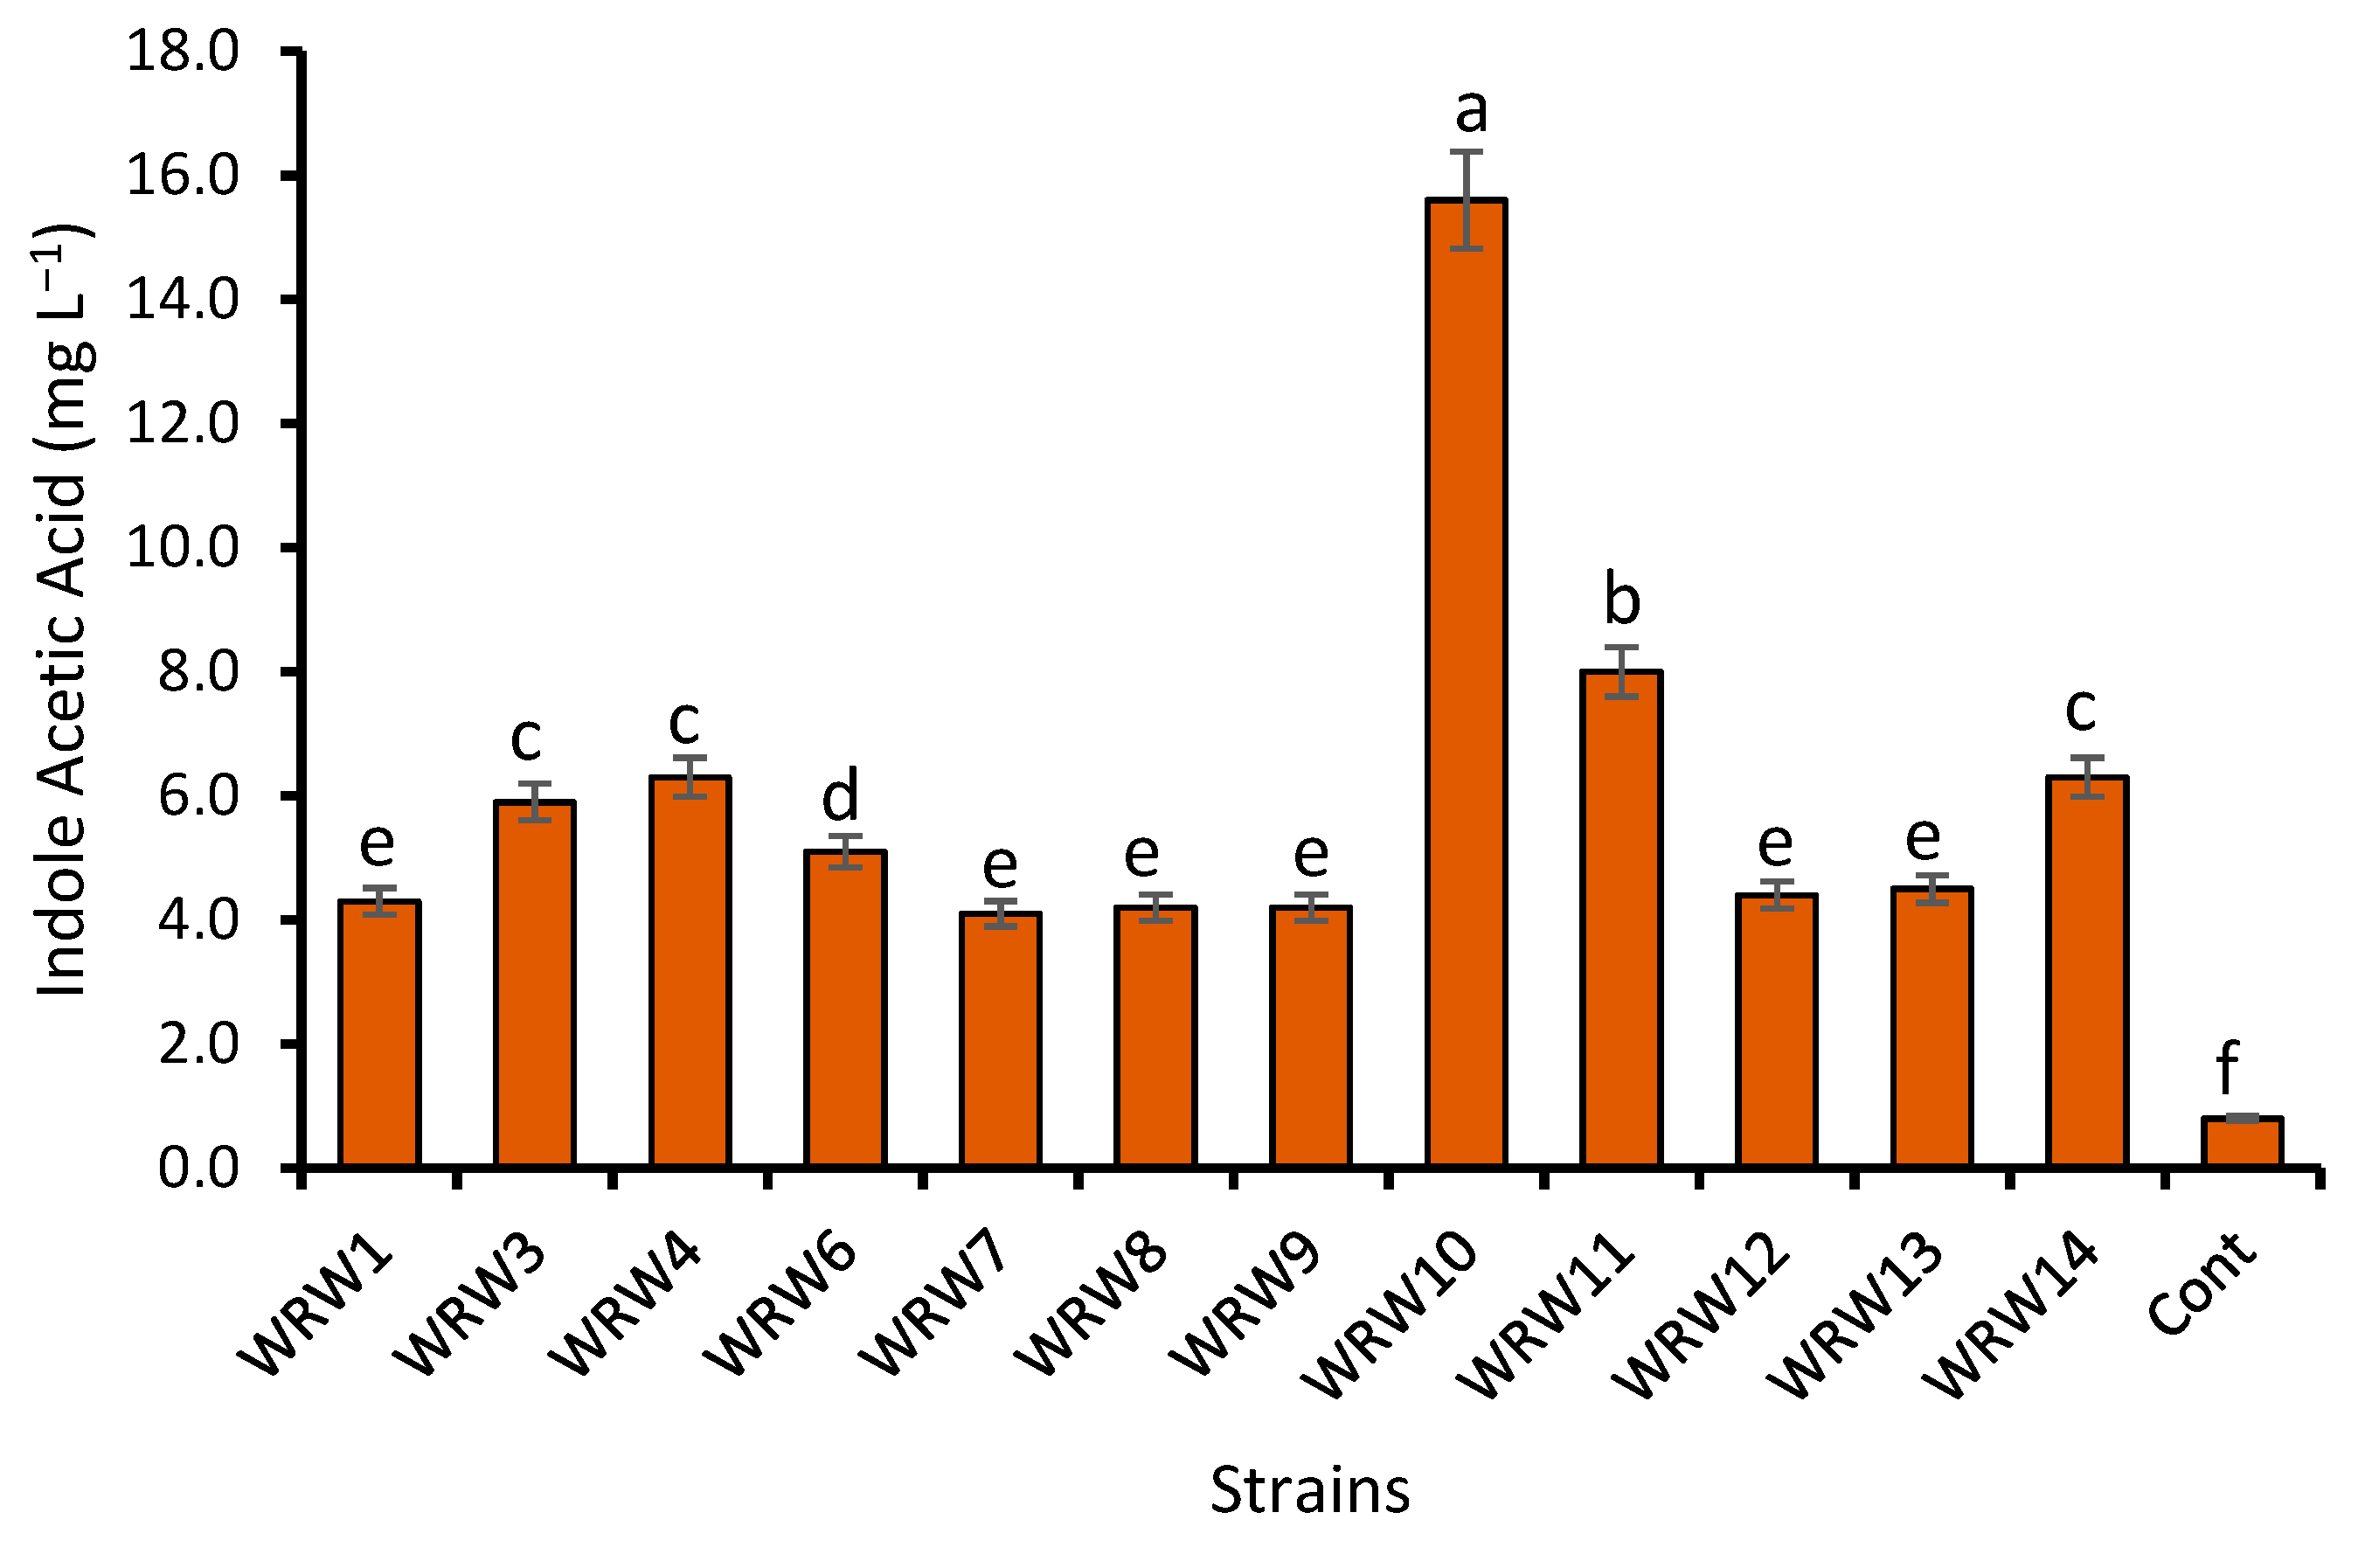
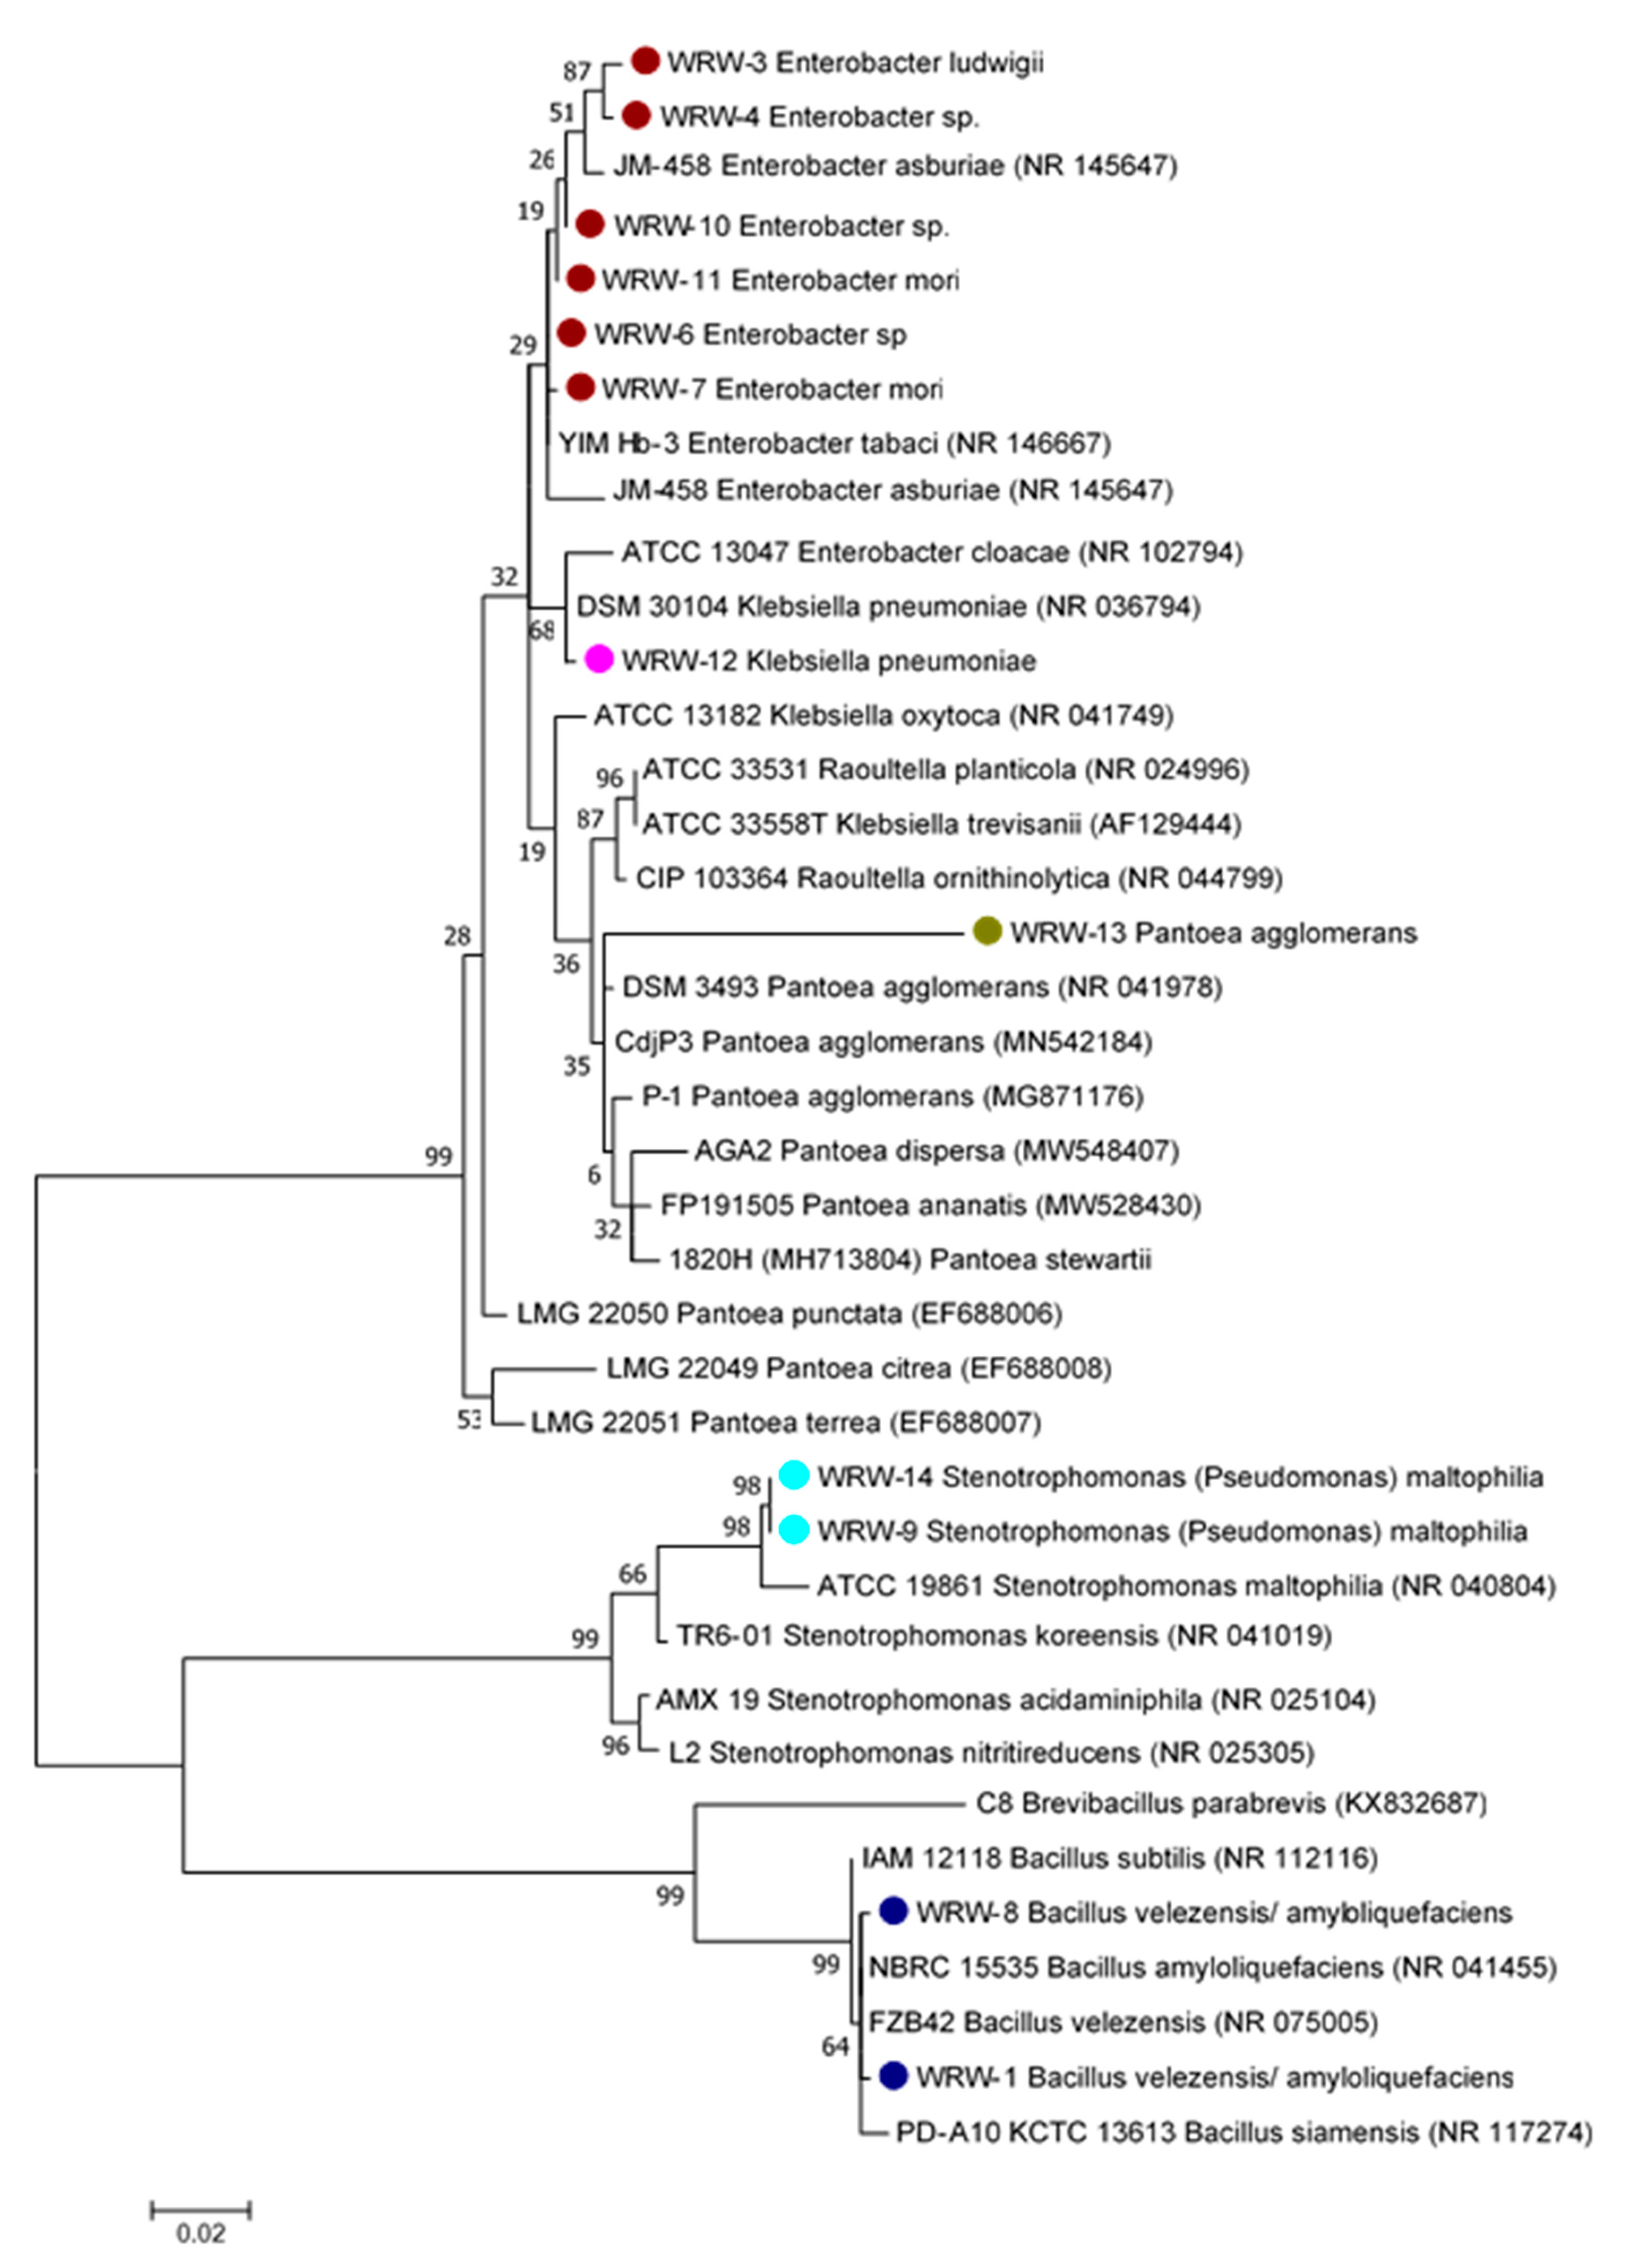
3.1.3. Phylogenetic Tree and Biochemical Test of the Isolated Microorganisms from WRW
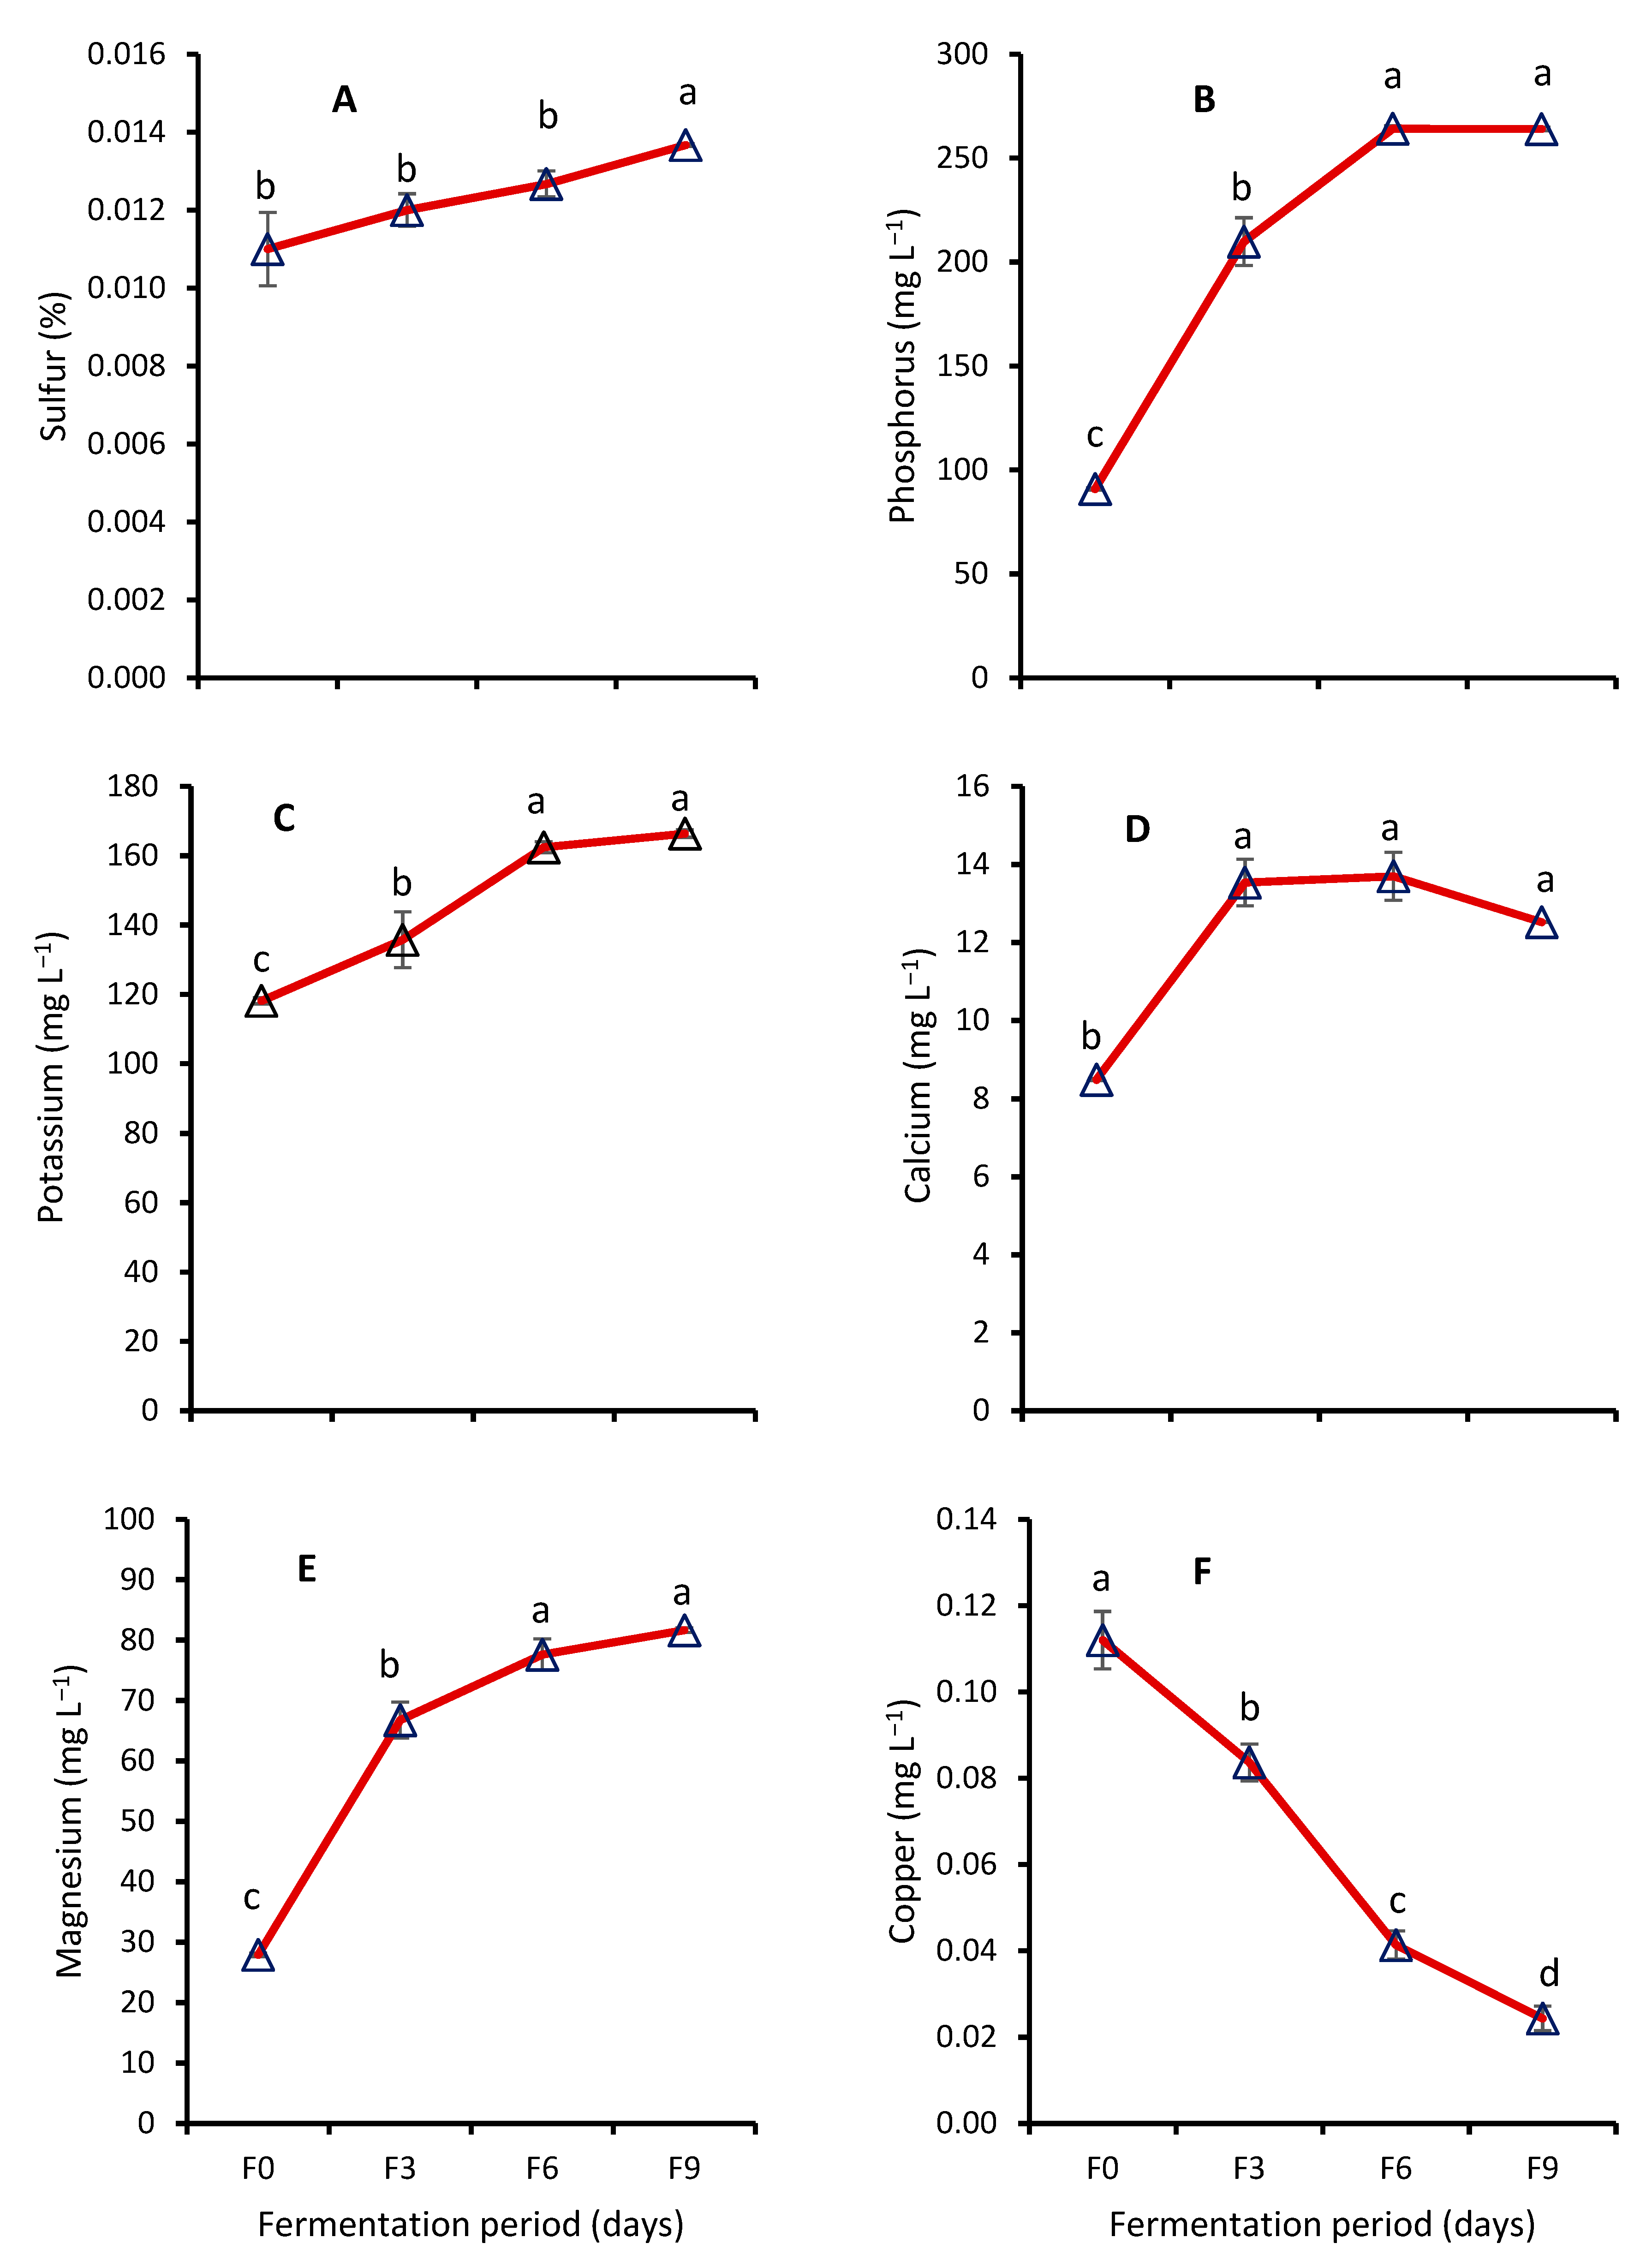
3.2. Nutrient Analyses
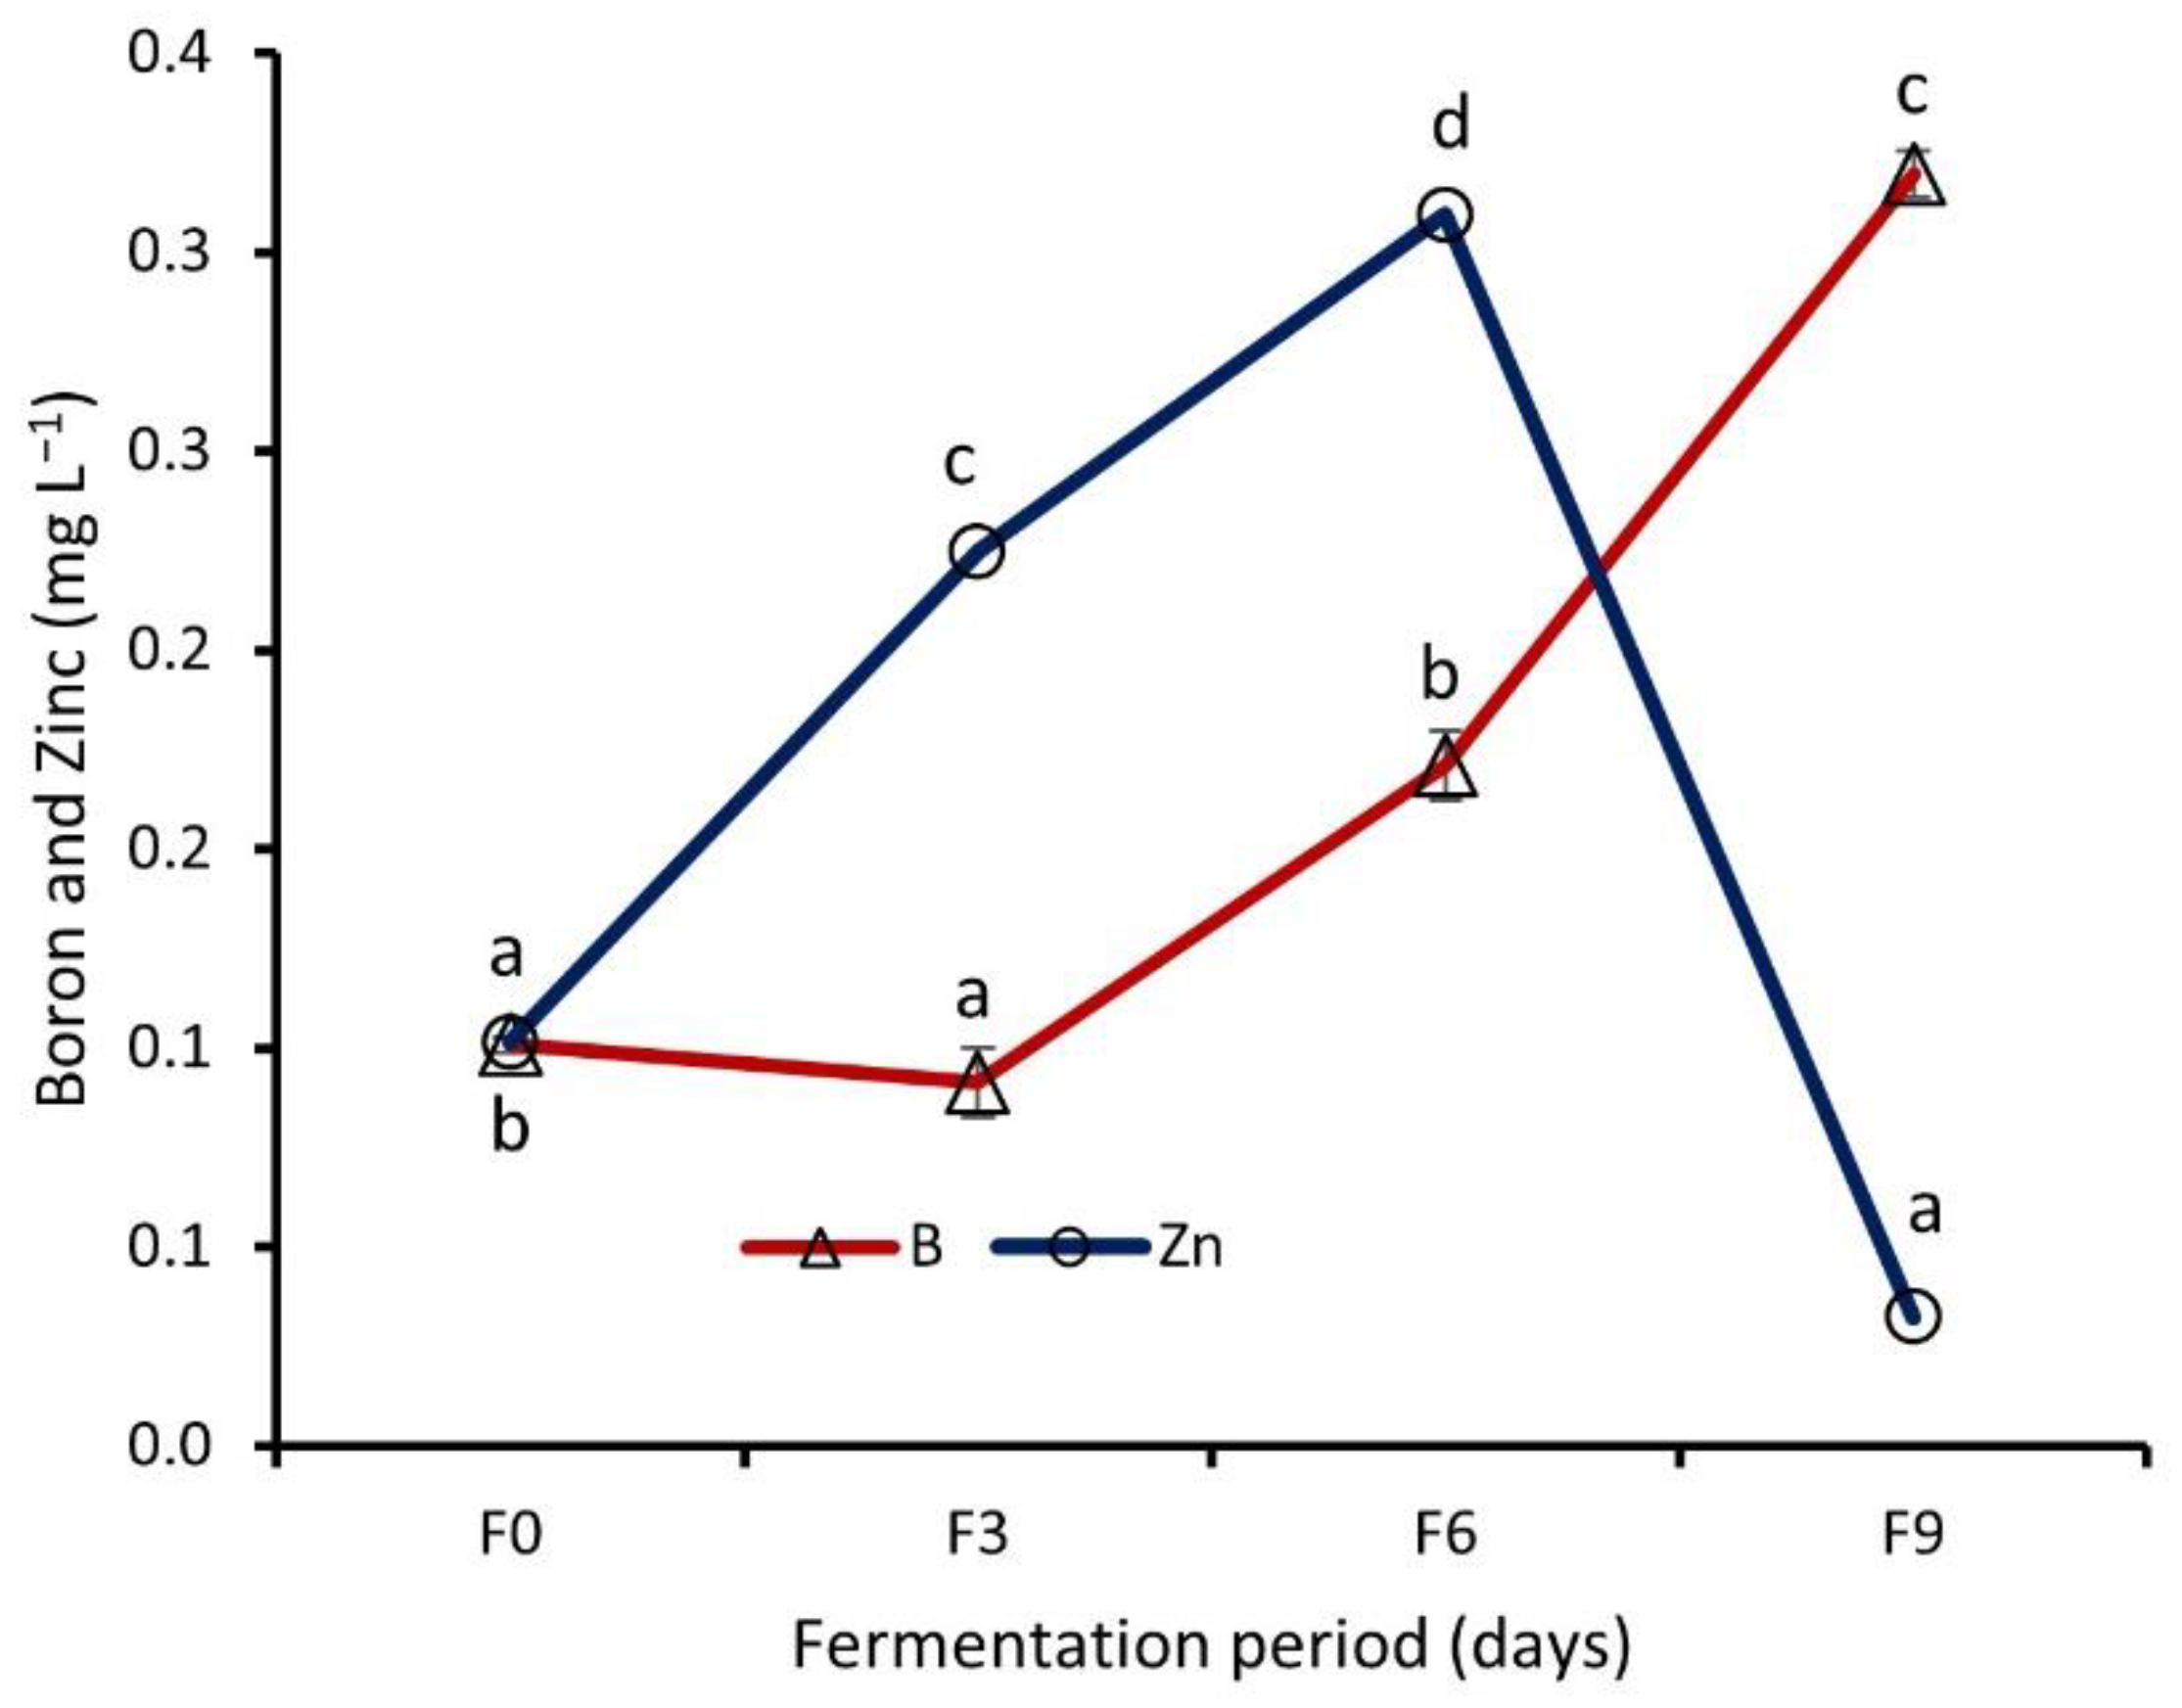
Effect of Fermentation on Nutrient Contents of WRW
4. Discussion
4.1. Effect of Fermentation on Bacterial Population and Biochemical Tests of WRW
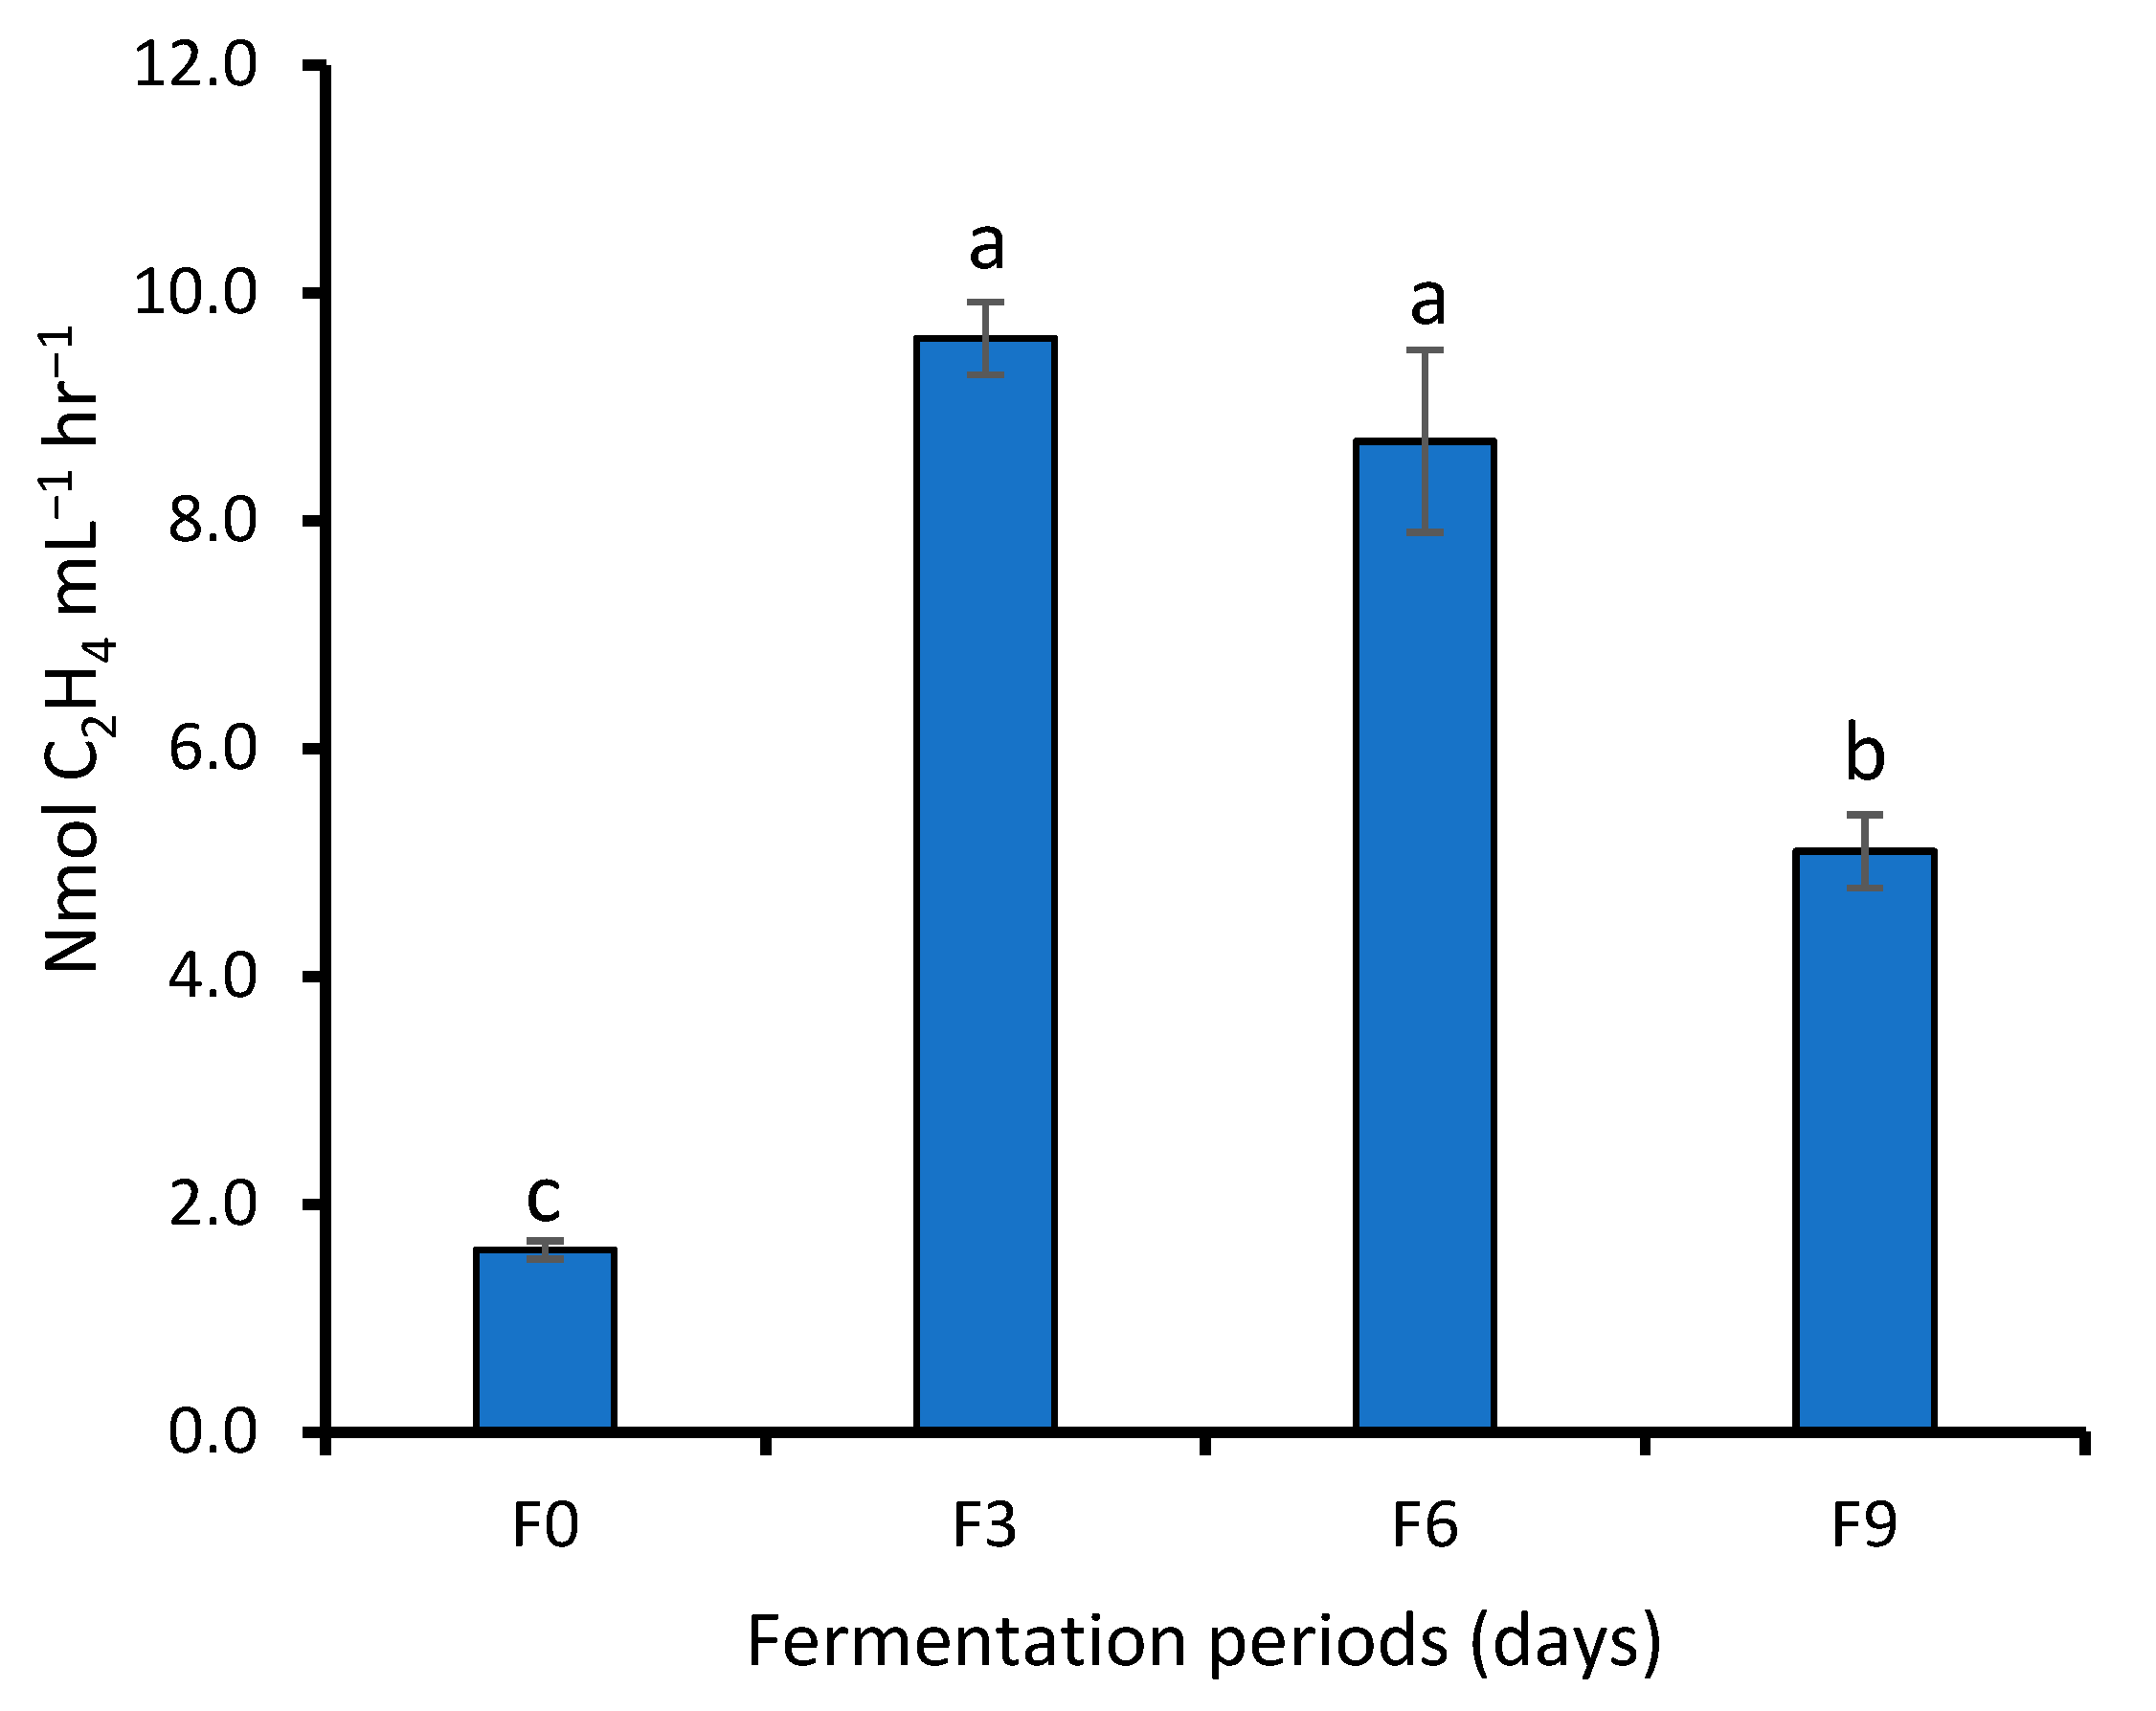
4.2. Effect of Fermentation on the Indole Acetic Acid Production
4.3. Phylogenetic Analysis of the Isolated Microbes
4.4. Effect of Fermentation on Nutrient Contents of WRW
5. Conclusions and Recommendations
Author Contributions
Funding
Institutional Review Board Statement
Informed Consent Statement
Data Availability Statement
Acknowledgments
Conflicts of Interest
References
- GRiSP. Global Rice Science Partnership Rice Almanac, 4th ed.; International Rice Research Institute, Los Baños: Philippines, CA, USA, 2013. [Google Scholar]
- Nabayi, A.; Teh, C.B.S.; Ngai, T.P.; Tan, A.K.Z. Wastewater from washed rice water as plant nutrient source: Current understanding and knowledge gaps. Pertanika J. Sci. Technol. 2021, 29, 1347–1369. [Google Scholar] [CrossRef]
- Juliano, B.O. Rice: Chemistry and Technology, 2nd ed.; American Association of Cereal Chemists: Eagan, MN, USA, 1985. [Google Scholar]
- OECD. Environmental Outlook to 2050: The Consequences of Inaction; OECD: Paris, France, 2012. [Google Scholar]
- WWAP. The United Nations World Water Development Report; UNESCO: Paris, France, 2017. [Google Scholar]
- Akib, M.A.; Setiawaty, H.; Haniarti, H.; Sulfiah, S. Improving the quality of “Leri” rice washing waste by different period of fermentation and yeast concentration as an alternative liquid organic fertilizer. Int. J. Agric. Syst. 2015, 2, 153–162. [Google Scholar]
- Nurhasanah, Y.S.; Nelly, N.; Reka, P.; Anik, N.; Muhammad, L.F. Potential Wastewater Washing Rice as a Propagation Media for Plant Probiotic Bacteria; Institute Pertanian Bogor: Bogor, Indonesia, 2010. [Google Scholar]
- Amalia, N.; Chitra, A.S. The effect of application of rice dishwater and manure as organic fertilizer to the growth of mustard (Brassica Juncea L.). Agrol. Agric. Sci. J. 2018, 5, 74–82. [Google Scholar]
- Sairi, F.; Ismail, N.; Ibrahim, N. The effect of FRAW towards the growth of chilli seedlings and its associated microorganisms. Malays. J. Microbiol. 2018, 14, 606–610. [Google Scholar]
- Enders, A.; Lehmann, J. Comparison of wet-digestion and dry-ashing methods for total elemental analysis of biochar. Commun. Soil Sci. Plant Anal. 2012, 43, 1042–1052. [Google Scholar] [CrossRef]
- Nelson, D.W.; Sommers, L. Total carbon, organic carbon, and organic matter. Methods Soil Anal. Part 2 Chem. Microbiol. Prop. 1983, 9, 539–579. [Google Scholar]
- McLean, E.O. Soil pH and lime requirement. Methods Soil Anal. Part 2 Chem. Microbiol. Prop. 1983, 9, 199–224. [Google Scholar]
- Tan, K.Z.; Radziah, O.; Halimi, M.S.; Khairuddin, A.R.; Habib, S.H.; Shamsuddin, Z.H. Isolation and characterization of rhizobia and plant growth-promoting rhizobacteria and their effects on growth of rice seedlings. Am. J. Agric. Biol. Sci. 2014, 9, 342–360. [Google Scholar] [CrossRef] [Green Version]
- Thomas, P.; Sekhar, A.C.; Upreti, R.; Mujawar, M.M.; Pasha, S.S. Optimization of single plate-serial dilution spotting (SP-SDS) with sample anchoring as an assured method for bacterial and yeast cfu enumeration and single colony isolation from diverse samples. Biotechnol. Rep. 2015, 8, 45–55. [Google Scholar] [CrossRef] [PubMed] [Green Version]
- Döbereiner, J.; Day, J.M. Associative symbioses in tropical grasses: Characterization of microorganisms and dinitrogen-fixing sites. In Proceedings of the 1st International Symposium on Nitrogen Fixation, Pullman, WA, USA, 27 January 1976; Volume 2, pp. 518–538. [Google Scholar]
- Hardy, R.W.F.; Holsten, R.D.; Jackson, E.K.; Burns, R.C. The acetylene-ethylene assay for N2 fixation: Laboratory and field evaluation. Plant Physiol. 1968, 43, 1185–1207. [Google Scholar] [CrossRef] [PubMed] [Green Version]
- Somasegaran, P.; Hoben, H.J. Methods in Legume-Bradyrhizobium Japonicum Technology; Hawaii Institute of Tropical Agriculture and Hunan Resources College of Tropical Agriculture and Human Resource, University of Hawaii: Manoa, HI, USA, 1985. [Google Scholar]
- Pikovskaya, R.I. Mobilization of phosphorus in soil in connection with vital activity of some microbial species. Mikrobiologiya 1948, 17, 362–370. [Google Scholar]
- Sitepu, I.R.; Hashidoko, Y.; Santoso, E.; Tahara, S. Potent phosphate-solubilizing bacteria isolated from dipterocarps grown in peat swamp forest in Central Kalimantan and their possible utilization for biorehabilitation of degraded peatland. In Proceedings of the International Symposium and Workshop on Tropical Peatland, Yogyakarta, Indonesia, 27–29 August 2007; pp. 27–29. [Google Scholar]
- Kumar, K.V.; Srivastava, S.; Singh, N.; Behl, H.M. Role of metal resistant plant growth promoting bacteria in ameliorating fly ash to the growth of Brassica juncea. J. Hazard. Mater. 2009, 170, 51–57. [Google Scholar] [CrossRef]
- Ribeiro, C.M.; Cardoso, E.J.B.N. Isolation, selection and characterization of root-associated growth promoting bacteria in Brazil Pine (Araucaria angustifolia). Microbiol. Res. 2012, 167, 69–78. [Google Scholar] [CrossRef]
- Barton, C.J. Photometric analysis of phosphate rock. Anal. Chem. 1948, 20, 1068–1073. [Google Scholar] [CrossRef]
- Hu, X.; Chen, J.; Guo, J. Two phosphate-and potassium-solubilizing bacteria isolated from Tianmu Mountain, Zhejiang, China. World J. Microbiol. Biotechnol. 2006, 22, 983–990. [Google Scholar] [CrossRef]
- Gordon, S.A.; Weber, R.P. Colorimetric estimation of indole-3-acetic acid. Plant Physiol. 1951, 26, 192–195. [Google Scholar] [CrossRef] [Green Version]
- Ehmann, A. The van URK-Salkowski reagent—A sensitive and specific chromogenic reagent for silica gel thin-layer chromatographic detection and identification of indole derivatives. J. Chromatogr. A 1977, 132, 267–276. [Google Scholar] [CrossRef]
- Khalifa, A.Y.Z.; Alsyeeh, A.M.; Almalki, M.A.; Saleh, F.A. Characterization of the plant growth promoting bacterium, Enterobacter cloacae MSR1, isolated from roots of non-nodulating Medicago sativa. Saudi J. Biol. Sci. 2016, 23, 79–86. [Google Scholar] [CrossRef]
- Chen, Y.S.; Yanagida, F.; Shinohara, I. Isolation and identification of lactic acid bacteria from soil using an enrichment procedure. Lett. Appl. Microbiol. 2005, 40, 195–200. [Google Scholar] [CrossRef] [PubMed]
- Nabayi, A.; Teh, C.B.S.; Tan, A.K.Z.; Tan, N.P.; Nurul, I.M.A. Chemical and microbial characterization of washed rice water waste to assess its potential as plant fertilizer and for increasing soil health. Agronomy 2021, 11, 2391. [Google Scholar] [CrossRef]
- He, Q.; Feng, C.; Chen, N.; Zhang, D.; Hou, T.; Dai, J.; Hao, C.; Mao, B. Characterizations of dissolved organic matter and bacterial community structures in rice washing drainage (RWD)-based synthetic groundwater denitrification. Chemosphere 2019, 215, 142–152. [Google Scholar] [CrossRef] [PubMed]
- Rousk, J.; Brookes, P.C.; Bååth, E. Contrasting soil pH effects on fungal and bacterial growth suggest functional redundancy in carbon mineralization. Appl. Environ. Microbiol. 2009, 75, 1589–1596. [Google Scholar] [CrossRef] [Green Version]
- Taylor, J.R.N.; Hugo, L.F.; Yetnerberk, S. Developments in Sorghum Bread Making; Woodhead Publishing Limited: Shaxton, UK, 2005. [Google Scholar]
- Nkhata, S.G.; Ayua, E.; Kamau, E.H.; Shingiro, J.B. Fermentation and germination improve nutritional value of cereals and legumes through activation of endogenous enzymes. Food Sci. Nutr. 2018, 6, 2446–2458. [Google Scholar] [CrossRef] [PubMed] [Green Version]
- Panhwar, Q.A.; Zadziah, O.; Zaharah, A.R.; Sariah, M.; Mohd, R.I. Isolation and characterization of phosphate-solubilizing bacteria from aerobic rice. Afr. J. Biotechnol. 2012, 11, 2711–2719. [Google Scholar] [CrossRef]
- Dastager, S.G.; Deepa, C.K.; Puneet, S.C.; Nautiyal, C.S.; Pandey, A. Isolation and characterization of plant growth-promoting strain Pantoea NII-186. from Western Ghat Forest soil, India. Lett. Appl. Microbiol. 2009, 49, 20–25. [Google Scholar] [CrossRef]
- Rodríguez, H.; Fraga, R. Phosphate solubilizing bacteria and their role in plant growth promotion. Biotechnol. Adv. 1999, 17, 319–339. [Google Scholar] [CrossRef]
- Pérez, E.; Sulbarán, M.; Ball, M.M.; Yarzábal, L.A. Isolation and characterization of mineral phosphate-solubilizing bacteria naturally colonizing a limonitic crust in the south-eastern Venezuelan region. Soil Biol. Biochem. 2007, 39, 2905–2914. [Google Scholar] [CrossRef] [Green Version]
- Bhattacharyya, P.N.; Jha, D.K. Plant growth-promoting rhizobacteria (PGPR): Emergence in agriculture. World J. Microbiol. Biotechnol. 2012, 28, 1327–1350. [Google Scholar] [CrossRef] [PubMed]
- Deepa, C.K.; Dastager, S.G.; Pandey, A. Isolation and characterization of plant growth promoting bacteria from non-rhizospheric soil and their effect on cowpea (Vigna unguiculata (L.) Walp.) seedling growth. World J. Microbiol. Biotechnol. 2010, 26, 1233–1240. [Google Scholar] [CrossRef]
- Sugumaran, P.; Janarthanum, B. Solubilization of potassium containing minerals by bacteria and their effect of plant growth. World J. Agric. Sci. 2007, 3, 350–355. [Google Scholar]
- Boubekri, K.; Soumare, A.; Mardad, I.; Lyamlouli, K.; Hafidi, M.; Ouhdouch, Y.; Kouisni, L. The Screening of potassium-and phosphate-solubilizing actinobacteria and the assessment of their ability to promote wheat growth parameters. Microorganisms 2021, 9, 470. [Google Scholar] [CrossRef] [PubMed]
- Boddey, R.M.; De Moraes Sá, J.C.; Alves, B.J.R.; Urquiaga, S. The contribution of biological nitrogen fixation for sustainable agricultural systems in the tropics. Soil Biol. Biochem. 1997, 29, 787–799. [Google Scholar] [CrossRef]
- Katupitiya, S.; Millet, J.; Vesk, M.; Viccars, L.; Zeman, A.; Lidong, Z.; Elmerich, C.; Kennedy, I.R. A mutant of Azospirillum brasilense Sp7 impaired in flocculation with a modified colonization pattern and superior nitrogen fixation in association with wheat. Appl. Environ. Microbiol. 1995, 61, 1987–1995. [Google Scholar] [CrossRef] [Green Version]
- Naher, U.A.; Radziah, O.; Shamsuddin, Z.H.; Halimi, M.S.; Mohd Razi, I. Isolation of diazotrophs from different soils of Tanjong Karang rice growing area in Malaysia. Int. J. Agric. Biol. 2009, 11, 547–552. [Google Scholar]
- Ahmad, F.; Ahmad, I.; Khan, M.S. Screening of free-living rhizospheric bacteria for their multiple plant growth promoting activities. Microbiol. Res. 2008, 163, 173–181. [Google Scholar] [CrossRef]
- Ng, L.C.; Sariah, M.; Sariam, O.; Radziah, O.; Abidin, M.A.Z. Rice seed bacterization for promoting germination and seedling growth under aerobic cultivation system. Aust. J. Crop Sci. 2012, 6, 170–175. [Google Scholar]
- Chi, Q.; Tang, W.; Liu, L.; Meng, J.; Dong, X.; Chen, W.; Li, X. Isolation and properties of Enterobacter sp. LX3 capable of producing indoleacetic acid. Appl. Sci. 2018, 8, 2108. [Google Scholar] [CrossRef] [Green Version]
- Rabbee, M.F.; Sarafat Ali, M.; Choi, J.; Hwang, B.S.; Jeong, S.C.; Baek, K. Hyun Bacillus velezensis: A valuable member of bioactive molecules within plant microbiomes. Molecules 2019, 24, 1046. [Google Scholar] [CrossRef] [PubMed] [Green Version]
- Dunlap, C.A.; Kim, S.J.; Kwon, S.W.; Rooney, A.P. Bacillus velezensis is not a later heterotypic synonym of Bacillus amyloliquefaciens; Bacillus methylotrophicus, Bacillus amyloliquefaciens subsp. Plantarum and ‘Bacillus oryzicola’ are later heterotypic synonyms of Bacillus velezensis based on phylogenom. Int. J. Syst. Evol. Microbiol. 2016, 66, 1212–1217. [Google Scholar] [CrossRef]
- Fan, B.; Blom, J.; Klenk, H.P.; Borriss, R. Bacillus amyloliquefaciens, Bacillus velezensis, and Bacillus siamensis Form an “Operational Group B. amyloliquefaciens” within the B. subtilis species complex. Front. Microbiol. 2017, 8, 22. [Google Scholar] [CrossRef] [Green Version]
- Kloepper, J.W.; Ryu, C.M.; Zhang, S. Induced systemic resistance and promotion of plant growth by Bacillus spp. Phytopathology 2004, 94, 1259–1266. [Google Scholar] [CrossRef] [Green Version]
- Lucy, M.; Reed, E.; Glick, B.R. Applications of free living plant growth-promoting rhizobacteria. Antonie Leeuwenhoek Int. J. Gen. Mol. Microbiol. 2004, 86, 1–25. [Google Scholar] [CrossRef] [PubMed]
- Lugtenberg, B.; Kamilova, F. Plant-growth-promoting rhizobacteria. Annu. Rev. Microbiol. 2009, 63, 541–556. [Google Scholar] [CrossRef] [Green Version]
- Pranoto, Y.; Anggrahini, S.; Efendi, Z. Effect of natural and Lactobacillus plantarum fermentation on in-vitro protein and starch digestibilities of sorghum flour. Food Biosci. 2013, 2, 46–52. [Google Scholar] [CrossRef]
- Sripriya, G.; Antony, U.; Chandra, T.S. Changes in carbohydrate, free amino acids, organic acids, phytate and HCl extractability of minerals during germination and fermentation of finger millet (Eleusine coracana). Food Chem. 1997, 58, 345–350. [Google Scholar] [CrossRef]
- Blandino, A.; Al-Aseeri, M.E.; Pandiella, S.S.; Cantero, D.; Webb, C. Cereal-based fermented foods and beverages. Food Res. Int. 2003, 36, 527–543. [Google Scholar] [CrossRef]


| Fermentation Periods (Days) | N fix | PS | KS | Catalase | PSI | KSI | IAA (μg mL−1) |
|---|---|---|---|---|---|---|---|
| F0 | − | − | − | − | 0 | 0 | 1.2 |
| F3 | ++ | ++ | + | ++ | 4.2 | 3.4 | 8.3 |
| F6 | ++ | ++ | + | ++ | 2.3 | 1.9 | 7.2 |
| F9 | + | + | + | ++ | 2.4 | 2.0 | 5.8 |
| Isolates | Fermentation Period | Accession Number | Closest Identity in NCBI | Similarity (%) | N Fixation | PS | KS | Catalase | PSI | KSI | Gram Stain |
|---|---|---|---|---|---|---|---|---|---|---|---|
| WRW-1 | F3 | MW365554.1 | Bacillus velezensis strain HSB1 | 99.35 | − | + | + | ++ | 1.3 | 1.2 | Positive |
| WRW-3 | F3 | MW365555.1 | Enterobacter ludwigii strain SDI-19 | 98.75 | ++ | + | − | ++ | 1.4 | 0 | Negative |
| WRW-4 | F3 | MW365556.1 | Enterobacter sp. Strain LSB19 | 99.10 | ++ | + | − | ++ | 1.2 | 0 | Negative |
| WRW-6 | F0 | MW365557.1 | Enterobacter sp. Strain LSB3 | 97.59 | + | + | − | + | 1.2 | 0 | Negative |
| WRW-7 | F6 | MW365558.1 | Enterobacter mori strain BC1 | 98.51 | − | ++ | − | − | 1.2 | 0 | Positive |
| WRW-8 | F6 | MW365559.1 | Bacillus velezensis strain 2656 | 99.70 | − | + | + | +++ | 1.4 | 1.3 | Positive |
| WRW-9 | F6 | MW365560.1 | Stenotrophomonas maltophilia strain JM11 | 99.87 | ++ | + | ++ | + | 1.5 | 1.3 | Negative |
| WRW-10 | F9 | MW365561.1 | Enterobacter sp. Strain LSB10 | 99.49 | + | + | − | + | 1.6 | 0 | Negative |
| WRW-11 | F9 | MW365562.1 | Enterobacter mori strain BC1 | 99.19 | − | + | − | ++ | 1.16 | 0 | Negative |
| WRW-12 | F3 | MW365563.1 | Klebsiella pneumoniae strain LB-AMP3KSU | 99.87 | ++ | ++ | ++ | +++ | 1.8 | 2.3 | Negative |
| WRW-13 | F3 | MW365564.1 | Pantoea agglomerans stain SVMR | 97.92 | ++ | ++ | ++ | ++ | 1.6 | 1.2 | Negative |
| WRW-14 | F9 | MW365565.1 | Stenotrophomonas maltophilia strain F41 | 99.47 | + | + | + | + | 1.3 | 1.1 | Negative |
| Elements | Rice Grains | Freshly Prepared WRW | % Elements Leached from Rice Grains (%) |
|---|---|---|---|
| Ash (%) | 0.95 ± 0.036 | – | – |
| Moisture (%) | 14.39 ± 0.057 | 99.32 ± 0.310 | – |
| TC (%) | 40.30 ± 0.008 | 3.87 ± 0.371 | 9.6 |
| TN (%) | 1.25 ± 0.012 | 0.02 ± 0.001 | 1.6 |
| S (%) | 0.10 ± 0.003 | 0.01 ± 0.001 | 10.0 |
| P (mg kg−1) | 1320.83 ± 34.044 | 90.94 ± 4.761 | 6.9 |
| K (mg kg−1) | 1130.83 ± 22.639 | 118.16 ± 2.55 | 10.4 |
| Ca (mg kg−1) | 427.08 ± 5.717 | 18.17 ± 1.891 | 4.3 |
| Mg (mg kg−1) | 244.93 ± 10.257 | 27.91 ± 1.754 | 11.4 |
| (mg kg−1) | 215.45 ± 4.410 | 18.52 ± 1.281 | 8.6 |
| (mg kg−1) | 100.82 ± 8.530 | 4.92 ± 1.112 | 4.8 |
| Cu (mg kg−1) | 5.25 ± 0.236 | 0.18 ± 0.001 | 3.4 |
| Zn (mg kg−1) | 5.02 ± 0.044 | 0.10 ± 0.002 | 2.0 |
| B (mg kg−1) | 1.40 ± 0.152 | 0.12 ± 0.002 | 8.6 |
Publisher’s Note: MDPI stays neutral with regard to jurisdictional claims in published maps and institutional affiliations. |
© 2021 by the authors. Licensee MDPI, Basel, Switzerland. This article is an open access article distributed under the terms and conditions of the Creative Commons Attribution (CC BY) license (https://creativecommons.org/licenses/by/4.0/).
Share and Cite
Nabayi, A.; Sung, C.T.B.; Zuan, A.T.K.; Paing, T.N. Fermentation of Washed Rice Water Increases Beneficial Plant Bacterial Population and Nutrient Concentrations. Sustainability 2021, 13, 13437. https://doi.org/10.3390/su132313437
Nabayi A, Sung CTB, Zuan ATK, Paing TN. Fermentation of Washed Rice Water Increases Beneficial Plant Bacterial Population and Nutrient Concentrations. Sustainability. 2021; 13(23):13437. https://doi.org/10.3390/su132313437
Chicago/Turabian StyleNabayi, Abba, Christopher Teh Boon Sung, Ali Tan Kee Zuan, and Tan Ngai Paing. 2021. "Fermentation of Washed Rice Water Increases Beneficial Plant Bacterial Population and Nutrient Concentrations" Sustainability 13, no. 23: 13437. https://doi.org/10.3390/su132313437
APA StyleNabayi, A., Sung, C. T. B., Zuan, A. T. K., & Paing, T. N. (2021). Fermentation of Washed Rice Water Increases Beneficial Plant Bacterial Population and Nutrient Concentrations. Sustainability, 13(23), 13437. https://doi.org/10.3390/su132313437