
Impact of Cropland Reclamation on Ecological Security in the Yangtze River Economic Belt, China

Abstract
:1. Introduction
2. Methodology
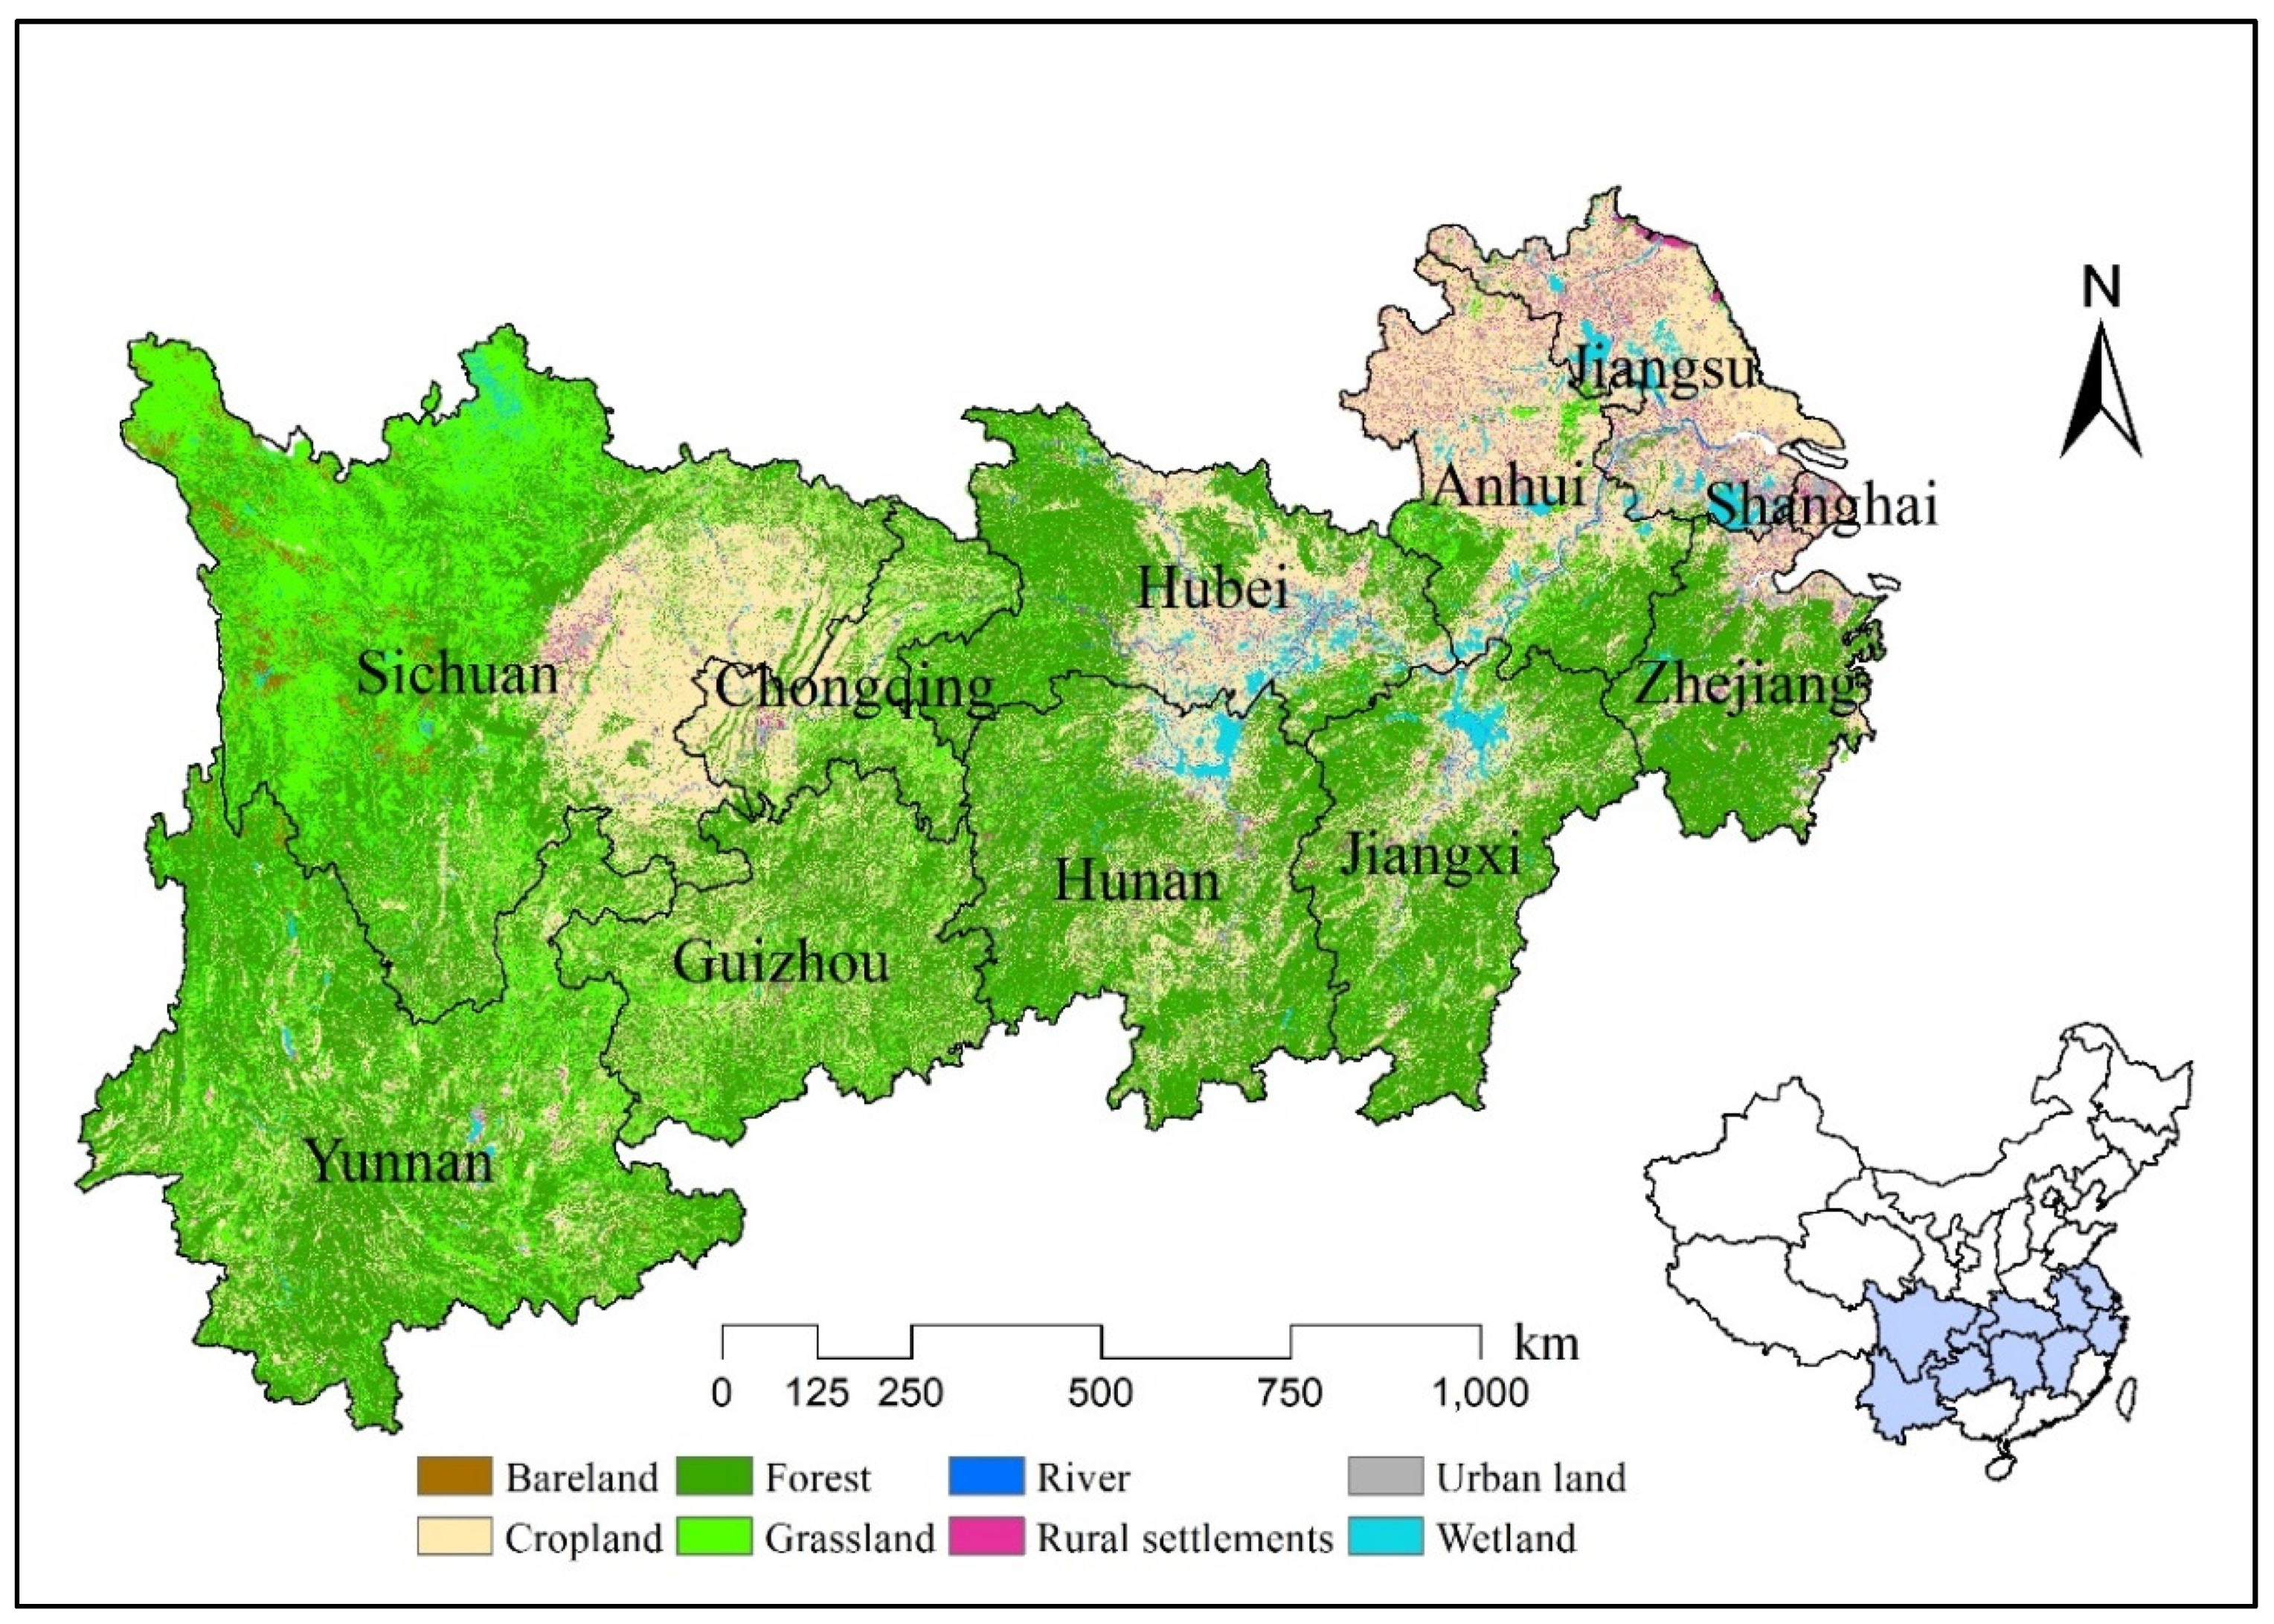
2.1. Study Area
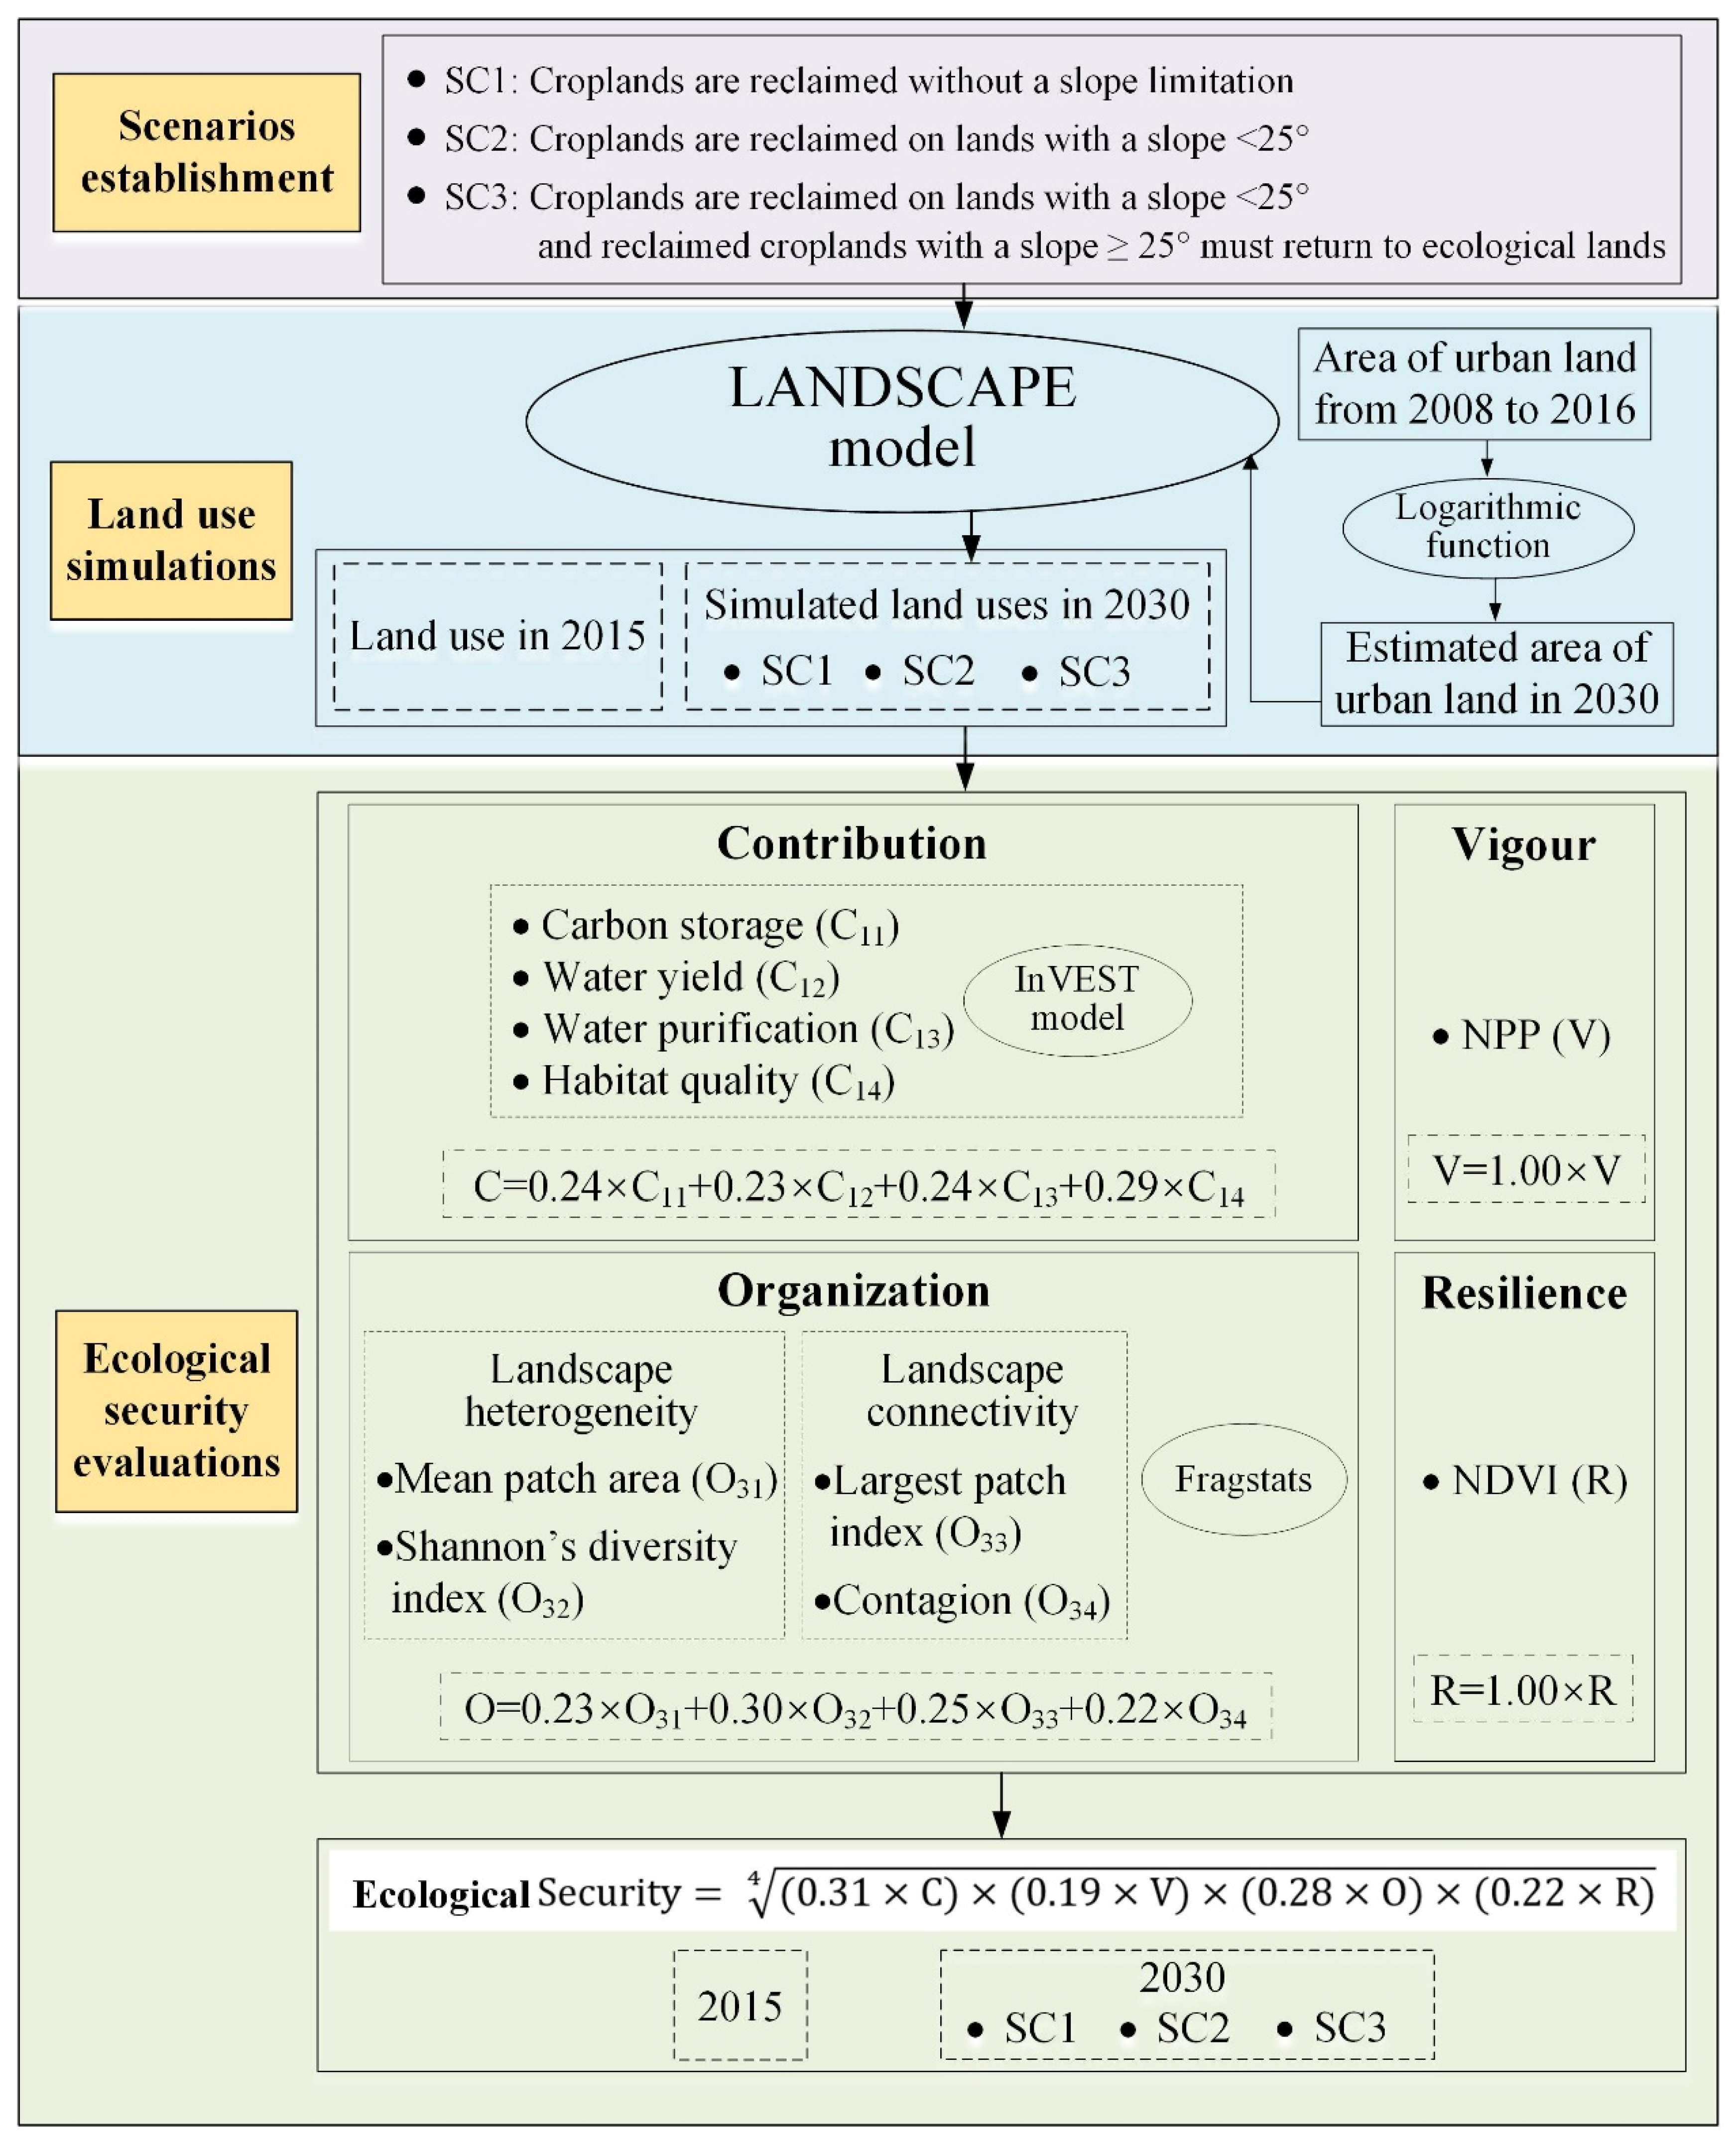
2.2. Research Framework
2.3. The Land Use Simulation Model LANDSCAPE
2.4. Data Sources
3. Results
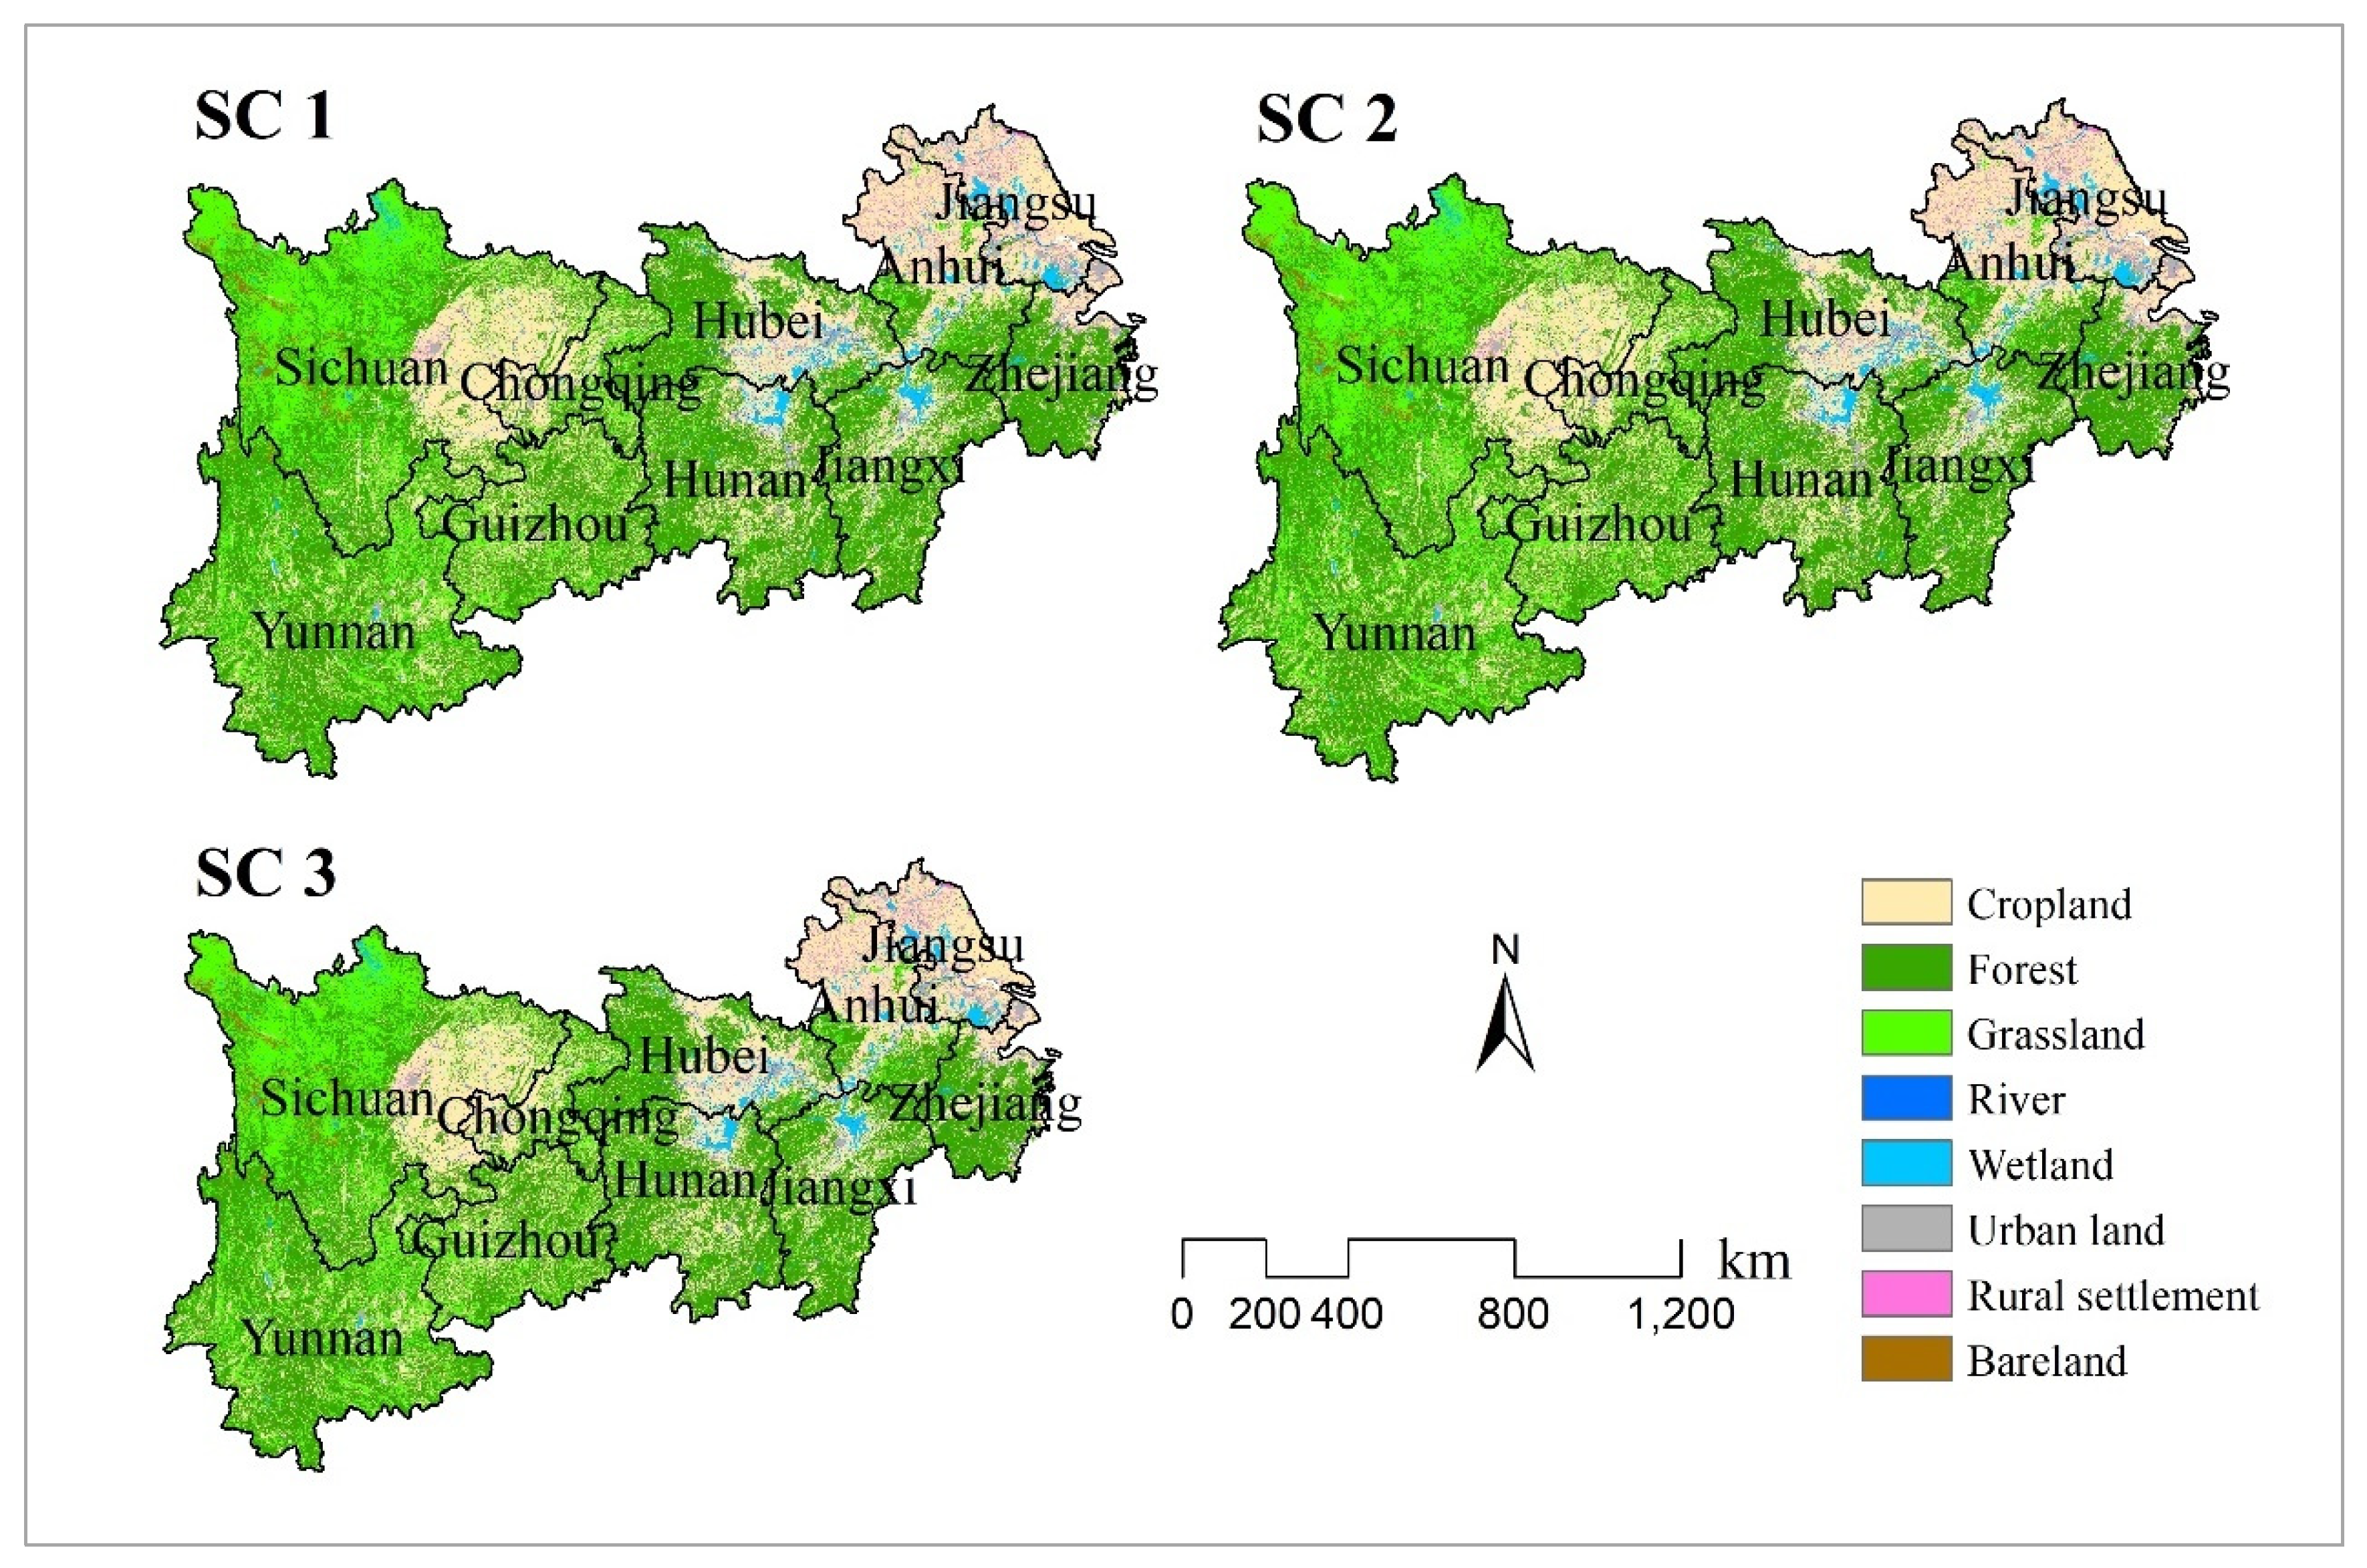
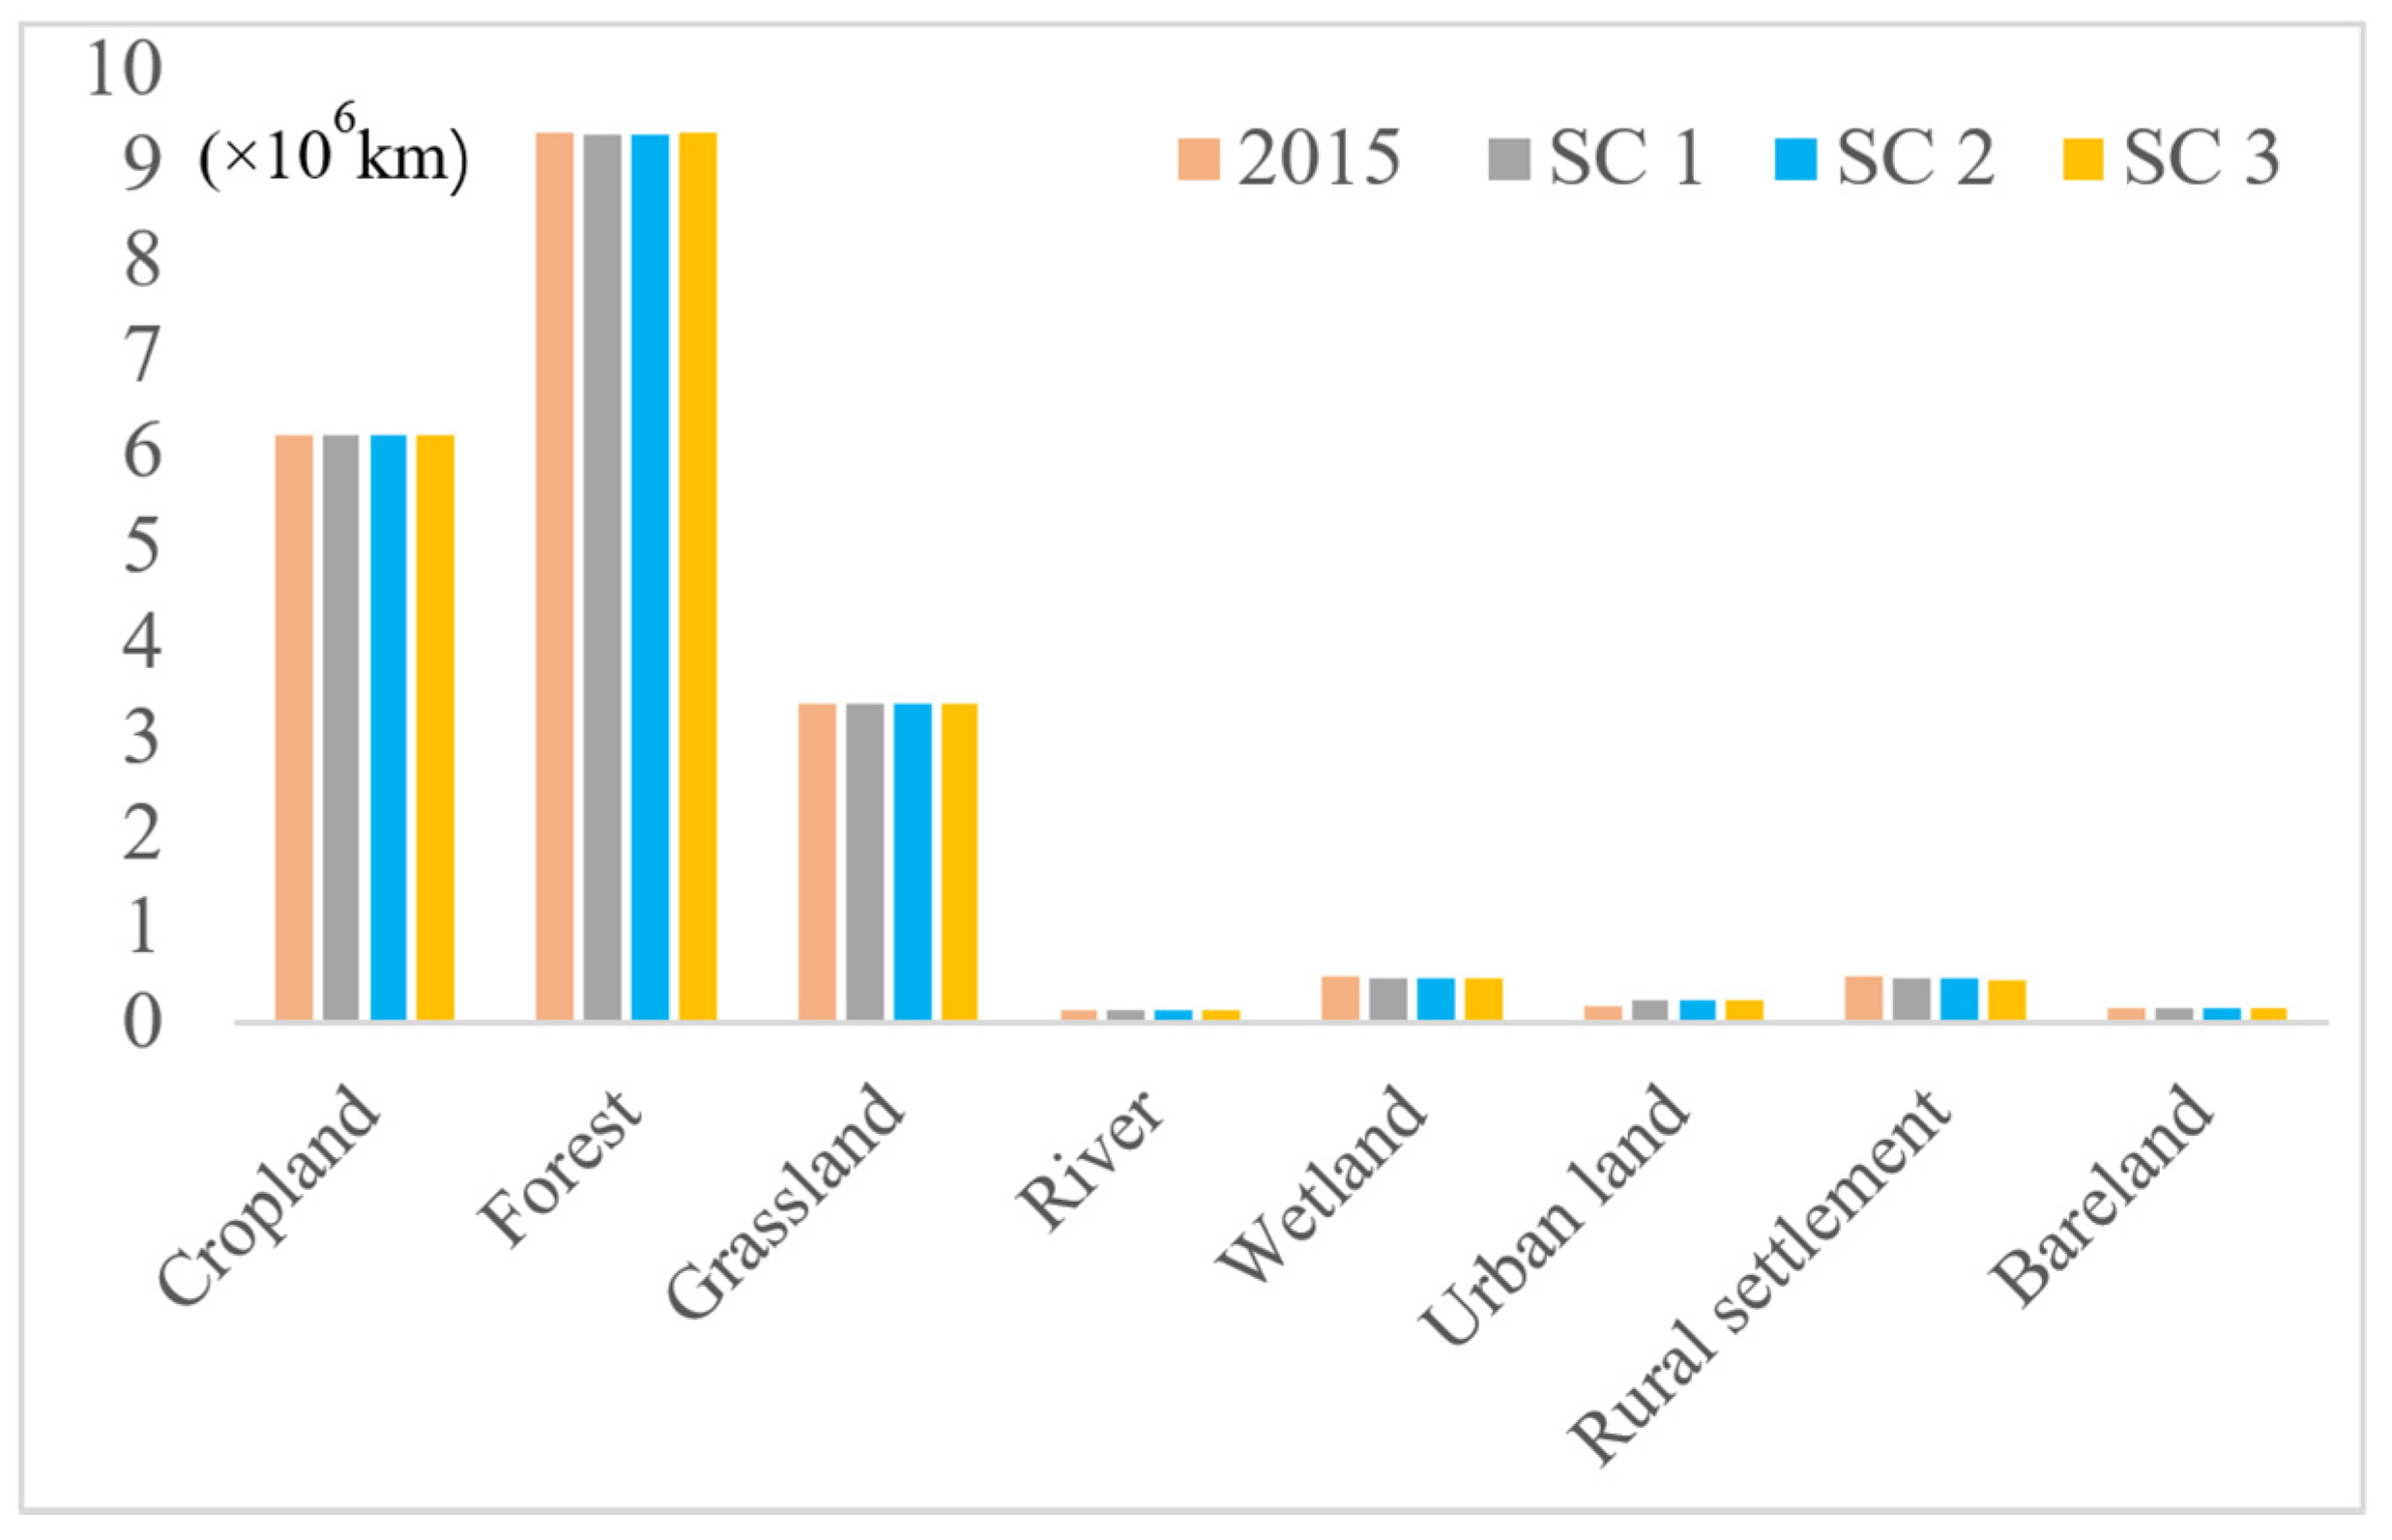
3.1. Land Use Simulations with the LANDSCAPE Model
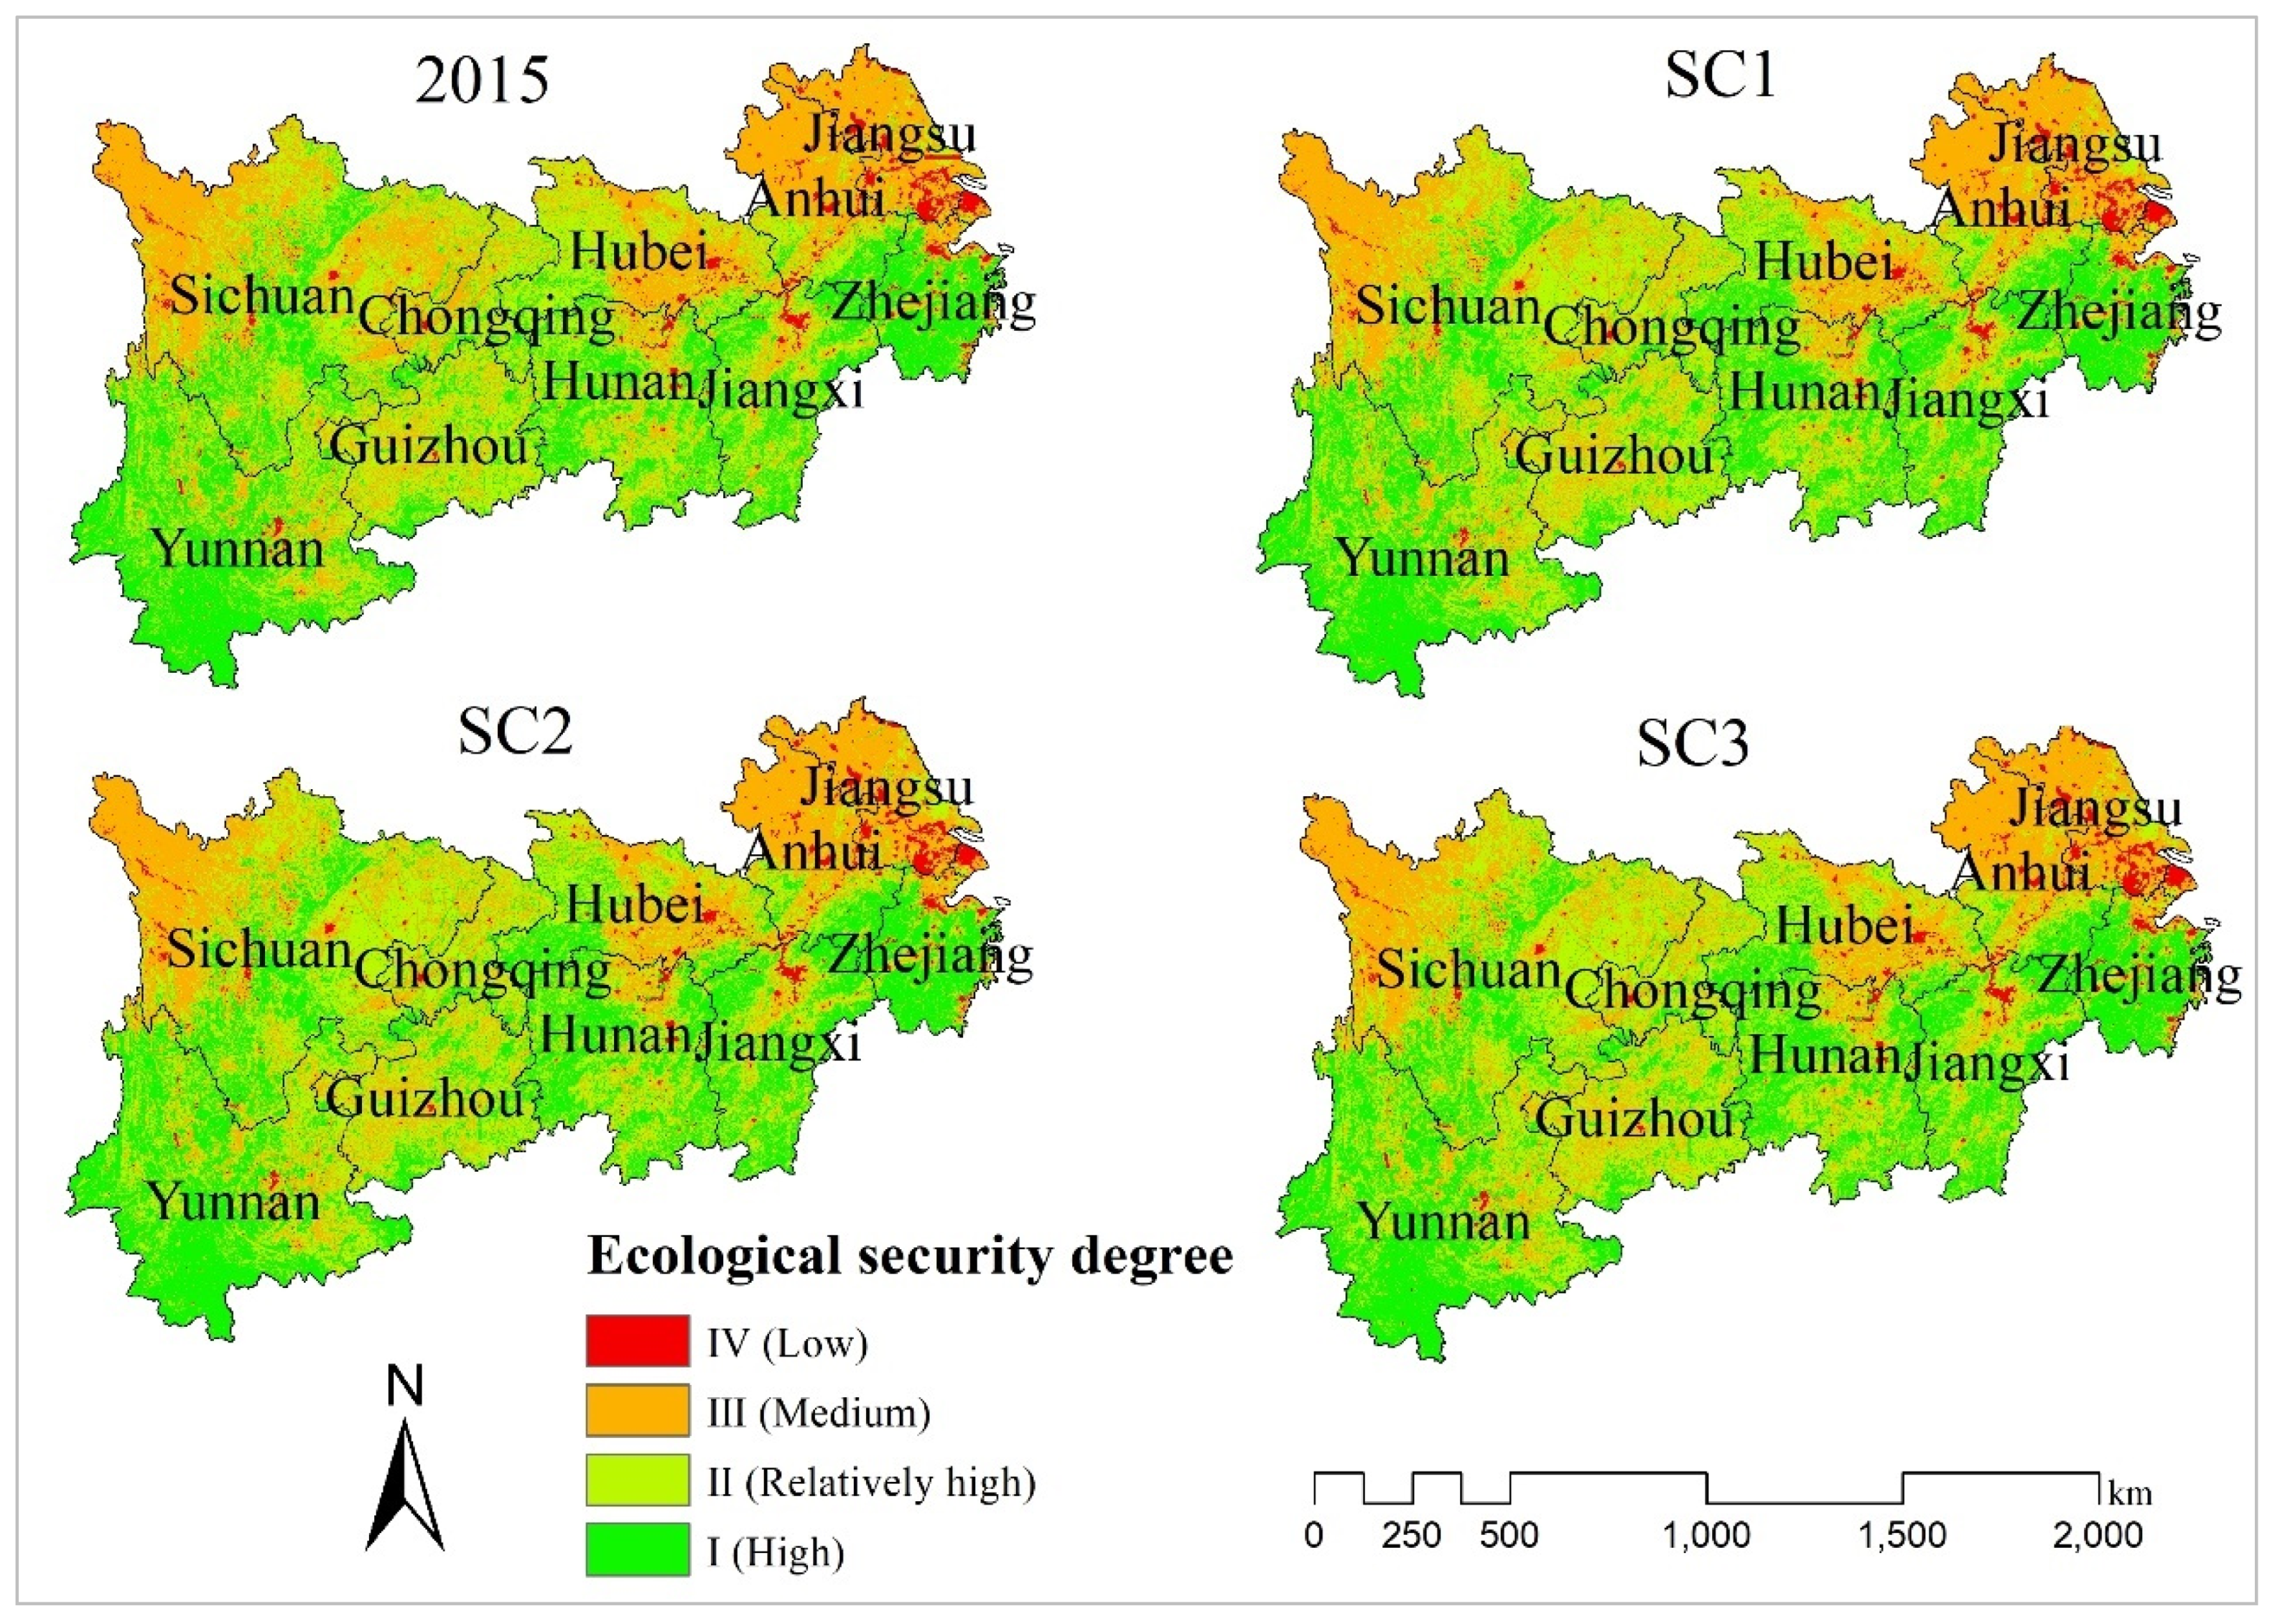
3.2. Evaluation of Ecological Security with the CVOR Framework
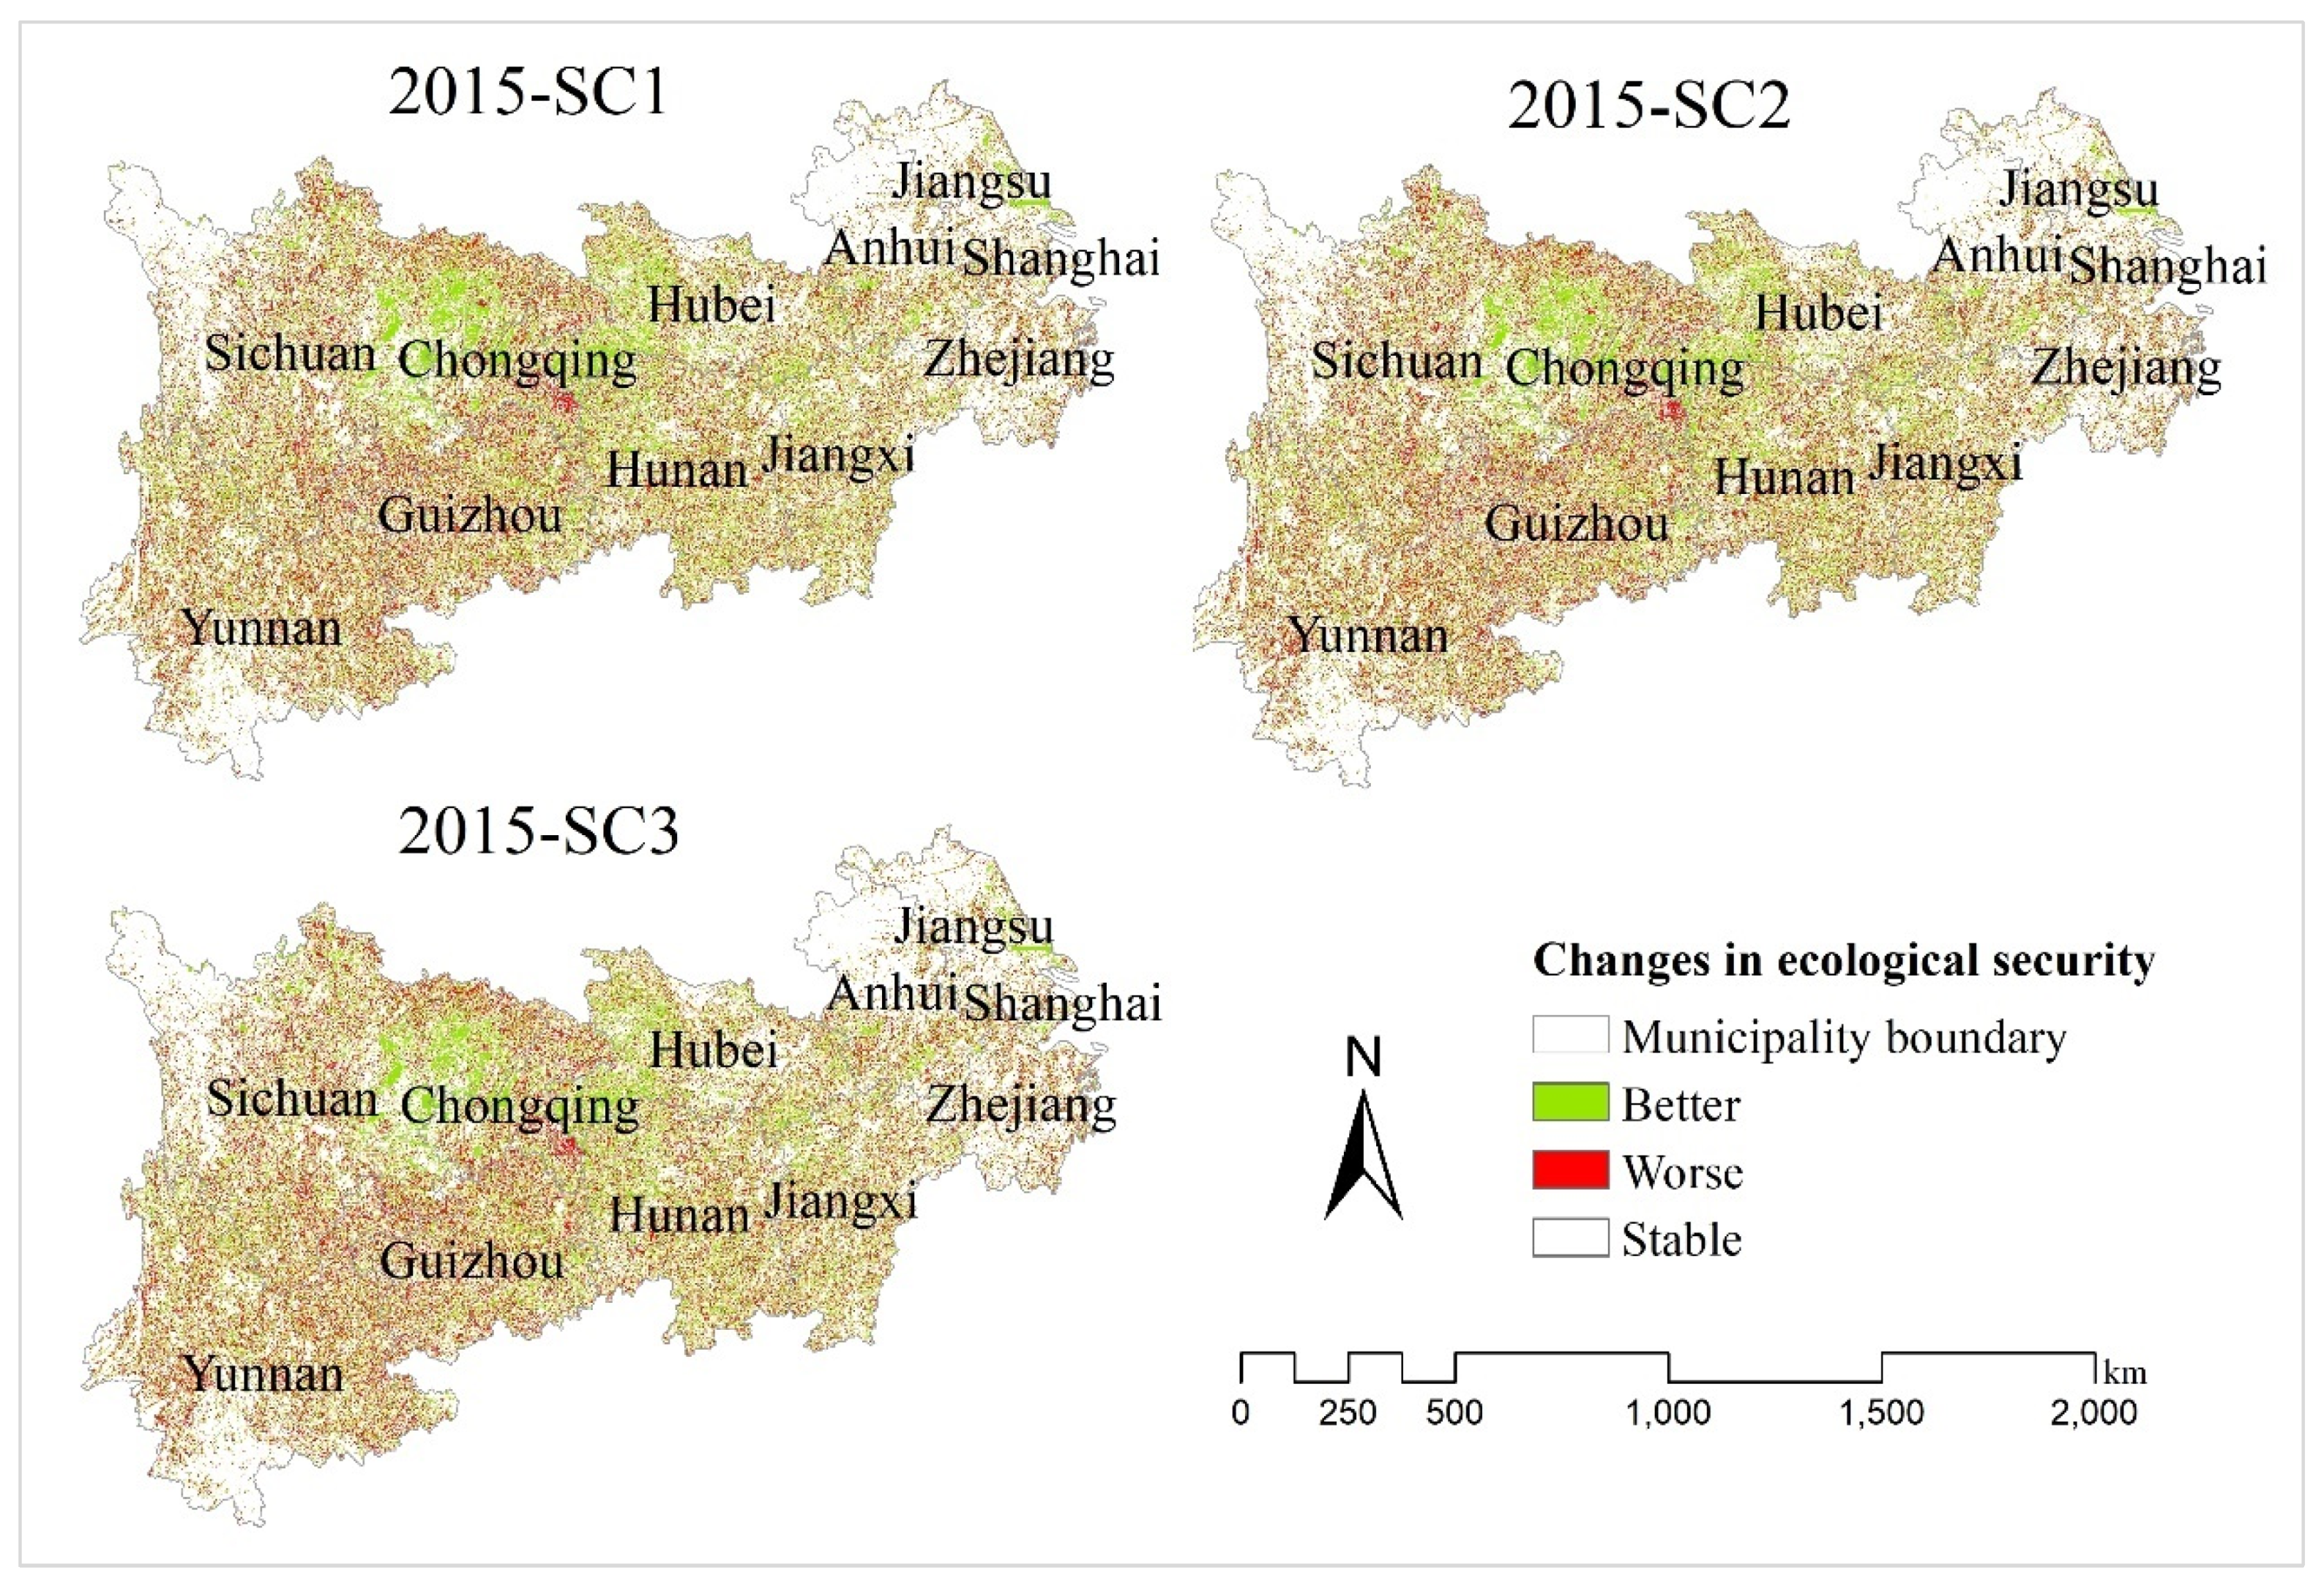
3.3. Changes in Ecological Security between 2015 and 2030
4. Discussion
4.1. The LANDSCAPE Model for Simulating Land Uses in Different Scenarios
4.2. Evaluation of Ecological Security with the CVOR Framework
4.3. Changes in Ecological Security from 2015 to 2030
4.3.1. Changes in the Ecological Security of All Scenarios
4.3.2. Comparison of Changes in Ecological Security in Different Scenarios
5. Conclusions
Author Contributions
Funding
Institutional Review Board Statement
Informed Consent Statement
Data Availability Statement
Conflicts of Interest
Appendix A

| Year | Area of Urban Land | Year | Area of Urban Land |
|---|---|---|---|
| 2008 | 460.00 | 2013 | 543.28 |
| 2009 | 466.60 | 2014 | 552.61 |
| 2010 | 484.01 | 2015 | 566.13 |
| 2011 | 506.42 | 2016 | 585.61 |
| 2012 | 520.30 |
| Land Use Type | Cropland | Forest | Grassland | River | Wetland | Urban Land | Rural Settlements | Bareland |
|---|---|---|---|---|---|---|---|---|
| 2015 | 6.17 | 9.33 | 3.34 | 0.14 | 0.49 | 0.17 | 0.49 | 0.16 |
| 2030 | ≥6.17 (depends on changes in urban land area from 2015 to 2030) | =0.14 | >0.17 (predicted with historical data) |
| Land Use Type | Resilience Coefficient |
|---|---|
| Cropland | 0.45 |
| Forest | 1.00 |
| Grassland | 0.70 |
| River | 1.00 |
| Wetland | 0.85 |
| Urban land | 0.20 |
| Rural settlements | 0.25 |
| Bare land | 0.00 |
| Cropland | Forest | Grassland | River | Wetland | Urban Built-Up Area | Rural Settlement | Bare-Land | |
|---|---|---|---|---|---|---|---|---|
| Kappa Simulation | 0.333 | 0.140 | 0.218 | N/A | 0.270 | 0.521 | 0.298 | 0.296 |
References
- Israel, D.; Briones, R. Impacts of natural disasters on agriculture, food security, and natural resources and environment in the Philippines. In Economic and Welfare Impacts of Disasters in East Asia and Policy Responses; Sawada, Y., Oum, S., Eds.; ERIA Research Project Report 2011-8; Economic Research Institute for ASEAN and East Asia: Jakarta, Indonesia, 2012; pp. 553–599. [Google Scholar]
- Cocklin, C.; Keen, M. Urbanization in the Pacific: Environmental change, vulnerability and human security. Environ. Conserv. 2002, 27, 392–403. [Google Scholar] [CrossRef]
- Gao, S.; Sun, H.; Cao, G.; Zhao, L.; Wang, R.; Xu, M. Dynamic assessment of island ecological security under urbanization: A case study of Pingtan Island in the Southeast Coast of China. Environ. Earth Sci. 2018, 77, 531. [Google Scholar] [CrossRef]
- Li, W.; Xie, S.; Wang, Y.; Huang, J.; Cheng, X. Effects of urban expansion on ecosystem health in Southwest China from a multi-perspective analysis. J. Clean. Prod. 2021, 294, 126341. [Google Scholar] [CrossRef]
- Zhang, R.; Pu, L.; Li, J.; Zhang, J.; Xu, Y. Landscape ecological security response to land use change in the tidal flat reclamation zone, China. Environ. Monit. Assess. 2016, 188, 1–10. [Google Scholar] [CrossRef]
- Costanza, R. Toward an operational definition of ecosystem health. In Ecosystem Health: New Goals for Environmental Management; Costanza, R., Norton, B., Haskell, B., Eds.; Island Press: Washington, DC, USA, 1992; pp. 239–256. [Google Scholar]
- Rapport, D.J. What Constitutes Ecosystem Health? Perspect. Biol. Med. 1989, 33, 120–132. [Google Scholar] [CrossRef]
- Costanza, R. Ecosystem health and ecological engineering. Ecol. Eng. 2012, 45, 24–29. [Google Scholar] [CrossRef] [Green Version]
- Wicklum, D.; Davies, R.W. Ecosystem health and integrity? Can. J. Bot. 1995, 73, 997–1000. [Google Scholar] [CrossRef]
- He, J.; Pan, Z.; Liu, D.; Guo, X. Exploring the regional differences of ecosystem health and its driving factors in China. Sci. Total Environ. 2019, 673, 553–564. [Google Scholar] [CrossRef]
- Pan, Z.; He, J.; Liu, D.; Wang, J.; Guo, X. Ecosystem health assessment based on ecological integrity and ecosystem services demand in the Middle Reaches of the Yangtze River Economic Belt, China. Sci. Total Environ. 2021, 774, 144837. [Google Scholar] [CrossRef]
- Peng, J.; Liu, Y.; Wu, J.; Lv, H.; Hu, X. Linking ecosystem services and landscape patterns to assess urban ecosystem health: A case study in Shenzhen City, China. Landsc. Urban Plan. 2015, 143, 56–68. [Google Scholar] [CrossRef]
- Peng, J.; Zhao, S.; Dong, J.; Liu, Y.; Meersmans, J.; Li, H.; Wu, J. Applying ant colony algorithm to identify ecological security patterns in megacities. Environ. Model. Softw. 2019, 117, 214–222. [Google Scholar] [CrossRef] [Green Version]
- Spiegel, J.; Bonet, M.; Yassi, A.; Molina, E.; Concepcion, M.; Mast, P. Developing ecosystem health indicators in Centro Habana: A community-based approach. Ecosyst. Health 2001, 7, 15–26. [Google Scholar] [CrossRef]
- Wiegand, J.; Raffaelli, D.; Smart, J.; White, P.C.L. Assessment of temporal trends in ecosystem health using an holistic indicator. J. Environ. Manag. 2010, 91, 1446–1455. [Google Scholar] [CrossRef] [PubMed]
- Ke, X.; Wang, X.; Guo, H.; Yang, C.; Zhou, Q.; Mougharbel, A. Urban ecological security evaluation and spatial correlation research—Based on data analysis of 16 cities in Hubei Province of China. J. Clean. Prod. 2021, 311, 127613. [Google Scholar] [CrossRef]
- Rapport, D. Ecological footprints and ecosystem health: Complementary approaches to a sustainable future. Ecol. Econ. 2000, 32, 367–370. [Google Scholar]
- Yang, B.; Ke, X.; Van Vliet, J.; Yu, Q.; Zhou, T.; Verburg, P.H. Impact of cropland displacement on the potential crop production in China: A multi-scale analysis. Reg. Environ. Chang. 2020, 20, 97. [Google Scholar] [CrossRef]
- Tang, L.; Ke, X.; Zhou, Q.; Wang, L.; Koomen, E. Projecting future impacts of cropland reclamation policies on carbon storage. Ecol. Indic. 2020, 119, 106835. [Google Scholar] [CrossRef]
- Tang, L.; Ke, X.; Chen, Y.; Wang, L.; Zhou, Q.; Zheng, W.; Xiao, B. Which impacts more seriously on natural habitat loss and degradation? Cropland expansion or urban expansion? Land Degrad. Dev. 2020, 32, 946–964. [Google Scholar] [CrossRef]
- Ke, X.; Wang, L.; Ma, Y.; Pu, K.; Zhou, T.; Xiao, B.; Wang, J. Impacts of Strict Cropland Protection on Water Yield: A Case Study of Wuhan, China. Sustainability 2019, 11, 184. [Google Scholar] [CrossRef] [Green Version]
- Mei, Y.; Kong, X.; Ke, X.; Yang, B. The Impact of Cropland Balance Policy on Ecosystem Service of Water Purification—A Case Study of Wuhan, China. Water 2017, 9, 620. [Google Scholar] [CrossRef] [Green Version]
- Ke, X.; van Vliet, J.; Zhou, T.; Verburg, P.; Zheng, W.; Liu, X. Direct and indirect loss of natural habitat due to built-up area expansion: A model-based analysis for the city of Wuhan, China. Land Use Policy 2018, 74, 231–239. [Google Scholar] [CrossRef]
- Lambin, E.F.; Meyfroidt, P. Global land use change, economic globalization, and the looming land scarcity. Proc. Natl. Acad. Sci. USA 2011, 108, 3465–3472. [Google Scholar] [CrossRef] [PubMed] [Green Version]
- Ke, X.; Zheng, W.; Zhou, T.; Liu, X. A CA-based land system change model: LANDSCAPE. Int. J. Geogr. Inf. Sci. 2017, 31, 1798–1817. [Google Scholar] [CrossRef]
- Xu, X.; Yang, G.; Tan, Y.; Liu, J.; Hu, H. Ecosystem services trade-offs and determinants in China’s Yangtze River Economic Belt from 2000 to 2015. Sci. Total Environ. 2018, 634, 1601–1614. [Google Scholar] [CrossRef] [PubMed]
- Xu, X.; Jiang, B.; Chen, M.; Bai, Y.; Yang, G. Strengthening the effectiveness of nature reserves in representing ecosystem services: The Yangtze River Economic Belt in China. Land Use Policy 2020, 96, 104717. [Google Scholar] [CrossRef]
- Peng, J.; Liu, Y.; Li, T.; Wu, J. Regional ecosystem health response to rural land use change: A case study in Lijiang City, China. Ecol. Indic. 2017, 72, 399–410. [Google Scholar] [CrossRef]
- Whitford, W.; Rapport, D.; DeSoyza, A. Using resistance and resilience measurements for ‘fitness’ tests in ecosystem health. J. Environ. Manag. 1999, 57, 21–29. [Google Scholar] [CrossRef]
- White, R.; Engelen, G. Cellular automata as the basis of integrated dynamic regional modelling. Environ. Plan. B Plan. Des. 1997, 24, 235–246. [Google Scholar] [CrossRef]
- Hamon, R. Estimating potential evapotranspiration. J. Hydraul. Div. 1961, 87, 107–120. [Google Scholar] [CrossRef]
- Wolock, D.; McCabe, G. Effects of potential climatic change on annual runoff in the conterminous United States. J. Am. Water Resour. Assoc. 1999, 35, 1341–1350. [Google Scholar] [CrossRef]
- Verburg, P.H.; Soepboer, W.; Veldkamp, T.; Limpiada, R.; Espaldon, V.; Mastura, S.S.A. Modeling the Spatial Dynamics of Regional Land Use: The CLUE-S Model. Environ. Manag. 2002, 30, 391–405. [Google Scholar] [CrossRef] [PubMed]
- Liang, X.; Liu, X.; Li, X.; Chen, Y.; Tian, H.; Yao, Y. Delineating multi-scenario urban growth boundaries with a CA-based FLUS model and morphological method. Landsc. Urban Plan. 2018, 177, 47–63. [Google Scholar] [CrossRef]
- Hilferink, M.; Rietveld, P. Land use scanner: An integrated GIS based model for long term projections of land use in urban and rural areas. J. Geogr. Syst. 1999, 1, 155–177. [Google Scholar] [CrossRef] [Green Version]
- Hazbavi, Z.; Sadeghi, S.; Gholamalifard, M.; Davudirad, A. Watershed health assessment using the pressure–state–response (PSR) framework. Land Degrad. Dev. 2020, 31, 3–19. [Google Scholar] [CrossRef]
- Yu, G.; Yu, Q.; Hu, L.; Zhang, S.; Fu, T.; Zhou, X.; He, X.; Liu, Y.; Wang, S.; Jia, H. Ecosystem health assessment based on analysis of a land use database. Appl. Geogr. 2013, 44, 154–164. [Google Scholar] [CrossRef]
- Xu, C.; Pu, L.; Zhu, M.; Li, J.; Chen, X.; Wang, X.; Xie, X. Ecological Security and Ecosystem Services in Response to Land Use Change in the Coastal Area of Jiangsu, China. Sustainability 2016, 8, 816. [Google Scholar] [CrossRef] [Green Version]
- Zhou, D.; Lin, Z.; Ma, S.; Qi, J.; Yan, T. Assessing an ecological security network for a rapid urbanization region in Eastern China. Land Degrad. Dev. 2021, 32, 2642–2660. [Google Scholar] [CrossRef]
- Su, M.; Fath, B.D.; Yang, Z. Urban ecosystem health assessment: A review. Sci. Total Environ. 2010, 408, 2425–2434. [Google Scholar] [CrossRef]
- Weinzettel, J.; Hertwich, E.; Peters, G.; Steen-Olsen, K.; Galli, A. Affluence drives the global displacement of land use. Glob. Environ. Chang. 2013, 23, 433–438. [Google Scholar] [CrossRef] [Green Version]
- Li, Z.-T.; Li, M.; Xia, B.-C. Spatio-temporal dynamics of ecological security pattern of the Pearl River Delta urban agglomeration based on LUCC simulation. Ecol. Indic. 2020, 114, 106319. [Google Scholar] [CrossRef]
- Wu, L.; Xie, B. The variation differences of cultivated land ecological security between flatland and mountainous areas based on LUCC. PLoS ONE 2019, 14, e0220747. [Google Scholar] [CrossRef] [PubMed] [Green Version]
- Liu, J.; Li, S.; Ouyang, Z.; Tam, C.; Chen, X. Ecological and socioeconomic effects of China’s policies for ecosystem services. Proc. Natl. Acad. Sci. USA 2008, 105, 9477–9482. [Google Scholar] [CrossRef] [PubMed] [Green Version]
- Sun, B.; Zhou, Q. Expressing the spatio-temporal pattern of farmland change in arid lands using landscape metrics. J. Arid. Environ. 2016, 124, 118–127. [Google Scholar] [CrossRef]
- Su, S.; Hu, Y.; Luo, F.; Mai, G.; Wang, Y. Farmland fragmentation due to anthropogenic activity in rapidly developing region. Agric. Syst. 2014, 131, 87–93. [Google Scholar] [CrossRef]
- Zhang, Y.; Peng, C.; Li, W.; Tian, L.; Zhu, Q.; Chen, H.; Fang, X.; Zhang, G.; Liu, G.; Mu, X.; et al. Multiple afforestation programs accelerate the greenness in the ‘Three North’ region of China from 1982 to 2013. Ecol. Indic. 2016, 61, 404–412. [Google Scholar] [CrossRef]


| Dataset | Data Description | Indicator of CVOR Framework | Usage |
|---|---|---|---|
| Land use data | Land use in 2000, 2015 | For the evaluation of CVOR indicators:
| / |
| Area of urban land | Area of urban land from 2008 to 2016 | / | To predict the area of urban land in 2030 |
| Topographic data | Elevation | For the evaluation of CVOR indicators:
| / |
| Traffic data | The distance to the nearest national road | For the evaluation of CVOR indicator: habitat quality | To derive for one of the threats of habitat quality |
| The distance to the nearest provincial road | |||
| The distance to the nearest major road | |||
| Soil data | Root restricting layer depth | For the evaluation of CVOR indicator: Water yield | To derive for the carbon pool |
| Plant available water content | For the evaluation of CVOR indicator: Water yield | / | |
| Meteorological data | Average annual precipitation | For the evaluation of CVOR indicators:
| To derive for nutrient runoff proxy |
| Potential evapotranspiration | For the evaluation of CVOR indicators: Water yield | To derive for reference evapotranspiration | |
| NPP | NPP in 2015 | For the evaluation of CVOR indicator: NPP | / |
| NDVI | NDVI in 2015 | For the evaluation of CVOR indicator: NDVI | / |
| Dataset | Data Description | Data Processing | Data Type | Resolution | Sources |
|---|---|---|---|---|---|
| Land use data | Land use in 2000, 2015 | / | Raster | 500 m | Data Centre of Resources and Environment, Chinese Academy Science (CAS) |
| Area of urban land | Area of urban land from 2008 to 2016 | Statistical data | / | Chinese statistical yearbook (2009–2017) | |
| Topographic data | Elevation | Hydrology in ArcGIS | Raster | 500 m | The Shuttle Radar Topography Mission (SRTM) |
| Traffic data | The distance to the nearest national road | Euclidean distance in ArcGIS | Raster | / | Department of Transportation of China (http://jtt.hubei.gov.cn/) |
| The distance to the nearest provincial road | Raster | / | |||
| The distance to the nearest major road | Raster | / | |||
| Soil data | Root restricting layer depth | / | Raster | 500 m | The China Soil Database; Soil survey data (The second national soil survey) |
| Plant available water content | / | Raster | 500 m | ||
| Meteorological data | Average annual precipitation | Kriging’s interpolation method in ArcGIS | Raster | 500 m | The Chinese Meteorological Administration (CMA) |
| Average annual accumulated temperature | Kriging’s interpolation method in ArcGIS | Raster | 500 m | ||
| Potential evapotranspiration | Calculated annually using the Hamon equation based on precipitation data ([31,32]) | Raster | 500 m | ||
| NPP | NPP in 2015 | Raster | 1000 m | Data Centre of Resources and Environment, Chinese Academy Science (CAS) | |
| NDVI | NDVI in 2015 | Raster | 1000 m |
| Land Use Type | 2015 | SC 1 | SC 2 | SC 3 | Change of SC1 (2015–2030) | Change of SC2 (2015–2030) | Change of SC3 (2015–2030) |
|---|---|---|---|---|---|---|---|
| Cropland | 30.40 | 30.40 | 30.40 | 30.40 | 0.0002 | 0.0008 | 0.0018 |
| Forest | 45.97 | 45.93 | 45.93 | 45.98 | –0.0917 | –0.0922 | 0.0125 |
| Grassland | 16.48 | 16.47 | 16.47 | 16.47 | –0.0452 | –0.0458 | –0.0508 |
| River | 0.67 | 0.67 | 0.67 | 0.67 | 0.0000 | 0.0000 | 0.0000 |
| Wetland | 2.43 | 2.32 | 2.32 | 2.31 | –4.2329 | –4.2370 | –4.7425 |
| Urban land | 0.86 | 1.13 | 1.13 | 1.13 | 31.0349 | 31.0349 | 31.0349 |
| Rural settlement | 2.39 | 2.28 | 2.28 | 2.24 | –4.7859 | –4.7736 | –6.2302 |
| Bare land | 0.81 | 0.80 | 0.80 | 0.80 | –0.0367 | –0.0428 | –0.0428 |
| Degree of Ecological Security | 2015 (km2) | SC1 (km2) | SC2 (km2) | SC3 (km2) | 2015 (%) | SC1 (%) | SC2 (%) | SC3 (%) |
|---|---|---|---|---|---|---|---|---|
| I (High) | 60,069 | 54,383 | 54,384 | 54,380 | 2.96 | 2.68 | 2.68 | 2.68 |
| II (Relatively high) | 650,115 | 598,382 | 601,336 | 603,558 | 31.99 | 29.46 | 29.59 | 29.70 |
| III (Medium) | 746,364 | 743,137 | 762,253 | 759,736 | 36.72 | 36.58 | 37.50 | 37.38 |
| IV (Low) | 575,864 | 635,510 | 614,439 | 614,738 | 28.33 | 31.28 | 30.23 | 30.25 |
| Improved | 2015–2030 (SC1) | 2015–2030 (SC2) | 2015–2030 (SC3) | Deteriorated | 2015–2030 (SC1) | 2015–2030 (SC2) | 2015–2030 (SC3) | Stable | 2015–2030 (SC1) | 2015–2030 (SC2) | 2015–2030 (SC3) |
|---|---|---|---|---|---|---|---|---|---|---|---|
| IV–III | 7.41 | 7.80 | 7.78 | III–IV | 9.89 | 9.33 | 9.34 | IV–IV | 19.86 | 19.46 | 19.46 |
| IV–II | 1.03 | 1.04 | 1.06 | II–IV | 1.46 | 1.33 | 1.34 | III–III | 19.56 | 20.08 | 20.01 |
| IV–I | 0.03 | 0.03 | 0.03 | II–III | 9.36 | 9.39 | 9.35 | II–II | 20.61 | 20.70 | 20.74 |
| III–II | 7.13 | 7.17 | 7.22 | I–IV | 0.11 | 0.11 | 0.11 | I–I | 1.93 | 1.93 | 1.93 |
| III–I | 0.15 | 0.15 | 0.15 | I–III | 0.24 | 0.24 | 0.24 | ||||
| II–I | 0.56 | 0.56 | 0.56 | I–II | 0.67 | 0.67 | 0.67 | ||||
| Sum | 16.31 | 16.75 | 16.80 | Sum | 21.73 | 21.07 | 21.05 | Sum | 61.96 | 62.18 | 62.15 |
Publisher’s Note: MDPI stays neutral with regard to jurisdictional claims in published maps and institutional affiliations. |
© 2021 by the authors. Licensee MDPI, Basel, Switzerland. This article is an open access article distributed under the terms and conditions of the Creative Commons Attribution (CC BY) license (https://creativecommons.org/licenses/by/4.0/).
Share and Cite
Yin, F.; Zhou, T.; Ke, X. Impact of Cropland Reclamation on Ecological Security in the Yangtze River Economic Belt, China. Sustainability 2021, 13, 12735. https://doi.org/10.3390/su132212735
Yin F, Zhou T, Ke X. Impact of Cropland Reclamation on Ecological Security in the Yangtze River Economic Belt, China. Sustainability. 2021; 13(22):12735. https://doi.org/10.3390/su132212735
Chicago/Turabian StyleYin, Feng, Ting Zhou, and Xinli Ke. 2021. "Impact of Cropland Reclamation on Ecological Security in the Yangtze River Economic Belt, China" Sustainability 13, no. 22: 12735. https://doi.org/10.3390/su132212735
APA StyleYin, F., Zhou, T., & Ke, X. (2021). Impact of Cropland Reclamation on Ecological Security in the Yangtze River Economic Belt, China. Sustainability, 13(22), 12735. https://doi.org/10.3390/su132212735