Article

Assessing Urban Metabolism through MSW Carbon Footprint and Conceptualizing Municipal-Industrial Symbiosis—The Case of Zaragoza City, Spain

1
Research Centre for Energy Resources and Consumption, Instituto CIRCE, Universidad de Zaragoza, 50018 Zaragoza, Spain
2
Ayuntamiento de Zaragoza, 50003 Zaragoza, Spain
*
Authors to whom correspondence should be addressed.
Sustainability 2021, 13(22), 12724; https://doi.org/10.3390/su132212724
Submission received: 27 September 2021 / Revised: 9 November 2021 / Accepted: 15 November 2021 / Published: 17 November 2021
(This article belongs to the Collection Sustainable Household Behaviors: Consumption and Mobility)

Abstract

:
This paper proposes a holistic vision of the urban metabolism (UM), viewing the city as a subsystem within an industrial ecosystem (IE) in which municipal-industrial symbiosis is essential to achieve sustainability goals. For this purpose, the metabolism of a large Spanish city, Zaragoza, was studied by analyzing the main fractions of its MSW. A methodology based on carbon footprint (CF) was developed to analyze the environmental impact—in terms of CO2—of the influence of households’ behavior, the City Council’s strategies, and the main MSW fractions. Zaragoza’s IE represents a footprint of 931,250 CO2 tons for the fractions studied, of which 438,000 CO2 tons are due to organic fraction, 180,371 to plastics and 154,607 to paper and cardboard, which are the three most significant contributors. If households selectively separated 100% of their waste, the footprint would drop to 648,660 tons of CO2. Furthermore, monetary savings were quantified through the CO2 emissions price. The proposed methodology accounts for the CF of the whole IE, not just the city. Moreover, it enables the creation of Sankey diagrams to visualize the distribution of emissions of each subsystem, highlighting the importance of cooperation between the city and its recycling industries to reduce its CF.

1. Introduction

Municipal Solid Waste (MSW) can be an important source of resources for industry, while avoiding the environmental impact of leaving waste in nature. Cities produce more MSW per capita than rural populations. Moreover, the growth of urban populations—where already half of the world’s population lives—means that the annual waste generation is expected to increase worldwide by 70% from 2.01 billion tons in 2016 to 3.06 billion in 2050 [1]. This problem concerns the European Commission, as they have set a series of objectives to be met by the member states, such as a 10% reduction of MSW generation by 2020, with respect to 2010 and a recycling rate of 50% of MSW by 2020, rising to 55% of MSW by 2025 [2].
Although the European Commission has set the roadmap towards city sustainability, as Girardet warns [3], “the mere ‘sustainable development’ is not enough, since to be compatible with natural systems, cities need to move away from linear systems of resource use and learn to operate as closed-loop, circular systems”. However, due to the inevitable losses involved in any industrial process, as the second thermodynamic law inevitably states, cities and their industries will only be able to approximate this “circular system”, as virgin natural resources will always be required [4]. Furthermore, Girardet adds [3] “For a safe urban future, it is crucially important to quantify the flow of energy and resources within cities, and between cities and the world beyond, i.e., the metabolism of cities”. The concept of urban metabolism (UM) was first conceived by Wolman in 1965, and it is defined by Kennedy as “the sum total of the technical and socio-economic processes that occur in cities, resulting in growth, production of energy, and elimination of waste” [5]. This paper, dedicated to MSW, focuses on the production of consumer goods, their transformation into MSW and their treatment. The manufacturing industry carries out the first of these functions, the second by the city—composed of households and businesses (H&B)—and the third by waste recyclers. Each of them is indispensable for the long-term maintenance of the city, thus creating a symbiosis between them. From this, the concept of municipal-industrial symbiosis arises, where waste from the municipality is a resource for the recycling industry, and its outputs are resources for the manufacturing industry. Hence, the municipality, composed of H&B, is integrated as an “industry” in the industrial ecosystem (IE). This idea stems from the concept of industrial symbiosis, which allows traditionally separate entities and companies to share resources—materials, energy, water and by-products—making the outputs of ones the inputs of others, avoiding the consumption of resources external to the whole. One of the most well known examples is the case of the Kalundborg eco-industrial park [6]. However, in contrast to industrial symbiosis [7,8,9], in which a higher-ranking industry feeds a lower-ranking industry with its waste, the municipality stands as the driving subsystem, in the concept of municipal-industrial symbiosis, occupying the central hierarchical position since it is the municipality that feeds the recycling industries, with a lower hierarchical level.
Thus, this study accounts for the carbon footprint (CF) of the whole IE that involves MSW management, not just the city. Commonly, the mainstream conception of MSW management only includes the study of the city and not the industries of its IE. Many MSW studies use Life Cycle Analyses (LCAs), which provides a global, coherent and transparent view of the flows in waste management systems and quantification of the environmental profile [10]. These methodologies have been applied to European cities or regions, such as Madrid (Spain) [11], Aveiro (Portugal) [12], Castellón de la Plana (Spain) [13], the metropolitan area of Porto (Portugal) [14], Asturias (Spain) [15], Aalborg (Denmark) [16], Sweden [17], Region of Central Macedonia (Greece) [18], United Kingdom [19], Northern Germany [20], Naples (Italy) [21]. However, these LCAs start once the material becomes waste [22], which ignores the role of manufacturers and recyclers in MSW management. It allocates the environmental impact only to the city and not to the whole IE it belongs to. However, other studies take the perspective of UM and therefore include the waste management and manufacturing processes and post-management treatments [23,24,25,26,27].
To better understand the ideas of UM and municipal-industrial symbiosis, Figure 1 was constructed, showing the relationship between the subsystems/actors involved in the UM, and its three main stages, from the MSW point of view.
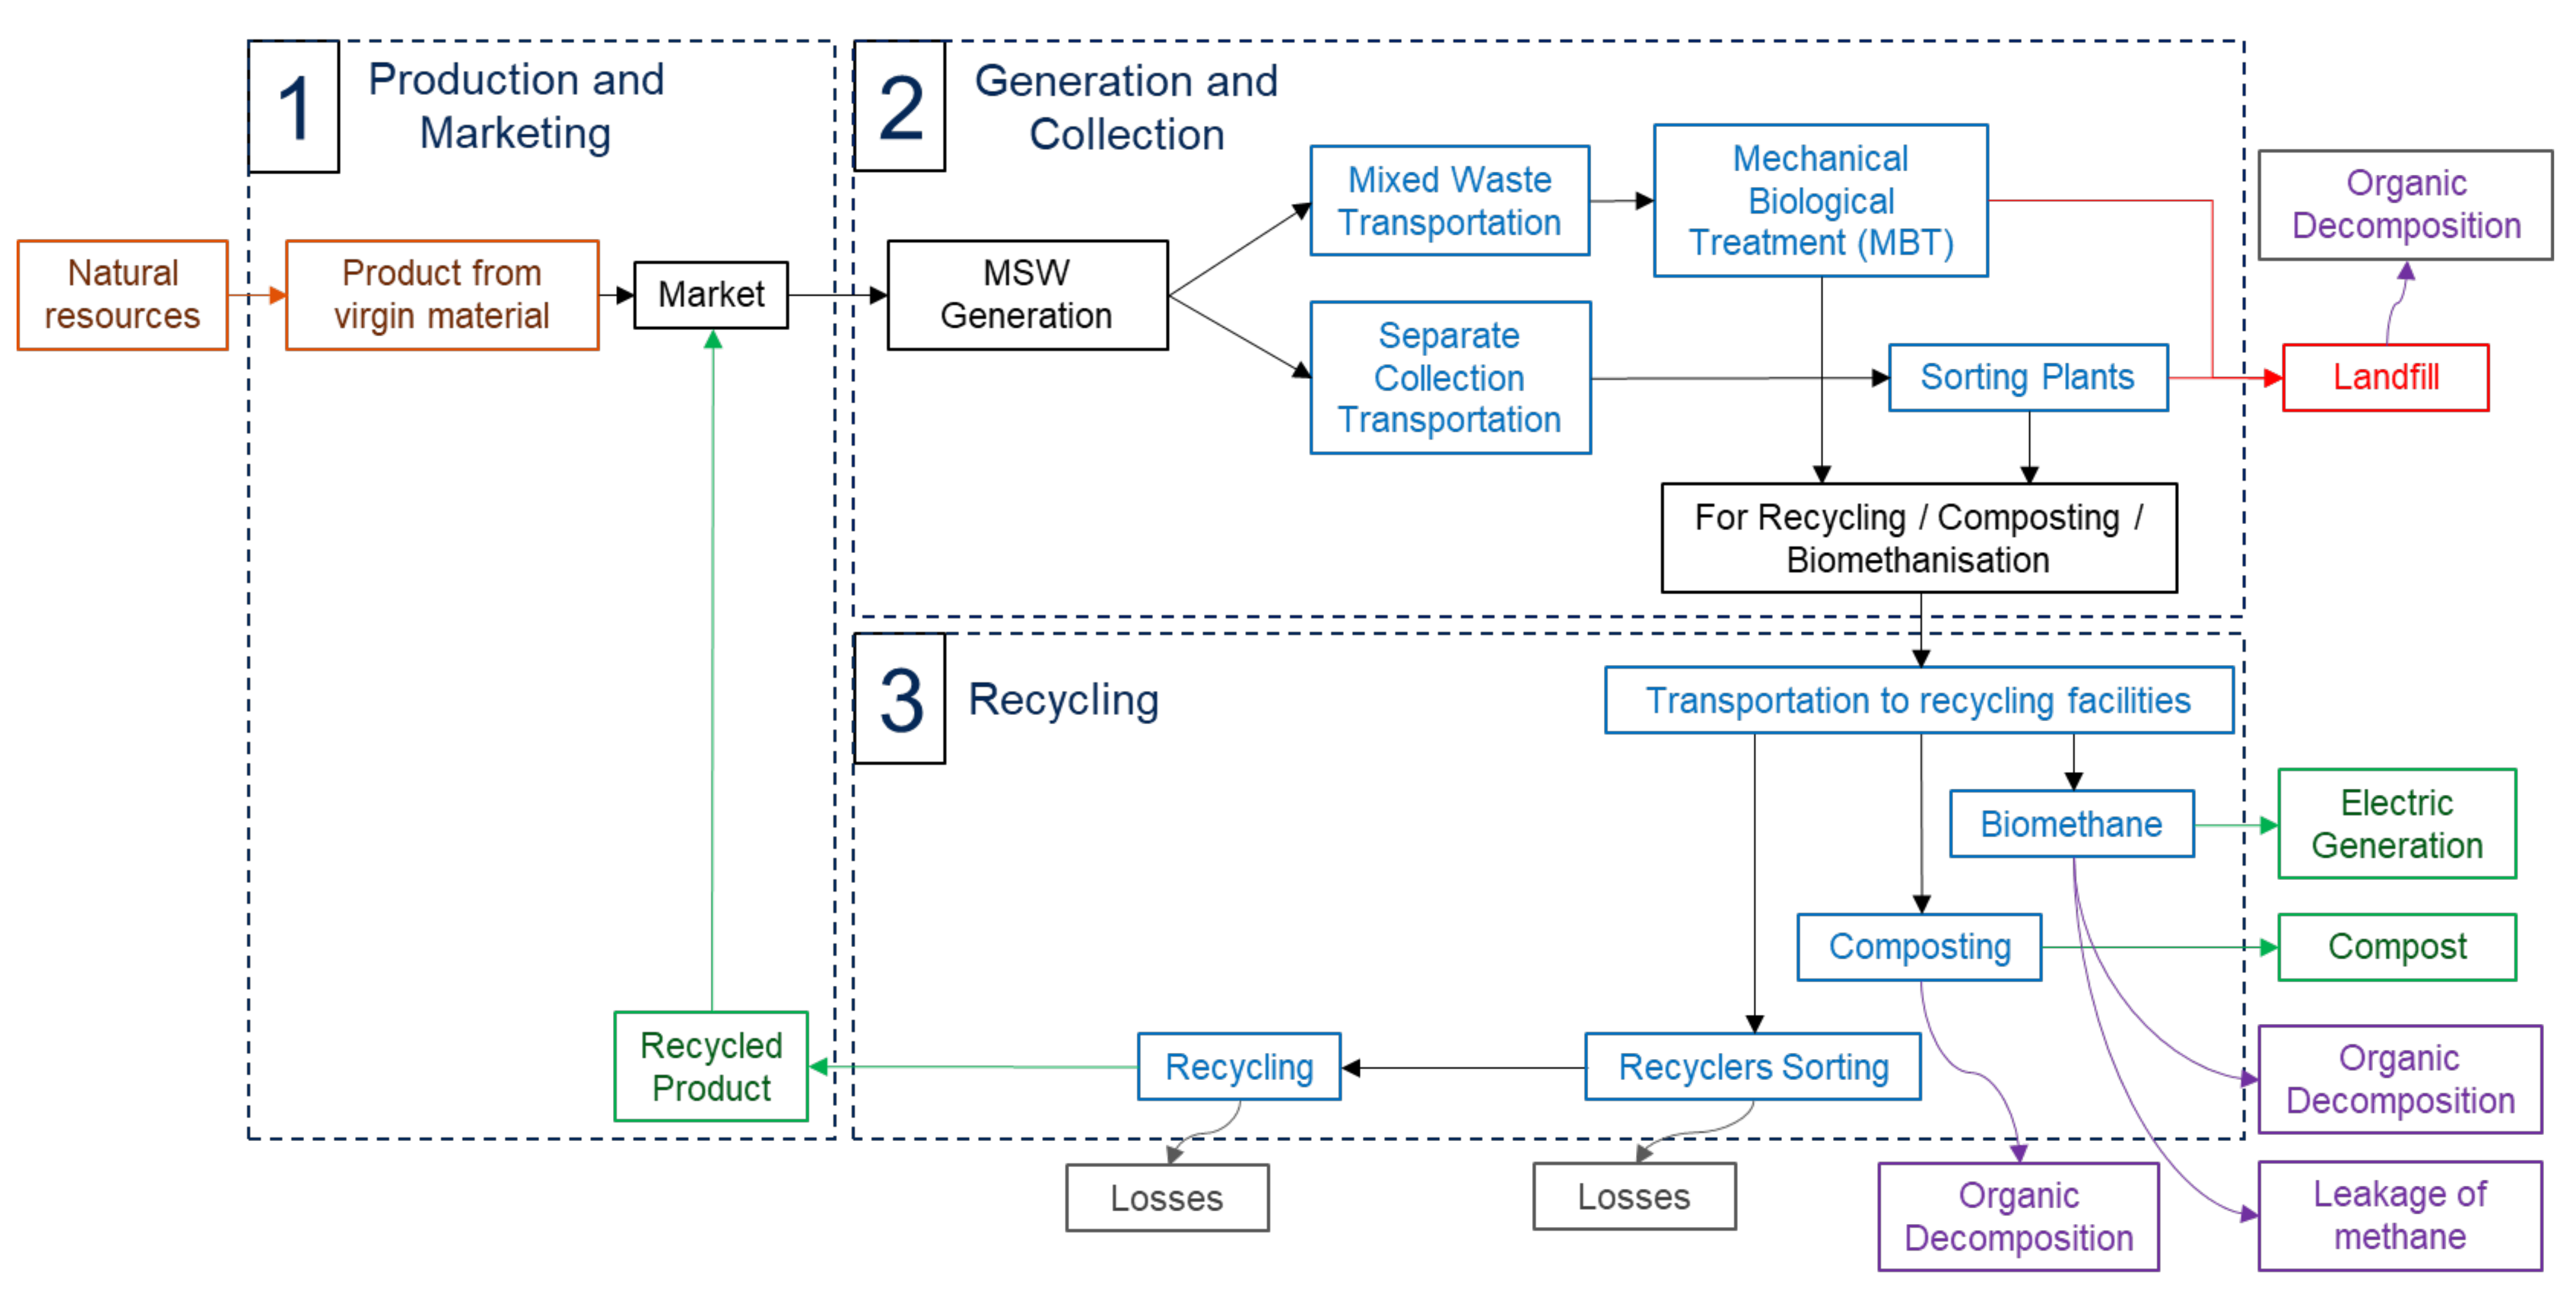
  • Design, production and marketing (1): conception, manufacturing industry and advertising.
  • Generation and collection (2): local authorities and H&B.
  • Recycling (3): recyclers.
Figure 1. Brief diagram of the Industrial Ecosystem (IE) from MSW point of view, including all subsystems/actors involved. It also shows Urban Metabolism (UM) from an MSW point of view (production, consumption and waste treatment).
Sustainability 13 12724 g001
The first of these (1 Design, Production and Marketing) contains everything related to the conception, manufacture of a product until it reaches a shop where it can be purchased by the consumer (market). This first stage, responsibility of manufacturers and advertisers, is crucial because the product’s environmental impact is defined here as the type and size of its packaging material or the recycled content of its packaging. As a result, policies have been developed to extend producer responsibility beyond the consumption phase, considering the whole life cycle. These policies are called extended producer responsibility (EPR) and in the EU, ERP is mandatory within the context of the waste electric and electronic equipment (WEEE), batteries, and vehicles [28]. In Spain, integrated management systems (SIG, by its Spanish acronym) are in place to apply EPR legislation [29] (more information in Appendix A).
The second stage (2 Generation and Collection) includes the consumption of products by H&B, the generation of waste and the separate collection of waste (essential for the subsequent recycling process). The main actor is the city itself composed of local authorities responsible for MSW collection and H&B. H&B behavior is important since they are responsible for buying lower-impact products, generating less waste, and separating waste appropriately. Nevertheless, municipalities must provide information to H&B to raise awareness and incentives (e.g., implementing a deposit-return system (DRS)).
Finally, in the third stage (3 Recycling), the actual recycling occurs, i.e., all the industrial processes capable of converting the separated MSW streams into new materials for the production phase of a new product. This phase includes recycling of metals such as steel or aluminum, plastics (present in the light packaging fraction), paper, glass or the use of organic matter for the generation of biogas and compost. The main subsystem/actor at this stage is the recycling industry, composed of multiple industries—from food waste to waste electrical and electronic equipment—which must transform the city’s multiple waste streams into multiple products useful for the manufacturing industry. The size of the city is determined by the number and type of these industries. In this stage, some losses cannot be avoided, partly due to bad design and manufacturers’ choices and partly due to the second law of thermodynamics. Therefore, it is essential to separate products correctly during stage 2, in which the behavior of H&B plays an important role.
Figure 1 shows that the city (Stage 2) has a series of inputs, i.e., products that enter and are consumed in the city, and a series of outputs, i.e., the waste generated by consumption. These inputs and outputs comprise the metabolism of the city. Thus, the city plays a central hierarchical role as its waste feeds the recycling industries. With this vision, city council strategies should focus on H&B and the entire IE [30]. Therefore, it is important to ensure cooperation between the city and its neighboring industries (where possible to save transport costs, although particular wastes that require large centralized industries to ensure economies of scale for cost-effective recycling). However, the lack of traceability of data, especially between the stages in Figure 1, is the first problem that needs to be addressed. For example, many plastics that have been collected separately end up in landfills in foreign countries with less stringent environmental laws [31].
This paper first analyzes the data of MSW generation and treatment of Zaragoza—the fifth most populated city in Spain and capital of Aragon with 681,877 inhabitants in 2020—comparing the analysis with the rest of MSW treatments in Spain. Secondly, a method is established to quantify the CF of the MSW management of the city’s IE. This method is used to analyze different scenarios compared to the current one, in which the scope of the household’s behavior is analyzed. Thus, it is possible to understand the metabolism of a city’s MSW, developing some Sankey diagrams for the main MSW fractions in terms of CO2. These show the CF allocated to each subsystem that composes the IE. This methodology is used to assess the environmental benefit—in terms of CO2—of some MSW management improvement strategies, the influence of households’ behavior in selective waste separation, analyzing the main MSW fractions and estimating their monetary value through the price of CO2 emissions. Finally, in the discussion and conclusions, the most important results and concepts are highlighted and discussed.

2. Materials and Methods

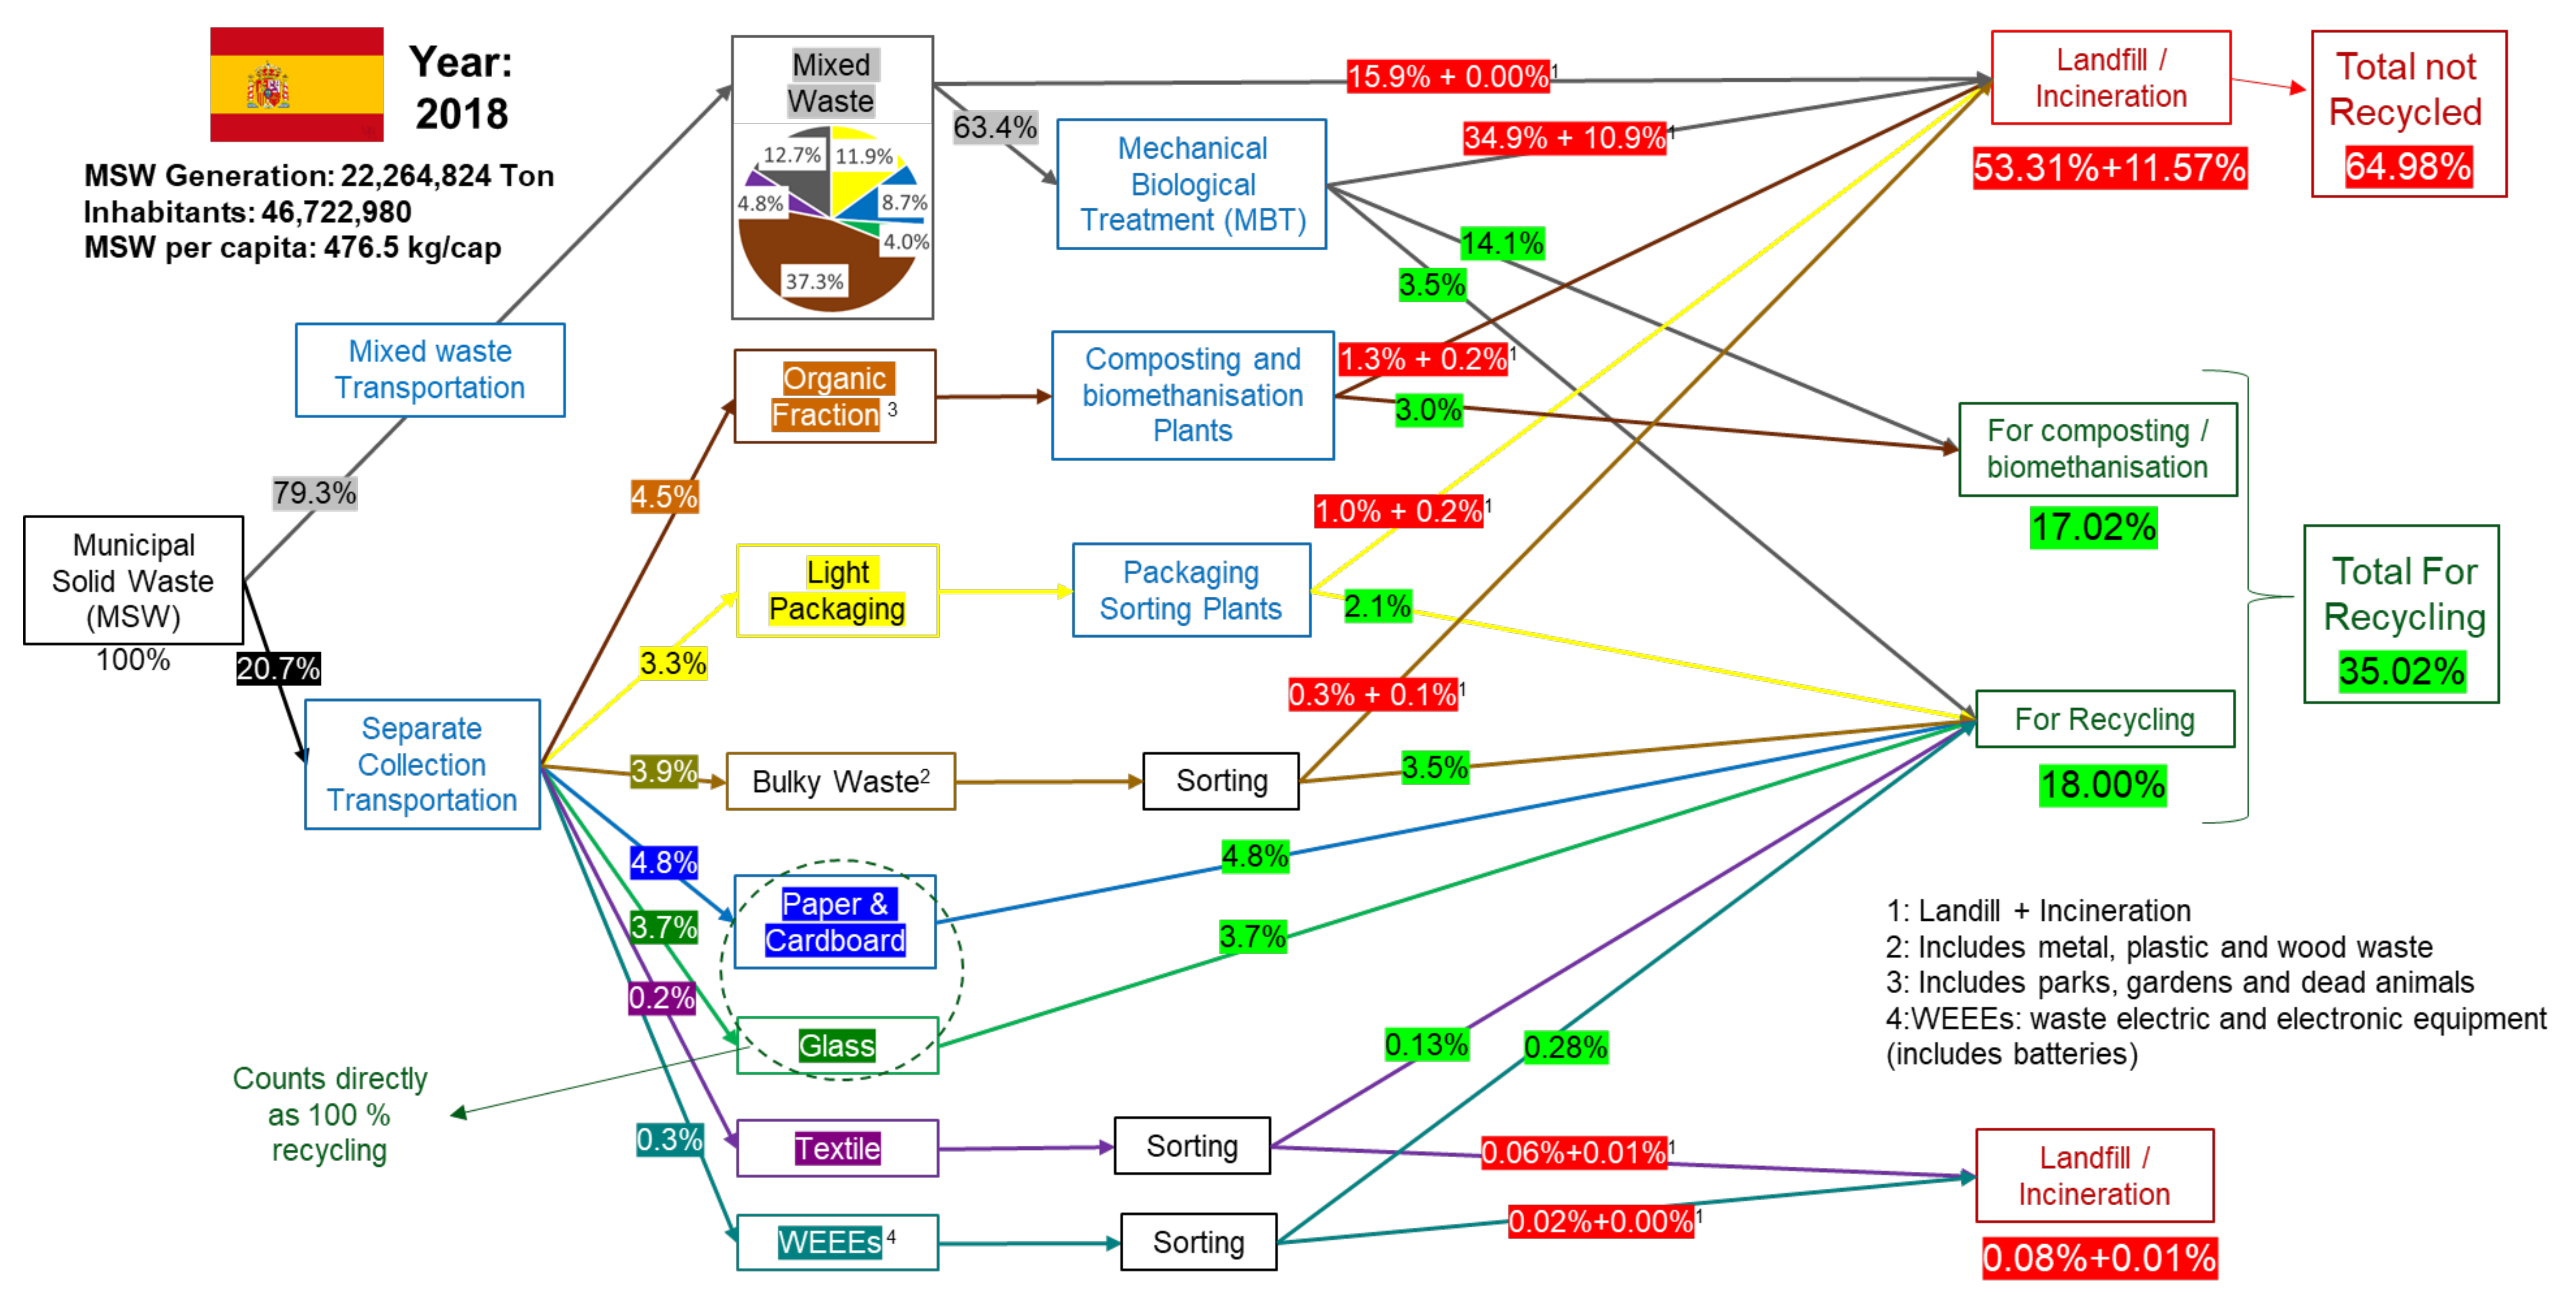
2.1. MSW Data Sources for Zaragoza and Spain

MSW generation and treatment data of Zaragoza come from Zaragoza City Council, and the “Plan Gestión Integral de Residuos de Aragón (GIRA) 2018–2020” [32] was used to estimate the mixed waste composition. For MSW generation and treatment data of Spain the “Memoria Anual de generación y gestión de residuos de Competencia Municipal 2018” [33] and the “Plan Estatal Marco de Gestión de Residuos (PEMAR) 2016–2022” [34] were used. Through these documents, it is possible to estimate all MSW generation by fractions, the different treatments that are applied to them and the amount of MSW that is delivered to recyclers, i.e., all processes that are the responsibility of local authorities and that are shown in Figure 1 in the so-called Stage 2.

2.2. CO2 Footprint Method Data

The CO2 footprint method was applied to light packaging (specifically plastics, steel, aluminum and briks), paper and cardboard (P&C), glass, and organic fractions in Zaragoza city. In the last point (2.1.), the sources of the data of the so-called stage 2 (Figure 1) are listed. Howeover, due to the lack of data traceability [31] between these stages, it was necessary to estimate the quantities that are sent to recyclers (stage 3) and the recycled quantities that reach the manufacturing industry (stage 1). The first assumption is that all material collected separately by the municipality and recovered at mechanical biological treatment (MBT) plant, i.e., sent to recyclers (boundary between stages 2 and 3 in Figure 1) actually ends up in recycling plants, and it is not lost. According to some researchers [31], this is not always the case since many materials, especially plastics, end up in landfills in foreign countries, even though they have been collected separately. Once the material arrives at the recycling plant, it is sorted, generating losses during the process. Recycling is carried out after sorting—which is also subject to losses in terms of material and quality (downcycling), simplified as a loss of material [12]. The percentages of sorting, recycling and downcycling losses used in this paper are shown in Table 1. These assumptions allow estimating all the complete material flows since the organic fraction is treated at the Zaragoza Urban Waste Treatment Complex (CTRUZ for its acronym in Spanish) (See Appendix B), who provided their data.
Once the mass flows were estimated, they had to be transformed into CF units, i.e., tons of CO2 equivalent (t CO2 eq.). For this purpose, emissions were classified by type, as shown in Figure 1 using colors.
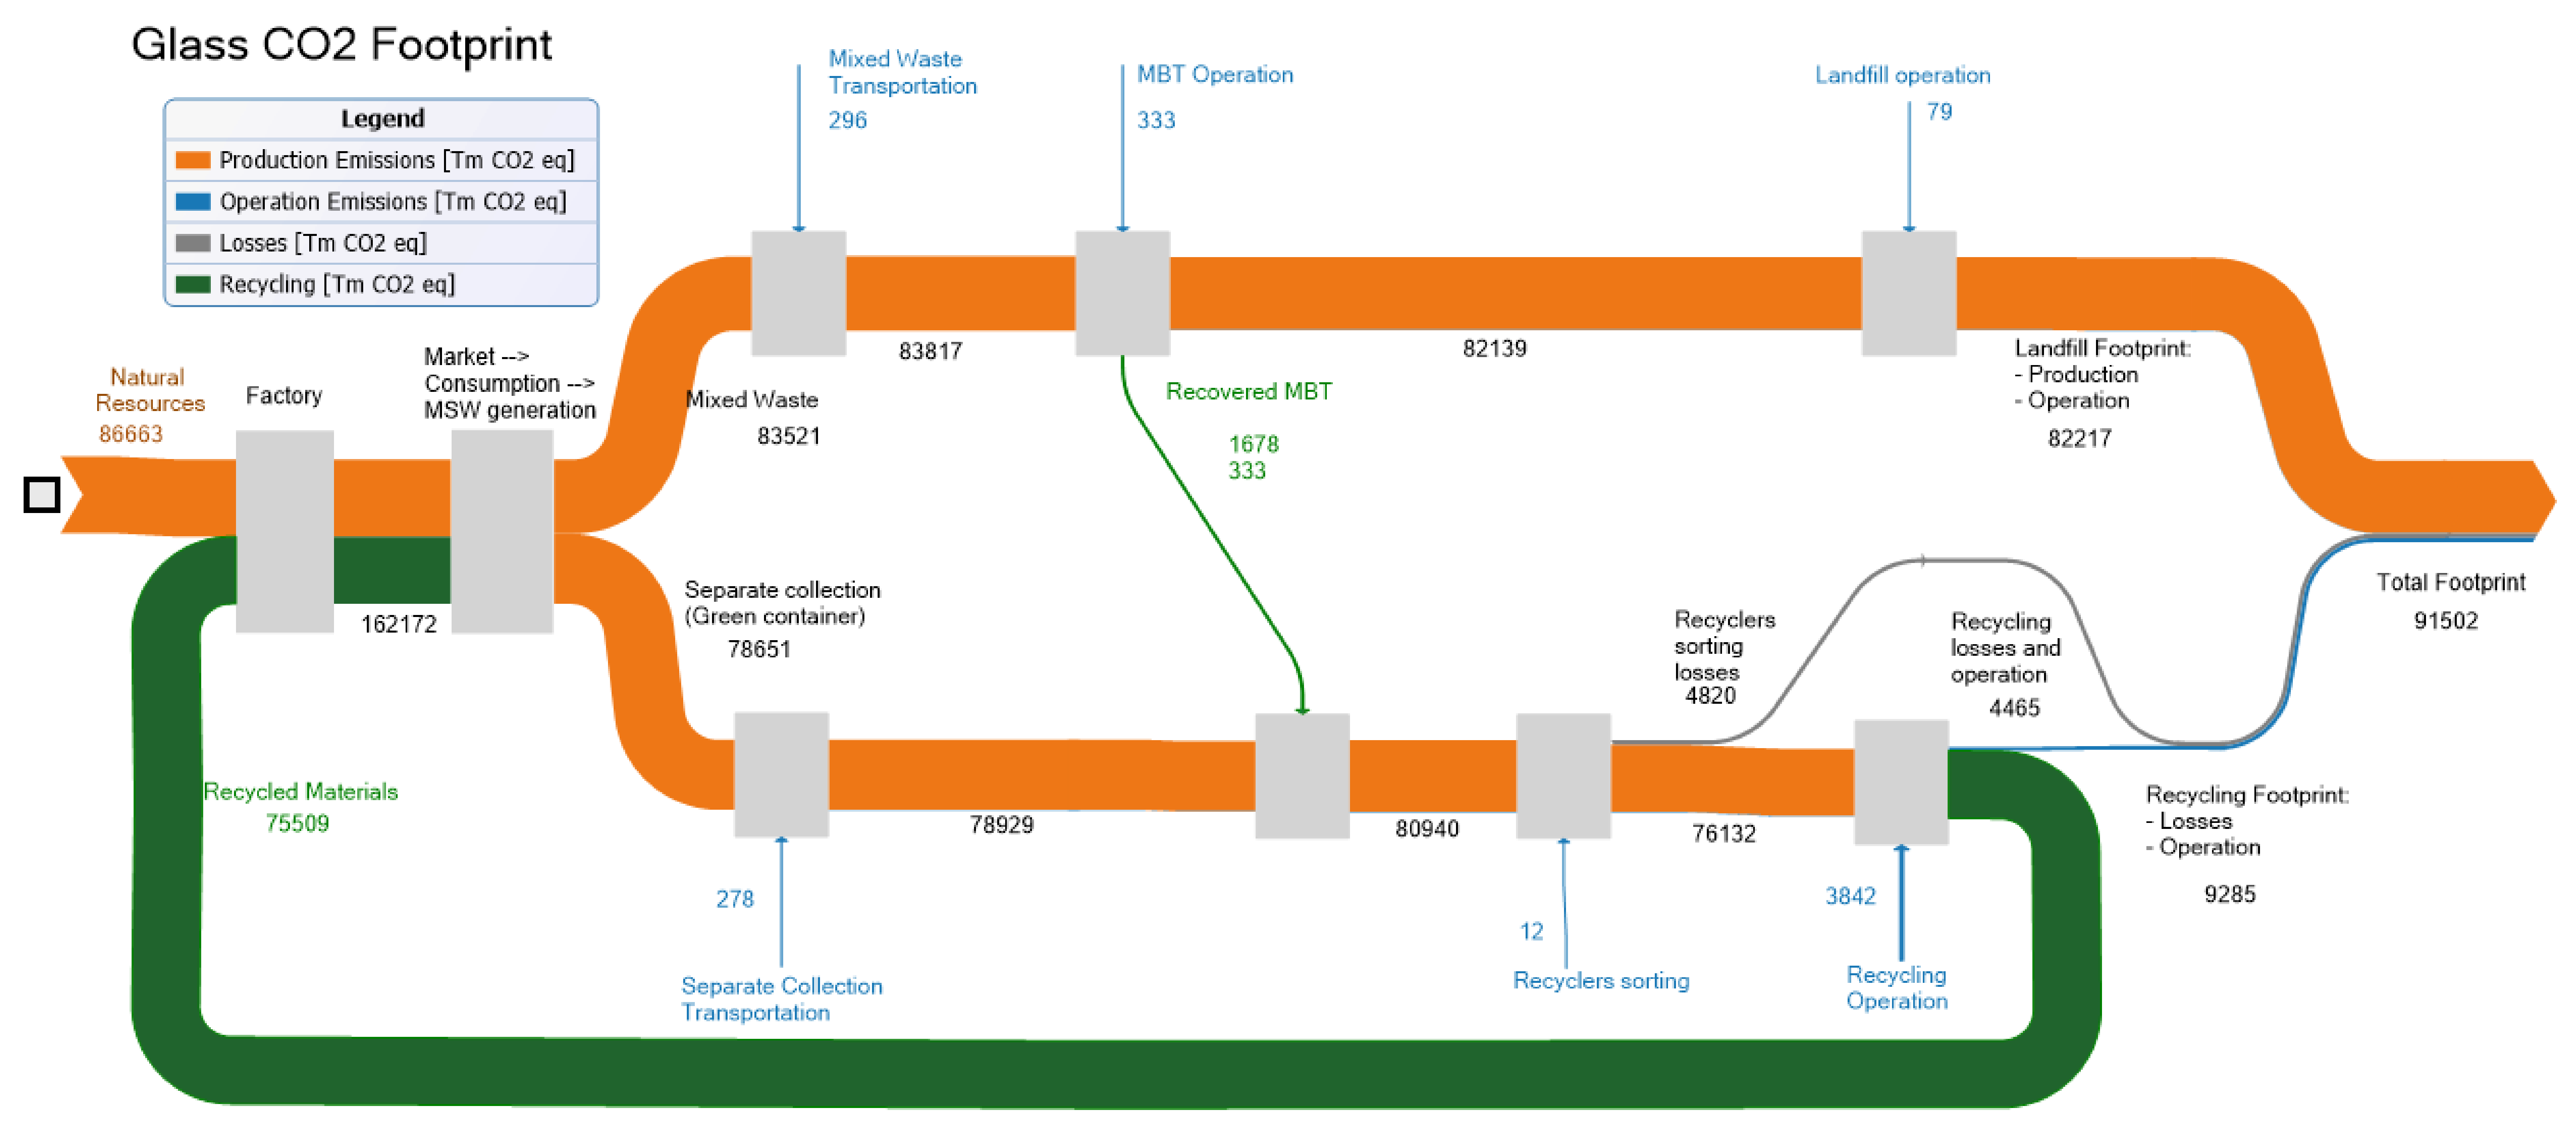
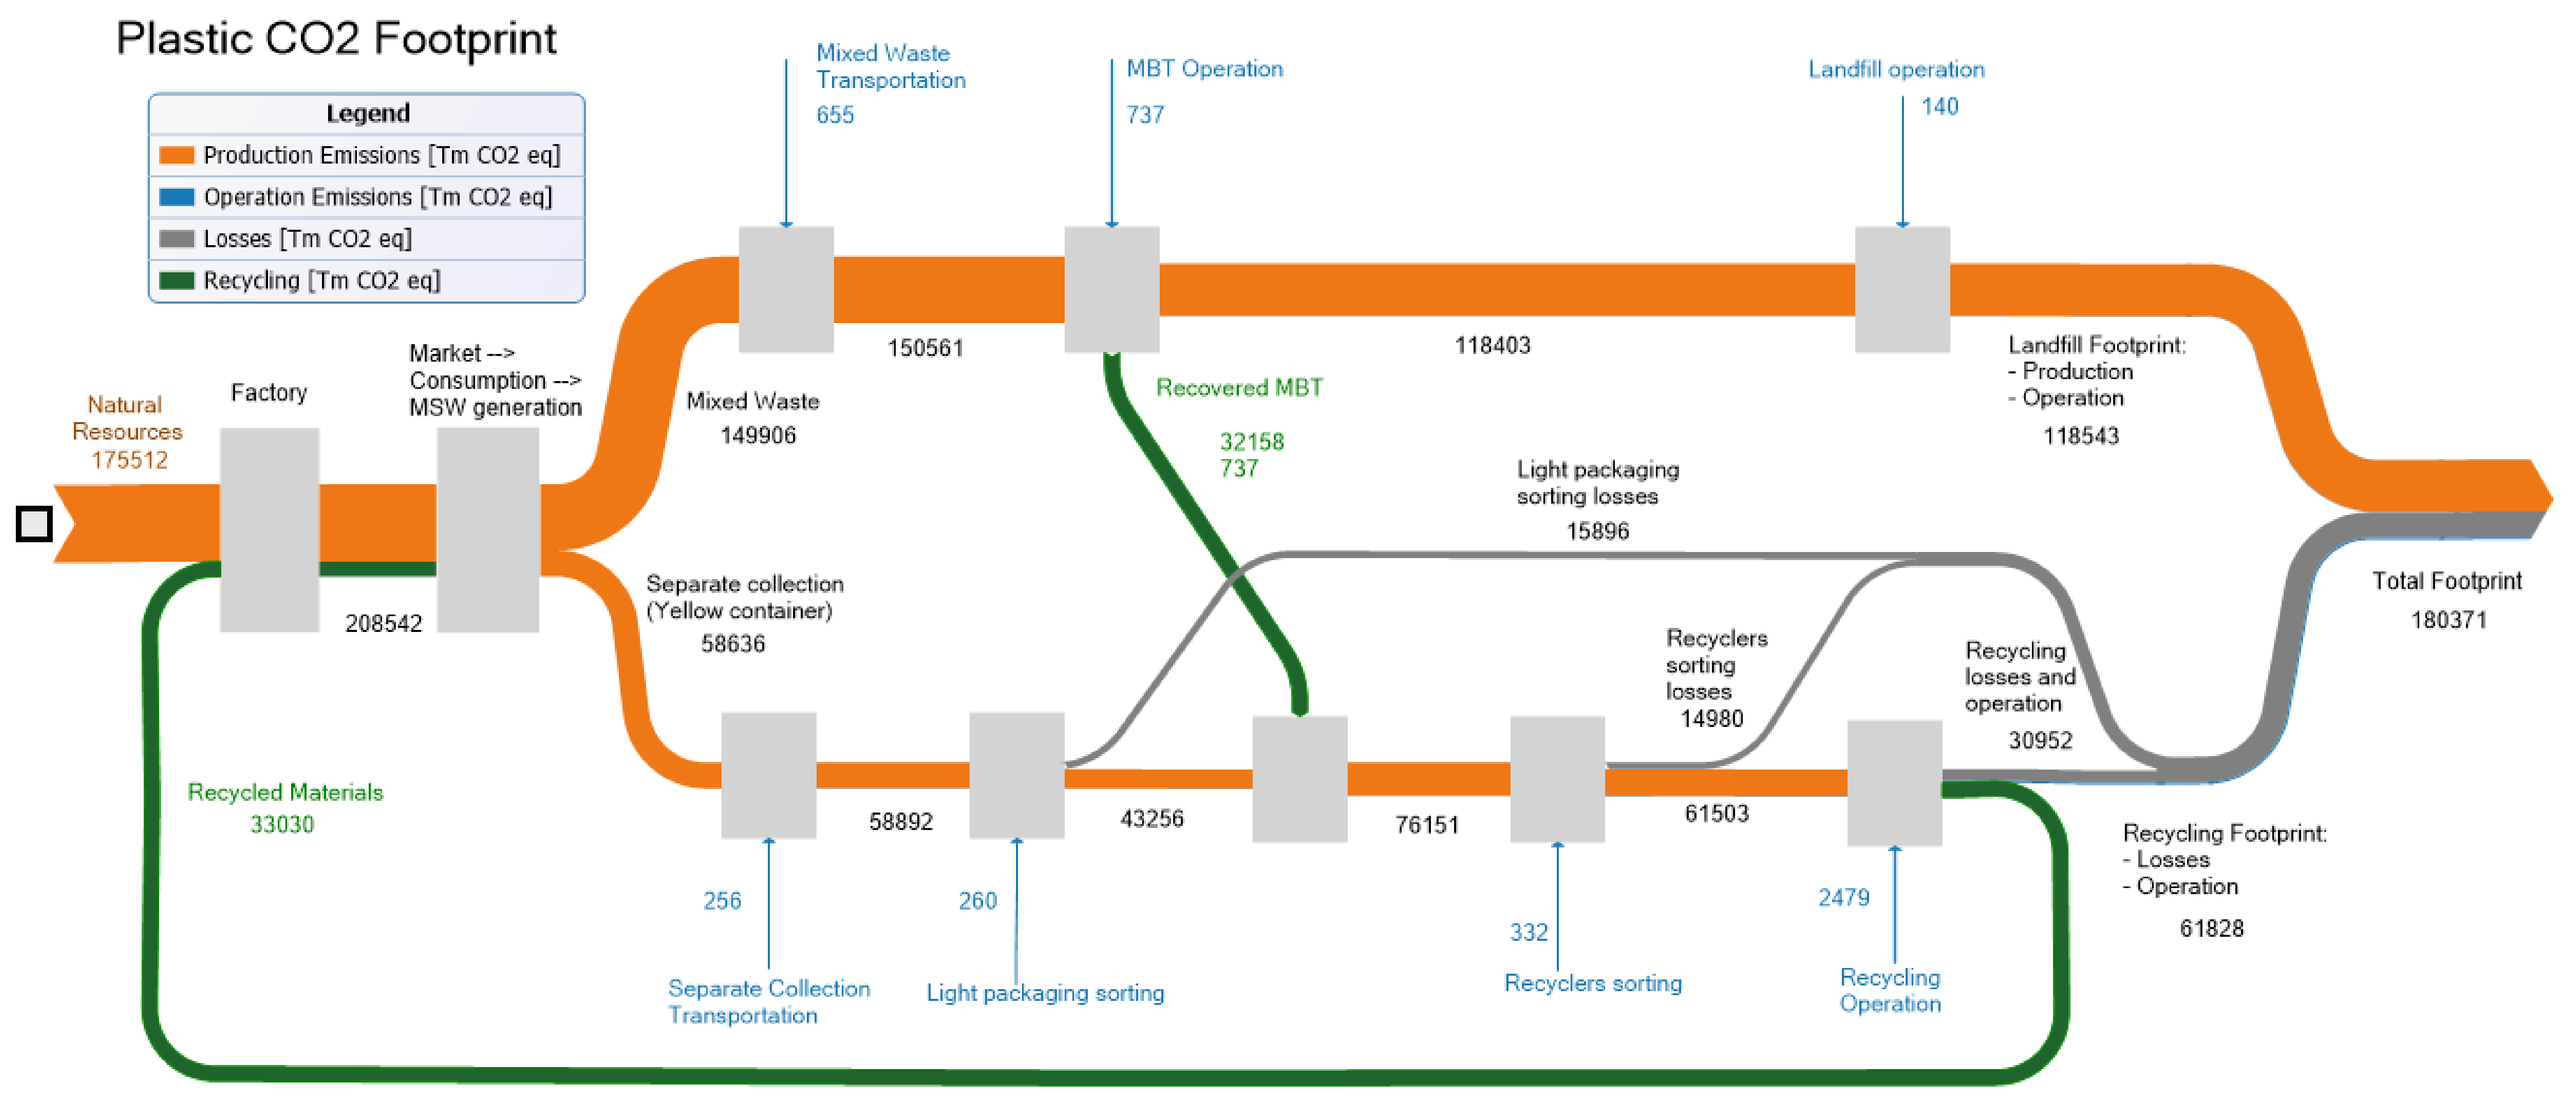
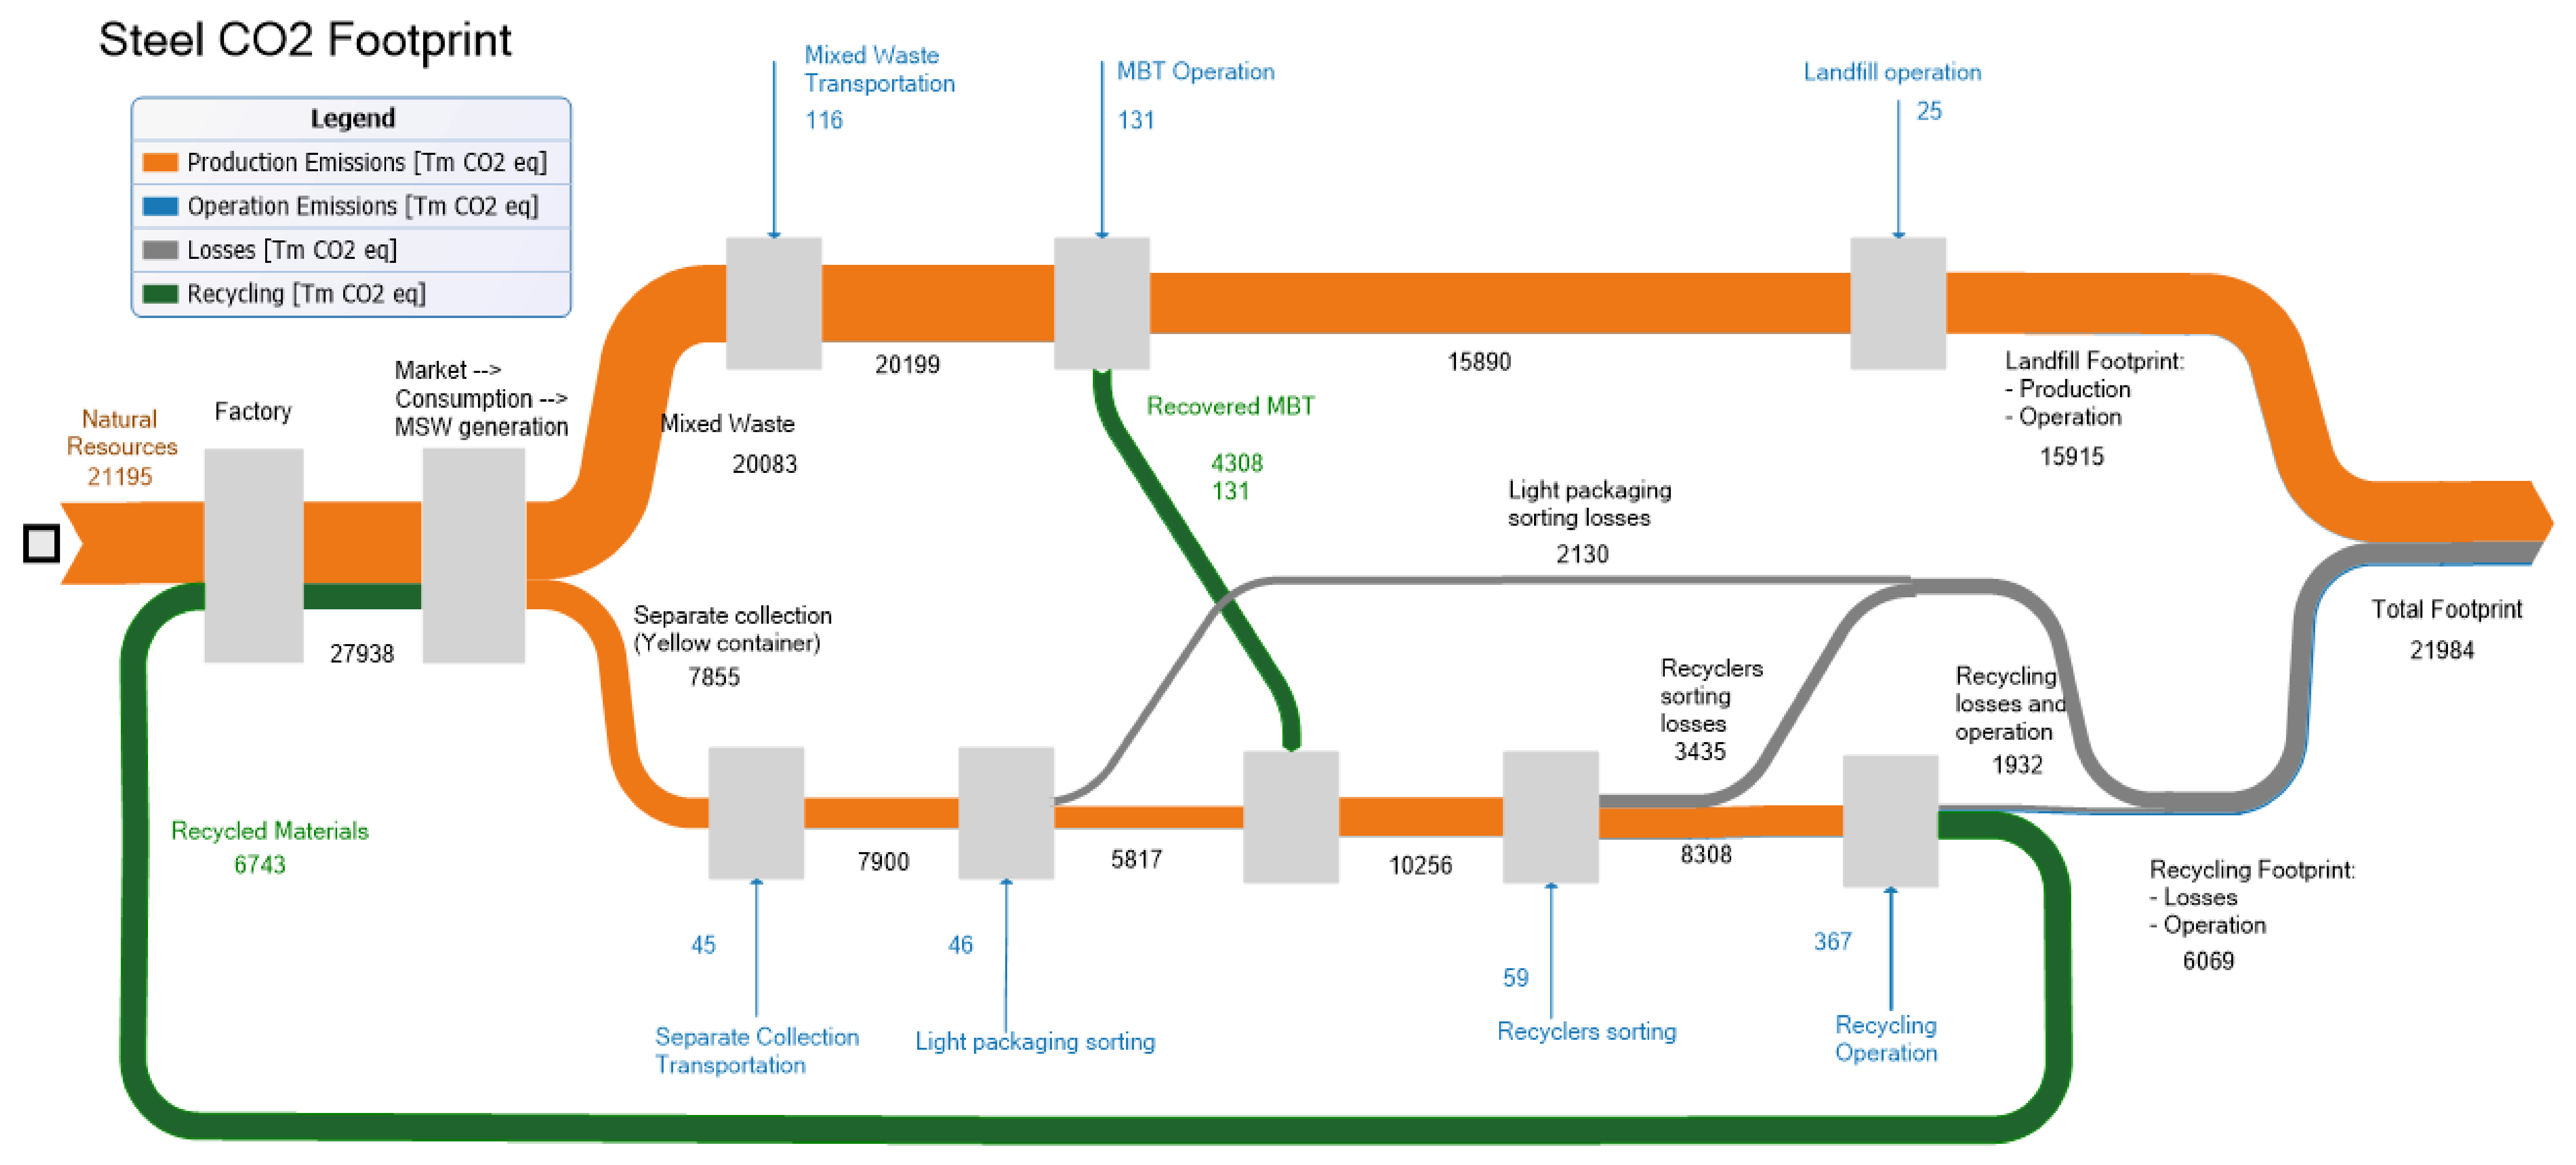
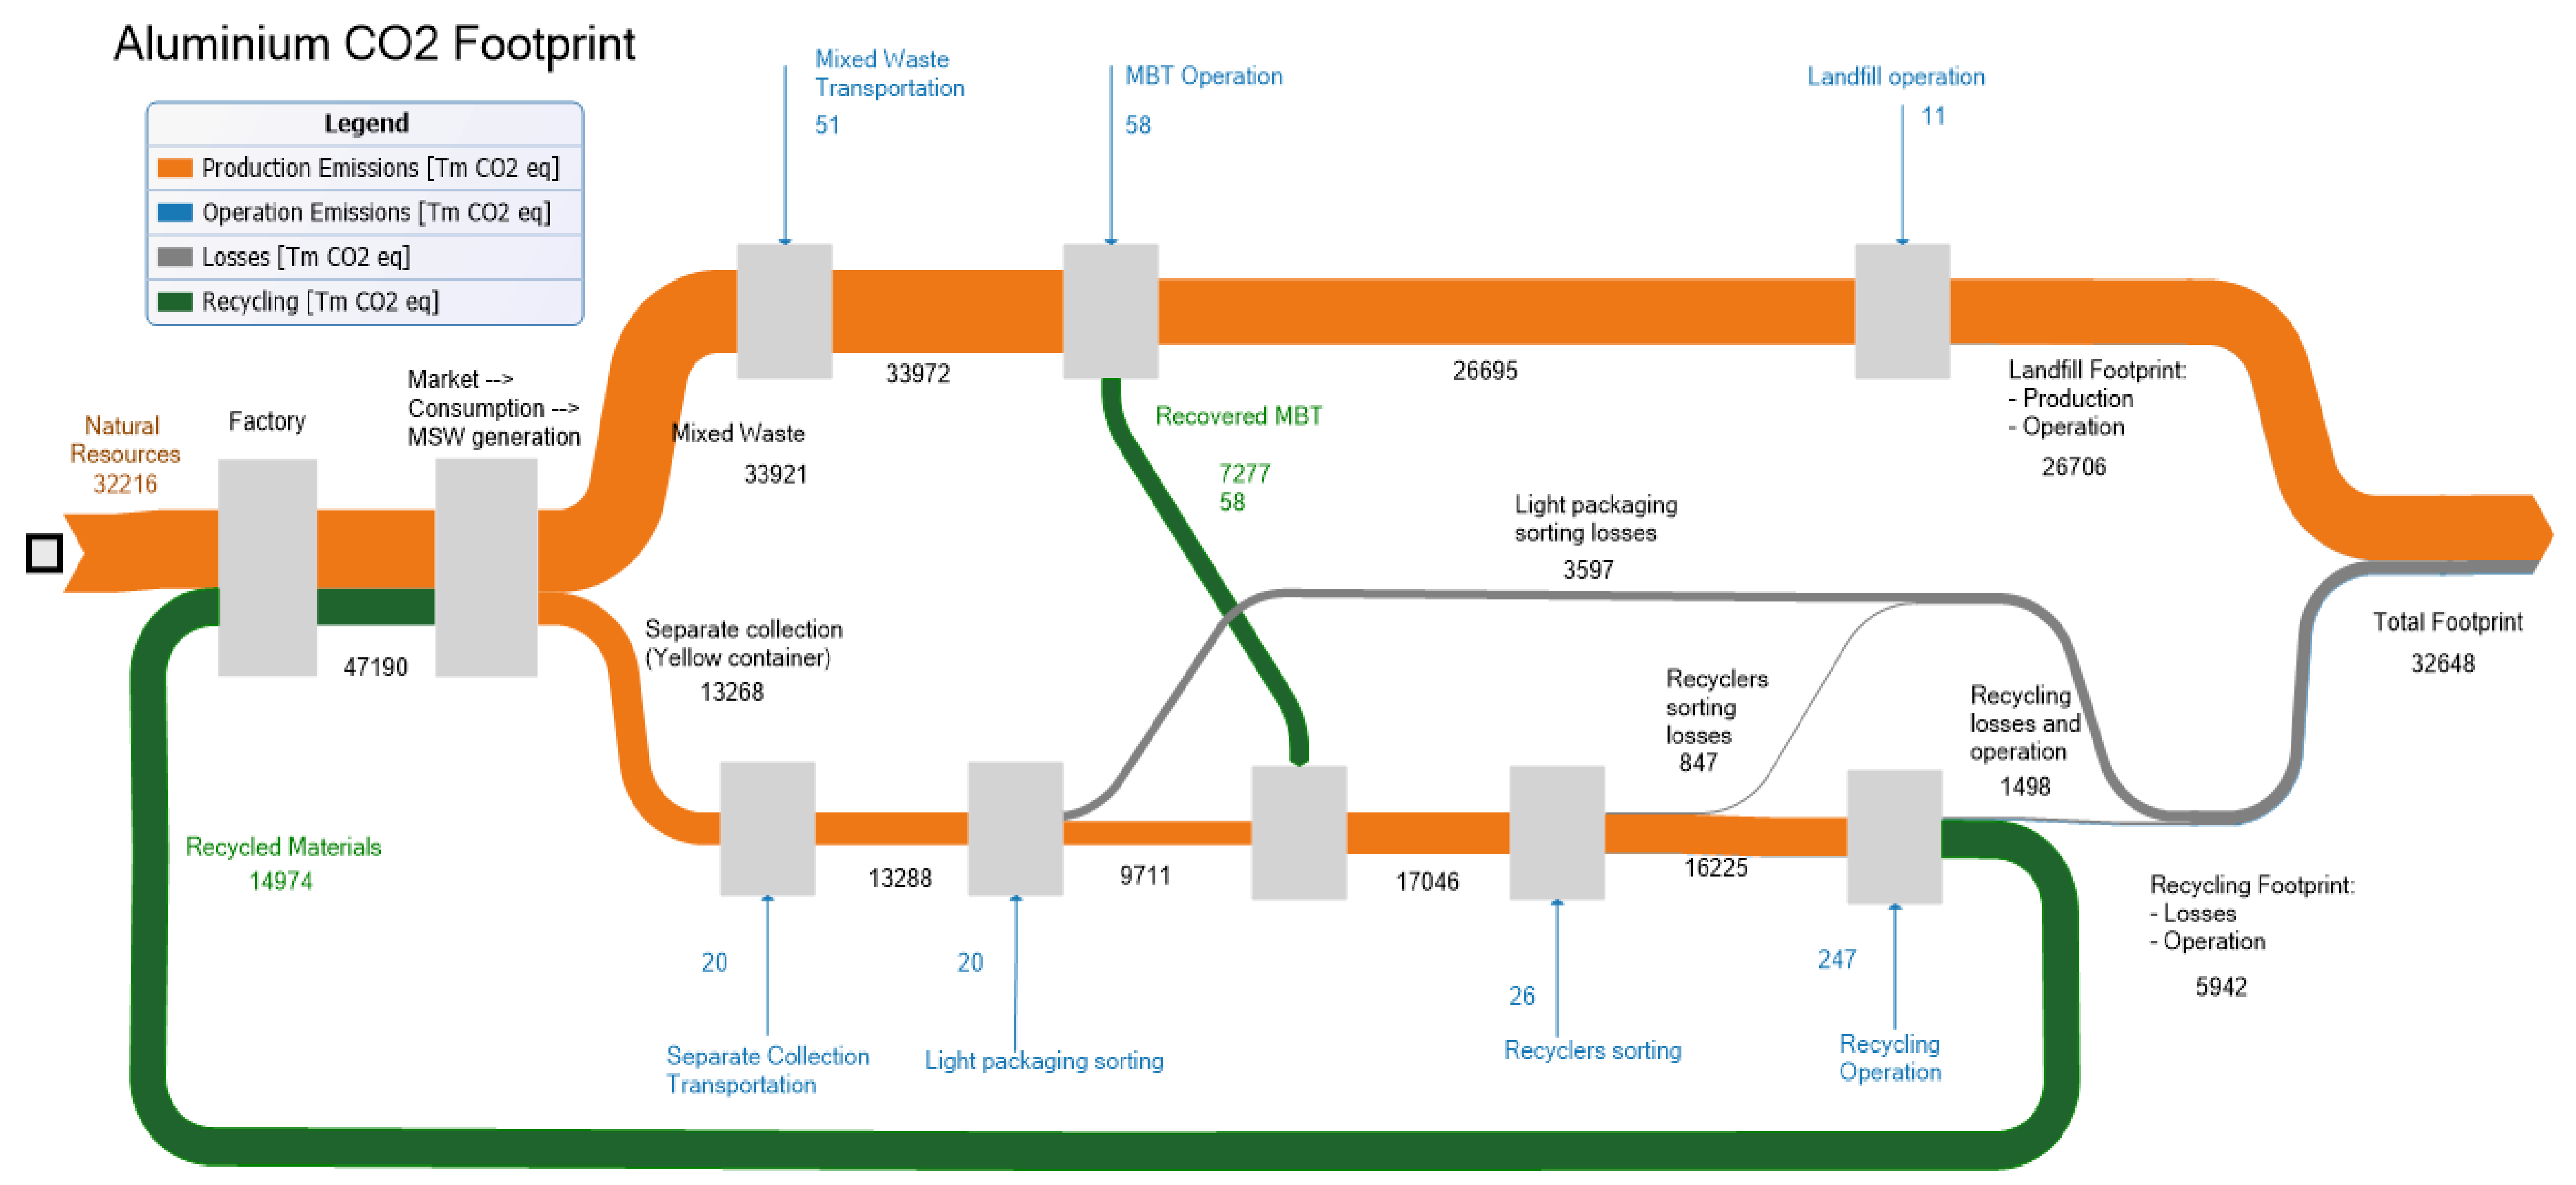
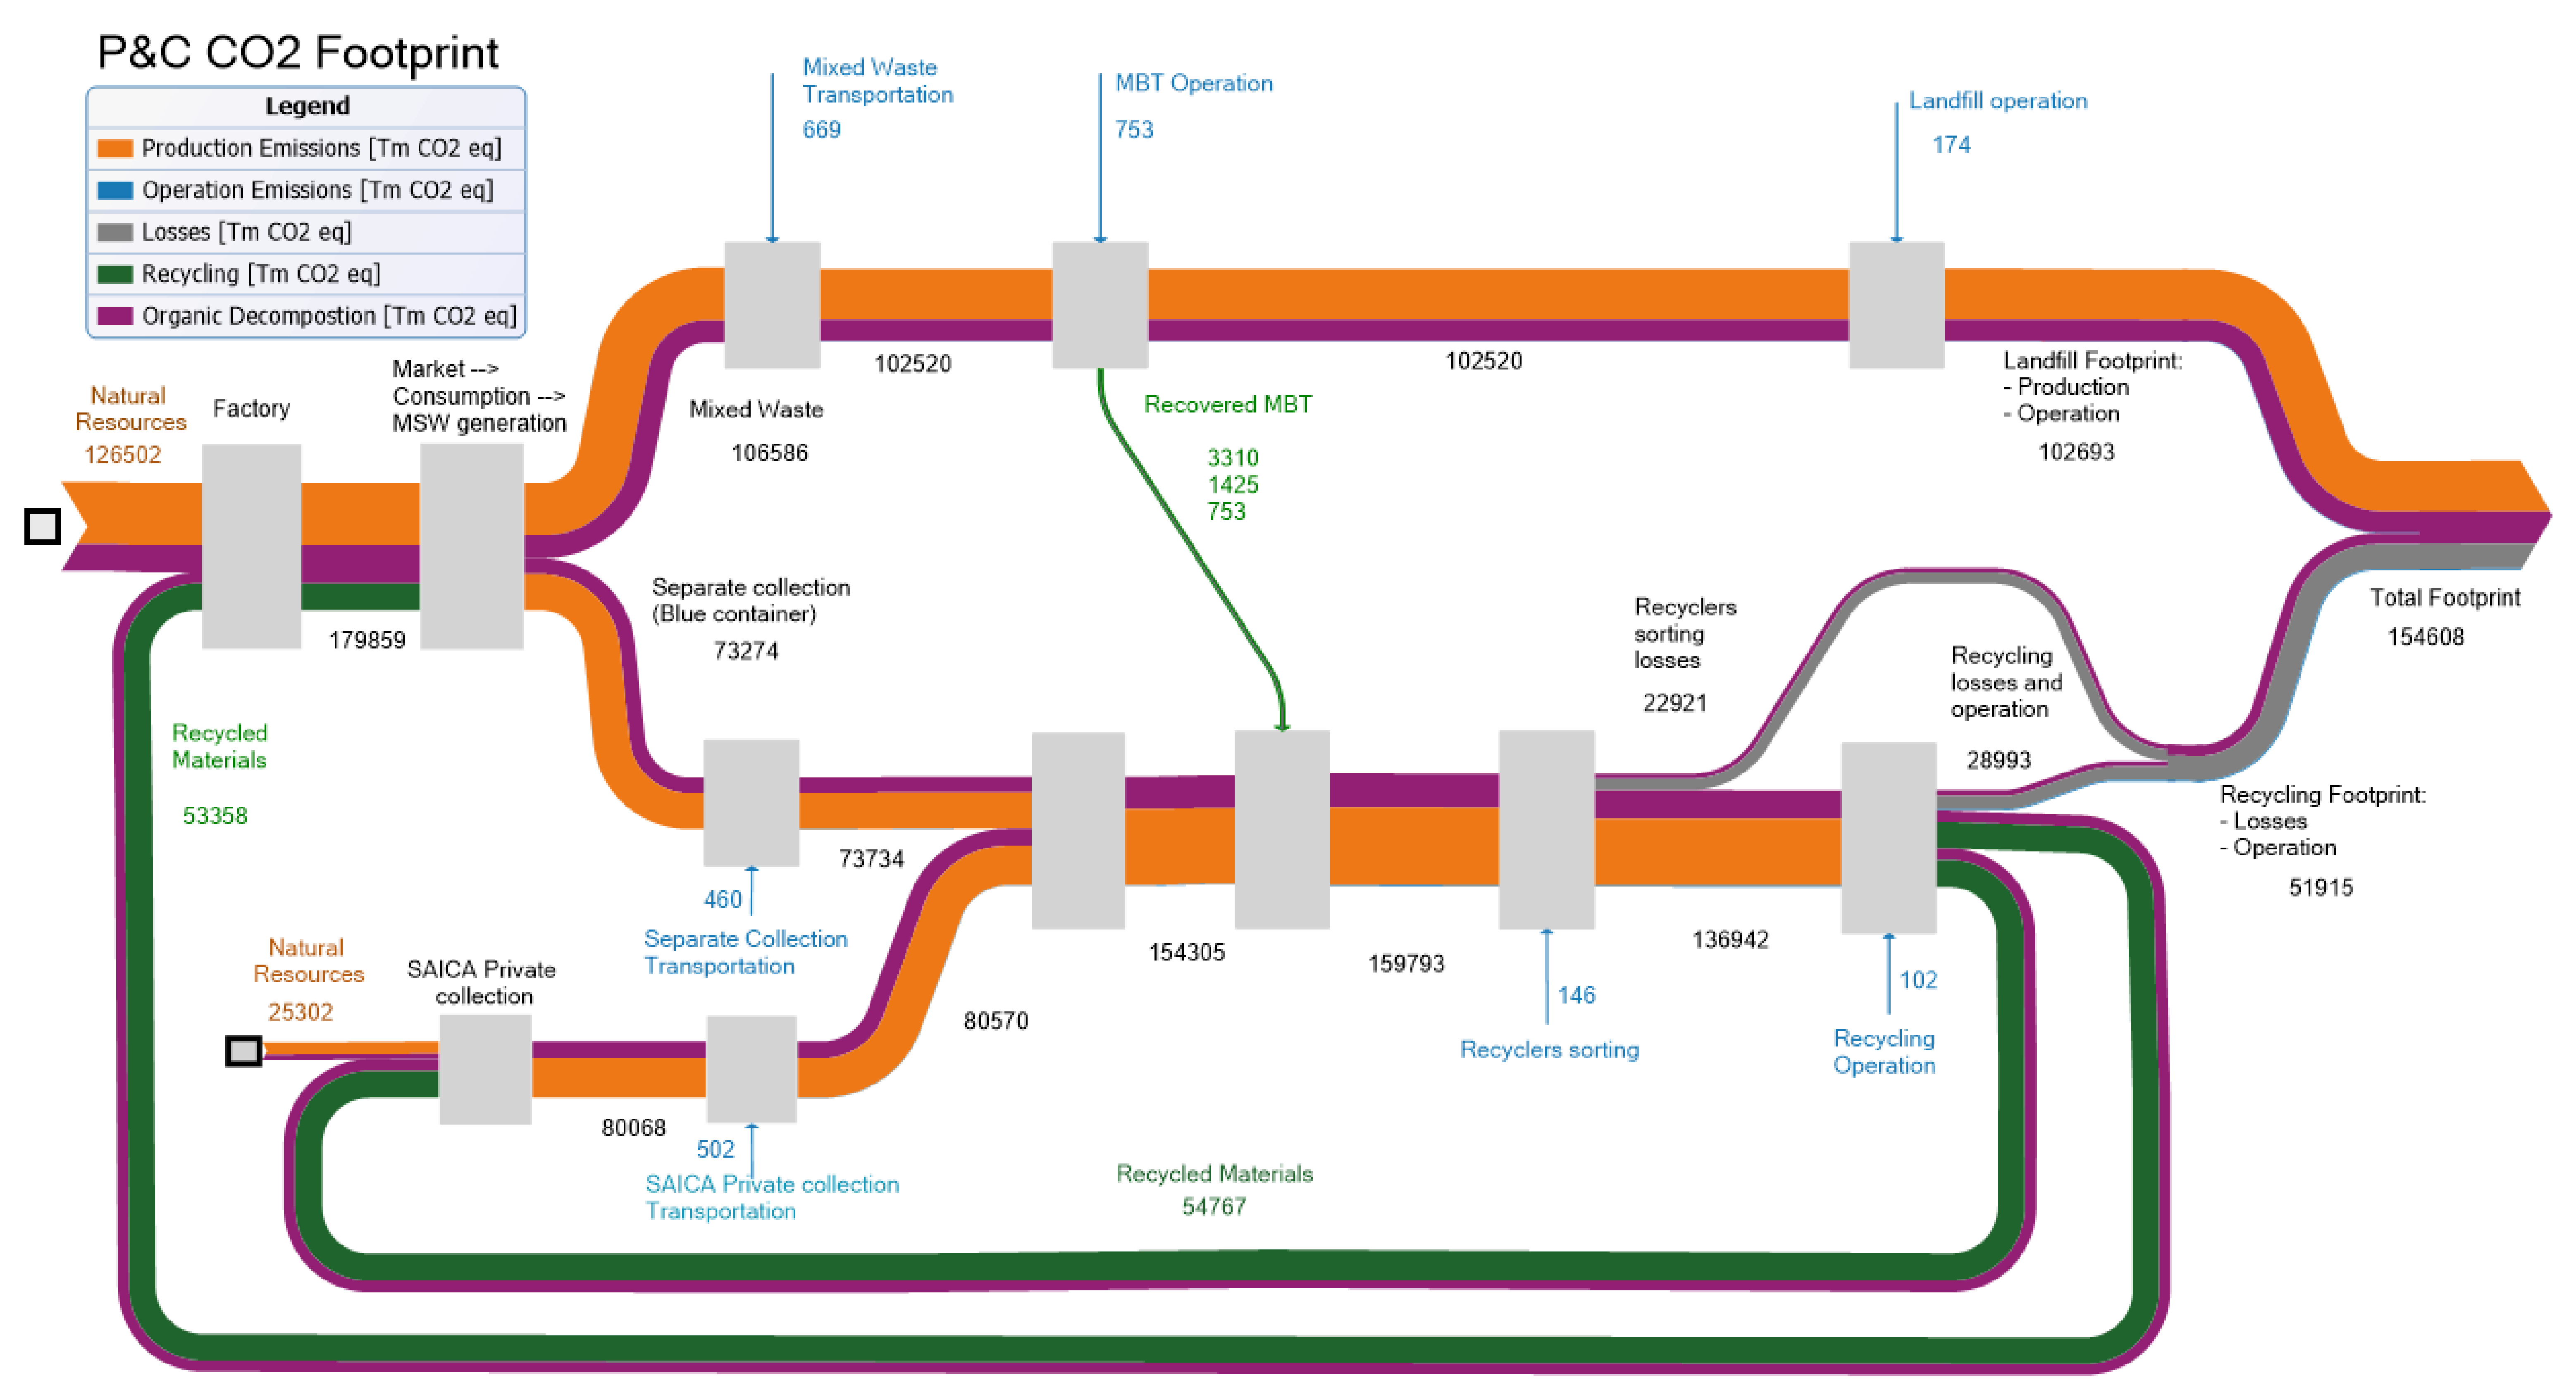
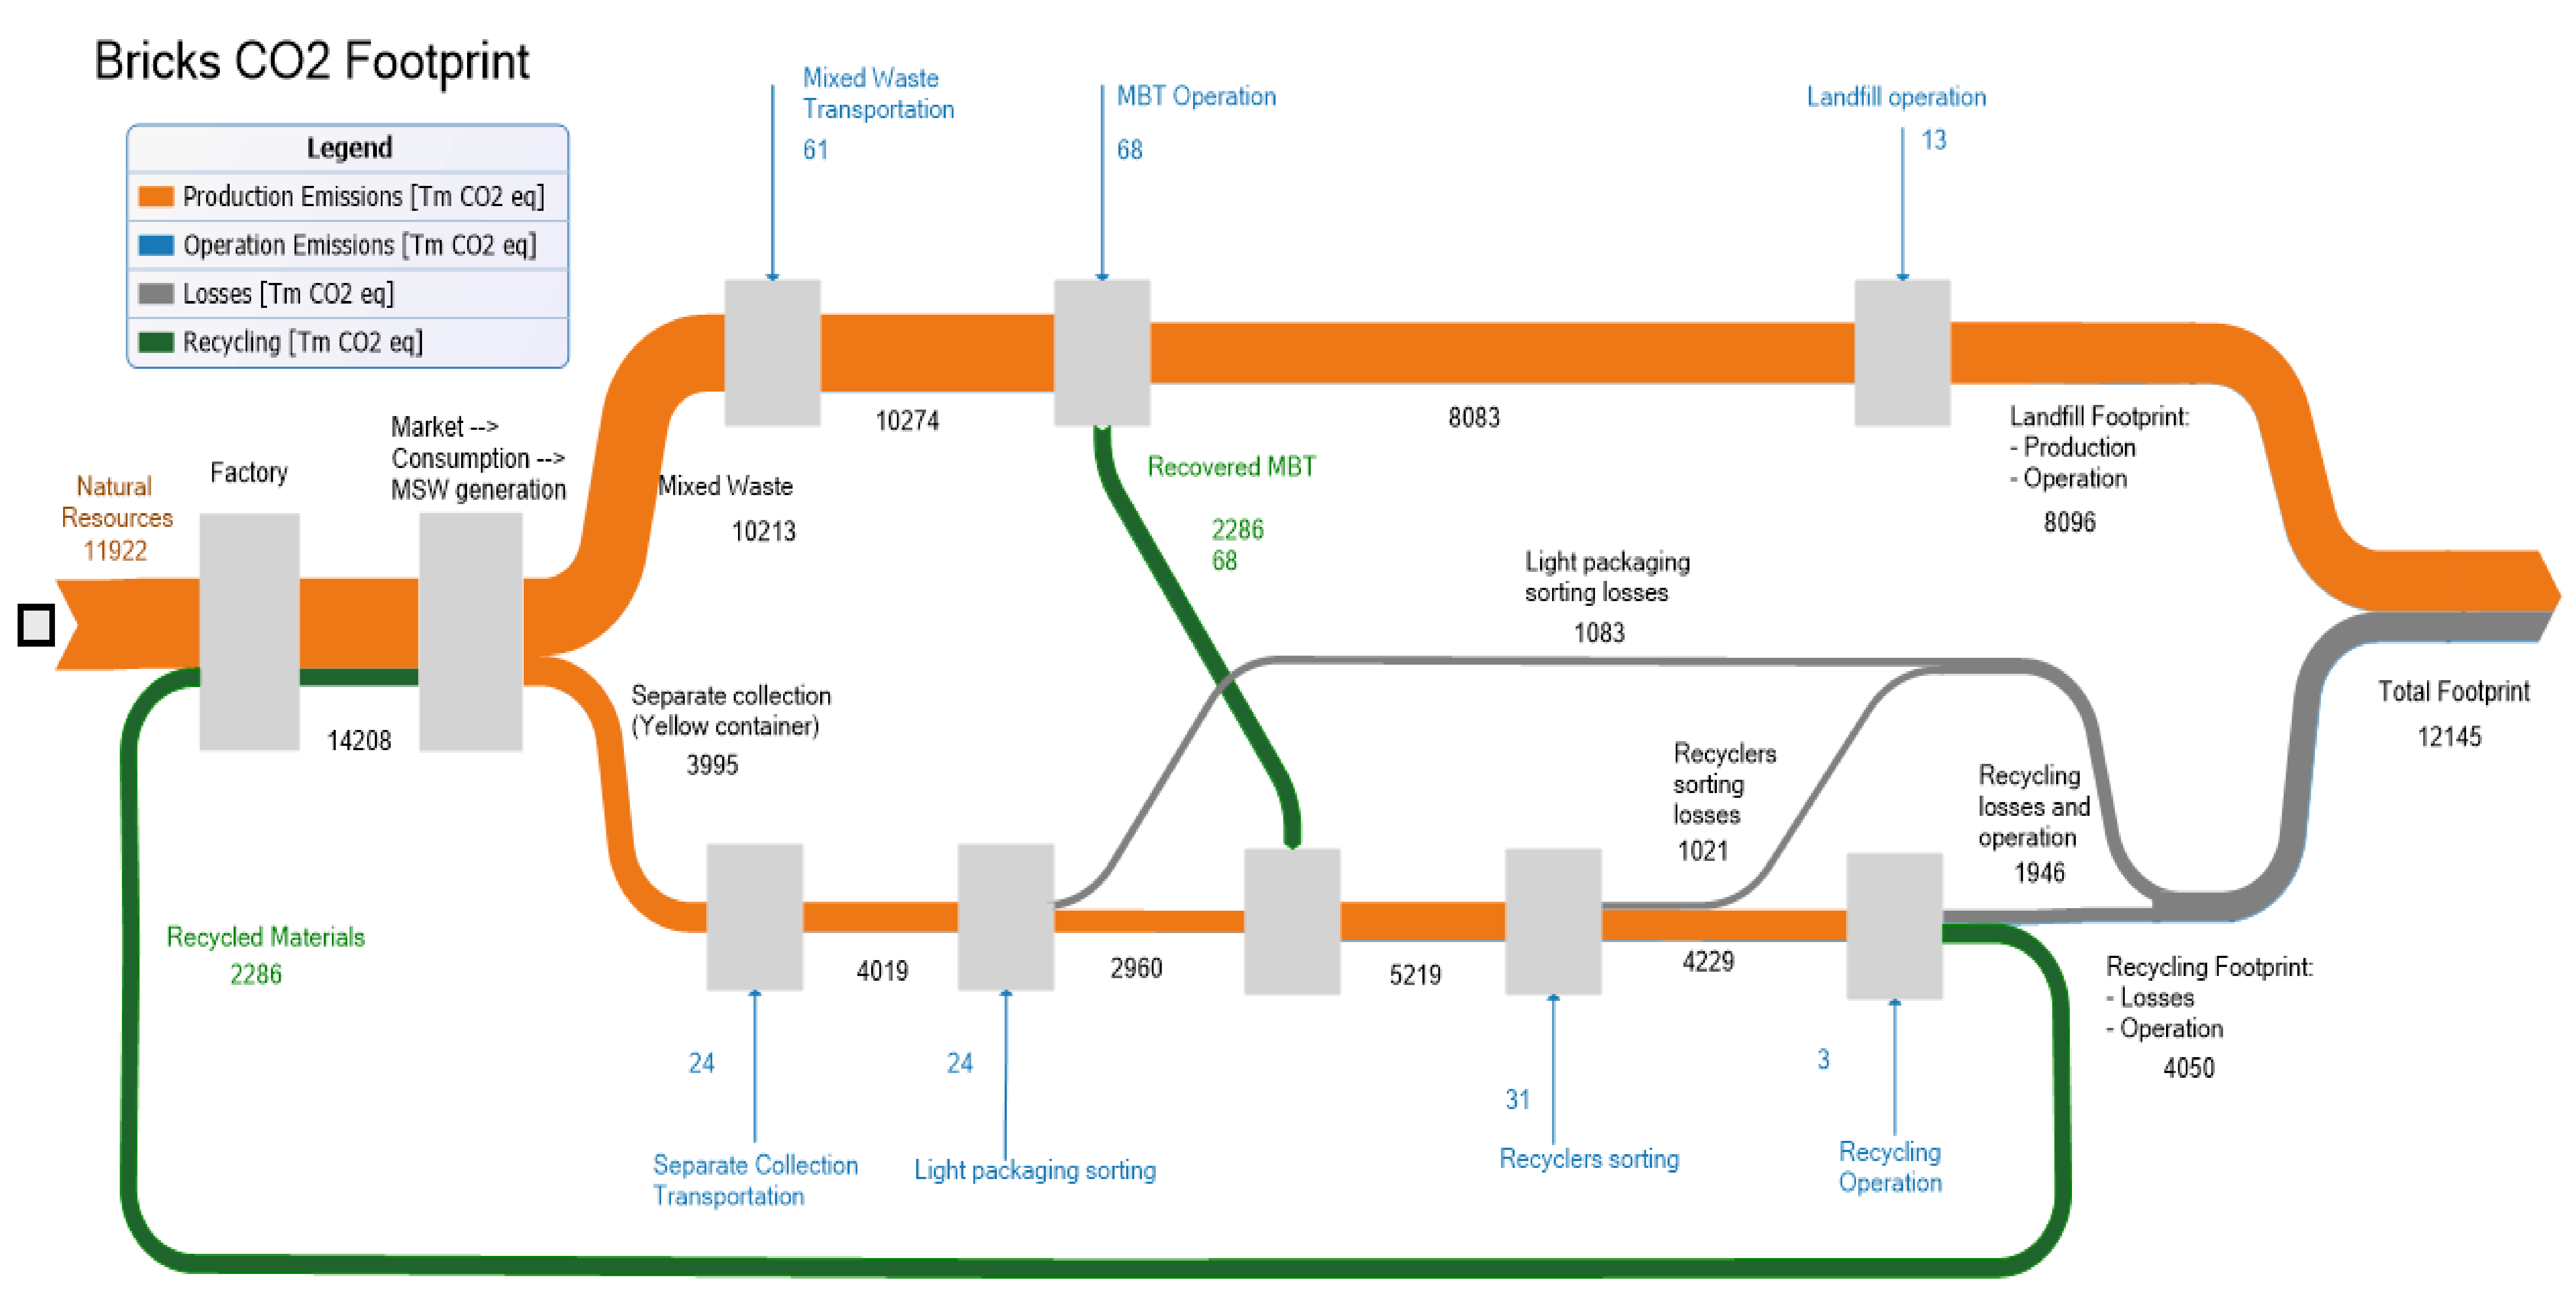
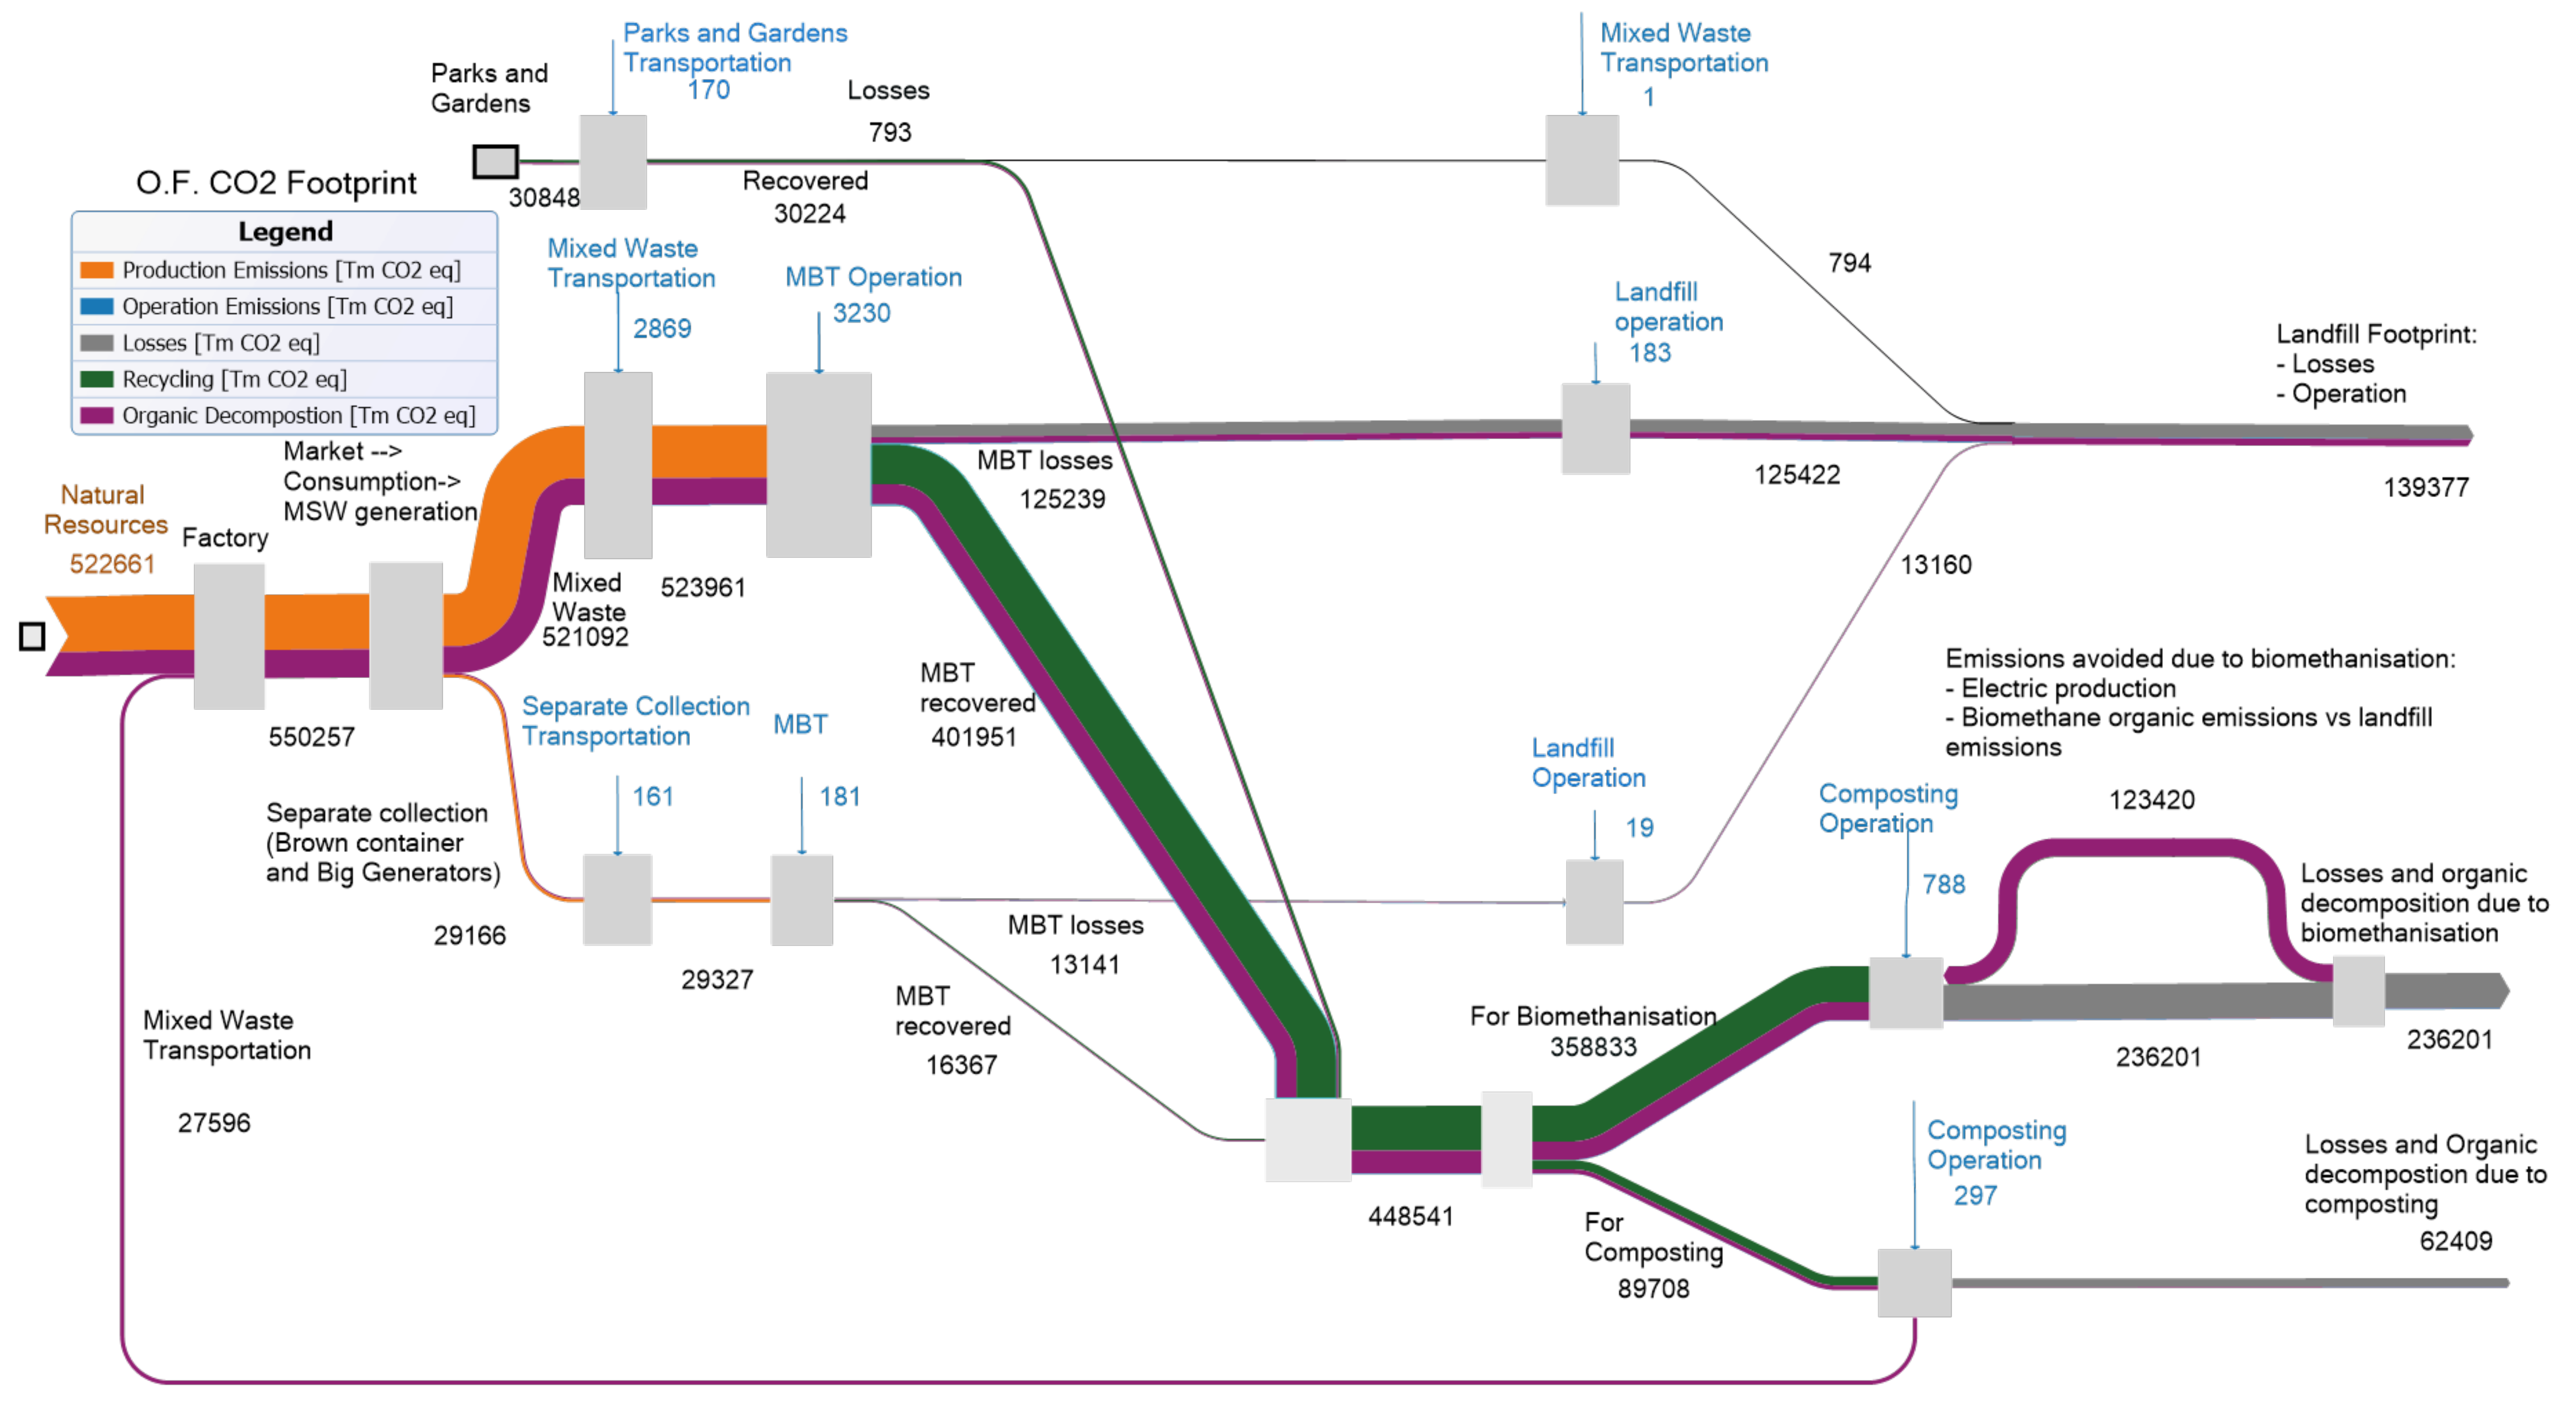
  • Orange (initial Carbon Footprint (CF)): represents all the previous CO2 footprint produced in stage 1 by crops, manufacturing, transport… from the time the raw material is extracted from nature until it reaches the market and can be purchased by the consumer.
  • Blue (operations): represents emissions produced by operations that emit CO2, mainly due to energy consumption. These operations are waste transport, sorting, biomethanization, composting or recycling operations.
  • Red (landfill): indicates that once a waste reaches the landfill, it can no longer be reintroduced into the economy, so its “CO2 backpack” is not recoverable either. In addition, emissions due to the operation of the landfill are also considered.
  • Green (avoided emissions): covers processes that manage to avoid CO2 emissions. These include the production of biomethane, which is used to generate electricity, compost, and recycling processes that reduce the amount of natural resources required.
  • Purple (organic decomposition): This color highlights processes related to organic decomposition. Organic decomposition only occurs if the material comes from living matter, which generates methane with its decomposition. It only affects the organic and P&C fractions as they are of organic origin [36].
The calculation is slightly different for packaging or organic fraction.

2.2.1. Packaging Fraction Data

It is composed of Plastics, Steel, Aluminium and Briks (Lightweight Packaging), P&C and Glass. Table 2 shows the data used to do the calculations. Some references give data on fuel consumption. In these cases, data in Table 3 were used to transform in CO2 eq. emissions.
To calculate the footprint of the packaging fraction, the first step was to calculate the amount of virgin material mass required, which is the difference between total market mass and recycled mass, after accounting for sorting, recycling and downcycling losses. Next, the mass of virgin material was transformed into t CO2 eq. (through the ratios shown in Table 2) and then the emissions from the different operations were added to this initial footprint, i.e., emissions due to transport, MBT operation, recycling and more, which depend on the mass quantity of waste. Thus, the final footprint is the sum of these factors. The avoided emissions are because less virgin material product is needed due to recycling.

2.2.2. Organic Fraction Data

Table 4 shows the data used to transform tons of waste into tons of CO2 eq., as explained in the previous section.
On the other hand, Table 5 shows the specific organic waste treatment processes data: composting and biomethanization. These processes emit CO2 eq. due to energy consumption (operation) and organic decomposition, which generates methane. On the other hand, they can avoid part of their CO2 footprint by avoiding the use of inorganic fertilizers—in the case of composting—and by generating electricity—in the case of biomethanization.
In the case of the organic fraction, all organic waste generated after consumption were transformed into CO2 eq. emissions with the proportions shown in Table 4. Then, all emissions due to transport and operation, which depend on the mass of waste generated, were added. In this case, emissions were avoided by producing compost and electricity, so the avoided emissions are shown with a negative sign in Table 5, as they are subtracted from the total emissions. In addition, the composting and biomethanization processes have lower organic decomposition emissions compared to the landfill composition and therefore more emissions are avoided due to this.

2.3. City Council Strategies Data

The above method was used to analyze the environmental benefit—in terms of CO2—that some strategies carried out in other municipalities could have in Zaragoza. These strategies aim to influence the behavior of H&B to encourage them to separate waste. The strategies analyzed are as follows:
  • Deposit Return System (DRS) implementation: According to the What We Waste report published by Reloop [44], the country’s typical DRS has an average return rates of 89% for cans and 87% for glass. However, in the case of Zaragoza there are some legislative barriers in this respect (see Appendix A).
  • Door-to-door commercial collection with identification code. The Spanish city of Lleida uses the door-to-door commercial collection system, using personalized bags incorporating a TAG [45]. Thanks to this system, the city increased selective collection by 4.8 percentage points (pp) between 2016 and 2017.
  • Improved collection and quality of the organic fraction: the implementation of electronic card-opening locks on the organic fraction containers makes it possible to verify the effective use of the containers, applying a reduced rate to all those families who deposit the organic fraction in the container. As a result, the Mancomunidad del Txingudi (Basque Country, Spain) increased selective collection in 10.8% [46].

3. MSW Analysis Results

3.1. Analysis of the MSW Flow in Zaragoza

Before analyzing the UM using the method proposed in Section 2.2., an analysis of the flows of the main fractions that compose the MSW from Zaragoza city was carried out.

3.1.1. Temporal Evolution of Zaragoza’s MSW

Table 6 shows the evolution between 2016 and 2019 of the main fractions in the city (approximately 70% of MSW): mixed waste, light packaging, P&C and glass. In addition, the mixed waste fraction was divided into its main constituent fractions according to the data provided in the GIRA plan [32].
Total waste per capita increases steadily over the indicated period, at an approximate annual rate of 1.3% (Table 6). Moreover, population increases between 2016–2019, which results in a growth of MSW, at an annual rate of approximately 2%. According to European objectives, the waste generated should be reduced by 10% in 2020 compared to 2010 [2] and, in the case of Zaragoza’s MSW, not only is it not being reduced, but it is increasing.
On the other hand, separate collection (light packaging, P&C, and glass) increase year after year. This situation could be considered good news (and some SIG (see Appendix A) [47] consider it to be so), but nothing could be further from the truth, since the quantities of these fractions that are not collected separately, and therefore end up in the mixed waste fraction, are also increasing. For example, in the light packaging fraction between 2017 and 2018, it is observed that 0.4 kg per inhabitant more was collected separately, but also 1 kg per inhabitant more ended up in the mixed waste fraction, making the apparent improvement in the separate collection not happen.

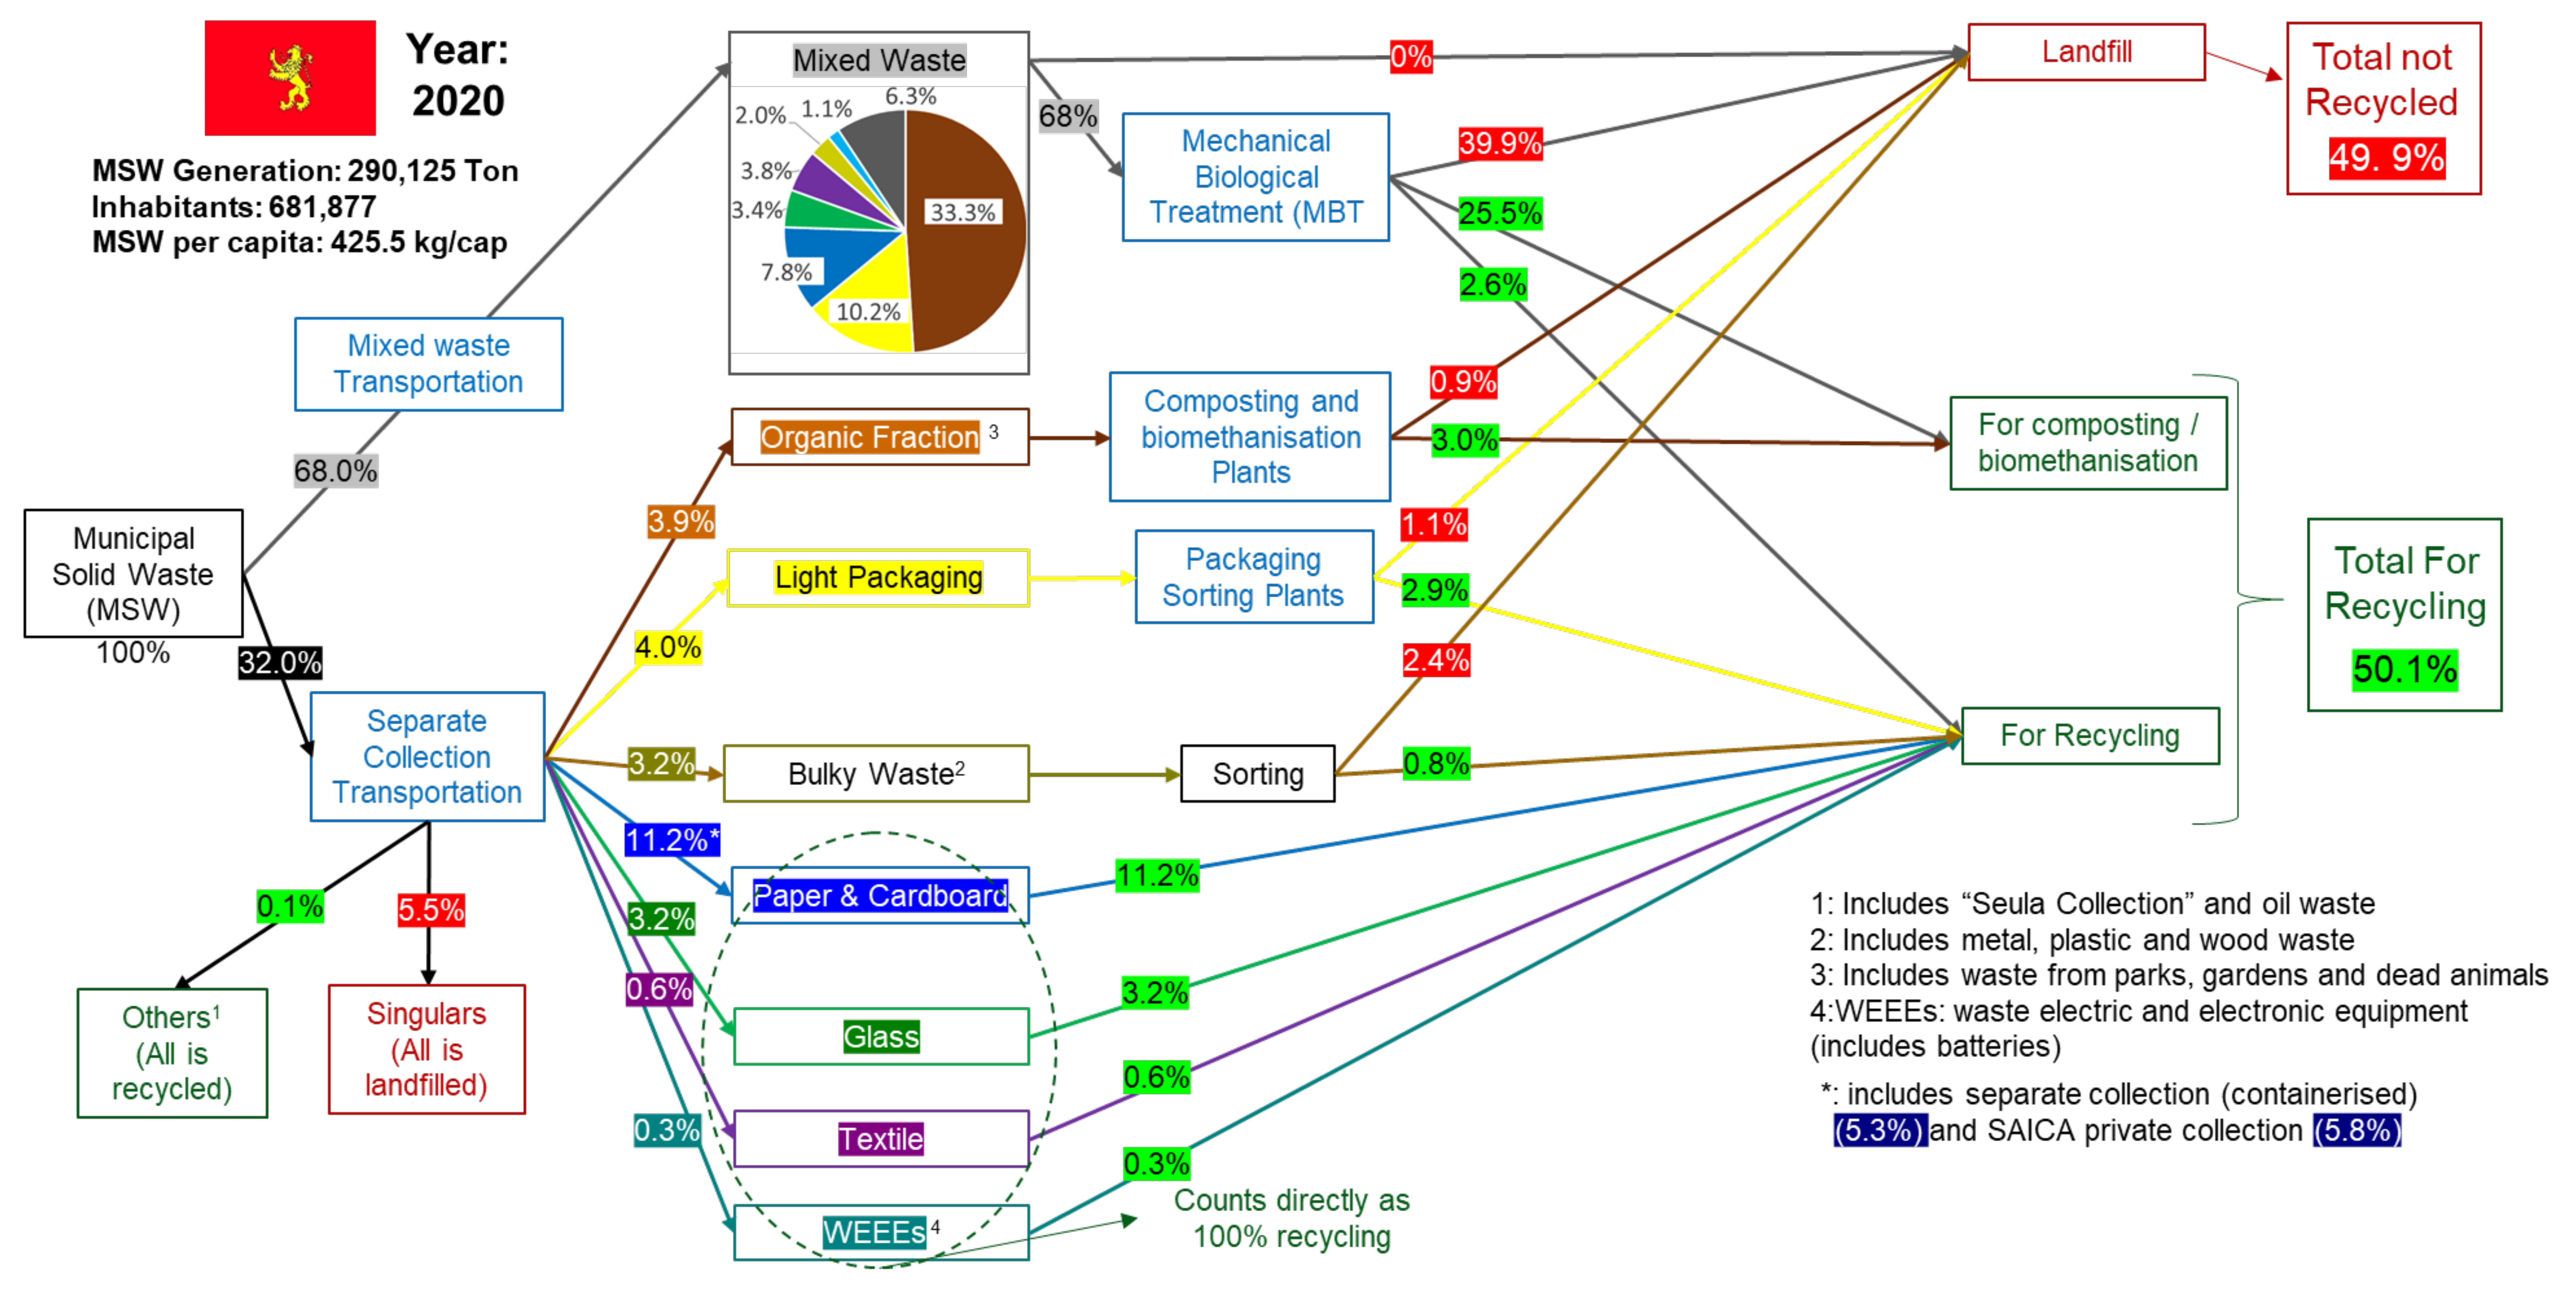
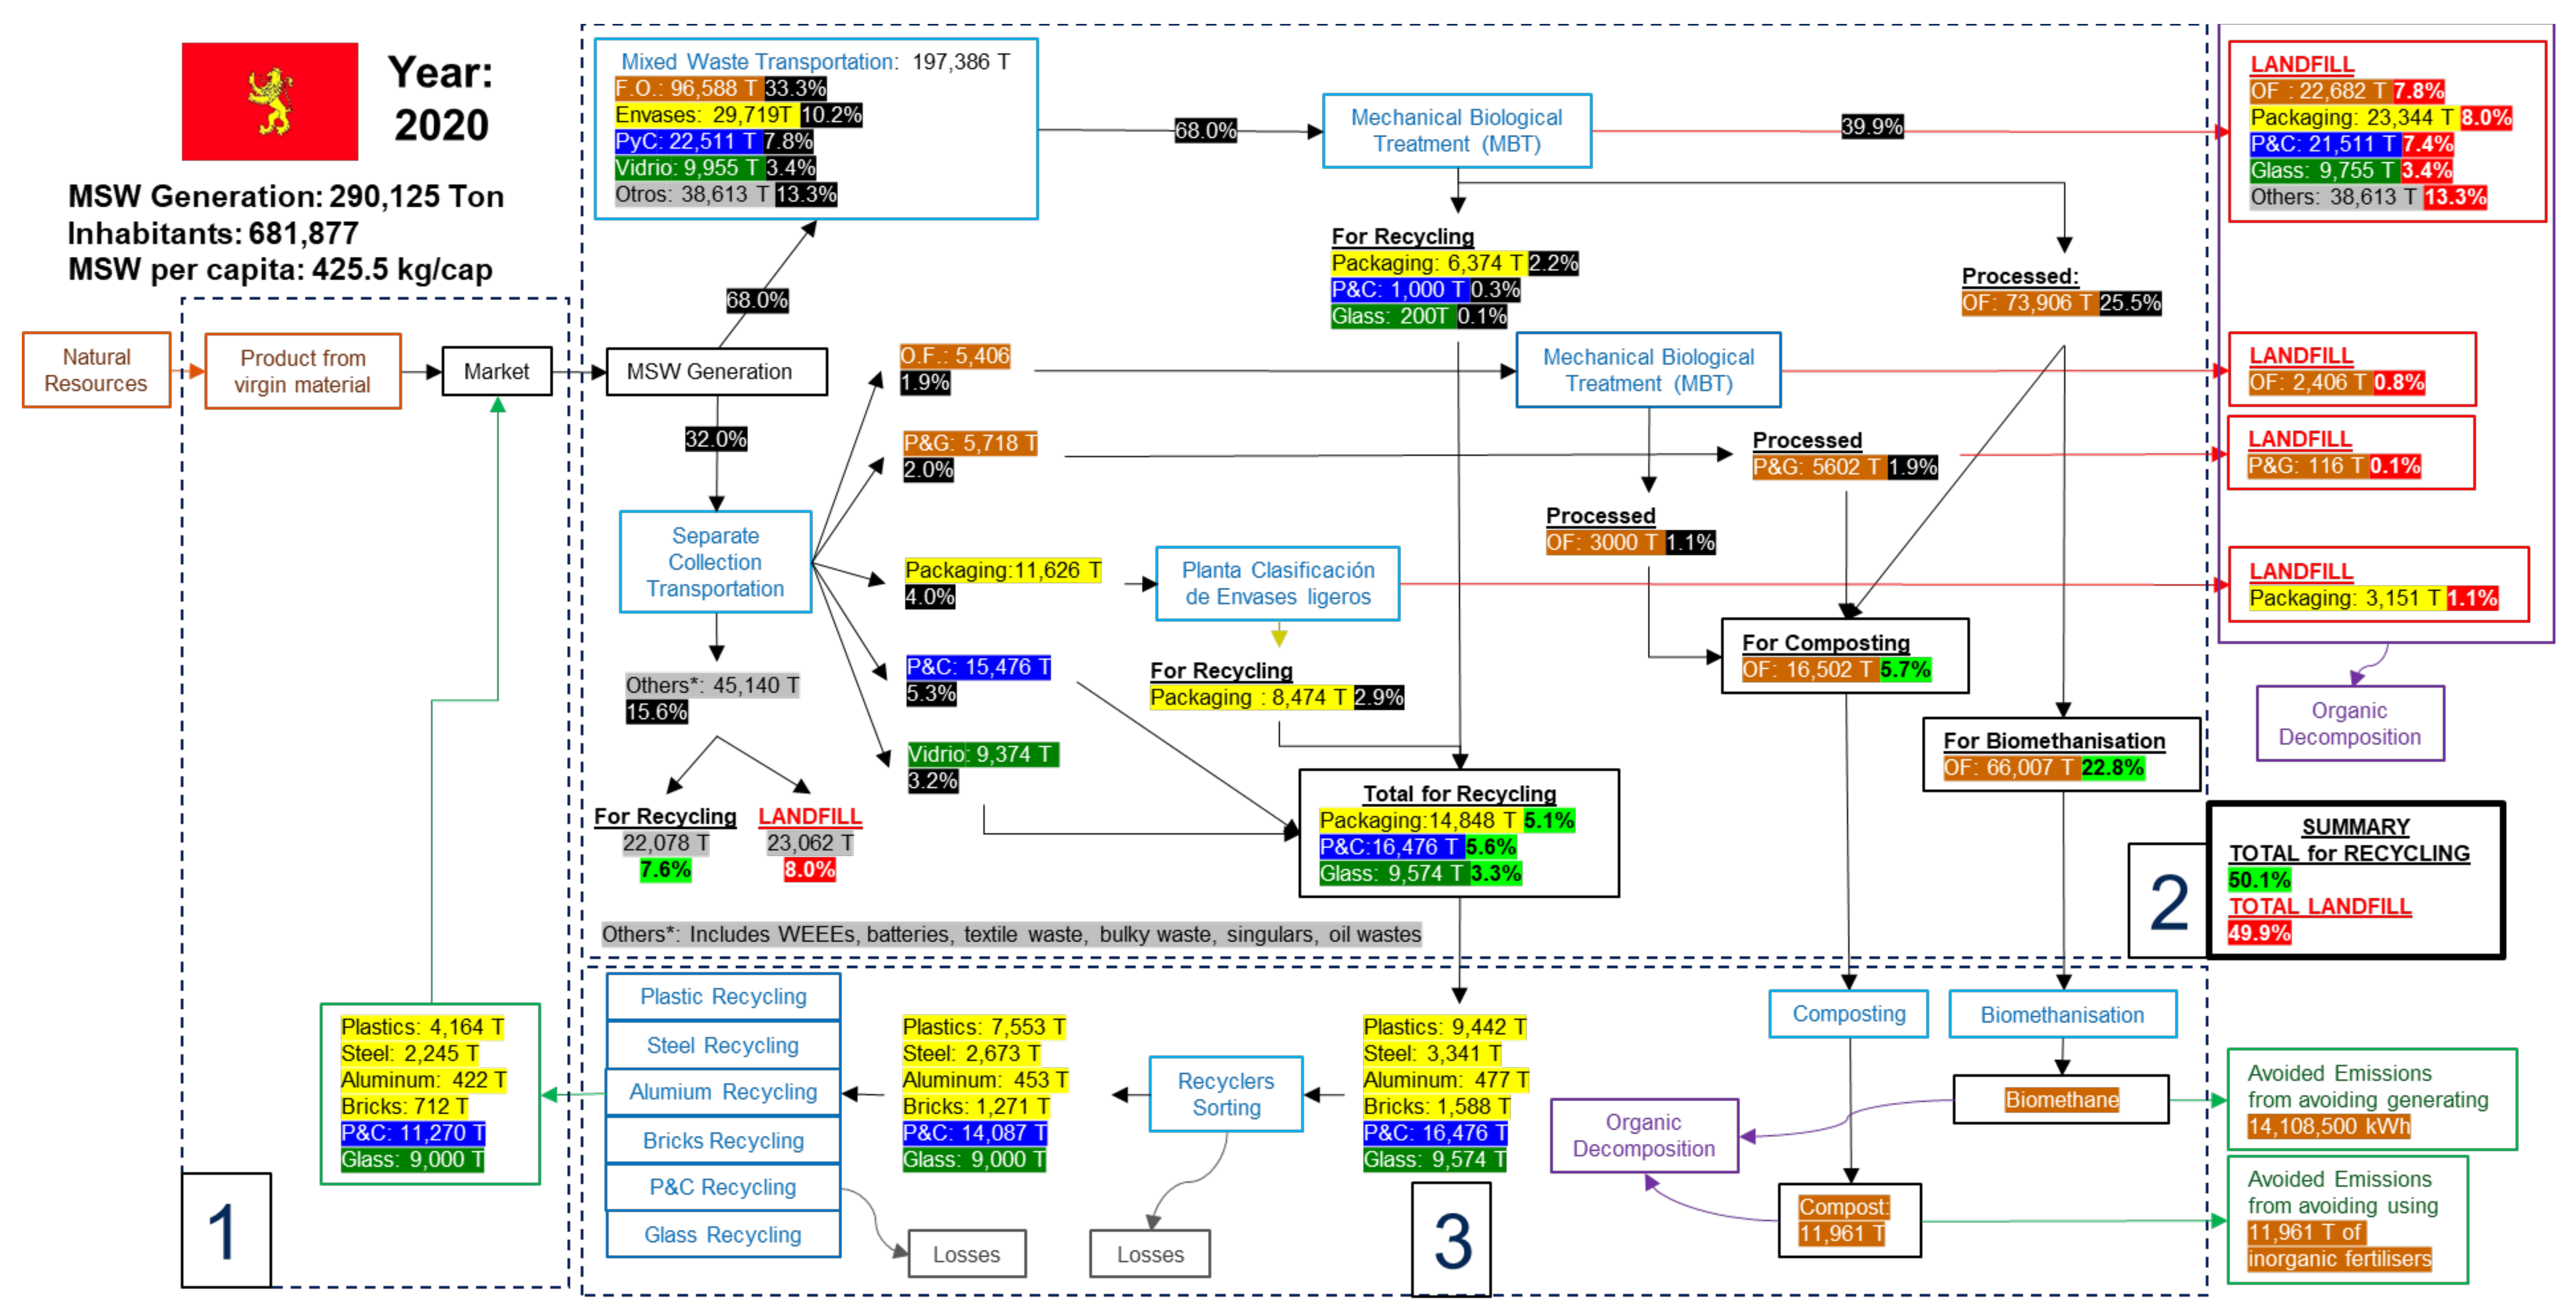
3.1.2. MSW Fraction Flows in 2020

Figure 2 and Figure 3 show the MSW flows of Zaragoza and Spain in 2020 and 2018, respectively. These figures summarize the flows of the so-called stage 2 (Figure 1), indicating a percentage of total MSW. Both Figures show a typical MSW management scheme in Spain: first, MSW is divided into mixed waste and separate collection. A small graph shows the composition of mixed waste. On the other hand, separate waste collection, which is carried out through containers placed on the street (except bulky waste and WEEE, which are collected at local waste facilities), contains the following fractions: organic fraction, light packaging, bulky waste, P&C, glass, textile and WEEE (including batteries). The fractions are then transported to different treatment plants. Finally, the sorting plants send the sorted waste of each fraction to the recyclers. At this point, the materials delivered to the recyclers count as “recycled” for the municipality, so losses during recycling are not considered in this figure. Therefore, it is important to note that although in Figure 2 the recycling rate for Zaragoza is 50.15% and in Figure 3 it is 35.02% for Spain, no material is recycled at this stage. Recycling is carried out in the subsequent stage (third stage, Figure 1), and due to the lack of data traceability, it is not possible to know the exact amount that is recycled [31]. On the other hand, waste that ends up in incineration or landfill does not count as recycled. However, since there is no incineration plant in Zaragoza, all non-recycled MSW end up in the landfill. Although in Figure 2, the fractions of bulky waste, textiles and WEEE appear, they are not considered in this analysis, due to their low mass contribution:
  • Mixed waste: It is the main waste fraction (68%). However, up to 85% of waste should be collected selectively, highlighting the low collection efficiency of the city’s current method based on containers placed on the street. Nevertheless, if citizens separate MSW correctly and deposit it in the appropriate container, this percentage could be considerably reduced. For the treatment of this fraction, Zaragoza has a Mechanical-Biological Treatment (MBT) plant at the CTRUZ (see Appendix B) where the entire fraction (197,000 tons) is treated. Here, 41.3% of mixed waste is recovered (28.1% of total MSW, see Figure 2), corresponding to more than half of the total recycling (50.1%). On the other hand, 58.7% (39.9% of total MSW, see Figure 2) is rejected and sent to landfills—which shows the low efficiency of this process—selective collection being preferable.
  • Organic fraction: The majority of MSW belongs to this fraction: 33.3% of total MSW ends up in mixed waste, and 3.9% of total MSW is in the selective collection. The big difference between them is that this fraction’s selective collection is only carried out in some neighborhoods, but it is expected to reach the whole city in 2023.
  • Light packaging: This fraction is transported to a packaging sorting plant. In 2020, some 11,600 tons of light packaging (4% of total MSW) were collected separately; however, as much as 29,600 tons (10.2% of total MSW) ended up in the mixed waste fraction, making it the most abundant fraction after organic fraction. Given that only 28% of light packaging is collected selectively, urgent measures are needed to increase the selective collection with alternative and/or complementary collection systems such as the DRS. In addition, future sensorization projects in Zaragoza city could help to improve collection efficiency (see Appendix C). On the other hand, only 72.5% of the fraction is recovered for recycling at the packaging sorting plant (2.9% of the 4% collected selectively), which contrasts with the recyclability of P&C or glass, which have 100% recycling. However, research projects are being carried out in facilities close to Zaragoza city that promise to recover 100% of the plastic (see Appendix C).
  • Paper & Cardboard: This fraction shows recycling rates of 100% of what is collected separately, since it is not sorted but sent directly to recyclers. This fraction is the third most important (11.2% of the total, collected selectively), as it has to be divided in two: on the one hand, 5.3% is collected in street containers and, on the other hand, 5.8% is collected by Aragonese cellulose industry Inc. (SAICA for its Spanish acronym), through containers placed in industries near Zaragoza (see Appendix B). However, a significant part of this waste ends up in the mixed fraction, around 7.8% (of total MSW), which means that approximately 60% of P&C ends up in the mixed waste fraction, and it is necessary to improve selective collection.
  • Glass: This fraction has recycling rates of 100% of what is collected separately, as in the previous one. It also has the highest rate of selective packaging collection (light packaging and P&C). 3.2% is collected separately versus 3.4%, which ends up in the mixed waste fraction. Therefore, despite this, there is still much potential for improvement because 51.5% still ends up in the mixed waste fraction.
Figure 2. MSW flows in Zaragoza in 2020. All percentages have been calculated based on total MSW generation.
Sustainability 13 12724 g002
Figure 3. MSW flows in Spain in 2018. It has been assumed that all direct landfill comes from the mixed waste fraction. All percentages have been calculated based on total MSW generation.
Sustainability 13 12724 g003
Comparing the flows in Figure 2 and Figure 3, Zaragoza and Spain present very similar results. The most significant difference is that the separate collection in Zaragoza is slightly higher, mainly due to the private collection of SAICA (Appendix B), which takes place in industries close to the city and is not present in the rest of Spain. On the other hand, it is observed that Spain does not reach the EU recycling targets of 50%, while Zaragoza does. This is mainly due to the Zaragoza’s MBT plant because it is a large city with this type of infrastructure, and all its mixed waste fraction can be treated in this plant, while, in the generic Spanish case, many towns and cities lack these facilities, so most of their mixed waste (the most significant fraction) would end up in landfill or incinerated. Another difference is that there are no incinerators in Zaragoza, so all the waste rejected in sorting plants end up in the landfill. Other Spainish cities that have such facilities may incinerate their waste.

3.2. Analysis of Zaragoza’s MSW Metabolism and Household Behavior with the CO2 Footprint Method

The CO2 footprint method described in Section 2.2 was used to quantify the UM of the city of Zaragoza’s IE from the main MSW fractions point of view. Figure 4 shows the material flow of Zaragoza’s organic, light packaging, P&C, and glass fractions in 2020. It shows the three stages already mentioned in the Introduction, which are essential in the UM (Figure 1). Once all the materials passing through each of the stages and processes (i.e., metabolized) are known, it is easy to calculate the total footprint of all types of waste, as explained in point 2.2. Three different scenarios were established for each of the fractions:
  • Maximum footprint: In this scenario, it is assumed that nothing is recycled, and therefore 100% of the fractions end up in the landfill.
  • Current footprint: It is the current scenario
  • Minimum footprint: Everything is supposed to be recycled while maintaining the current market mass. This scenario shows the minimum carbon footprint that would be generated if every citizen separated 100% of their waste correctly, i.e., if their behavior was perfect.
Figure 4. Mass results of all fractions studied: Organic, Packaging, Paper & Cardboard and Glass.
Sustainability 13 12724 g004
The results of these scenarios were analyzed separately for the packaging and organic fractions.

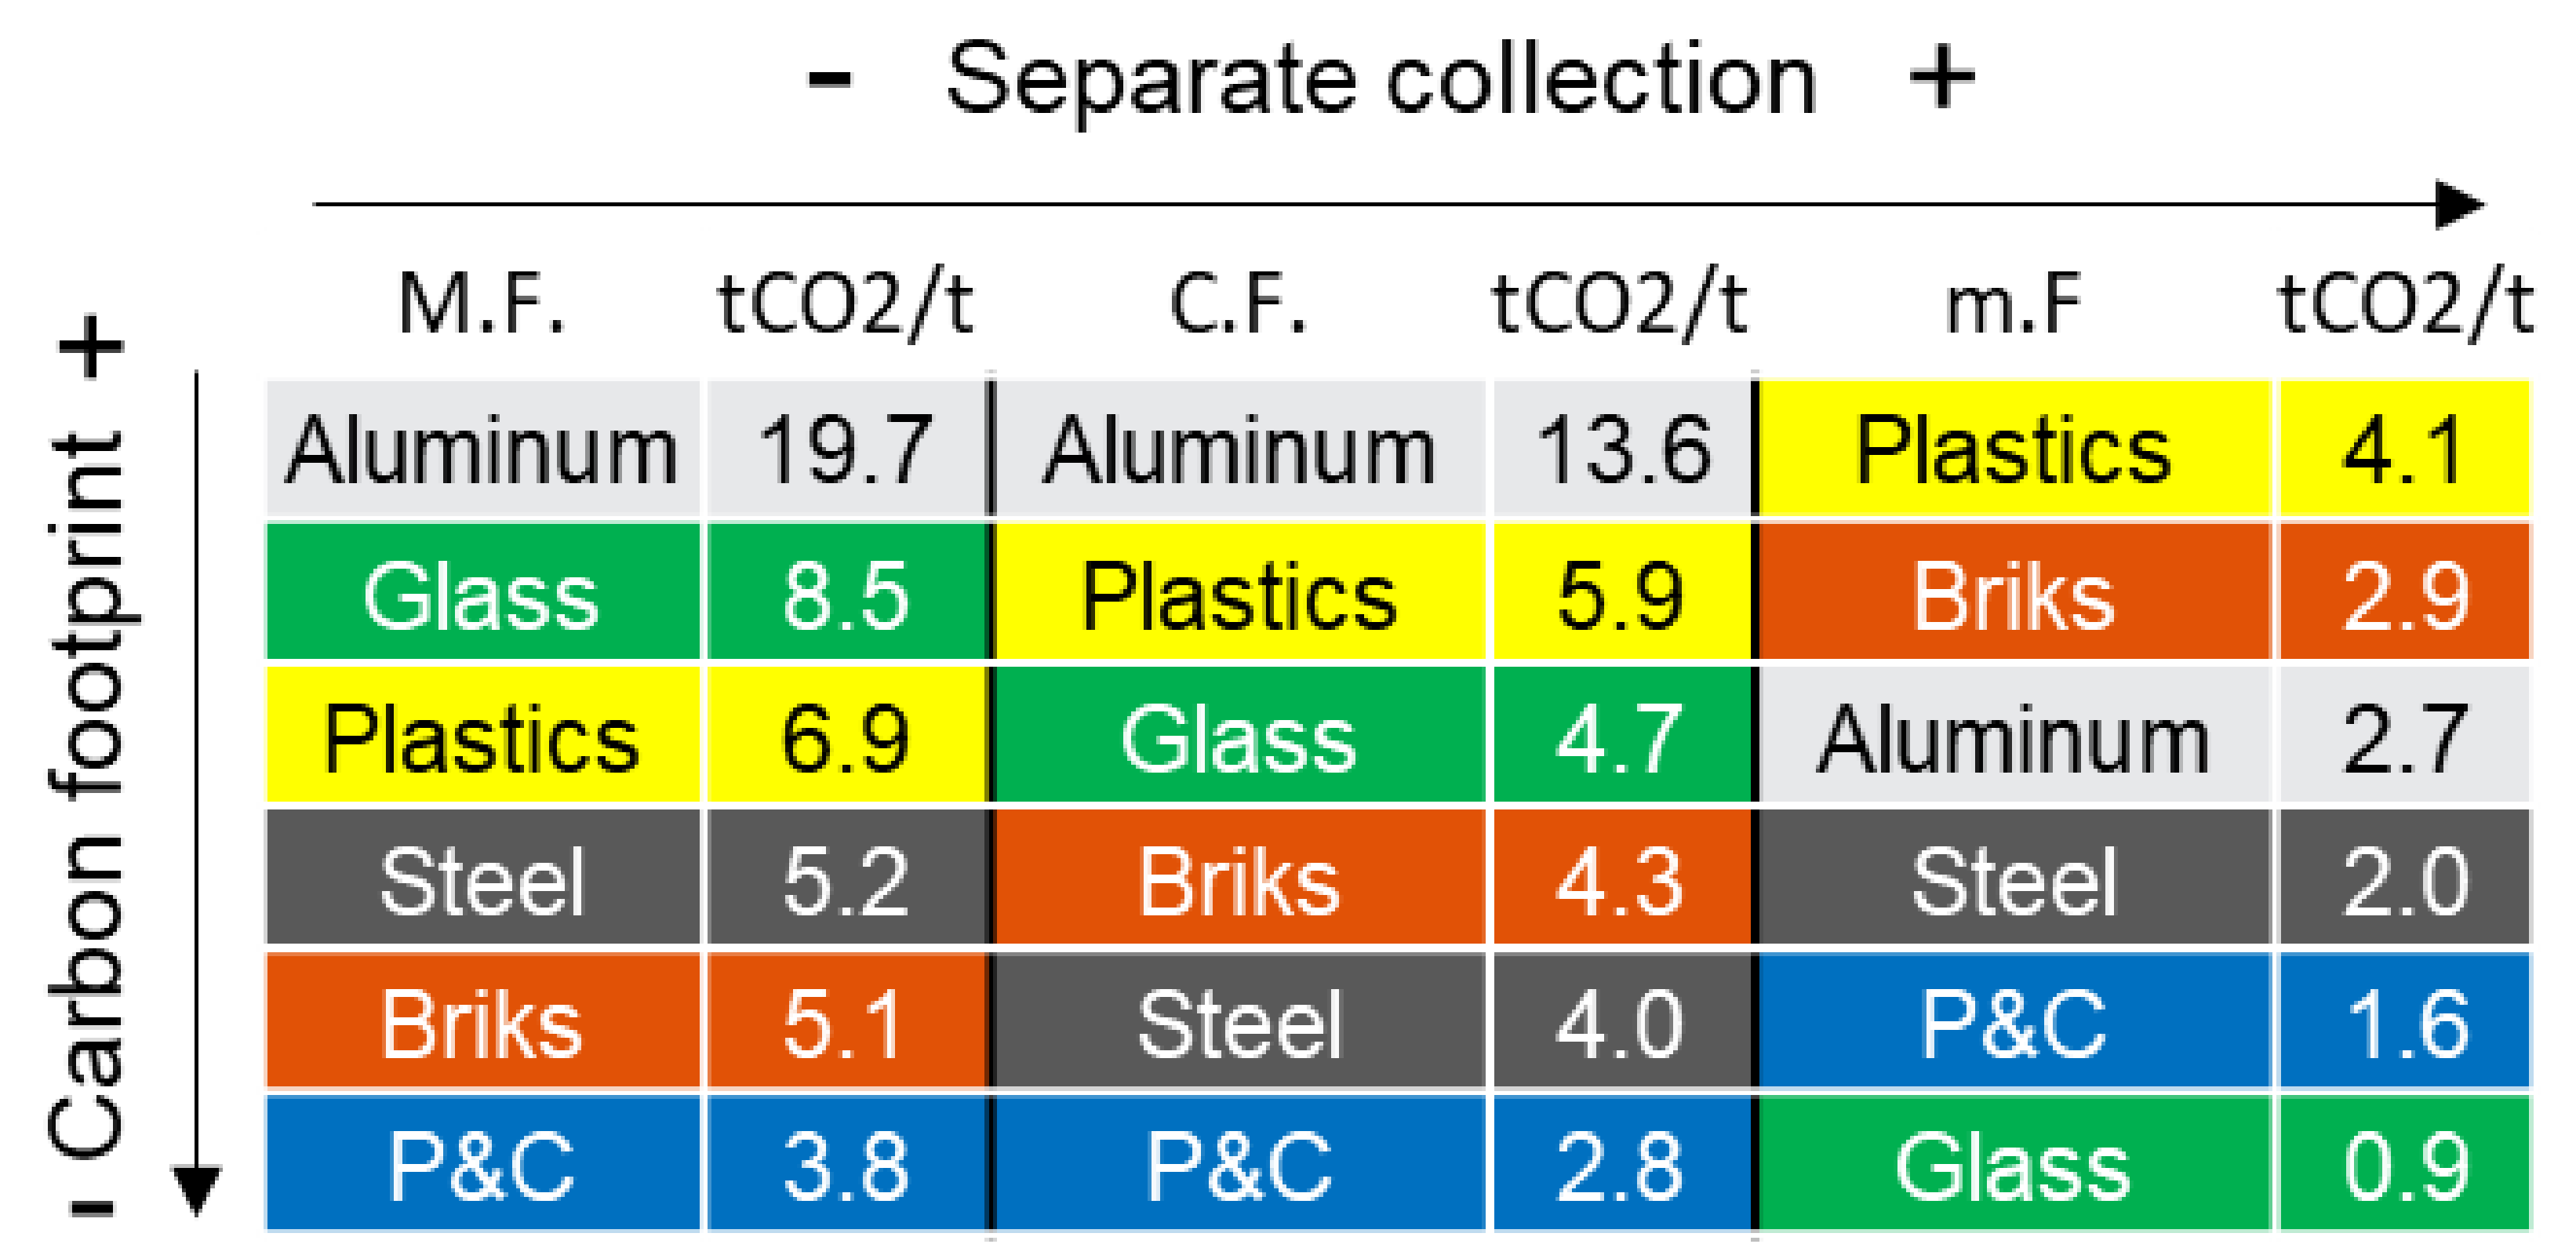
3.2.1. Analysis of the Packaging Fraction

Table 7 shows the results for each packaging fraction and is divided into three parts:
  • Results for each scenario (columns A, B, C), with their separate collection rates (columns SC.)
  • Current avoided emissions are the difference between the maximum footprint scenario and the current footprint scenario and the potential avoided emissions, which are the difference between the current and minimum footprint.
  • Total market mass and the relative results are obtained by dividing columns A, B, and C (D).
Table 7. Results of the CO2 method for Zaragoza in 2020 for packaging fraction. The main results are shown in columns A, B and C. SC: separate collection; t CO2 = ton CO2 equivalent.
Maximum FootprintCurrent
Footprint
Minimum
Footprint
Current Avoided EmissionsPotential Avoided EmissionsMarket
Mass
Relative MF.Relative
CF.
Relative
m.F.
S.C.AS.C.BS.C.CA-BB-CDA/DB/DC/D
Units%t CO2%t CO2%t CO2 t CO2t CO2tt CO2/tt CO2/tt CO2/t
P&C0%208,49440.7%154,607100%87,17453,88767,43354,8973.82.81.6
Glass0%163,54948.5%91,502100%18,08472,04773,41819,3298.54.70.9
Plastics0%210,72628.1%180,371100%126,23730,35554,13430,6686.95.94.1
Steel0%28,32528.1%21,984100%10,674634111,31054355.24.02.0
Aluminum0%47,36028.1%32,649100%640014,71126,249239919.713.62.7
Briks0%14,41128.1%12,146100%81072265403928415.14.32.9
Total 672,865 493,259 256,676179,606236,583
Analyzing the absolute results, i.e., in case the proportion of each material in the market is maintained, it is observed that with the increase of separate collection, glass, P&C, and plastics produce the highest savings (column B-C), since they are the most numerous fractions. These fractions also produce the highest savings at present due to the same reason. For this reason, strategies should pay particular attention to separate collection of these fractions, as they can potentially bring the most significant benefits. However, it is important to know the impact in relative weight terms to encourage using some materials over others from a CO2 footprint point of view. It is important to note that the analysis below only considers the CO2 footprint and the weight of the different materials. This limits its conclusions because it does not take into account the packaging capacity of the materials (e.g., a plastic bottle weighs much less than a glass bottle for the same volume), the barrier effect of food protection of plastics that other materials do not have, or other types of environmental impact such as the duration of their degradation in nature. For this purpose, Figure 5 was constructed with the data in Table 7. The footprint of each fraction changes considerably if they are recycled or not because of their different initial footprint and recycling processes. However, it is observed that light packaging fractions (especially plastics, aluminium and briks) have the highest footprints in almost all scenarios. Glass and aluminium, on the other hand, are the fractions that reduce their footprint proportionally the most if they are recycled. For example, glass goes from being the second-largest footprint (with 8.5 t CO2/t) without recycling to the one with the smallest footprint if recycled (0.9 t CO2/t). P&C is the fraction with the lowest CF in almost all scenarios. On the other hand, plastics are the fraction with the highest CF. However, they have the advantage of the food protection effect, which helps to reduce food waste.
When looking at the total results in Table 7, the current footprint due to packaging is 493,259 t CO2 eq. and even if H&B properly separate 100% of the waste they generate, the total CF would be 256,676 t CO2 eq., reducing it by 236,583 t CO2 eq. This shows the limitations in the household’s behavior if the current packaging mass is maintained. On the other hand, the current system avoids 179,600 t CO2 eq., compared to the case of no separate collection (maximum footprint). This means that the current situation can be greatly improved with new strategies that promote separate collection systems that encourage H&B to separate waste correctly, such as the DRS.
To better understand how CO2 eq. emissions are allocated to the different processes, a Sankey diagram was created for the current situation of the P&C fraction (Figure 6). Sankey diagrams for the remaining fractions studied can be found in Appendix D. In Figure 6, the largest CO2 eq. impact of P&C comes from the production footprint and organic decomposition, and that this can be reduced by increasing separate collection, which would lead to an increase in recycling. However, Table 7 shows that it is not possible to reduce the emissions of the whole process to zero (the minimum footprint is 84,174 t CO2 eq.), due to the unavoidable process losses that occur in the sorting and recycling processes and the fact that energy is constantly needed, which always has associated emissions, as shown in Figure 6. Reducing the footprint to below 84,174 t CO2 eq. would only be possible by reducing the amount of material used in the market. Finally, it is important to note that the CO2 eq. emissions from operations (in blue) are very low compared to the amount of the production footprint (in orange) and organic decomposition (in purple). This fact is what makes recycling save CO2 eq. emissions. The same ideas apply to all other packaging fractions.

3.2.2. Analysis of the Organic Fraction

In the case of the organic fraction (OF) it cannot directly replace the food from which it comes, but two by-products can be generated from its waste: biogas, through biomethanization, and compost, through composting. These can produce electricity “free” of CO2 emissions, and replace inorganic fertilizers, respectively. The replacement of inorganic fertilizers for agricultural uses is only possible with high quality, separately collected compost. However, most of the compost generated in Zaragoza comes from the compost recovered at the MBT plant (as indicated below). Thus, the city council has devised a project called “The forest of the Zaragozans” (see Appendix C), which seeks to involve citizens in planting trees to improve their awareness of waste separation. In addition, the City Council also participate in other projects, such as “Circular Biocarbon”, led by Urbaser (see Appendix C).
Table 8 shows the results for the OF, divided into the same columns as Table 7. It shows that the OF has the most significant footprint, with 437,987 t CO2 eq. compared to 493,259 t CO2 eq. for all packaging combined. In addition, OF is the least able to reduce its footprint through separate collection (only 46,000 t CO2 eq. compared to 236,000 t CO2 eq. for packaging). This is because, although separate collection of OF is very low (5.3%), a large amount of OF is recovered at the MBT plant for composting and biomethanization, 76.5%, as can be seen in the Sankey diagram (Figure 7). On the other hand, about 150,000 t CO2 eq. are currently avoided, similar to all packaging combined (179,000 t CO2 eq.), due to the MBT plant. Therefore, if the collection system were improved to the maximum with the same waste generation, the footprint would be 392,000 t CO2 eq.

3.2.3. Summary of Results of the Metabolism of Zaragoza in CO2 and Monetary Terms

CF results can be transformed into monetary terms, through CO2 prices, which, in this document, is set at 50 euros/ton of CO2 [48], although prices are expected to increase in the future. The higher the price of emissions, the higher the economic cost of metabolizing the IE, so cost show in this paper could be even higher in the future. Thus, taking Table 7 and Table 8, it is possible to calculate the savings (columns A-B and B-C) in economic terms. These calculations are shown in Table 9.
Table 9 shows that the CF of the MSW fractions studied from Zaragoza city amounts to 931,000 t of CO2. This amount can be considered the current residue of the UM and could be reduced if the subsystems/actors (see Figure 1) involved were more efficient. For example, if the behavior of H&B in the city was perfect and 100% separate collection was achieved, the CF (or metabolic residue) would decrease to 648,500 t CO2. On the other hand, if H&B reduced food waste by half, the footprint could be reduced by more than 200,000 t CO2 eq. Currently, the savings compared to a scenario without recycling amount to 330,000 t CO2 eq. and could reach 282,500 t CO2 eq. more if H&B separate 100% of their waste correctly. Therefore, the current system saves around €16,500,000 (19,120,000 USD) and could save up to an additional €14,000,000 (16,224,000 USD) with 100% separate collection. Further savings beyond this figure would be possible by reducing the amount of material on the market, especially food waste, as discussed in the previous section.

3.3. Analysis of the City Council Strategies

Table 10 shows the results of applying the strategies proposed in Section 2.3. These measures would provide incentives for H&B to increase the selective sorting of materials. Some assumptions are made to simplify the calculations, e.g., the entire aluminum and steel fraction corresponds to cans and the glass fraction to bottles.
Thus, if the DRS for steel, aluminum and glass fractions were implemented, the CF could be reduced by up to 93,000 tons of CO2, a figure comparable to the entire footprint currently generated by glass (91,502 t CO2 eq.), which could lead to savings of 4,650,000 euros. This measure is particularly beneficial for the glass and aluminum fractions, as they reduce their footprint the most when recycled, as explained in previous sections. Appendix D show Sankey diagrams that confirm this. However, the implementation of the DRS does not depend on the municipality and there are legislative barriers to its implementation (see Appendix A). On the other hand, just by increasing selective collection by 4.81 percentage points, i.e., from the current 50.1% to 54.81%, the CF would be reduced by 16,278 tons of CO2, which in economic terms translates into a saving of 813,890 euros (only taking into account the fractions studied). Finally, an increase in the selective collection of OF by 10.8 percentage points, i.e., from the current 5.3% to 16.1%, would mean a reduction in emissions of 7763 t CO2 eq and a saving of 388,153 euros. In this case, the improvement is smaller than the previous ones because a large part of the organic matter can be recovered through the MBT process, up to 76.5%. However, separate collection is necessary to ensure the quality of the compost generated and that it can be used on crops. This measure is expected to be implemented in Zaragoza in 2022–2023, so the results of its implementation will be known in the future.

4. Discussion and Conclusions

This paper uses data from a large Spanish city, Zaragoza, to understand the UM of its MSW, which comprises the city and the entire industrial ecosystem (IE), where the city occupies a central hierarchical position as a supplier of waste to its recycling industries. One of the most important limitations of this study is the quality of the data. On the one hand, the MSW generation data for Zaragoza and Spain are reliable, as they only focus on the city stage (stage 2, Figure 1), but the focus of this study covers the industries of the city’s IE. Here, it is difficult to know how much material finally reaches the recycling industry and where it is located. Therefore, traceability of data between the different subsystem/actors in the IE is essential to overcome this problem. To avoid this, some assumptions are made, such as that all materials that the municipality sends for recycling eventually reach the recycling facility, which is not always the case [31]. This means that the CF data presented in this paper might be considerably higher in reality.
Regarding the Zaragoza MSW data analysis, its MSW generation trend is on the rise, increasing by 2% per year (between 2016–2019), which goes against the European objectives. On the other hand, Zaragoza meets the European recycling target, collecting 50.1% of its MSW separately. In contrast, Spain does not meet this target with 35%. The main difference in these results is not due to the amount of MSW collected separately in the street containers (in Zaragoza, 48.5% of glass, 40.7% of P&C and 28.1% of light packaging are collected separately, none reaching 50%), but to the MBT Zaragoza facilities, which can recover a large part of the waste, is deposited in the mixed fraction (especially organic waste). In contrast, other Spanish municipalities do not have such facilities, which reduces the amount of waste recycled. About selective collection, currently, almost 70% of MSW ends up in the mixed fraction, of which 80% corresponds to fractions that could be recovered separately. This fact highlights the saturation and inefficiency of the current container system in Zaragoza and Spain. Therefore, implementing new collection systems, such as the DRS, which could complement or replace the current system, should be studied.
The CF method was applied to the main MSW fractions to measure the UM of Zaragoza’s IE. For this purpose, the production footprint was taken into account, and the amount of recycled materials was estimated, assuming sorting and recycling losses, thus integrating producers and recyclers, i.e., the MSW of the IE. Considering data limitations discussed above, the current situation results show that the organic fraction has the highest emissions (438,000 t CO2 eq.) because composting and biomethanization are not able to compensate for the massive footprint of food waste. In comparison, the footprint of the rest of the packaging fractions is 493,000 t CO2 eq. However, the CF of each packaging fraction analyzed is very different as—taking into account only the packaging mass—the P&C and glass fractions have lower CF than lightweight packaging. However, lightweight packaging has other advantages, such as the food protection effect, which helps to reduce food waste. In total, with the current separate collection rates, the footprint of the analyzed fractions amounts to 931,200 t CO2 eq. Assuming perfect household behavior that achieves 100% separate collection, the footprint would decrease to 649,000 t CO2 eq. To reduce these emissions, it would be necessary to reduce food waste and/or the consumption of often unnecessary packaging, e.g., by buying in bulk. For example, if H&B reduced food waste by half, the footprint could be reduced by more than 200,000 t CO2 eq, i.e., 30%. This requires the involvement of H&B, which need to be correctly informed and made aware of the situation. In addition, Sankey diagrams were developed to simulate and show CF distribution among the subsystems of the MSW of the IE.
CF savings can be transformed into monetary savings through the price of CO2 emissions. Thus, some measures carried out in other places, such as Lleida city [45] or the community of Txingudi [46], were evaluated in Zaragoza, assuming the same effect. For example, the DRS, applied to glass, steel and aluminum, could achieve an emission reduction of 91,500 t CO2 eq, in economic terms, 4,650,000 euros (5,385,188 USD). On the other hand, using only the CF as an indicator presents some problems, as it does not consider other effects such as soil acidification, effect on human health, eutrophication of water and more. These indicators are considered in LCAs carried out by the authors [12,13,15,17]. Another problem not accounted for by CO2 is plastic pollution, as plastics are not biodegradable and can easily end up in the sea due to their lightness, causing severe environmental damage to marine flora and fauna. Some studies [49] warn that the equivalent of one plastic card per week is ingested due to plastic pollution.
To improve the current situation regarding MSW management in the city, it is essential to establish strategies that allow for the traceability of data related to MSW management. In this respect, Zaragoza City Council is setting an example by carrying out a sensorization project (see Appendix C) that will provide essential data on MSW management in the city, such as the fuel consumption of the collection fleet or the optimization of routes. Then, traceability must follow the entire waste pathway from the generation until its integration into the economy, i.e., throughout the city’s IE (as shown in Figure 1). Thus, policymakers could set strict standards for product manufacturers to use recycled and lower environmental impact materials, promote standardization of their packaging to facilitate reuse (especially glass because of its ease of reuse) and provide information to recyclers to improve recycling processes. On the other hand, more efficient collection systems should be studied, such as the DRS—in Zaragoza, 93,000 t CO2 eq could be avoided, equivalent to the current footprint of glass. In addition it would inform and incentivize H&B to buy products with less impact, avoiding light packaging, where possible, generating less waste, encouraging bulk purchasing and reuse of packaging, and avoiding food waste. In addition, other measures proposed by Zaragoza City Council, such as the participation of citizens in the planting of a forest of 700,000 trees in the vicinity of the city (Appendix C), would improve their awareness of waste separation and make the Forest something personal that would contribute to reducing the city’s CF. Finally, it is important to highlight the role of recycling industries close to the city (Appendix B) that help minimize the CO2 footprint impact of transport and generate local jobs. Nevertheless, how does one reduce the CF of waste management? The answer lies not only in the management of municipalities or in the behavior of H&B, but in all actors involved, from manufacturers to recyclers.

5. Beyond Conclusions: The Concept of “Liver-Industries” and “Brain-Management”

Most MSW management studies use LCAs, but they start once a material or product becomes waste [22], so they do not consider the whole IE, only the city. Therefore, some of these authors conclude that MSW management can be carbon neutral or even a carbon sink [12,16,17,40]. This can lead to confusion because it could be thought that an activity capable of absorbing carbon is better to recycle than to reduce MSW generation, which is false, as in no case is recycling capable of offsetting manufacturing footprints, as this paper demonstrates with the minimum footprint scenarios.
Therefore, the boundaries of the analysis need to be expanded, providing a view not only of the city but also the whole city’s IE. Thus, the city is conceived as a large waste-generating industry within an IE, arising from the municipal-industrial ecosystem concept. This ecosystem has a metabolism, in which the different subsystems have their own role for the correct functioning of the whole, making symbiosis between them essential. The biomimicry supports this vision, conceiving the municipal-industrial ecosystem as a living organism [50,51] with at least three essential organs or subsystems. One responsible for the production of the city’s consumer goods (manufacturers), another for the consumption of these goods and the initial management of the waste generated (H&B), and the last one should transform this waste into new raw materials for the first organ (recyclers), thus closing the material cycle, as occurs in nature (Figure 1). These organs need to cooperate in a symbiosis that enables the life of the whole organism. This approach highlights the role of the recycling industry in transforming waste from the city’s H&B into new products, closing cycles and moving one step closer to a circular economy and the sustainability of cities. Thus, these recycling industries act like the liver in vertebrate animals, being necessary for developing liver-industries to ensure the life of the municipal-industrial ecosystem in the long term. Therefore, communication and cooperation between these actors (or organs) are essential. Manufacturing industries need cities to attract workers and consumers, cities need recycling industries to achieve a healthy environment, and recycling industries need manufacturing industries to sell their recycled materials. To achieve this cooperation, a new organ that should act as the manager is needed to enable proper communication between the subsystems: a “brain-manager” of the municipal-industrial ecosystem. This organ would be necessary because the roles and responsibilities of the municipality, the manufacturing or recycling industry are limited to their subsystems, and none of them has sufficient information to manage the whole. Moreover, this “brain-manager” requires a holistic view of the municipal-industrial ecosystem of a city and the neighboring ecosystems, following the principle of subsidiarity, which states that what can be done locally should not be decided and executed at a distance. Particular wastes need economies of scale for their recycling to be economically competitive. Thus, some liver-industries can recycle waste from the city in which they are located and from their region, thus managing waste from nearby towns or cities. The size of cities conditions the number of liver-industries, due to the amount and type of MSW. This could be the case for smaller volumes, such as WEEE.
Phenomena such as climate change, as well as other serious environmental problems and the threat of resource scarcity in the future, are warnings of the malfunction of the “liver” of city’s IE, and the liver-industries and brain-managers need to be promoted and strengthened if industrial society, its cities, and its standards of living want to survive in the long term. Thus, a municipal-industrial symbiosis is presented as a conceptual solution to face the future environmental problems and shortage of raw materials that industrial society and its cities would face, transforming the MSW problem into an opportunity for society.

Author Contributions

Conceptualization, A.V.; methodology, A.V. and J.T.; formal analysis, J.T. and A.T. resources, J.T. and M.Á.A.; writing, J.T. and A.V. All authors have read and agreed to the published version of the manuscript.

Funding

This research received no external funding.

Conflicts of Interest

The authors declare no conflict of interest.

Appendix A

The Spanish Packaging Law establishes that the purpose of the “Sistemas Integrados de Gestión” (SIG) is the periodic collection of packaging waste at or near the consumer’s home and must guarantee compliance with the recycling and recovery targets set by the law, so that packaging companies that join a SIG will be exempted from creating their own DRS, which is the other alternative proposed by the law. [50]. This means that practically all packaging companies have to join the SIG, due to the cost of having their own DRS. In the case of plastics and aluminium the responsible SIG is Ecoembes and in the case of glass it is Ecovidrio. These entities receive income through the so-called “green dot”, a seal of environmental information that guarantees that the company responsible for the packaged product complies with the Packaging Law through its membership of Ecoembes or Ecovidrio contributes financially to its respective management. Thus, the “green dot” represents the payment made by the packaging company to the SIG for the provision of the packaging waste recovery service. This income is then used to cover the cost to local authorities of selective collection of packaging. In other words, the packaging containers, the lorries and operators who collect it, the treatment plants where it is sorted or others.
Therefore, it is not the jurisdiction of the municipalities to implement a DRS but of the SIG. However, the implementation of the DRS is not preferred by the SIG because the basis of their business is that they receive revenue for all packaging that enters the market, but only pay for those that end up in the packaging containers, which only depends on the good faith of the households. Therefore, paradoxically, SIGs get more revenue (and therefore power and influence) the less waste is separated by households and the more packaging there is on the market, and these objectives run counter to waste reduction and separation.

Appendix B

Zaragoza city has several recycling companies in the surrounding area that can recycle or recover a large part of the city’s waste. Having these industries is fundamental to bringing the city closer to a more circular economy, minimizing the CO2 footprint of transport, and generating local jobs.
  • CTRUZ: Zaragoza City Council has the Zaragoza Urban Waste Treatment Complex (CTRUZ, acronym in Spanish), in operation since 2009. This facility serves more than 750,000 citizens of Zaragoza city and 61 nearby municipalities. Its construction and operation were assigned to UTE Ebro, composed of the companies Urbaser and Vertresa. Its commissioning has allowed [51]:
    The recovery of materials for subsequent recycling (MBT process).
    The use of organic matter for biogas and compost production.
    The generation of electrical energy: the biogas obtained is transformed into electrical energy through a cogeneration installation that allows the Complex’s consumption to be covered and the surplus to be exported to the electricity grid.
    Water treatment, where the leachate produced is treated.
    Controlled landfill
  • SAICA (Sociedad Anónima Industrias Celulosa Aragonesa): was founded in 1943 in Zaragoza to produce paper. It is currently the most important paper and cardboard producer and recycler in Spain, with an international presence. All the briks in Spain are recycled in the Zaragoza plants. Nevertheless, only 75% of the cardboard is extracted, while the other 25%, made up of plastic and aluminium, is deposited for the moment in an industrial waste landfill pending the implementation of a technology that can separate them [52]. In addition, these plants also recycle the paper and cardboard fraction of Zaragoza city.
  • Verallia: the glass separated from the MSW of Zaragoza city is used as raw material in the nearby Verallia factory in Cuarte de Huerva, where new glass is manufactured using the previous waste. Verallia is the world’s third-largest producer of glass containers for food and beverage and in the Iberian Peninsula has 6 factories located in Azuqueca de Henares, Burgos, Montblanc, Sevilla, Zaragoza and Mondego (Portugal) [53].
  • CEMEX (Morata de Jalón): About 65 km from Zaragoza in the town of Morata de Jalón is the Cemex factory with a production capacity of 970,000 tons of clinker and 1,400,000 tons of cement per year [54]. MSW organic fraction with sufficient calorific value could be used as secondary fuel for clinker production.
  • Parque Tecnológico de Reciclado López Soriano (PTR): is an industrial estate located on 835 hectares in the district of Torrero-La Paz in the municipality of Zaragoza. It is promoted by the López Soriano business group and is mainly dedicated to recycling. The previously named CTRUZ is located within the estate. In addition, many other SMEs dedicated to recycling are located there [55].
  • Mercazaragoza: is the most important logistics platform specializing in agrifood in the Ebro Valley. A distribution, commercialization, transformation and logistics platform that operates 24 h a day to guarantee the supply of foodstuffs in its area of influence. It contains more than 150 companies specializing in fresh and frozen products. These companies market around 200,000 tonnes of food a year, concentrating on one of Spain’s most important fresh food offers. Although Mercazaragoza is not an industry or company dedicated to recycling, it should be mentioned as a significant food waste generator, which will be used to generate the compost necessary for the Bosque de los Zaragozanos Project [56].

Appendix C

Zaragoza City Council participates, on its own initiative or together with other institutions or companies, in various projects to improve the recyclability of MSW, making use of and developing new technologies. Some of them are the following:
  • Sensorization project: From 2022–2023, Zaragoza City Council is going to implement a system of sensors installed in the city’s waste collection vehicles, containers and cleaning vehicles, as well as software that will allow real-time data to be obtained on waste collection in the city. In addition to providing more reliable data in the medium and long term to have a more accurate knowledge of the city’s MSW flows, this system will enable energy and time costs to be reduced through the optimization of operations with the acquisition of real-time data on dynamic collection routes. Along with this system, a specific container for the organic matter will be implemented throughout the city, making use of electronic card-opening locks, allowing for the collection of more data on the separation of this fraction.
  • Project to transform plastic into fuel: The R&D project “3R2020+. From waste to resource through recycling” was funded by the Ministry of Science, Innovation and University and framed in the Collaboration Agreement signed between Urbaser, CTRUZ, and Zaragoza City Council ended in October 2020. This project was developed in Urbaser’s R&D centre, located in Zaragoza, and investigated the transformation of plastic film from MSW into diesel fuel by distilling the pyrolysis liquids produced. It is still in the pilot phase, but a functional plant will be built soon [57].
  • “Bosque de los Zaragozanos” project foresees the planting of a forest of 700,000 trees in the vicinity of Zaragoza, using compost recovered from the MBT and covering an area of 1200 hectares [58].
  • Circular Biocarbon project: it is a first-of-its-kind flagship biorefinery designed to turn the organic fraction of municipal solid waste and sewage sludge into high added-value end products, including plastic molding tools, mechanical moving parts, direct consumer products, night vision cameras, devices for 5G telecommunications, bags for biowaste collection, biodegradable in soil mulch films, liquid microalgae biostimulant fertilizer or solid organ-mineral fertilizer with biostimulant properties. The project will set the basis for the commercial demonstration of the feasibility of a biorefinery as a new waste treatment model for cities. It will open up the market for new products and business frameworks based on a circular vision of waste treatment in cities and help pave the way towards a sustainable bioeconomy [59]. This project, led by Urbaser, will lead to the construction of Europe’s first biorefinery for solid urban waste and sewage sludge in Zaragoza.

Appendix D

Figure A1. Sankey diagram of the carbon footprint of the industrial ecosystem (IE) for the P&C fraction in the current scenario (Zaragoza data, 2020).
Sustainability 13 12724 g0a1
Figure A2. Sankey diagram of the carbon footprint of the industrial ecosystem (IE) for the glass fraction in the current scenario (Zaragoza data, 2020).
Sustainability 13 12724 g0a2
Figure A3. Sankey diagram of the carbon footprint of the industrial ecosystem (IE) for the plastic fraction in the current scenario (Zaragoza data, 2020).
Sustainability 13 12724 g0a3
Figure A4. Sankey diagram of the carbon footprint of the industrial ecosystem (IE) for the steel fraction in the current scenario (Zaragoza data, 2020).
Sustainability 13 12724 g0a4
Figure A5. Sankey diagram of the carbon footprint of the industrial ecosystem (IE) for the aluminum fraction in the current scenario (Zaragoza data, 2020).
Sustainability 13 12724 g0a5
Figure A6. Sankey diagram of the carbon footprint of the industrial ecosystem (IE) for the briks fraction in the current scenario (Zaragoza data, 2020).
Sustainability 13 12724 g0a6
Figure A7. Sankey diagram of the carbon footprint of the industrial ecosystem (IE) for the organic fraction in the current scenario (Zaragoza data, 2020).
Sustainability 13 12724 g0a7

References

  1. Kaza, S.; Yao, L.; Bhada-Tata, P.; van Woerden, F. What a Waste 2.0 A Global Snapshot of Solid Waste Management to 2050; World Bank Group: Washington, DC, USA, 2018. [Google Scholar]
  2. Bourguignon, D. European Circular Economy Package: Four Legislative Proposals on Waste. Available online: https://www.europarl.europa.eu/RegData/etudes/BRIE/2017/599288/EPRS_BRI%282017%29599288_EN.pdf (accessed on 2 November 2021).
  3. Girardet, H. Creating Regenerative Cities. Available online: https://www.taylorfrancis.com/books/mono/10.4324/9781315764375/creating-regenerative-cities-herbert-girardet (accessed on 2 November 2021).
  4. Valero, A.; Valero, A. Thermodynamic Rarity and Recyclability of Raw Materials in the Energy Transition: The Need for an In-Spiral Economy. Entropy 2019, 21, 873. [Google Scholar] [CrossRef] [Green Version]
  5. Kennedy, C.; Pincetl, S.; Bunje, P. The Study of Urban Metabolism and Its Applications to Urban Planning and Design. Environ. Pollut. 2011, 159, 1965–1973. [Google Scholar] [CrossRef] [PubMed]
  6. Neves, A.; Godina, R.; Azevedo, S.G.; Matias, J.C.O. A Comprehensive Review of Industrial Symbiosis. J. Clean. Prod. 2020, 247, 119113. [Google Scholar] [CrossRef]
  7. Chertow, M.R. Industrial Symbiosis: Literature and Taxonomy. Annu. Rev. Energy Environ. 2000, 25, 313–337. [Google Scholar] [CrossRef] [Green Version]
  8. Ulhøi, J.P. Industrial Symbiosis in an Extended Perspective; ResearchGate: Berlin, Germany, 2002. [Google Scholar]
  9. Neves, A.; Godina, R.; Azevedo, S.G.; Pimentel, C.; Matias, J.C.O. The Potential of Industrial Symbiosis: Case Analysis and Main Drivers and Barriers to Its Implementation. Sustainability 2019, 11, 7095. [Google Scholar] [CrossRef] [Green Version]
  10. Christensen, T.H.; Damgaard, A.; Levis, J.; Zhao, Y.; Björklund, A.; Arena, U.; Barlaz, M.A.; Starostina, V.; Boldrin, A.; Astrup, T.F.; et al. Application of LCA Modelling in Integrated Waste Management. Waste Manag. 2020, 118, 313–322. [Google Scholar] [CrossRef] [PubMed]
  11. Pérez, J.; de Andrés, J.M.; Lumbreras, J.; Rodríguez, E. Evaluating Carbon Footprint of Municipal Solid Waste Treatment: Methodological Proposal and Application to a Case Study. J. Clean. Prod. 2018, 205, 419–431. [Google Scholar] [CrossRef]
  12. Fernández-Braña, A.; Feijoo, G.; Dias-Ferreira, C. Turning Waste Management into a Carbon Neutral Activity: Practical Demonstration in a Medium-Sized European City. Sci. Total Environ. 2020, 728, 138843. [Google Scholar] [CrossRef] [PubMed]
  13. Bovea, M.D.; Ibáñez-Forés, V.; Gallardo, A.; Colomer-Mendoza, F.J. Environmental Assessment of Alternative Municipal Solid Waste Management Strategies. A Spanish Case Study. Waste Manag. 2010, 30, 2383–2395. [Google Scholar] [CrossRef]
  14. Herva, M.; Neto, B.; Roca, E. Environmental Assessment of the Integrated Municipal Solid Waste Management System in Porto (Portugal). J. Clean. Prod. 2014, 70, 183–193. [Google Scholar] [CrossRef]
  15. Fernández-Nava, Y.; del Río, J.; Rodríguez-Iglesias, J.; Castrillón, L.; Marañón, E. Life Cycle Assessment of Different Municipal Solid Waste Management Options: A Case Study of Asturias (Spain). J. Clean. Prod. 2014, 81, 178–189. [Google Scholar] [CrossRef] [Green Version]
  16. Habib, K.; Schmidt, J.H.; Christensen, P. A Historical Perspective of Global Warming Potential from Municipal Solid Waste Management. Waste Manag. 2013, 33, 1926–1933. [Google Scholar] [CrossRef] [PubMed]
  17. Arushanyan, Y.; Björklund, A.; Eriksson, O.; Finnveden, G.; Söderman, M.L.; Sundqvist, J.O.; Stenmarck, Å. Environmental Assessment of Possible Future Waste Management Scenarios. Energies 2017, 10, 247. [Google Scholar] [CrossRef] [Green Version]
  18. Banias, G.; Batsioula, M.; Achillas, C.; Patsios, S.I.; Kontogiannopoulos, K.N.; Bochtis, D.; Moussiopoulos, N. A Life Cycle Analysis Approach for the Evaluation of Municipal Solid Waste Management Practices: The Case Study of the Region of Central Macedonia, Greece. Sustainability 2020, 12, 8221. [Google Scholar] [CrossRef]
  19. Jeswani, H.K.; Azapagic, A. Assessing the Environmental Sustainability of Energy Recovery from Municipal Solid Waste in the UK. Waste Manag. 2016, 50, 346–363. [Google Scholar] [CrossRef]
  20. Wittmaier, M.; Langer, S.; Sawilla, B. Possibilities and Limitations of Life Cycle Assessment (LCA) in the Development of Waste Utilization Systems—Applied Examples for a Region in Northern Germany. Waste Manag. 2009, 29, 1732–1738. [Google Scholar] [CrossRef]
  21. Ripa, M.; Fiorentino, G.; Vacca, V.; Ulgiati, S. The Relevance of Site-Specific Data in Life Cycle Assessment (LCA). The Case of the Municipal Solid Waste Management in the Metropolitan City of Naples (Italy). J. Clean. Prod. 2017, 142, 445–460. [Google Scholar] [CrossRef]
  22. Zhang, J.; Qin, Q.; Li, G.; Tseng, C.H. Sustainable Municipal Waste Management Strategies through Life Cycle Assessment Method: A Review. J. Environ. Manag. 2021, 287, 112238. [Google Scholar] [CrossRef] [PubMed]
  23. Moffatt, S.; Kohler, N. Conceptualizing the Built Environment as a Social-Ecological System. Build. Res. Inf. 2008, 36, 248–268. [Google Scholar] [CrossRef]
  24. Zhang, Y. Urban Metabolism: A Review of Research Methodologies. Environ. Pollut. 2013, 178, 463–473. [Google Scholar] [CrossRef]
  25. Ngo, N.S.; Pataki, D.E. The Energy and Mass Balance of Los Angeles County. Urban Ecosyst. 2008, 11, 121–139. [Google Scholar] [CrossRef]
  26. Liang, S.; Zhang, T. Comparing Urban Solid Waste Recycling from the Viewpoint of Urban Metabolism Based on Physical Input-Output Model: A Case of Suzhou in China. Waste Manag. 2012, 32, 220–225. [Google Scholar] [CrossRef]
  27. Khalil, H.A.E.E.; Al-Ahwal, A. Reunderstanding Cairo through Urban Metabolism: Formal versus Informal Districts Resource Flow Performance in Fast Urbanizing Cities. J. Ind. Ecol. 2021, 25, 176–192. [Google Scholar] [CrossRef]
  28. European Commission Extended Producer Responsabiity (ERP) in European Union. Available online: https://ec.europa.eu/environment/archives/waste/eu_guidance/introduction.html (accessed on 3 November 2021).
  29. Ministerio Para La Transición Ecológica y el Reto Demográfico Extended Producer Responsability (EPR) Policies in Spain. Available online: https://www.miteco.gob.es/en/calidad-y-evaluacion-ambiental/temas/prevencion-y-gestion-residuos/flujos/responsabilidad-ampliada/ (accessed on 3 November 2021).
  30. Lander Svendsen, N.; Kaarsberg, S.; Watson, D.; Aditi Bhasin, P.; Klugman, S.; Solstad, M.; Larssen, S. How Can Municipalities Support the Development of Industrial Symbiosis? Interreg Baltic Sea Region 2021. Available online: https://symbiosecenter.dk/wp-content/uploads/2021/01/Guide-how-can-municipalities-support-the-development-of-industrial-symbiosis-final-version.pdf (accessed on 2 November 2021).
  31. Vizcaíno-López, A. Contenedor Amarillo S.A., 1st ed.; Fuera de Ruta: Valencia, Spain, 2020. [Google Scholar]
  32. Gobierno de Aragón: Dirección General de Sostenibilidad. Plan GIRA 2018–2022; Gobierno de Aragón, Departamento de Desarrollo Rural y Sostenibilidad: Zaragoza, Spain, 2018.
  33. Ministerio para la Transición Ecológica y Reto Demográfico. Memoria Anual de Generación y Gestión de Residuos de Competencia Municipal, 2018; Ministerio para la Transición Ecológica y Reto Demográfico: Madrid, Spain, 2020.
  34. Ministerio de Agricultura Alimentación y Medio Ambiente. Plan Estatal Marco de Gestión de Residuos (PEMAR) 2016–2022; Ministerio de Agricultura Alimentación y Medio Ambiente: Madrid, Spain, 2016.
  35. Rigamonti, L.; Grosso, M.; Giugliano, M. Life Cycle Assessment for Optimising the Level of Separated Collection in Integrated MSW Management Systems. Waste Manag. 2009, 29, 934–944. [Google Scholar] [CrossRef] [PubMed]
  36. U.S. Environmental Protection Agency. Documentation for Greenhouse Gas Emission and Energy Factors Used in the Waste Reduction Model (WARM)—Containers, Packaging, and Non-Durable Goods Materials Chapters; U.S. Environmental Protection Agency: Washington, DC, USA, 2016.
  37. Tetra Pak Brik Comoposition. Available online: https://www.tetrapak.com/en-in/sustainability/planet/good-for-you-good-for-the-earth/tetra-pak-cartons-recyclable (accessed on 3 November 2021).
  38. Greenrationbook.org the Green Ration Book Resources: The Cost of Everyday Living. Available online: http://www.greenrationbook.org.uk/resources/ (accessed on 2 November 2021).
  39. Martínez-Gasol, C.; Farreny-Gaya, R. Modelo de Cálculo de Emisiones de Gases de Efecto Invernadero Asociadas a Determinados Escenarios de Generación de Residuos Municipales En España; Fundació Fórum Ambiental: Barcelona, Spain, 2011. [Google Scholar]
  40. Pérez, J.; Lumbreras, J.; Rodríguez, E.; Vedrenne, M. A Methodology for Estimating the Carbon Footprint of Waste Collection Vehicles under Different Scenarios: Application to Madrid. Transp. Res. Part D Transp. Environ. 2017, 52, 156–171. [Google Scholar] [CrossRef]
  41. Ministerio Para La Transición Ecológica y el Reto Demográfico España. Informe Inventarios GEI 1990–2018 (Edición2020). Anexo 7. Factores de Emisión de CO2 y PCI de Los Combustibles. Available online: https://www.miteco.gob.es/es/cambio-climatico/temas/comercio-de-derechos-de-emision/es_2020_anexovii_unfccc_nir_tcm30-379357.pdf (accessed on 2 November 2021).
  42. Slorach, P.C.; Jeswani, H.K.; Cuéllar-Franca, R.; Azapagic, A. Energy Demand and Carbon Footprint of Treating Household Food Waste Compared to Its Prevention. In Proceedings of the Energy Procedia; Elsevier Ltd.: Amsterdam, The Netherlands, 2019; Volume 161, pp. 17–23. [Google Scholar]
  43. Amigos de la Tierra El Compostaje Doméstico: Receta Para Reducir Las Emisiones de CO2. Available online: https://www.tierra.org/wp-content/uploads/2016/01/compostaje_reducir_huella_carbono_estatal.pdf (accessed on 2 November 2021).
  44. Wilcox, J.; Mackenzie, J. What We Waste: Tracking 20 Years of Growth in International Drinks Container Wastage, and How Refillables and Deposit Return Systems Can Reverse This Trend; Reloop Platform: Brussels, Belgium, 2021. [Google Scholar]
  45. Sostenibilidadresiduos.es Uso de Bolsas Personalizadas Para La Recogida Comercial En Lleida (Cataluña). Available online: https://sostenibilidadresiduos.es/media/files/Actuaciones/Codigo_01/Codi_01_2.pdf (accessed on 2 November 2021).
  46. Sostenibilidadresiduos.es Uso de Cubos Aireados y Bolsa Compostables Para La Recogida de La Fracción Orgánica En La Mancomunidad de Servicios de Txingudi (País Vasco). Available online: https://sostenibilidadresiduos.es/media/files/Actuaciones/Codigo_50/Codigo_50_2.pdf (accessed on 2 November 2021).
  47. Ecoembes Estadísticas Sobre El Reciclaje de Envases Domésticos En España. Available online: https://www.ecoembes.com/es/ciudadanos/envases-y-proceso-reciclaje/datos-de-reciclaje-en-espana (accessed on 2 November 2021).
  48. SendeCO2 Precio Emisiones de CO2. Available online: https://www.sendeco2.com/es/ (accessed on 2 November 2021).
  49. Delemare, A.; Harding-Rolls, G.; Urbancic, N.; Benegas, X. Hablan Basura: El Manual Corporativo de Soluciones Falsas a La Crisis Del Plástico; Changing Markets Foundation: Utrecht, The Netherlands, 2020. [Google Scholar]
  50. Ecoembes Packaging Law Information. Available online: https://www.ecoembes.com/es/ciudadanos/preguntas-frecuentes-eco#t96n17360 (accessed on 2 November 2021).
  51. Zaragozarecicla.org CTRUZ Information. Available online: https://www.zaragozarecicla.org/el-ctruz/que-es-el-ctruz/ (accessed on 2 November 2021).
  52. Zaragozarecicla.org SAICA Information. Available online: https://www.zaragozarecicla.org/3909/se-puede-reciclar-un-tetrabrick/ (accessed on 2 November 2021).
  53. Verallia_Group Verallia Information. Available online: https://www.verallia.com/en/our-group/about/ (accessed on 2 November 2021).
  54. FundacionCema.org Cemex Information. Available online: https://www.fundacioncema.org/morata-morata-de-jalon/ (accessed on 2 November 2021).
  55. Recycling Technologic Park López Soriano Information. Available online: https://es.wikipedia.org/wiki/PTR_L%C3%B3pez_Soriano (accessed on 2 November 2021).
  56. MercaZaragoza Information. Available online: https://mercazaragoza.es/ (accessed on 2 November 2021).
  57. Urbaser 3R2020 Project: From Waste to Resource through Recycling. Available online: https://www.urbaser.com/2020/10/urbaser-y-clh-investigan-con-exito-la-obtencion-de-combustible-a-partir-de-residuos-plasticos/ (accessed on 2 November 2021).
  58. Bosquedeloszaragozanos.es Bosque de Los Zaragozanos Project. Available online: https://bosquedeloszaragozanos.es/ (accessed on 2 November 2021).
  59. CircularBiocarbon.eu Circular Biocarbon Biorefinery Project. Available online: https://circularbiocarbon.eu/ (accessed on 2 November 2021).
Figure 5. Carbon Footprint (CF) by weight of different packaging systems analyzed for the different scenarios studied. MF: Maximum footprint scenario, CF: Current footprint scenario, m.F: minimum footprint scenario. t CO2/t: ton of CO2 per ton of waste.
Sustainability 13 12724 g005
Figure 6. Sankey diagram of the carbon footprint of the industrial ecosystem (IE) for the P&C in the current scenario (Zaragoza data, 2020).
Sustainability 13 12724 g006
Figure 7. Sankey diagram of the carbon footprint of the industrial ecosystem (IE) for the organic fraction in the current scenario (Zaragoza data, 2020).
Sustainability 13 12724 g007
Table 1. Assumed sorting and recycling efficiencies.
SortingRecycling
TypeEffiencyEffiencyDowncycling
REF[35][35][12]
P&C86%100%80%
Glass94%100%100%
Plastics80%74%75%
Steel80%84%100%
Aluminium95%93%100%
Briks80%70%80%
Table 2. CO2 equivalent emissions per ton are associated with each packaging fraction type. * It has been assumed that briks are made up of 75% cardboard, 20% plastic and 5% aluminum [37] and that only 75% of the cardboard is recycled, the other 25% being waste from the recycling process.
Initial CO2 Footprint Sorting Plant Recycling Plant TransportMBTLandfillLandfill
TypeInitial CO2 FootprintOperationOperationOperationOperationOperationOrganic Decomposition
UnitkgCO2eq/TnkgCO2eq/TnkgCO2eq/TnkgCO2eq/TnkgCO2eq/TnkgCO2eq/TnkgCO2eq/Tn
REF[38][39][35][40][39][39][36]
P&C33104.43.629.733.48.11425
Glass83901.242729.733.48.1-
Plastics680030.228129.733.48.1-
Steel514030.223529.733.48.1-
Aluminium19,67030.230129.733.48.1-
Briks *500130.23.629.733.48.1-
Table 3. Emission factors used in case the data provided were energy consumptions [41].
ResourceElectricityNatural GasDieselFuel-Oil
UnitskgCO2eq/kWhkgCO2eq/GJkgCO2eq/GJkgCO2eq/GJ
Emission factor0.35567477
Table 4. CO2 equivalent emissions per ton for the organic fraction.
Initial CO2 FootprintTransportMBTLandfillLandfill
TypeInitial CO2 FootprintOperationOperationOperationOrganic Decomposition
UnitkgCO2eq/TnkgCO2eq/TnkgCO2eq/TnkgCO2eq/TnkgCO2eq/Tn
REF[42][40][39][39][43]
Organic357029.733.48.11825
Table 5. CO2 equivalent emissions per ton for composting and biomethanization.
CompostingBiomethanisation
TypeOperationOrganic DecompositionAvoidedOperationOrganic DecompositionAvoided
UnitskgCO2/TnkgCO2/TnkgCO2/TnkgCO2/TnkgCO2/TnkgCO2/kWh
REF[39][39][11][39][39][39]
Organic11.9172−2618.030−0.35
Table 6. Evolution of MSW generation and population growth of Zaragoza. “Total waste” only includes mixed waste, lightweight packaging and glass. Not to be confused with MSW, which in addition to these fractions also includes textiles, WEEE, bulky waste and others.
Years2016201720182019
Population661,108664,938666,880674,997
Total Waste
(kg/cap/yr)
356.1356.2366.6370.4
Mixed
Waste
(kg/cap/yr)
Mixed Waste100%313.0312.5318.0321.8
Organic40.0%125.2125.0127.2128.7
Light packaging18.3%57.357.258.258.9
Paper & Cardboard12.2%38.238.138.839.3
Glass4.2%13.113.113.413.5
Textile5.5%17.217.217.517.7
Others19.8%62.061.963.063.7
Separate Collection
(kg/cap/yr)
Light packaging 11.211.712.112.9
Paper & Cardboard 19.118.822.320.4
Glass 12.813.214.215.3
Table 8. Results of the CO2 method for Zaragoza in 2020 for organic fraction. The main results are shown in columns A, B and C. SC: separate collection; t CO2 = ton CO2 equivalent.
Maximum
Footprint (MF.)
Current
Footprint (CF.)
Minimum
Footprint (m.F.)
Current
Avoided Emissions
Potential Avoided EmissionsTotal
Mass
Relative
M.F.
Relative
CF.
Relative
m.F.
ABCA-BB-CDA/DB/DC/D
Unitst CO2t CO2t CO2t CO2t CO2Tt CO2/Tt CO2/Tt CO2/T
OF588,585437,987391,984150,59946,003101,9945.84.33.8
Table 9. Results of the UM of Zaragoza’s industrial ecosystem (IE) for MSW using the carbon footprint method. Savings results in economic terms.
Maximum Footprint
(A)
Current Footprint
(B)
Minimum Footprint
(C)
Current avoided
Emissions (A-B)
Potential
Avoided
Emissions
(B-C)
Current Avoided
Emissions
(A-B)
Potential
Avoided
Emissions
(B-C)
UnitsT CO2 eqT CO2 eqT CO2 eqT CO2 eqT CO2 eq
P&C208,494154,60787,17453,88767,4332,694,000 €3,372,000 €
Glass163,54991,50218,08472,04773,4183,602,000 €3,671,000 €
Plastics210,726180,371126,23730,35554,1341,518,000 €2,707,000 €
Steel28,32521,98410,674634111,310317,000 €566,000 €
Aluminum47,36032,649640014,71126,249736,000 €1,312,000 €
Briks14,41112,146810722654039113,000 €202,000 €
OF588,585437,987391,984150,59946,0037,530,000 €2,300,000 €
Total1,261,450931,246648,660330,205282,58616,510,000 €14,129,000 €
Table 10. City council strategies results: Annual CO2 and Euro savings.
MeasureWaste FractionResultsCO2 Footprint
Avoided (t CO2 eq.)
Cost Avoided €
DRS implementationAluminum cansRecycling rate: 89%22,7091,135,000€
DRS implementationSteel cansRecycling rate: 89%9784489,000€
DRS implementationGlass bottlesRecycling rate: 87%60,5893,029,000€
Collection with identification codeAll separate collection+4.8 pp16,278814,000€
Electronic card-opening locksOrganic fraction+10.8 pp7763388,000€
Publisher’s Note: MDPI stays neutral with regard to jurisdictional claims in published maps and institutional affiliations.

