Article

A Short-Term Power Output Forecasting Based on Augmented Naïve Bayes Classifiers for High Wind Power Penetrations

Department of Climate and Energy Systems Engineering, Ewha Womans University, Seoul 03760, Korea
*
Author to whom correspondence should be addressed.
Sustainability 2021, 13(22), 12723; https://doi.org/10.3390/su132212723
Submission received: 19 October 2021 / Revised: 12 November 2021 / Accepted: 15 November 2021 / Published: 17 November 2021
(This article belongs to the Special Issue Recent Developments in the Renewable and Sustainable Energies)

Abstract

:
Renewable-power-generating resources can provide unlimited clean energy and emit at most minute amounts of air pollutants and greenhouse gases, whereas fossil fuels are contributing to environmental pollution problems and climate change. The share of global power capacity comprising renewable-power-generating resources is increasing. However, due to the variability and uncertainty of wind resources, predicting the power output of these resources remains a key problem that must be resolved to establish stable power system operation and planning. In this study, we propose an ensemble prediction model for wind-power-generating resources based on augmented naïve Bayes classifiers. To select the principal component that affects the wind power outputs from among various meteorological factors, such as temperature, wind speed, and wind direction, prediction of wind-power-generating resources was performed using multiple linear regression (MLR) and a naïve Bayes classification model based on the selected meteorological factors. We proposed applying the analogue ensemble (AnEn) algorithm and the ensemble learning technique to predict the wind power. To validate this proposed hybrid prediction model, we analyzed empirical data from the wind farm of Jeju Island in South Korea and found that the proposed model has lower error than the single prediction models.

1. Introduction

Recently, the installation of large-scale offshore wind farms has been increasing due to the shortage of new onshore wind farm construction sites and the high quality of offshore wind farm resources. Both onshore and offshore, it is important to predict wind power outputs for stable power system operation because wind-power-generating resources exhibit great variability in their output depending on the weather conditions [1,2,3]. Various prediction models and parameters used to predict wind power output were analyzed through literature review. Reducing the intermittency of renewable energy sources increases the competitiveness of renewable energy in electricity generation and brings economic benefits. Various prediction models for wind power output prediction have already been proposed, and research is underway to improve the prediction accuracy of several proposed prediction models. According to [4], research to reduce generation intermittency by integrating geographically (or technologically) diverse sources has been widely conducted, and in [4], geographically diverse wind farms are integrated through pooling to reduce wind power output prediction errors. Finally, harvest areas were selected, and CVaR (conditional value at risk) was applied to model the optimal wind power portfolio for each harvest region. Through the review of many previous studies, it can be seen that the most used parameter as input data for wind power output prediction is wind speed. In fact, as a result of analyzing the correlation between various weather and wind power outputs (empirical data) in Section 3, the variable with the highest correlation with wind power output was wind speed. If the predicted wind speed at the time of prediction differs from the wind power output trend, the correlation between the wind speed and the wind power output decreases, and thus the prediction accuracy of the wind power output decreases. To improve this, wind speed prediction was performed using variational mode decomposition (VMD) and echo state network (ESN) techniques in [5,6]. In [5], wind speed prediction was performed using a VMD-DE (differential evolution)-ESN hybrid model, and in [6], a wind speed prediction model based on VMD and IWOA-ESN was proposed. The wind speed data are decomposed, and noise is removed through VMD, and the main characteristics of each frequency are extracted. Then the final wind speed is predicted for each subseries data by predicting the wind speed for each series based on the proposed prediction model. If the accuracy of the wind speed predicted through the methodologies proposed in [5] and [6] is high, the accuracy of wind power output prediction using the wind speed prediction value can be increased. In addition, by establishing a wind power generation operation plan (scheduling), it is possible to increase the wind energy utilization rate and reduce power generation costs. Previous studies have mainly used supervisory control and data acquisition (SCADA) and wind speed (m/s) as input data to predict short-term wind power with the training data being used for short periods of approximately 24 h up to a long period of 5 years [7,8,9,10]. However, when wind power prediction is performed using only a single variable (i.e., wind speed), the predictions may be biased or distorted depending on the characteristics of the wind speed data. In this study, we used SCADA data and wind speed (m/s), temperature (°C), wind direction (°), and atmospheric pressure (atm) data as input variables to predict wind power outputs, and we propose an algorithm that applies an analogue ensemble based on the multiple linear regression model and naïve Bayes classification model. The meteorological data comprised measured values provided by the Korea Meteorological Agency, and the final wind power outputs were predicted by calculating the weights for each prediction model after comparing the actual and predicted values of the previous month. Before performing multiple linear regression analysis on the selected meteorological variables, the correlation coefficient between each pair of weather data variables was calculated to determine whether there was multicollinearity, and the independent variables exhibiting multicollinearity were excluded or partially removed. Short-term wind power prediction is necessary to correct data errors and missing data through data processing. In a previous study, a Fourier-fitting-based power curve was calculated to correct data errors and missing data [9]. Data errors and missing data were corrected through the calculated power curve; when the wind speed and wind power output were both missing, the missing value was estimated as the average previous and following days. However, when both wind speed and wind power output are missing for longer periods, it is difficult to estimate missing values by averaging. In this study, to address this problem, applying a spatial ensemble is recommended as a future work to predict weather data for target points.
The key points of this study are as follows:
  • The purpose of this study is to reduce the prediction bias and improve the prediction performance of a single prediction model for wind power generation resources. An analogue ensemble was applied to the deterministic wind power output predictions calculated from a single prediction model, and the proposed algorithm was verified using data from the wind farm of Jeju Island.
  • Verification using empirical data confirmed that the proposed algorithm has higher prediction accuracy than a single prediction model. Therefore, the proposed algorithm is expected to be utilized in the power system as follows. (1) forecasting of the output of wind power resources and other renewable energy resources, (2) establishment of a real-time power system operation plan considering the characteristics of renewable energy power generation using probabilistic power output modeling, (3) promotion of renewable energy projects, and (4) establishment of a transmission network and substation expansion plan.
In summary, the proposed algorithm will contribute to resolving the instability of the power system due to the penetration of large-scale renewable energy. The remainder of this paper is organized as follows. Section 2 presents the methodology of the wind-power-generating resource prediction models. The theory and processes of each prediction model (i.e., multiple linear regression and naïve Bayes classification) are expressed in pseudocode, and the proposed augmented naïve Bayes classifier prediction model is explained through an algorithm. In Section 3, the prediction results estimated using the single prediction models and the proposed hybrid short-term prediction model are compared. The error evaluation index is the normalized mean absolute error (NMAE), adjusted R-squared ( R 2 ), and root mean square error (RMSE). Finally, Section 4 presents the conclusions and directions for future work.

2. Methodology

2.1. Multiple Linear Regression Model

Wind power is most affected by wind speed (i.e., wind power and wind speed are strongly correlated), and many previous studies have thus used wind speed as the input for predicting wind power. In this study, an analysis of the correlation between meteorological variables and SCADA data was performed to predict wind power, and multiple linear regression analysis was performed using meteorological variables that affect wind power, such as temperature, wind direction, and wind speed. MLR is a regression analysis technique in which the relationship between multiple explanatory variables and a single dependent variable is modelled using a linear equation. Equation (1) is the MLR model function equation [11]:
y = β 0 + β 1 x 1 + β 2 x 2 + + β k x k + ε ,
In this study, a multiple regression model for predicting the dependent variable (y) with multiple independent variables (x) was applied to wind power prediction. According to [12], when the independent variables are strongly correlated, multicollinearity is considered to be present. In this case, the variance of the estimated regression coefficients is large, making it difficult to accurately estimate and test parameters, thus reducing the reliability of the estimated regression model. Therefore, to predict wind power using an MLR model, it is necessary to examine whether multicollinearity exists by calculating the pairwise correlations of the independent variables. When one or more pair exhibits high correlation, it is necessary to remove or partially remove one or more of the independent variables. In our multiple regression analysis, the regression coefficients were estimated using the method of least squares, and the significance of the model was verified to determine whether to reject the null hypothesis. If the null hypothesis was rejected, the calculated regression equation was determined to be significant, and the adjusted R-squared value was calculated to evaluate the model fit. Algorithm 1 provides the pseudocode for the MLR model for short-term wind power prediction.
Algorithm 1. MLR
Input: Measured data, numerical weather prediction, installed capacity (MW)
Output: Wind power outputs (MW)
1: for forecasting data = forecasting start date to forecasting end date
2: Training data ∈ Input data (Date < forecasting date)
3: Evaluate multicollinearity
4:  if correlation coefficient < 0.8 then
5:   1. Estimate the regression coefficient
6:   2. Significance test:
7:    ifp-value < 0.05 then
8:     Return null hypothesis = Reject
9:   3. Goodness of fit test:
10:    if adjusted R-square (R2) > 0.65 (general value) then
11:     Return goodness of fit = True
12:   4. Predict wind power (ft)
13:    if ft < 0 then
14:     Return ft = 0
15:   end if
16:   if ft > installed capacity then
17:     Return ft = installed capacity
18:   end if
19: end

2.2. Naïve Bayes Classification Model

The naïve Bayes classification model performs prediction by generating classification rules based on Bayes’ rule. All possible outcomes of the variable to be classified are assigned a posterior probability according to their prior probability and likelihood value, and the outcome with the highest probability is used as the final wind power prediction [13,14,15]. Equation (2) is the naïve Bayes classification model equation [13]:
p ( θ | γ ) = p ( γ | θ ) p ( θ ) p ( γ ) p ( γ | θ ) p ( θ ) ,
where p ( θ | γ ) is the posterior probability, which is proportional to the product of the likelihood p ( γ | θ ) and the prior distribution or prior probability p ( θ ) .
The prior probability is the probability that event γ occurs before event θ occurs. The number of each classification variable determines the prior probability until new data are obtained. The prior probabilities are expressed as the ratio of the number of specific classification variables to the total number of classifications. The likelihood represents the probability of occurrence of event γ when event θ occurs, and the probability is calculated assuming that the attribute variables are independent of each other. Equation (3) is a likelihood function [13]:
p ( γ | θ ) = i = 1 n p ( γ i | θ ) ,
Maximum likelihood estimation is an estimation method for finding the parameter values that maximizes the likelihood, where the point θ * at which the posterior probability p ( θ | γ ) attains its maximum is the maximum a posteriori estimate. Equation (4) is the equation for maximum likelihood estimation [14]:
θ * = argmax θ   p ( θ | γ ) = argmax θ [ p ( γ | θ ) · p ( θ ) ] = argmax θ = p ( γ | θ ) ,
In other words, p ( γ | θ ) is a normalization constant with p ( θ ) determining the shape of the θ distribution and p ( γ ) normalizing the shape. To apply Bayesian theory to short-term wind power output prediction, it is necessary to generate classification rules for measured data, such as the wind power outputs and meteorological variables. By calculating the product of the prior probability and likelihood, the wind power outputs with the highest posterior probability for each time period were selected to derive the final output prediction for the wind farm. Algorithm 2 shows the pseudocode of the naïve Bayes classification model for short-term wind power prediction.
Algorithm 2. Naïve Bayes classification
Input: Measured data, numerical weather prediction, installed capacity (MW)
Output: Wind power outputs (MW)
1: for forecasting data = forecasting start date to forecasting end date
2: Training data ∈ Input data (Date < forecasting date)
3: 1. Calculate the prior probability and likelihood
p ( γ | θ ) = i = 1 n p ( γ i | θ ) ,
4: 2. Calculate the posterior probability
p ( θ | γ ) = p ( γ | θ ) p ( θ ) p ( γ ) ,
5: 3. Select the maximum a posteriori estimate
θ * = argmax θ   p ( θ | γ ) ,
6: 4. Predict wind power (ft)
7:  if ft < 0 then
8:   Return ft = 0
9:  end if
10:   if ft > installed capacity then
11:    Return ft = installed capacity
12:  end if
13: end

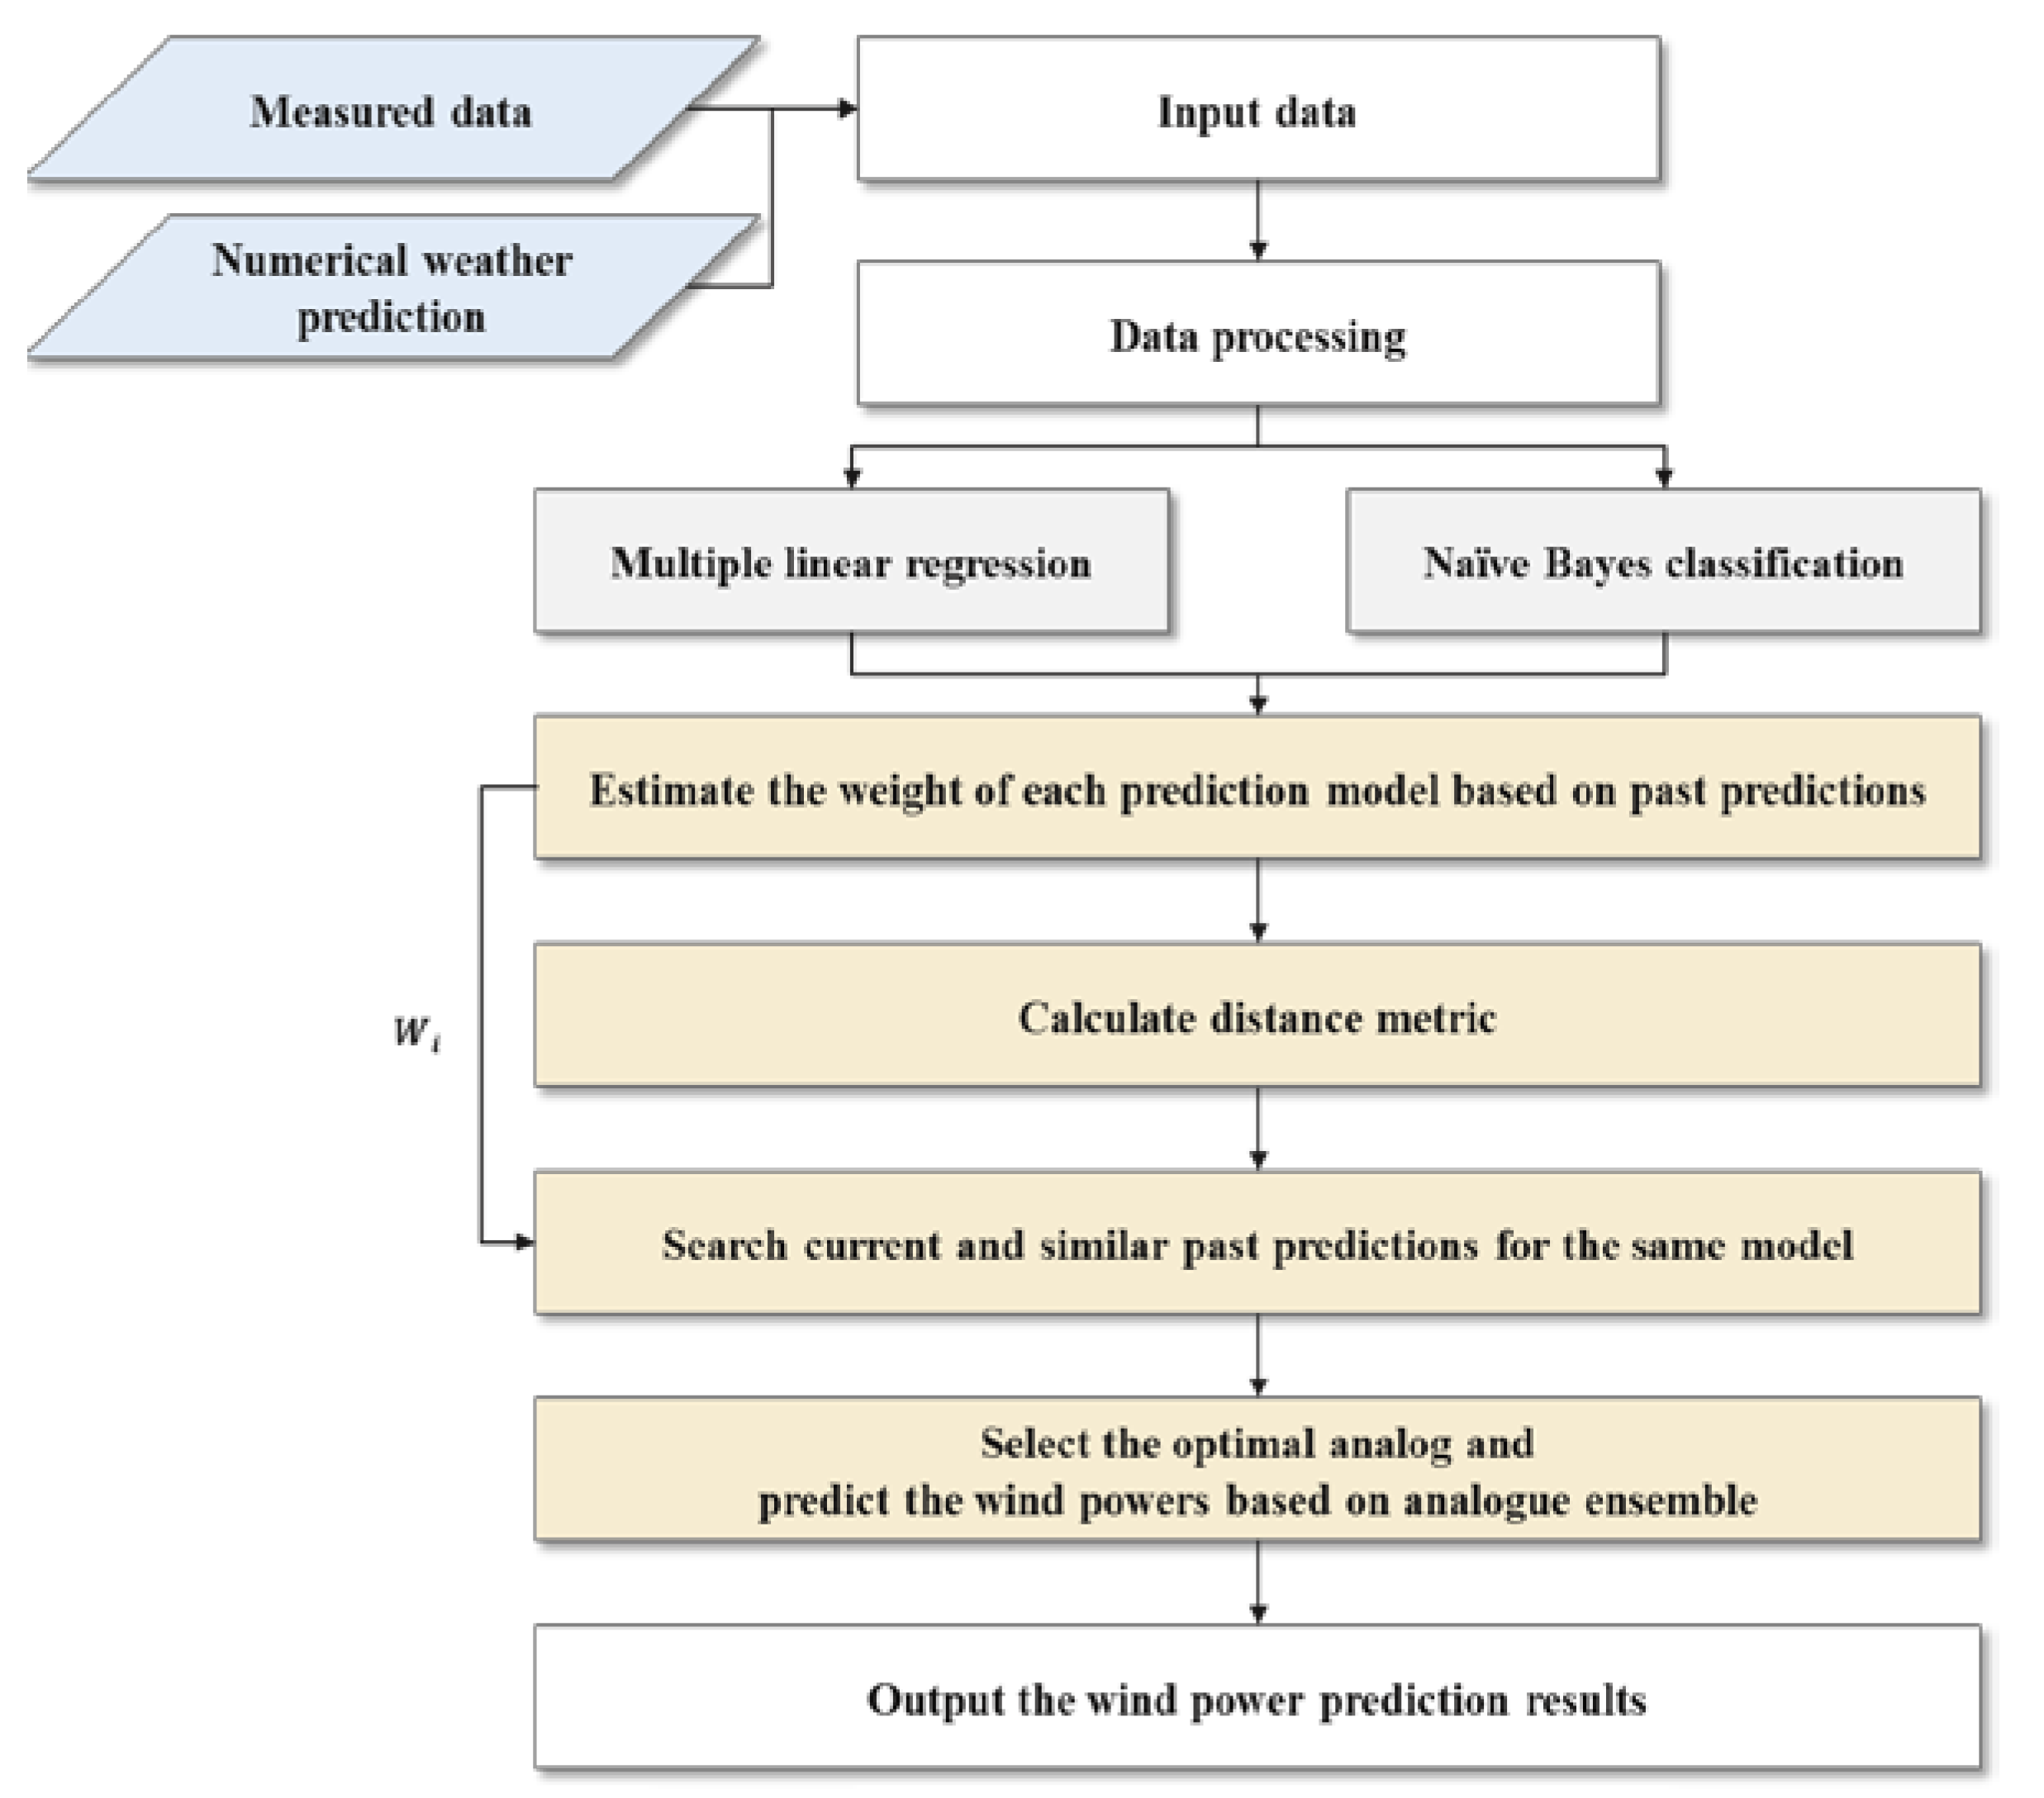
2.3. Hybrid Short-Term Prediction Model: Augmented Naïve Bayes Classifiers

If short-term wind power prediction is performed using only a single prediction model, the prediction result may be biased according to the characteristics of the model. The augmented naïve Bayes classifier proposed in this study is a hybrid short-term prediction model that applies an analogue ensemble to the deterministic predicted values calculated using the MLR model and the naïve Bayes classification model. The proposed model reduces the prediction bias of a single prediction model and improves the short-term wind power prediction performance. The analogue ensemble is a prediction technique that outputs probabilistic predictions based on the deterministic prediction values of single models. It uses a distance metric to search for a past situation similar to the prediction situation in the present period for the same single model. The measured data from the similar past prediction time is designated as the analogue, and the predicted value for the present time is reconstructed based on the selected analogue values. The distance metric for selecting the analogues was proposed by [16,17]:
| | F t A t | | = i = 1 N ω i σ i j = t ˜ t ˜ ( F i , t + j A i , t + j ) 2 ,
where F t is the prediction at time t, A t + j is the past prediction at time t + j , ω i is the weight for the i t h prediction model, and σ i is the standard deviation of the past prediction for the training period of the i t h prediction model [16,17,18]. Figure 1 illustrates the algorithm of the hybrid short-term prediction model proposed in this study. Short-term wind power prediction is performed by applying each prediction model to the input data, which is first corrected for outliers and missing values through data processing.
An analogue ensemble was applied based on the deterministic wind power prediction for each time period estimated by each prediction model. To perform analogue ensemble modeling, it was necessary to calculate the weights for each model. Equations (6) and (7) are the weight optimization equations:
M i n f ( x ) = 1 m i = 1 m | M t i = 1 n ω i F i , t | ,
s . t i = 1 n ω i = 1 ,
After calculating the weights, the distance metric with past prediction was calculated. The distance metric quantifies the similarity between the predicted value of the prediction time point and the past prediction. As the distance decreases, the difference between the predicted value and the prediction decreases, and the past measured value at the time point becomes an analogue candidate. The optimal number of analogues was determined from several analogue candidates, and the final short-term wind power prediction for the prediction time was output through the distribution of the determined analogues.

3. Case Study

To verify the proposed prediction model, the short-term wind power of wind farm A on Jeju Island was predicted using past weather data and SCADA-measured data.

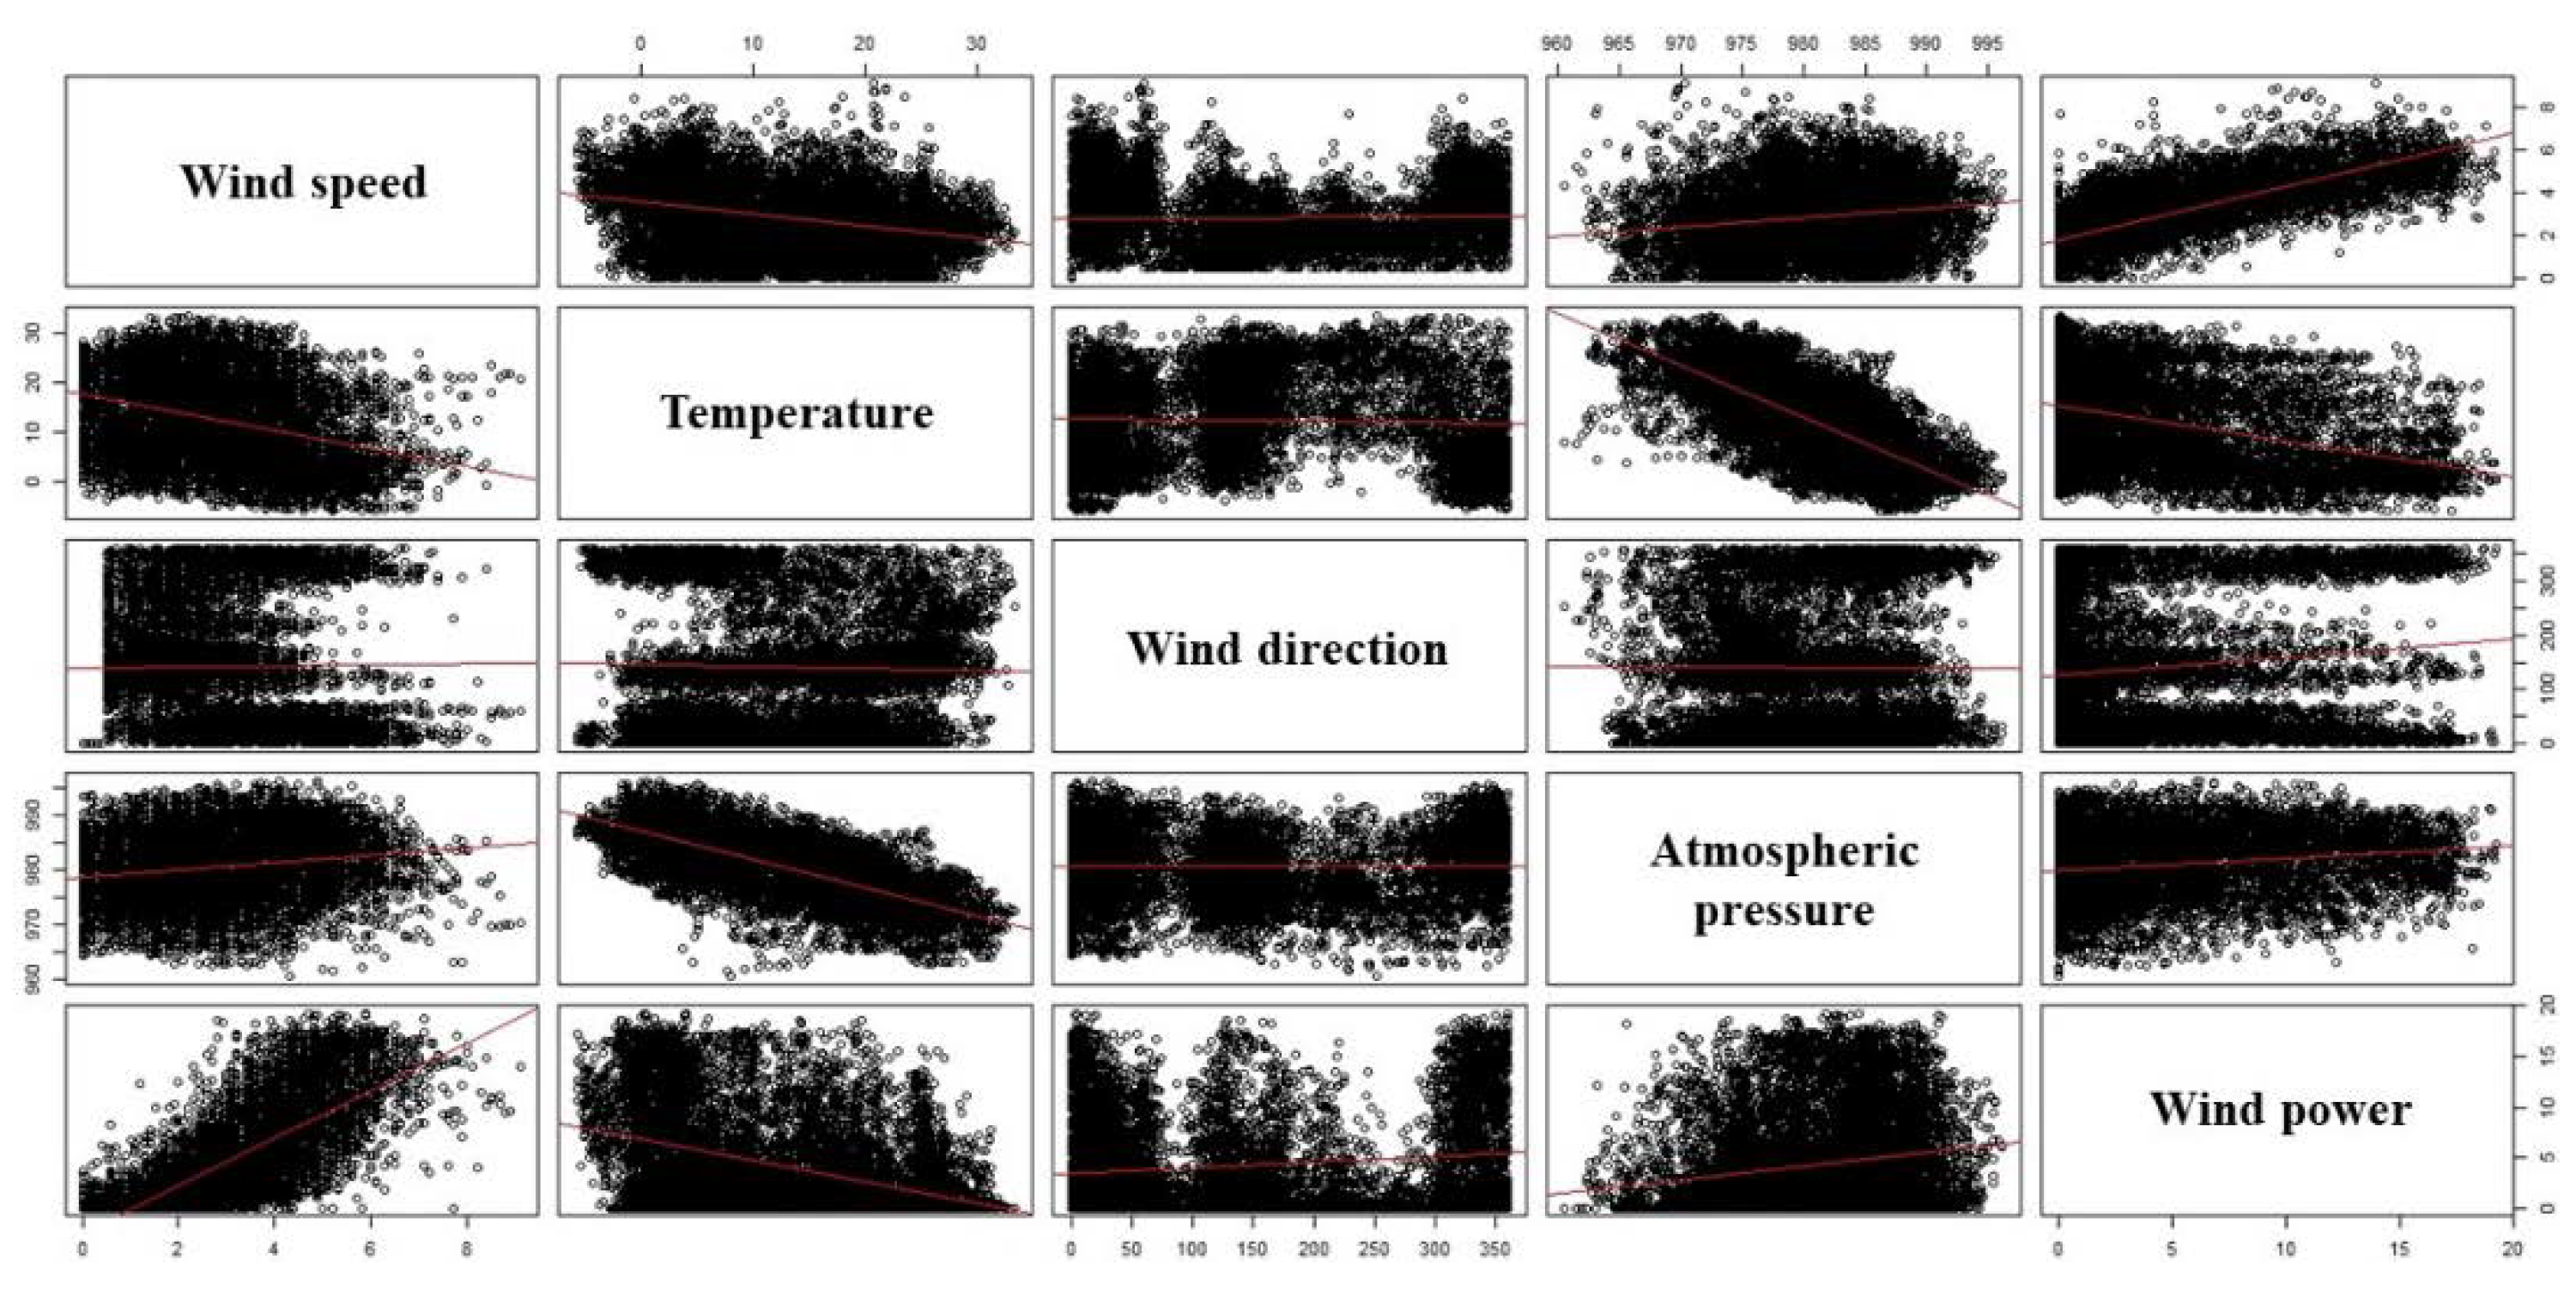
3.1. Data Processing

The input data were divided into three types: measured data, numerical weather predictions, and installed capacity. The measured data were subdivided into wind power output (MW) and meteorological data, which included wind speed (m/s), wind direction (°), temperature (°C), and atmospheric pressure (atm). The meteorological data were weather forecast data provided by the Korea Meteorological Agency. The input data period was 0:00 on 1 January 2017 to 23:00 on 31 May 2018. Missing time data were classified according to the missing time, and data preprocessing was performed. In the case of missing data within 1 h for data collected hourly, the missing value was replaced by the average of the preceding and following time points. In the case of missing data exceeding 1 h, the missing values were replaced by data acquired from another weather station that was nearest to that with missing data. Table 1 and Table 2 provide an overview and examples of the input data used for the wind power prediction of wind farm A on Jeju Island.
Figure 2 shows the result of the correlation analysis of the input data variables, which were examined for multicollinearity [12].
As evident in Figure 2, multicollinearity is not an issue in the input data because the correlation between the independent variables is weak. In addition, the explanatory power in predicting wind power output is expected to be higher than other variables because wind speed and atmospheric pressure are strongly correlated with wind power.

3.2. Short-Term Wind Power Prediction

The input data were SCADA data and weather data (wind speed, temperature, wind direction, and atmospheric pressure) from 1 January 2017 to 30 April 2018, which was the training period. The prediction period was from 0:00 on 1 April 2018 to 23:00 on 31 May 2018 (2 months).
To apply the analogue ensemble, wind power prediction data from past time points are required. In this study, we used past measured values and predicted values from 1 month before the prediction period. That is, the wind power was predicted from 0:00 on 1 April 2018 to 23:00 on 30 April 2018. The short-term wind power prediction data were estimated by applying an analogue ensemble based on the measured and predicted data of April 2018 and the predicted data of May 2018 for each prediction model.

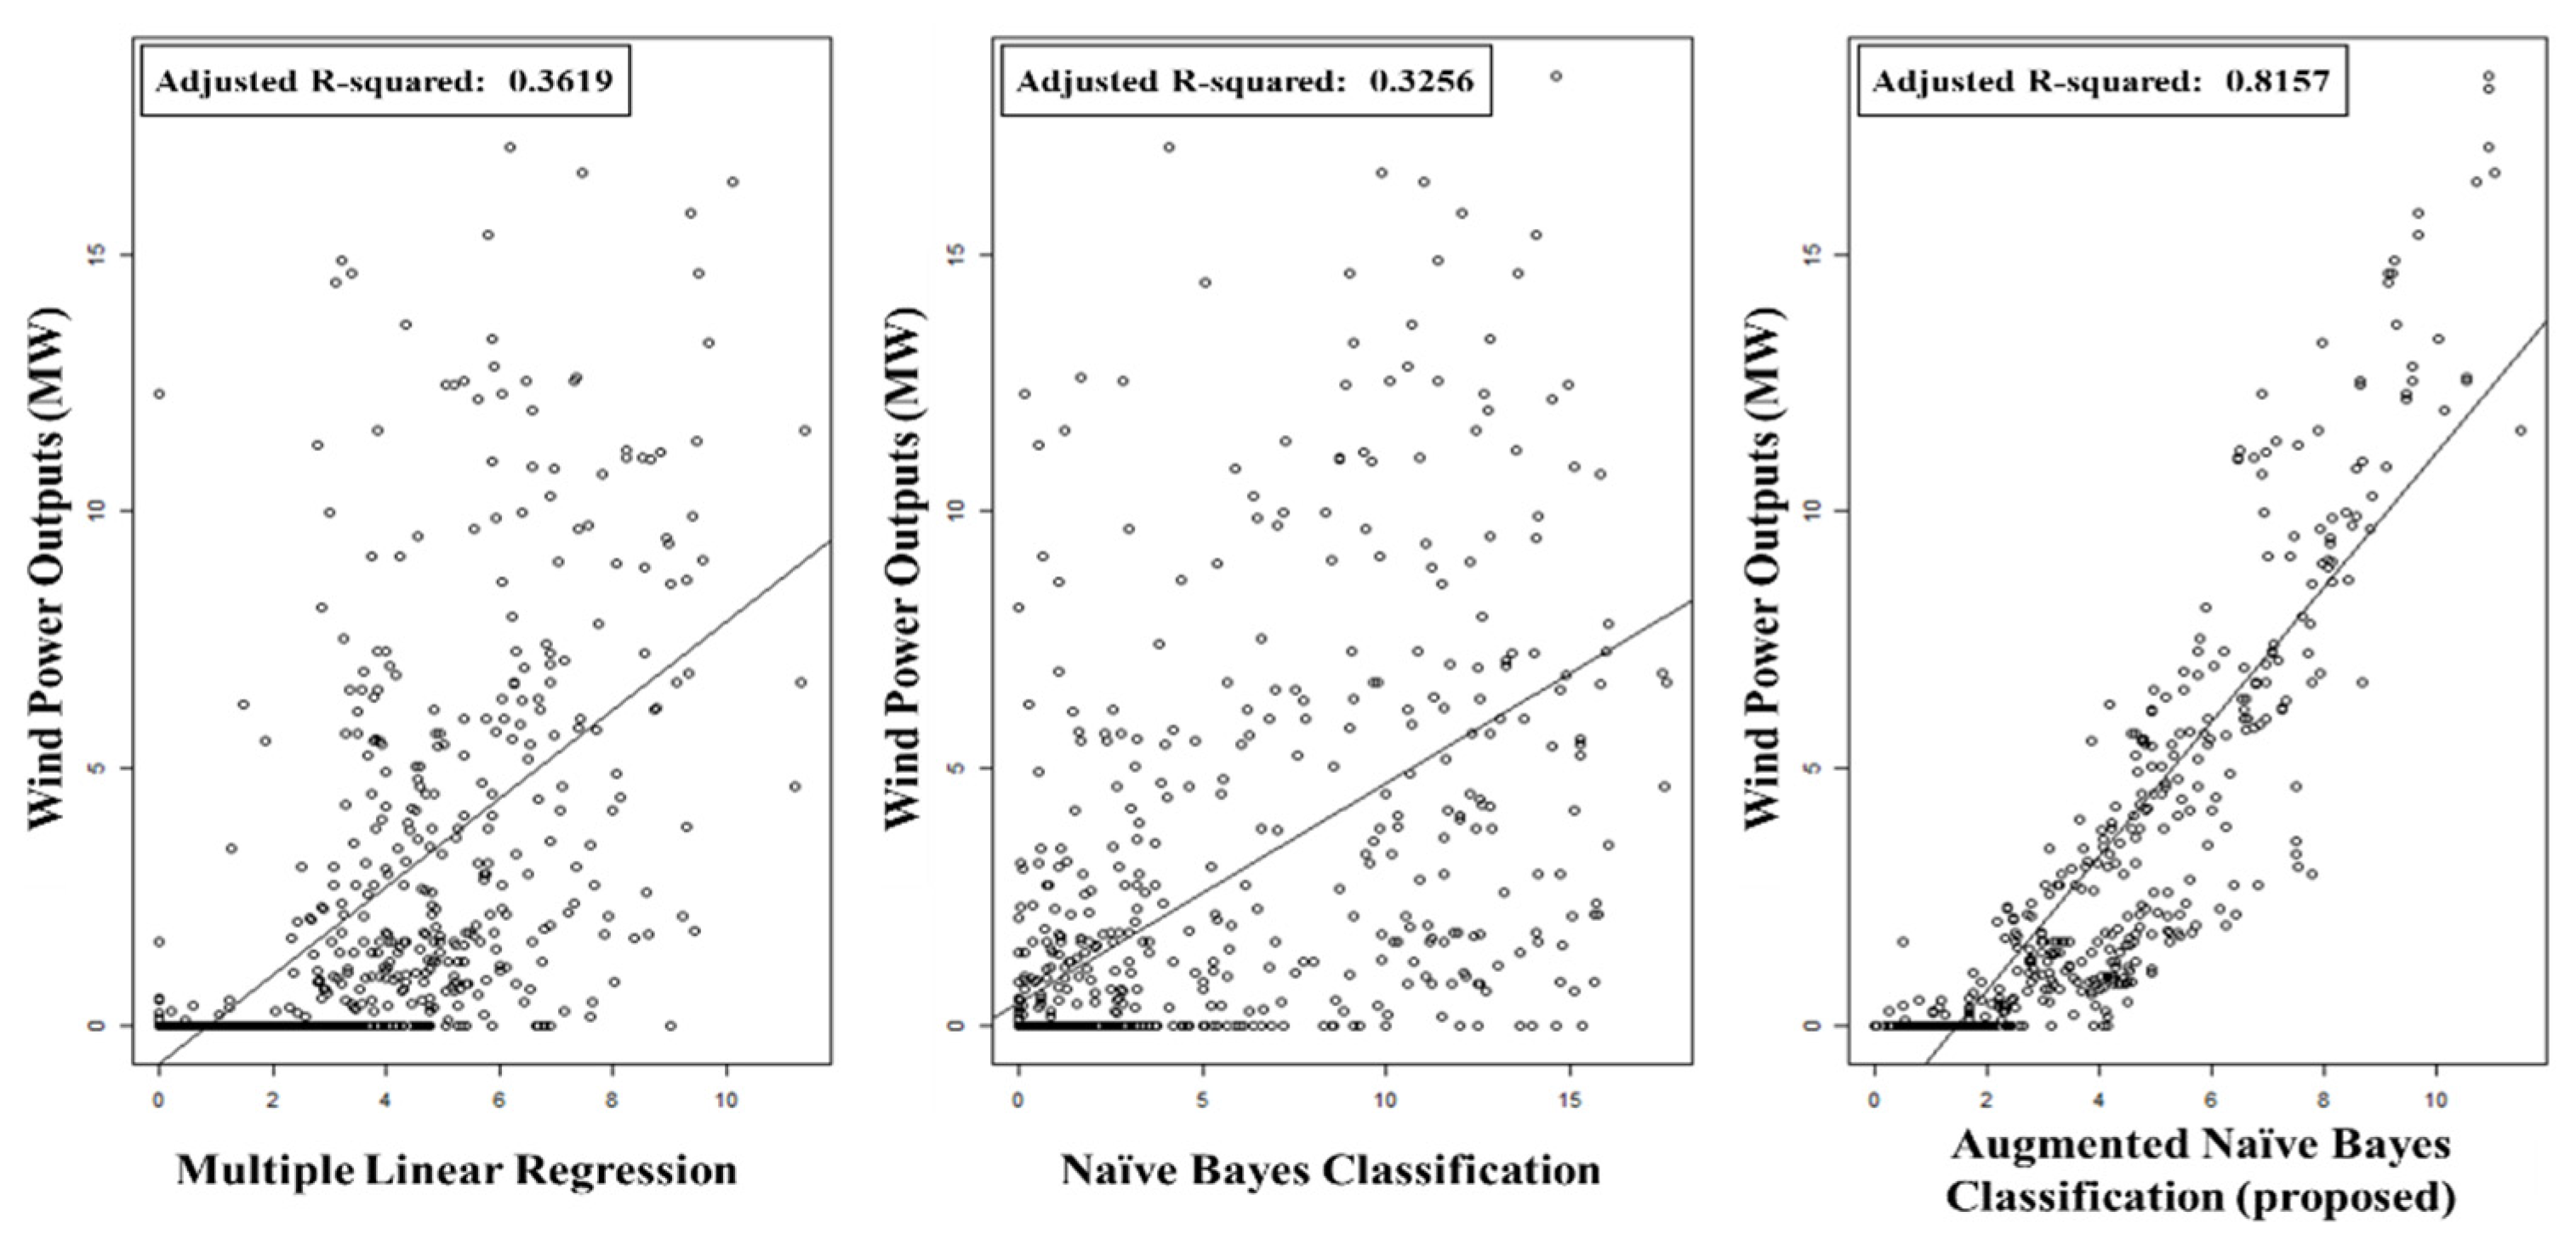
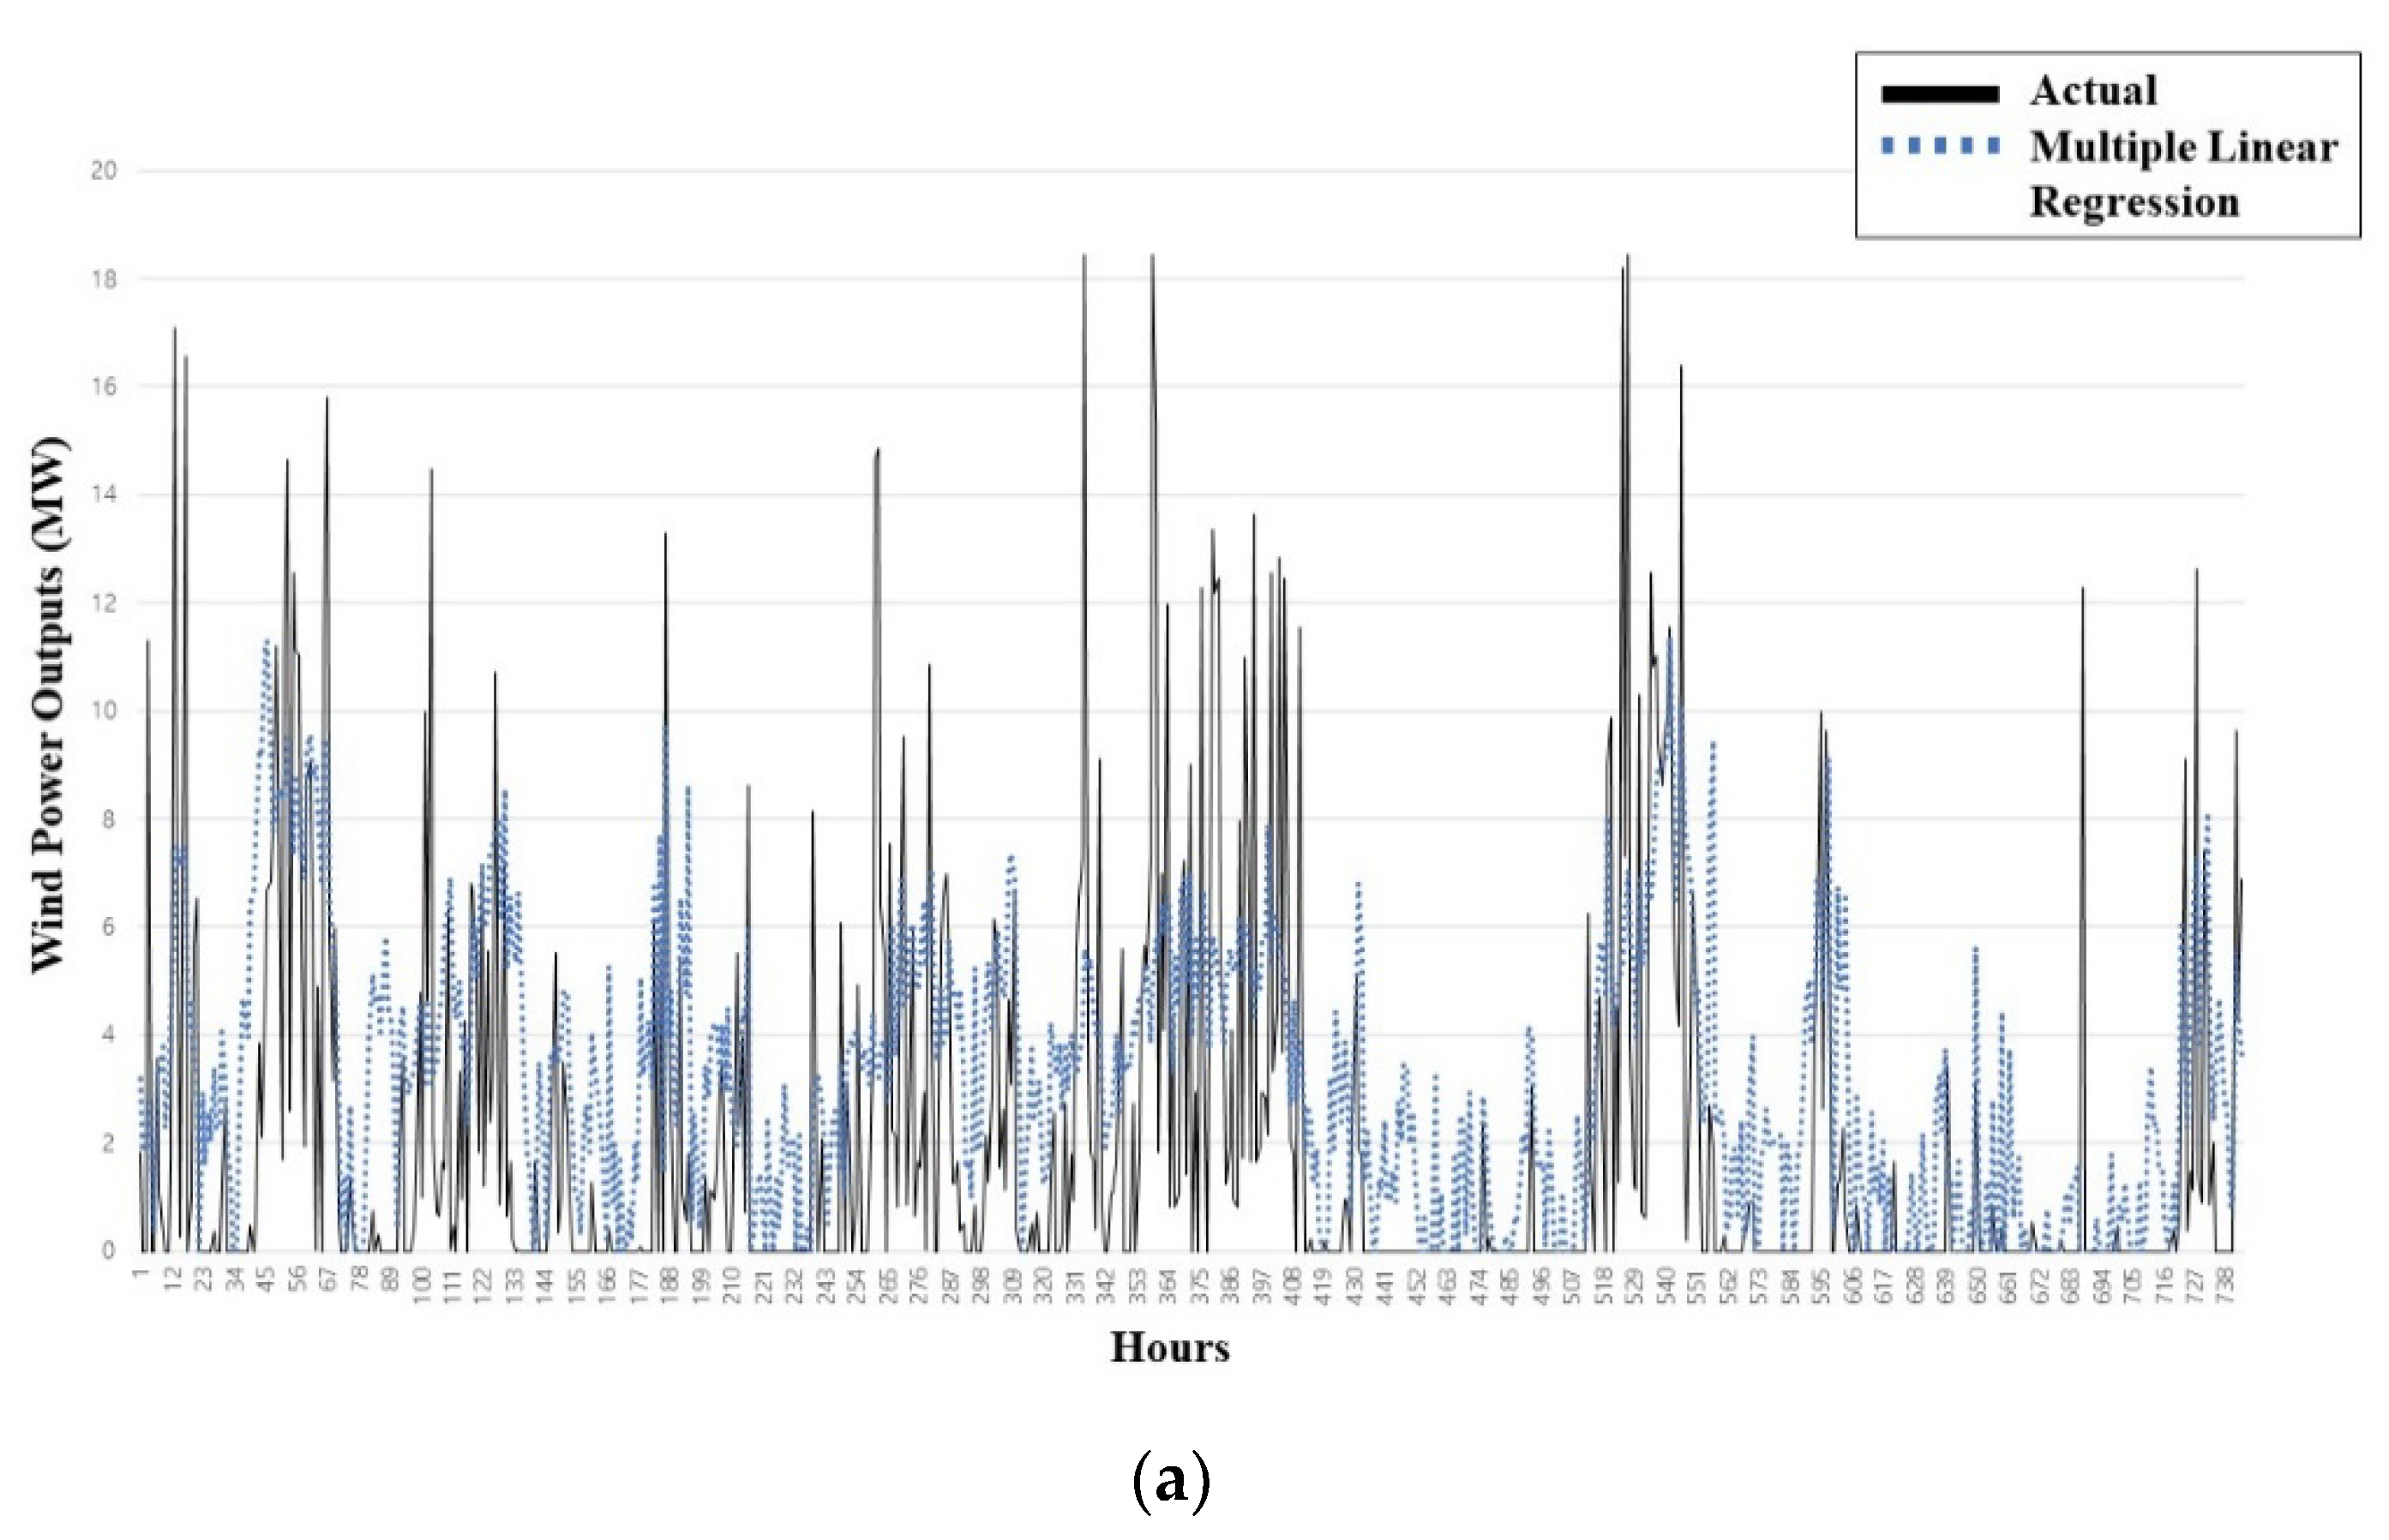
3.3. Analysis of Short-Term Wind Power Prediction Results

In this section, the short-term wind power prediction results estimated using the single prediction model and the proposed hybrid prediction model are analyzed. The prediction results were evaluated in terms of the NMAE, adjusted R 2 , and RMSE [19,20]:
NMAE = 1 n i = 1 n | ( P p r e d i c t e d ) i ( P m e a s u r e d ) i I n s t a l l e d   c a p a c i t y | ,
RMSE = 1 n i = 1 n [ ( P p r e d i c t e d ) i ( P m e a s u r e d ) i ] 2 ,
R 2 = 1 i = 1 n [ ( P p r e d i c t e d ) i ( P m e a s u r e d ) i ] 2 i = 1 n [ ( P m e a s u r e d ) i 1 n i = 1 n [ ( P m e a s u r e d ) i ] ] 2   ,
Adjusted   R 2 = n 1 ( n p 1 ) ( 1 R 2 )   .
The single prediction model used in this study, MLR, and the naïve Bayes classifier prediction model, respectively, may be biased or distorted depending on the characteristics of the prediction model. On the other hand, the proposed augmented naïve Bayes classifier prediction model predicts wind power outputs 1 month before the forecast period, and is a probabilistic forecasting technique that predicts the present by comparing prediction data in the past and actual measurement data similar to the forecast situation in the current period. Therefore, in the theory aspect, it is estimated that the wind power output prediction accuracy will be higher because the proposed prediction model has a lower probability of occurrence of prediction bias than single prediction models. The results of comparing the error evaluation index of each prediction model are as follows. Table 3 lists the error evaluation indexes of the single models and of the augmented naïve Bayes classifier model in which analogue ensembles were applied to the deterministic prediction data, which are the output of MLR and naïve Bayes classification.
Figure 3 shows the measured and predicted values for each prediction model with adjusted R 2 . It can be confirmed that the prediction of the proposed model has higher accuracy than single prediction models.

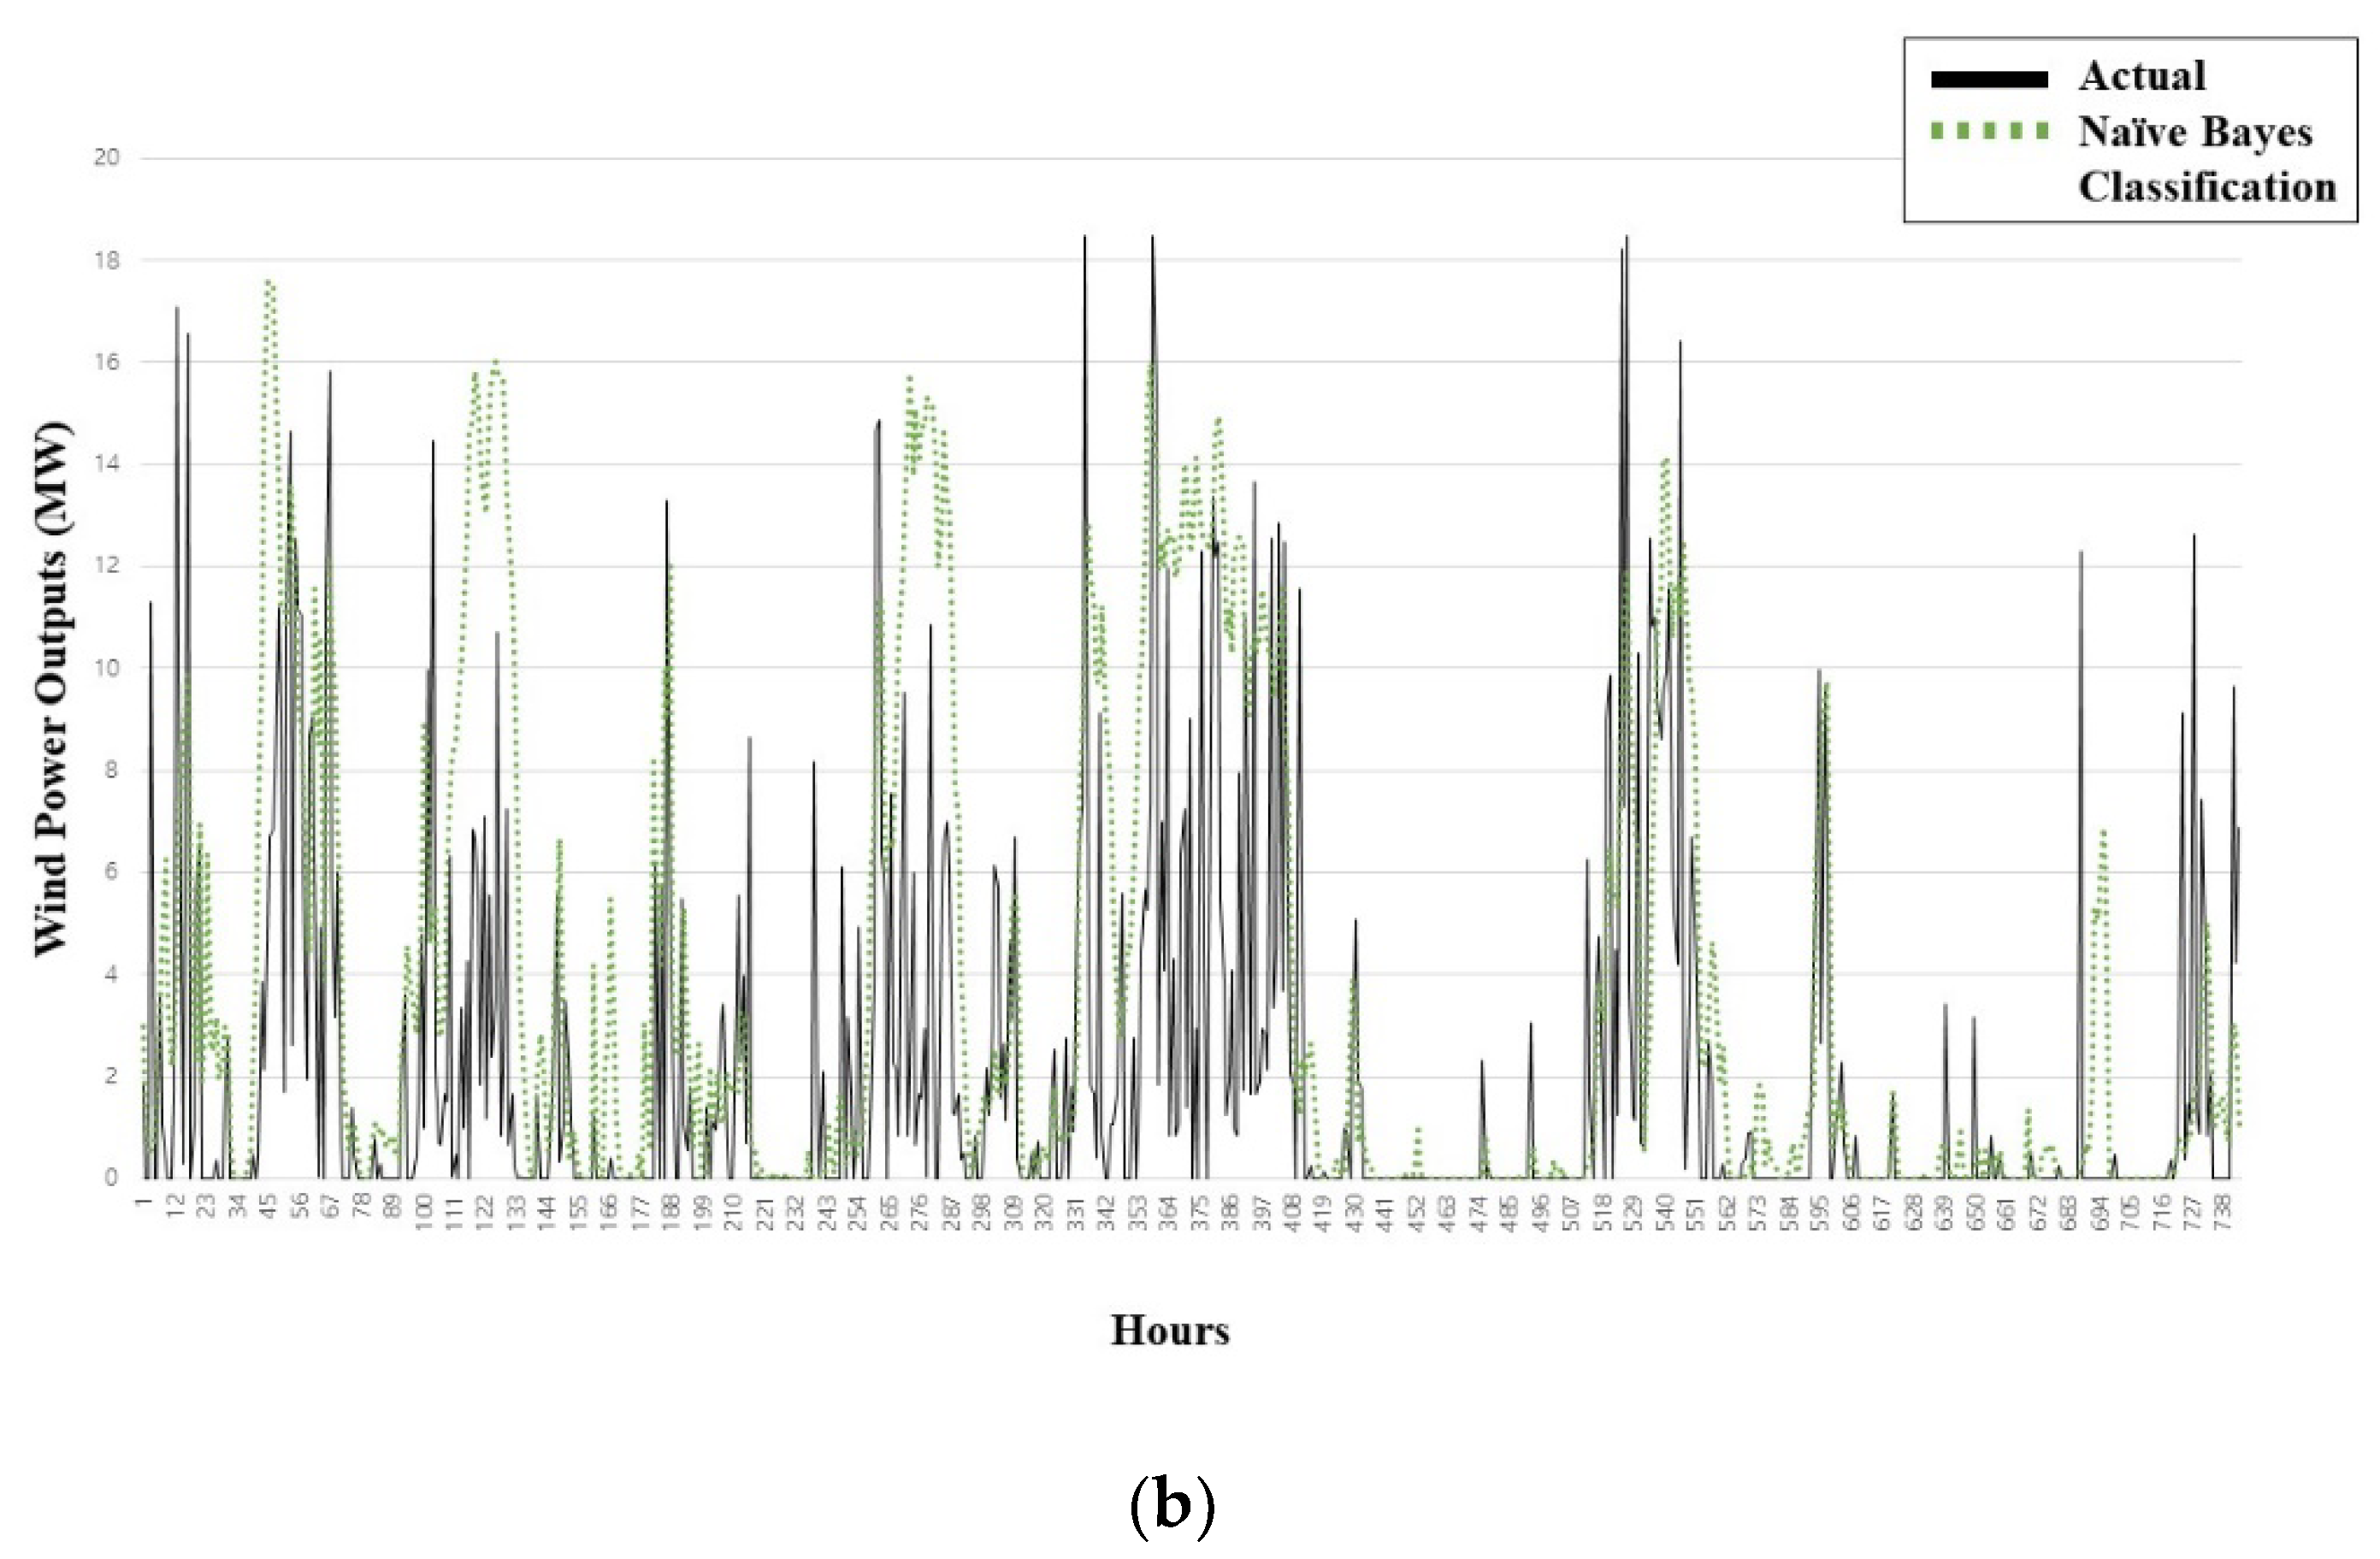
3.3.1. Single Prediction Models: MLR and Naïve Bayes Classification

The wind power was predicted from 1 May 2018 to 31 May 2018 using two single prediction models for short-term wind power prediction. Figure 4a,b shows the prediction results of the MLR model and the naïve Bayes classification model. The NMAE was 10.92% for the MLR model and 12.41% for the naïve Bayes classification model.

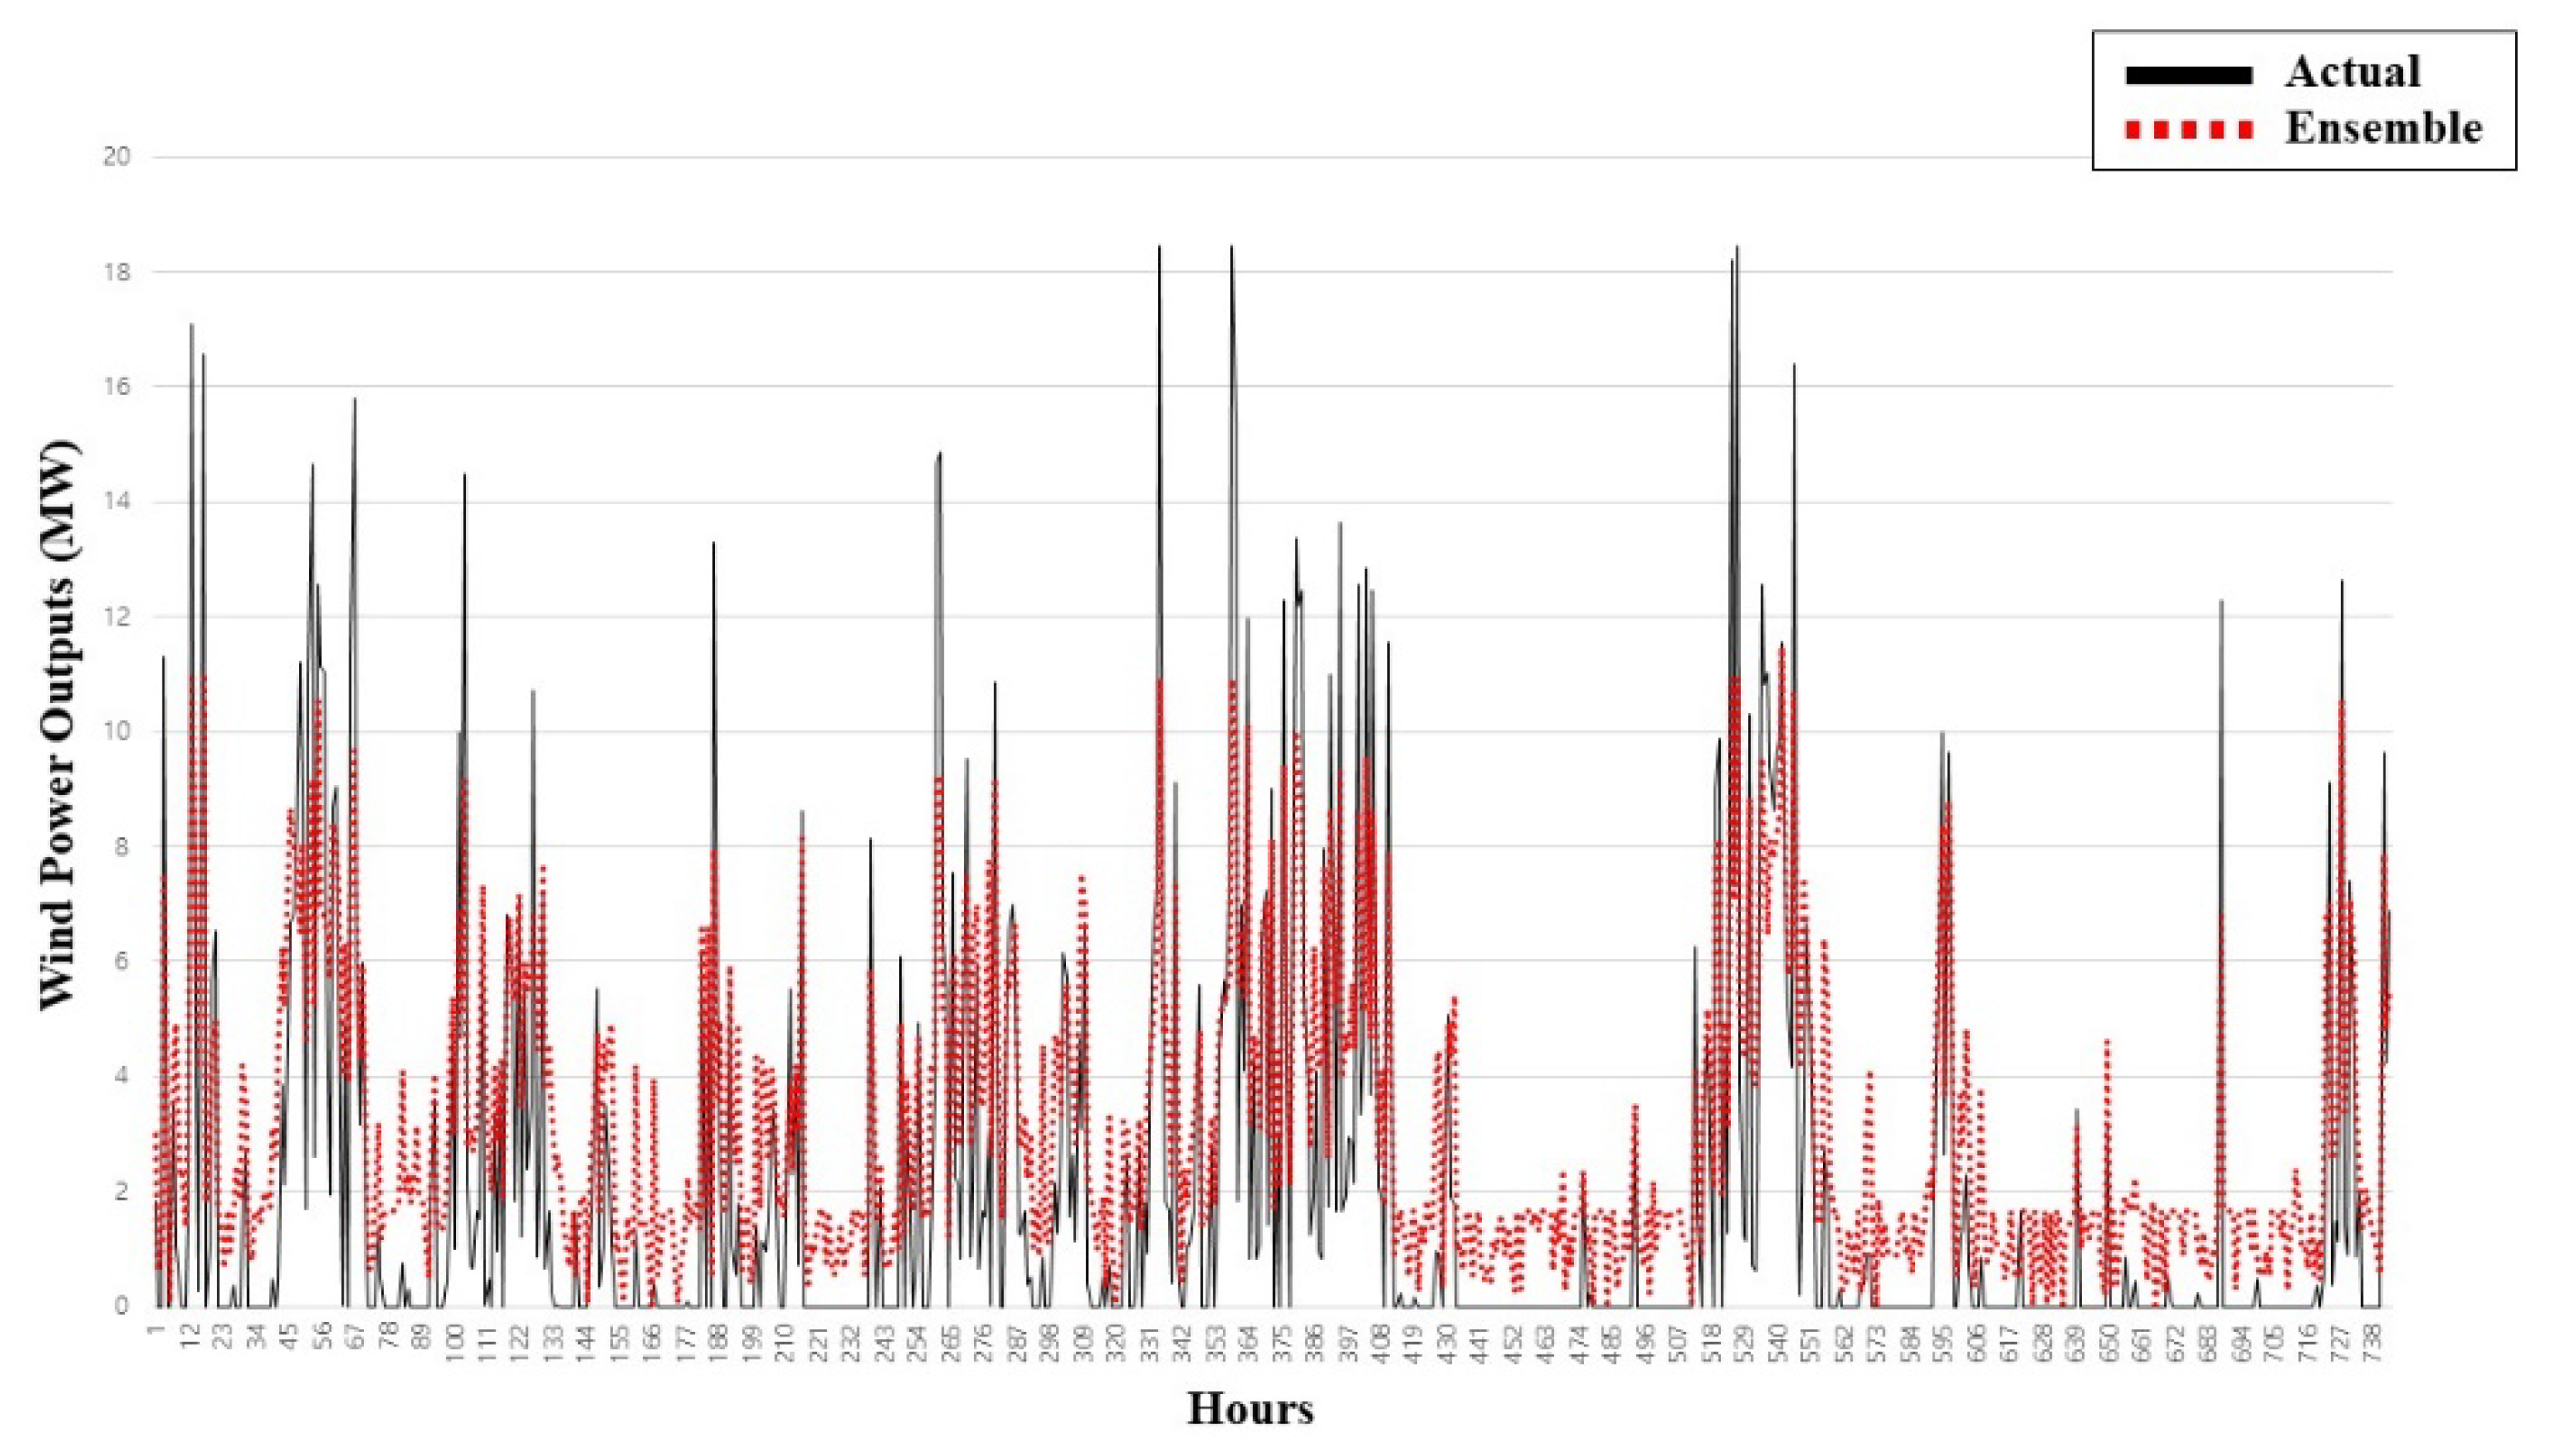
3.3.2. Hybrid Prediction Model: Augmented Naïve Bayes Classifier

As mentioned in the previous section, the deterministic prediction data from the single prediction models were used as input data for the proposed algorithm. Using the calculated data, the analogue ensemble weights for each prediction model were selected, and the optimal number of analogues was selected for each prediction time point. The optimal number of analogues was determined to be the number of analogues with the smallest distance metric value. Figure 5 shows the ensemble mean prediction results of the augmented naïve Bayes classifier model after applying the analogue ensemble.
The NMAE of the hybrid prediction model was 7.64%. It was thus confirmed that the proposed analogue-ensemble-based augmented naïve Bayes classifier prediction model improved the error by approximately 3.3–4.8% when compared with the single prediction models.

4. Conclusions

Variable renewable energy resources, including wind power and solar power, are penetrating the power system on a large scale. Nevertheless, the variability and uncertainty of renewable energy are expected to cause problems, such as overloading lines and exceeding the voltage maintenance standard range during power system operation and planning. It is therefore essential to secure system reliability and flexibility for the stable operation of the power grid. That is, a power system operation plan that reflects the characteristics of renewable energy must be established. In other words, the prediction of renewable energy power is important in the field of power system. Many prediction models of renewable energy have already been developed, and now many studies are being conducted to improve the prediction accuracy. In this study, we proposed an analogue ensemble prediction algorithm using past wind power outputs and meteorological data for short-term wind power prediction. To improve the limitations of a single prediction model and increase prediction accuracy, the characteristics of each model are analyzed and the weight of the prediction results for each model is calculated to derive the renewable energy power prediction results. The proposed prediction model is composed of an MLR model and a naïve Bayes classification model. The MLR and naïve Bayes classifier prediction model can be biased or distorted depending on the characteristics of each model, which is a limitation of a single prediction model. On the other hand, the proposed augmented naïve Bayes classifier prediction model can improve prediction accuracy because it reflects the characteristics of both single prediction models. To validate the proposed prediction model, we applied an analogue ensemble to the deterministic wind power predictions from the single prediction models and then performed wind power prediction for wind farm A of Jeju Island. For comparison, the error was quantified in terms of the NMAE, adjusted R 2 , and RMSE. The proposed augmented naïve Bayes classifier achieved the lowest NMAE value at 7.64%. Our results thus indicate that the proposed algorithm can reduce the prediction bias relative to a single model and increase the prediction accuracy. In the future, the proposed algorithm could be applied to the real-time power system operation modeling and probabilistic renewable energy output modeling to expand transmission networks and substation facilities. However, despite its improved prediction accuracy, the proposed model has limitations. First, its prediction accuracy is affected by the numerical weather predictions used for wind power prediction. Wind power prediction using this algorithm is thus difficult when the numerical weather prediction data include outliers or missing data. Moreover, if there were no weather stations located near the wind farm of interest, it would be difficult to use meteorological data. To overcome this limitation, in future work we plan to predict the meteorological variables for the target points through spatial ensembles (kriging). Because wind and meteorological variables share similarities within a certain area in a given time period, there is spatial correlation between different locations. Thus, if we predict the meteorological variables for the location at which wind power is to be predicted by using spatially correlated measured data from a nearby location, the prediction accuracy of the proposed algorithm can be improved.

Author Contributions

Data curation, G.K.; formal analysis, G.K.; methodology, G.K.; project administration, J.H.; validation, J.H.; writing—original draft, G.K.; writing—review and editing, J.H. All authors have read and agreed to the published version of the manuscript.

Funding

This research received no external funding.

Institutional Review Board Statement

Not applicable.

Informed Consent Statement

Not applicable.

Data Availability Statement

Not applicable.

Acknowledgments

This work was supported by the Korea Electric Power Corporation (No. R21XO01-1) and Korea Institute of Energy Technology Evaluation and Planning (KETEP) grant funded by the Korean government (MOTIE) (2019371010006B), development of core stabilizing technology for renewable power management system).

Conflicts of Interest

The authors declare no conflict of interest.

References

  1. Sideratos, G.; Hatziargyriou, N.D. An advanced statistical method for wind power forecasting. IEEE Trans. Power Syst. 2007, 22, 258–265. [Google Scholar] [CrossRef]
  2. Foley, A.M.; Leahy, P.G.; Marvuglia, A.; McKeogh, E.J. Current methods and advances in forecasting of wind power generation. Renew. Energ. 2012, 37, 1–8. [Google Scholar] [CrossRef] [Green Version]
  3. Li, L.L.; Zhao, X.; Tseng, M.L.; Tan, R.R. Short-term wind power forecasting based on support vector machine with improved dragonfly algorithm. J. Clean. Prod. 2020, 242, 118447. [Google Scholar] [CrossRef]
  4. Han, C.; Vinel, A. Reducing forecasting error by optimally pooling wind energy generation sources through portfolio optimization. Energy 2022, 239, 122099. [Google Scholar] [CrossRef]
  5. Hu, H.; Wang, L.; Tao, R. Wind speed forecasting based on variational mode decomposition and improved echo state network. Renew. Energ. 2020, 164, 729–751. [Google Scholar] [CrossRef]
  6. Tian, Z.; Li, H.; Li, F. A combination forecasting model of wind speed based on decomposition. Energy Rep. 2021, 7, 1217–1233. [Google Scholar] [CrossRef]
  7. Colak, I.; Sagiroglu, S.; Yesilbudak, M. Data mining and wind power prediction: A literature review. Renew. Energ. 2012, 46, 241–247. [Google Scholar] [CrossRef]
  8. Peng, H.; Liu, F.; Yang, X. A hybrid strategy of short term wind power prediction. Renew. Energ. 2013, 50, 590–595. [Google Scholar] [CrossRef]
  9. Li, C.; Lin, S.; Xu, F.; Liu, D.; Liu, J. Short-term wind power prediction based on data mining technology and improved support vector machine method: A case study in Northwest China. J. Clean. Prod. 2018, 205, 909–922. [Google Scholar] [CrossRef]
  10. Naik, J.; Satapathy, P.; Dash, P.K. Short-term wind speed and wind power prediction using hybrid empirical mode decomposition and kernel ridge regression. Appl. Soft Comput. 2018, 70, 1167–1188. [Google Scholar] [CrossRef]
  11. Abba, S.I.; Hadi, S.J.; Abdullahi, J. River water modelling prediction using multi-linear regression, artificial neural network, and adaptive neuro-fuzzy inference system techniques. Procedia Comput. Sci. 2017, 120, 75–82. [Google Scholar] [CrossRef]
  12. Taejin, L. R-Probability Statistics; Saengneung Publisher, 2016; ISBN 9788970508832. Available online: https://booksr.co.kr/html/book/book.asp?seq=696967 (accessed on 20 May 2021).
  13. Webb, G.I.; Keogh, E.; Miikkulainen, R. Naïve Bayes. In Encyclopedia of Machine Learning; Springer: Boston, MA, USA, 2010; Volume 15, pp. 713–714. [Google Scholar]
  14. Matsuura, M. Bayesian Statistical Modeling Using Stand and R; Gilbut, 2019; ISBN 9791160507324. Available online: https://www.enlib.or.kr/service/search_detail.asp?kid=ALL&id=2507803 (accessed on 20 May 2021).
  15. Nam, S.B.; Hur, J. A hybrid spatio-temporal forecasting of solar generating resources for grid integration. Energy 2019, 177, 503–510. [Google Scholar] [CrossRef]
  16. Delle Monache, L.; Nipen, T.; Liu, Y.; Roux, G.; Stull, R. Kalman filter and analog schemes to postprocess numerical weather predictions. Mon. Weather Rev. 2011, 139, 3554–3570. [Google Scholar] [CrossRef] [Green Version]
  17. Sperati, S.; Alessandrini, S.; Delle Monache, L. Gridded probabilistic weather forecasts with an analog ensemble. Q. J. R. Meteorol. Soc. 2017, 143, 2874–2885. [Google Scholar] [CrossRef]
  18. Delle Monache, L.; Eckel, F.A.; Rife, D.L.; Nagarajan, B.; Searight, K. Probabilistic weather prediction with an analog ensemble. Mon. Weather Rev. 2013, 141, 3498–3516. [Google Scholar] [CrossRef] [Green Version]
  19. Zhao, P.; Wang, J.; Xia, J.; Dai, Y.; Sheng, Y.; Yue, J. Performance evaluation and accuracy enhancement of a day-ahead wind power forecasting system in China. Renew. Energ. 2012, 43, 234–241. [Google Scholar] [CrossRef]
  20. Lin, Z.; Liu, X. Wind power forecasting of an offshore wind turbine based on high-frequency SCADA data and deep learning neural network. Energy 2020, 201, 117693. [Google Scholar] [CrossRef]
Figure 1. Augmented naïve Bayes classifier algorithm.
Sustainability 13 12723 g001
Figure 2. Scatter plots illustrating the pairwise correlations between the input data.
Sustainability 13 12723 g002
Figure 3. Scatter plot for each prediction model applied in this study.
Sustainability 13 12723 g003
Figure 4. Actual data and the prediction results of the single prediction models: (a) MLR and (b) naïve Bayes classifier.
Sustainability 13 12723 g004aSustainability 13 12723 g004b
Figure 5. Actual data and the prediction results of the proposed augmented naïve Bayes classifier prediction model.
Sustainability 13 12723 g005
Table 1. Overview of the input data.
ClassificationData
Measured data
-
Wind power output (MW)
-
Weather data (actual): wind speed (m/s), wind direction (°), temperature (°C), atmospheric pressure (atm)
Numerical weather prediction
-
Weather data (predicted): wind speed (m/s), wind direction (°), temperature (°C), atmospheric pressure (atm)
Installed capacity
-
Wind farm installed capacity (MW)
Table 2. Samples of the input data.
DateHourWind Speed
(m/s)
Temperature
(℃)
Wind Direction
(°)
Atmospheric
Pressure (atm)
Wind Power
(MW)
1 January 201702.43.564991.80.51063
1 January 201712.22.380.5991.70.48632
1 January 201721.91.376.1991.70.55926
1 January 201731.8354.6991.60.55926
1 January 201740.83.882991.40.04863
31 May 2018201.615.84.5976.70.72947
31 May 2018211.515.130.3976.92.11547
31 May 2018223.714.635.8977.12.99084
31 May 2018233.21548.8977.73.01516
31 May 2018242.814.743.59781.04558
Table 3. Error evaluation values for the prediction models.
MethodNMAERMSE Adjusted   R 2
MLR0.10923.13340.3619
Naïve Bayes classification0.12414.37980.3256
Augmented naïve Bayes classifiers0.07641.98040.8157
Publisher’s Note: MDPI stays neutral with regard to jurisdictional claims in published maps and institutional affiliations.

