Abstract
Ongoing climate change and associated food security concerns are pressing issues globally, and are of particular concern in the far north where warming is accelerated and markets are remote. The objective of this research was to model current and projected climate conditions pertinent to gardeners and farmers in Alaska. Research commenced with information-sharing between local agriculturalists and climate modelers to determine primary questions, available data, and effective strategies. Four variables were selected: summer season length, growing degree days, temperature of the coldest winter day, and plant hardiness zone. In addition, peonies were selected as a case study. Each variable was modeled using regional projected climate data downscaled using the delta method, followed by extraction of key variables (e.g., mean coldest winter day for a given decade). An online interface was developed to allow diverse users to access, manipulate, view, download, and understand the data. Interpretive text and a summary of the case study explained all of the methods and outcomes. The results showed marked projected increases in summer season length and growing degree days coupled with seasonal shifts and warmer winter temperatures, suggesting that agriculture in Alaska is undergoing and will continue to undergo profound change. This presents opportunities and challenges for farmers and gardeners.
1. Introduction
The relationship between agricultural production and climate change is of particular interest and pertinence in Alaska for several reasons. These include the accelerated pace of climate change in Alaska, the state’s current low agricultural food production and associated vulnerability to supply disruptions, remoteness, the lack of diversity in Alaska’s highly oil-dependent economy, and the potential for agricultural expansion.
Alaska’s high-latitude setting places it at the front lines of environmental change [1,2]. Due in large part to polar amplification [3], the climate is warming in the far north at as much as three times the rate of other regions of the world [4].
Food security is an issue of particular concern in Alaska, in part because the state is remote from the contiguous United States and other agricultural regions; of all the agriculturally-produced food consumed in the state, only five percent is locally grown [5]. Alaska also has many communities which are inaccessible by road, and are thus vulnerable to interruptions in food supply [6]. Alaska has ample arable land and fresh water, and yet lags far behind northern European nations in terms of agricultural self-sufficiency, which places it at a high risk for catastrophic disruptions to supply chains [7].
Rising temperatures, altered precipitation regimes and associated shifts in growing degree days, summer season length, and the timing of spring thaw and autumn frost are among the factors that are rapidly altering natural ecosystems and agricultural opportunities [2,8]. The ability of Alaskans to predict these changes will profoundly affect their ability to adapt. The State of Alaska recognizes the scope and magnitude of these changes and has made it a priority to ensure Alaskan communities and managers incorporate anticipated change into local and regional planning. This is also a goal of the University of Alaska (UA), which seeks to apply and advance its expertise in climate science and landscape ecology to better understand the manner by which these changes affect ecosystems, food webs and human populations.
Thus far, adaptation to climate change in the agricultural sector has been slow, and studies suggest that such adaptation does not occur until farmers perceive the importance and immediacy of climate change [9]. Farmers’ perceptions of climate change have been identified as an important factor for adaptation to take place [10,11,12] as it triggers the necessary changes that are needed for action, in addition to other factors [13].
Currently, agriculture in Alaska is climate-limited. Sparrow et al. [14] note that primary limitations include low heat energy, short growing seasons, and cold winters that prevent survival of perennial crops. Considerable research (e.g., [15,16,17]) has assessed how to overcome some of these limitations, particularly in the context of food security.
The scientific consensus suggests that climate change is already altering the equation, and will continue to do so [18]. Hatch [19] found that climate projections show that future growing conditions in the Fairbanks North Star Borough may be more similar to northern prairies in the lower 48 states. Sparrow [16] found that increases in growing degree days (GDD) could cause crop production to advance northward throughout the century, with increases in yields and new varieties becoming viable. Meanwhile, for some crops, climate change may not be positive. For example, burgeoning peony markets are dependent on Alaska’s relatively cool climate and late summer season.
Lader et al. [20] investigated some of the potential impacts of climate warming on northern agriculture. Their research used climate projections based on regional dynamical downscaling using the Weather Research and Forecasting (WRF) Model. They used these model outputs to assess changes in growing season length (GSL), spring planting dates, and potential occurrences of plant heat stress for five regions in Alaska. Expanding the use of these data by adding additional variables and the full spatial extent of the state, this project’s goal was to provide real-world tools that stakeholders around Alaska can use to plan for and adapt to agricultural change.
Currently available tools are limited in their ability to help Alaska’s farmers adjust to climate change. USDA hardiness zones are relatively fine-scale within Alaska, but are based only on extreme winter temperature; thus, they serve as a reliable metric only for plants affected and limited by winter extremes. Indicator plants, as defined by the USDA, help to capture some of the nuances of range limits. However, with ongoing climate change, both winter extremes and indicator species may shift and change. Moreover, for many species, particularly annual crops, other climate indicators are likely to provide more pertinent hardiness information. Communication with stakeholders can aid researchers in creating climate change assessments that address real-world concerns. Moreover, a meaningful assessment must take into account both positive and negative potential changes, including new opportunities and new stressors.
Peony farming serves as an excellent case study for research on climate change and agriculture in Alaska, because peonies represent a burgeoning niche market, and are a crop that is uniquely lucrative in Alaska for reasons linked directly to the climate. Peonies bloom in Alaska in July, August, and September and are available commercially nowhere else in the world during this time. Commercial peony farming has seen considerable growth in recent years. There are over 100,000 peony roots in the ground on peony farms in Alaska and farmers are continuing to add roots at over 30,000 roots per year, with gross sales of well over a million dollars. Peony growers engaged in the project expressed concern about seeing shifts toward earlier blooming times, which puts Alaska’s peonies in more direct competition with other markets.
The shifts in the Arctic climate will likely produce a range of impacts on different crop species, but through the development of decision support tools, those affected have a greater ability to prepare for changes proactively. This project drew upon local knowledge and the best available climate modeling techniques to build user-friendly tools that deliver practical information to farmers, ranchers, forest landowners, and Alaska Native communities to help them to adapt to climate change. The project demonstrated that over the coming years and decades profound shifts are likely in growing season length, growing degree days, and winter temperatures, and it linked these changes with potential shifts in key crops.
2. Materials and Methods
The project included four major stages:
- collaborative research and information-sharing in order to determine primary questions, available data, and effective strategies;
- development of datasets, models, and tools, to address these primary questions;
- interpretation and refinement of models and tools in order to maximize their utility and effectiveness; and
- final interpretation and dissemination of results and outcomes to project partners and to the public.
In the first stage, we fully reviewed the existing literature and the potential applications for existing downscaled climate projections. We then met (in person, via video conference, and by email) with collaborative partners from around Alaska, representing family-owned community-sustained farms (Calypso Farm and Ecology Center and Spinach Creek Farm), small-scale commercial peony growers (Arctic Alaska Peonies and The Alaska Peony Growers’ Association), a knowledge-sharing program between UAF and rural Alaska communities (Community Partnerships for Self-Reliance) and a Tribal conservation organization dedicated to the wise use of natural resources (Tyonek Tribal Conservation District). These partners had all indicated interest in the project prior to it being successfully funded, and had provided letters of support. Some, including the peony growers, had previously approached us with their questions, while others were networking contacts with known interest in climate change research, sustainability, and community self-reliance.
Given the collaborative, rather than top-down, nature of the research, discussions were open-ended. We discussed the development of user-friendly tools that could be developed for the project. However, we did also seek each collaborators’ specific thoughts regarding the greatest climate-related factors related to successful farming, with the expectation that these answers would vary by region and expertise but would reveal key patterns.
From these interactions we determined the following priorities. Those marked by a star (1, 2, and 7) were selected for modeling, based on the availability of appropriate climate data. Those not examined in this study may be pursued in future research.
- Growing degree days (GDD) are an important variable for determining crop viability. It is optimal to map GDD spatially, given that elevation, slope, and aspect are all key. Peonies and brassica (broccoli/cabbage family) are more successful with cooler temperatures (lower GDD), while other flowers and vegetables (e.g., squash) are more successful with higher GDD. *
- Total season length and/or the date of the first and last frost are crucial. This affects not only crops that need a long growing season (e.g., squash) but also crops that farmers like to stagger with multiple plantings, and plants for which the timing of harvest is key in order to compete in markets. *
- Soil temperature, particularly in spring, is very important.
- Cold spring temperatures in general are difficult for farmers.
- Drought or constant rain are problematic.
- For perennials, the timing of when snow arrives is an important factor.
- The coldest monthly mean temperature (often January) and coldest winter temperature are of interest for perennials. *
The selected questions led directly to the data analysis, modeling, and tool creation described below.
Climate station data is limited in Alaska, necessitating the use of downscaled gridded reanalysis data for both historical and future projections. The climate projections used in this project were derived from regional dynamically downscaled data produced with the Advanced Research core of the Weather Research and Forecasting Model (WRF) [21]. The model simulations were driven by multiple climate datasets for past time periods, including ERA-Interim data [22], the Geophysical Fluid Dynamics Laboratory Climate Model (GFDL), version 3 [23], and the National Center for Atmospheric Research (NCAR) Community Climate System Model, version 4. Two different sets of modeled data were used in this project, referred to as GFDL and NCAR, based on these two different Global Circulation Models, in order to represent the range and uncertainty associated with use of climate projections. While both models have been shown to be highly valid in northern latitudes [1], GFDL data tend to project greater changes in temperature, while NCAR outputs are more conservative. The full dynamical downscaling methodology and WRF configuration are described in Bieniek et al. [24] and Lader et al. [20]. Data were downscaled to 20 km spatial resolution; thus, all community-specific data described in this analysis can be understood to represent the 20 km grid cell that best represents the community locations. The projected data used the 8.5 RCP (Representative Concentration Pathway) of phase 5 of the Coupled Model Intercomparison Project (CMIP5) [25], as defined by the IPCC. The limitations imposed by spatial resolution and choice of RCP are described in the Discussion section.
Temperature and precipitation data were produced at hourly time resolution. This allowed for fine-scale identification of some of the key variables that were identified by stakeholders. Because we were aiming to highlight climate trends over long periods of time (decades or longer) rather than to accentuate model variability at the annual or sub-annual level, we used decadal means and multi-decadal means in our data visualization tools.
Separate tool interfaces within a dashboard-based website were developed for each selected variable, including one for GDD, one for season length, and two separate tools for visualizing cold conditions. All four resulting tools are available online–in separate tabs—at https://www.snap.uaf.edu/tools/gardenhelper/ (accessed on 15 September 2021) (see Supplementary Materials) with an accompanying explanatory text aimed at a wide range of stakeholders from the general public.
The first tool in the online interface was designed to provide gardeners with past, current, and projected future data estimating growing season length, as defined by the longest time period during which the temperature never drops below a selected threshold Fahrenheit degrees were used throughout the tool, based on user familiarity. This familiarity is also reflected by the fact that Fahrenheit degrees are more commonly referenced in the corresponding agricultural literature. Thus, in the tool these thresholds are defined as “hard frost, 28 °F” (−2.2 °C); “light frost, 32 °F” (0 °C); “Cold crops, 40 °F” (4.4 °C); or “Warm crops, 50 °F” (10 °C). In order to make the tool locally pertinent and accessible, we created drop-down menus to offer users a choice of hundreds of Alaska communities, each linked to the appropriate latitudinal and longitudinal location in the database; a radio-button choice of the NCAR or GFDL model, and a drop-down menu choice of temperature thresholds. The accompanying text explains these choices and interprets the outputs. Based on the literature, gardeners are offered a table with appropriate threshold values and the approximate number of days necessary to produce 24 different annual crops, including a range of popular vegetables and grains. The interpretation includes an explanation for why the data appear variable, even when averaged by decade, as well as an explanation for the use of two different GCMs.
The second component of the tool focuses on daily minimum temperatures—estimates of record-breaking cold. We created an interface such that for user-selected locations and a user-selected model, as described above, a graph is generated showing the modeled data based on the coldest temperature ever recorded or projected for a chosen location, date (e.g., 12 February or 18 July) and time period. For the purposes of this interface, we aggregated the data into color-coded thirty-year ranges to represent climatologies: 1980–2009, 2010–2039, 2040–2069, and 2070–2099. This allows users to see the clear distinctions between past, current, near-future, and far-future projections. The accompanying text explains how to use and interpret the interface.
The third tool interface calculates GDD, a metric commonly used to estimate how much heat is available and useable to crops. There are several methods for calculating GDD. Based on the available modeled data, and in order to create a user-friendly online tool with the greatest possible flexibility and clarity, we used a method in which we took the average of the daily high and daily low temperatures, and subtracted the user-selected baseline value from that average. In other words, if a user selected a baseline of 50 °F (10 °C), and if the daily high for a particular day was 70 °F (21 °C) and the low was 60 °F (16 °C), the GDD value for that day would be ((70 °F + 60 °F)/2) − 50 °F = 15 °F or in SI units ((21 °C + 16 °C)/2) − 10 °C = 8.5 °C. As in the season length tool, we offer four possible baselines: 28 °F (−2.2 °C), 32 °F (0 °C), 40 °F (4.4 °C), and 50 °F (10 °C). Daily values are cumulatively summed across the summer season, creating graphical outputs. In order to smooth the data and create a reasonable number of future projections, data are averaged by decade. Because heat stress is rare in Alaska, we did not include upper GDD thresholds in our calculations. GDD is not a familiar concept or calculation for many stakeholders, and as such we included adequate explanation in the tool interface to allow for appropriate interpretation. This included tables of sample crops identified by their growth thresholds and necessary GDD values (ten species with a threshold of 32 °F, four at 40 °F, and six at 50 °F; no species were identified with a threshold below 32 °F, but 28 °F was included in the dropdown interface to provide continuity with the growing season length tool.)
In the fourth and final tool interface, we created maps using metrics similar to those used by the USDA to define Plant Hardiness Zones. Here, users do not need to select a location, because all maps cover the full statewide spatial domain. However, users are offered the option of downloading high-resolution individual maps for four current and future time periods, or viewing all four simultaneously. For the purposes of this interface, we aggregated the data into the same thirty-year ranges that were used for the minimum temperature tool: 1980–2009, 2010–2039, 2040–2069, and 2070–2099. However, rather than being based on absolute coldest daily temperatures, hardiness maps are based on the average annual minimum winter temperature. In order to aid user interpretation, we matched map colors and labeling schemes to those used in USDA maps.
Finally, in addition to the creation of the above tool components, we assessed the potential changes to peony crops in Alaska, based on our climate projections coupled with data available from the literature and insights on agricultural research on peonies—particularly research conducted in Alaska by Patricia Holloway and others at UAF’s Georgeson Botanical Garden. This included data on dormancy, stem growth, flowering, and seasonal timing.
3. Results
3.1. Length of Growing Season
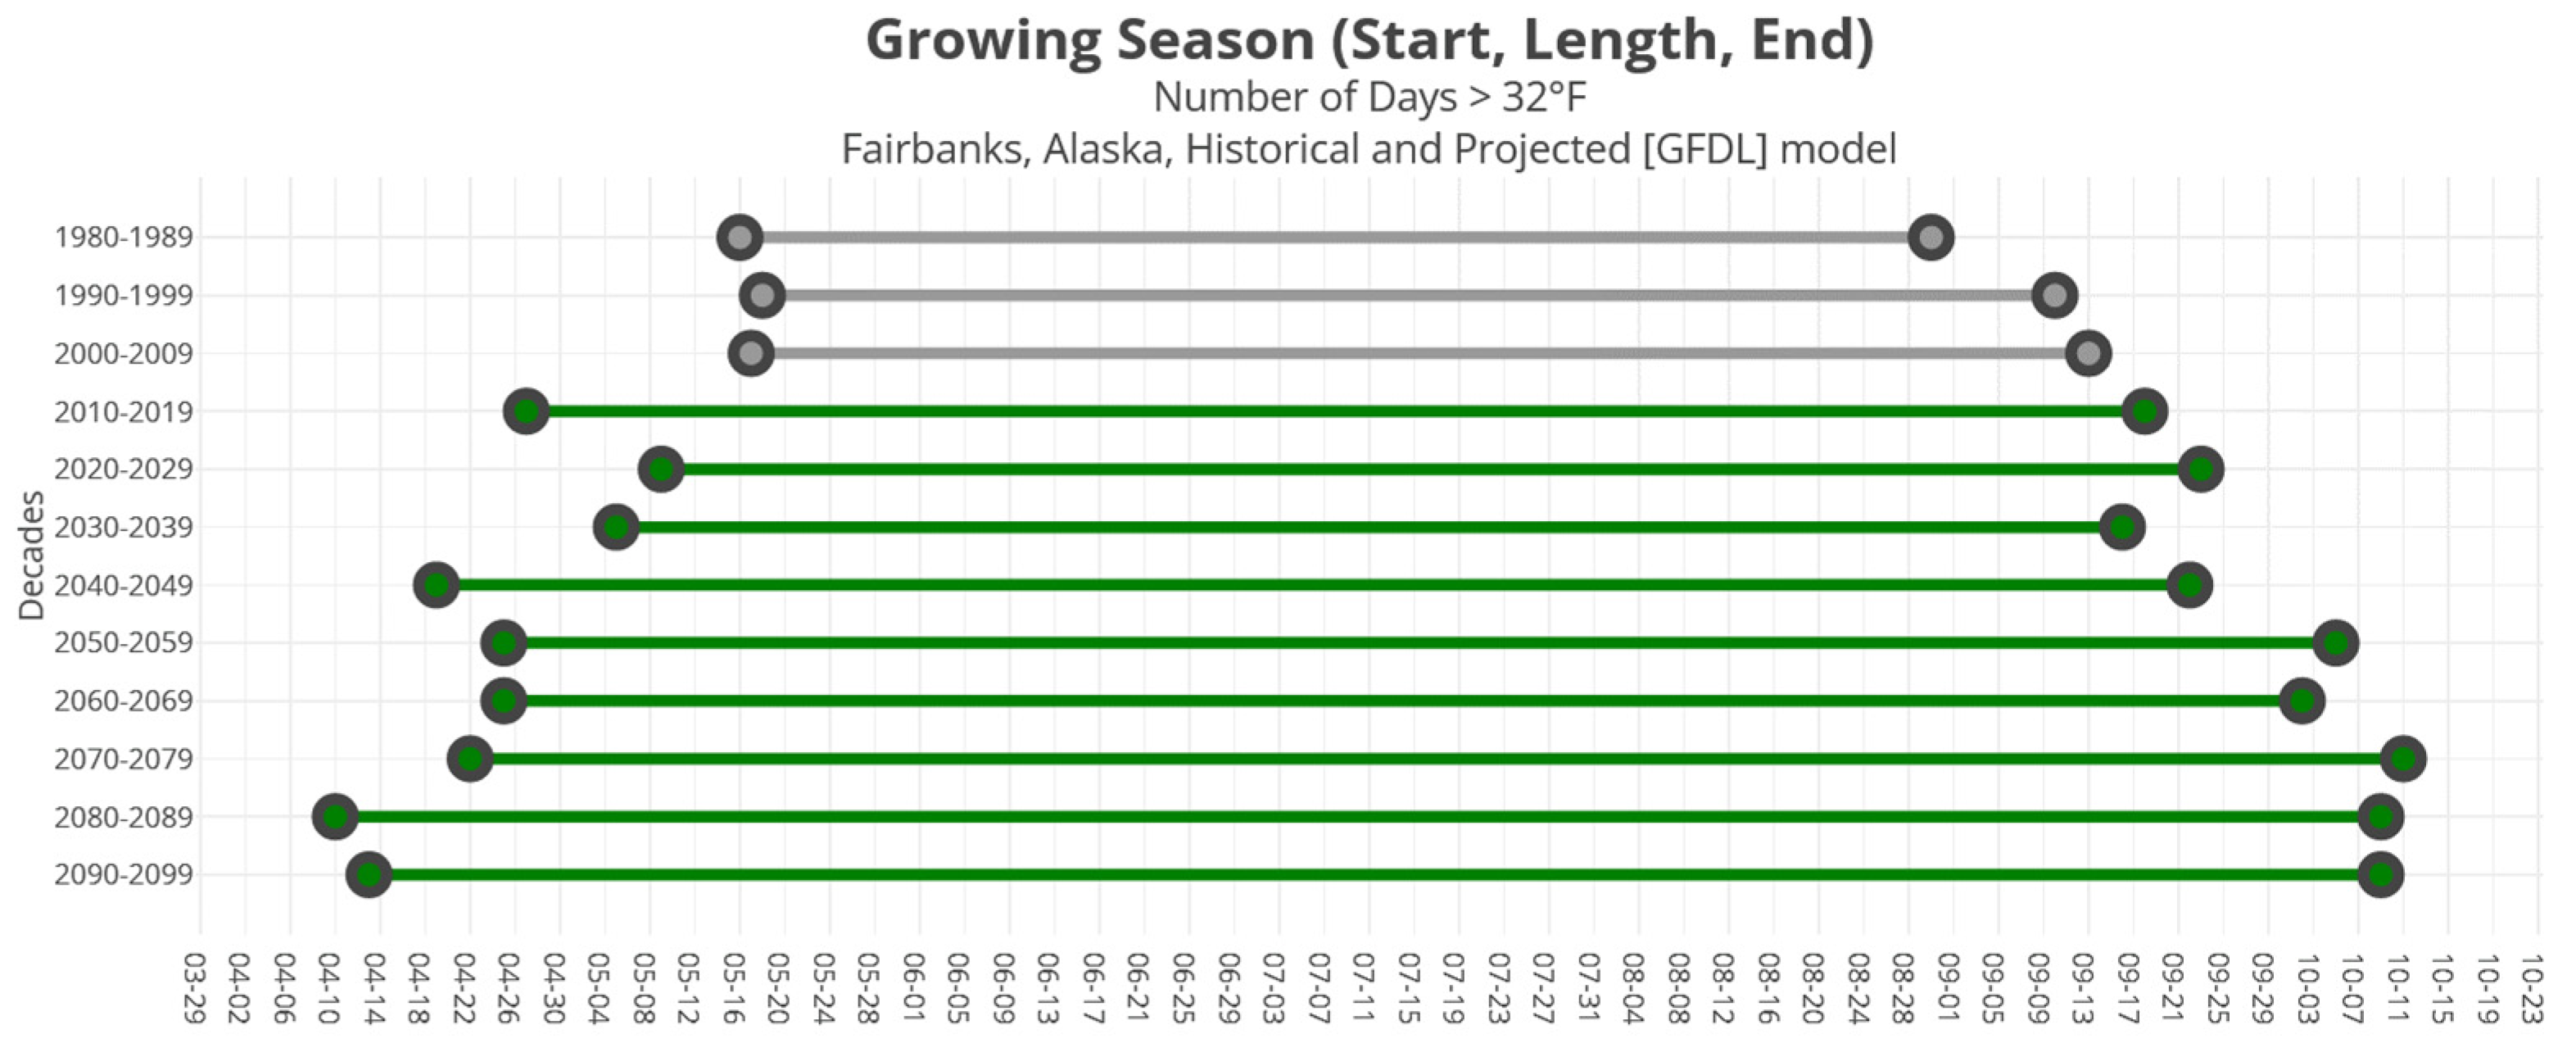
An example of the tool outputs for the length of growing season is shown in Figure 1. Although this figure shows only a single location (Fairbanks, the location of the researchers and several stakeholders engaged in this project), threshold (32 °F) and model (GFDL), it is typical of the full range of results in several ways. First, it clearly demonstrated, even to a casual viewer, that the summer growing season is projected to get longer over time. Second, it shows that this increase is likely to occur at both ends of the season, with earlier springs and later autumns. Finally, the results demonstrate that this shift, while obvious at the scale of a century, is somewhat variable or unpredictable, even with decadal averaging.
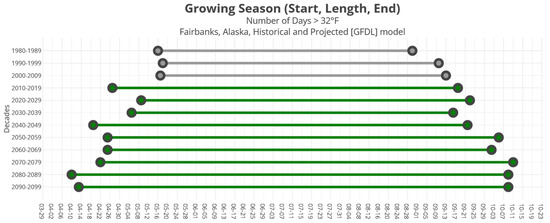
Figure 1.
Sample of Growing Season Length tool output. Location selected was Fairbanks, temperature threshold selected was 32 °F, and model selected was GFDL.
This tool can return data that, although technically realistic (reflecting likely real-world conditions), may be confusing and not useful to end users. If users select a particularly high temperature threshold, and/or live in a very cold region, the results may appear to be short and uneven, as in Figure 2. This is because the tool finds the longest consecutive period during which the daily minimum temperature never drops below the selected temperature. This time period may be extremely short, and is unlikely to be helpful in determining when to plant crops. Users are cautioned to be sure to select thresholds that make sense for their area. In future tool iterations, feedback from users may help create visualizations that avoid this issue altogether.
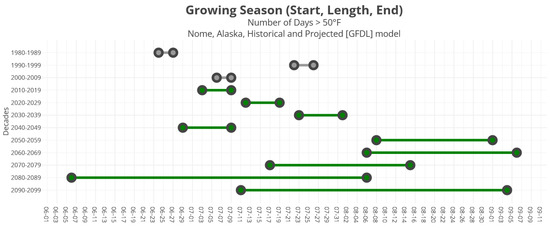
Figure 2.
Sample of Growing Season Length tool output. Location selected was Nome, temperature threshold selected was 50 °F, and model selected was GFDL.
3.2. Annual Minimum Temperature (AMT)
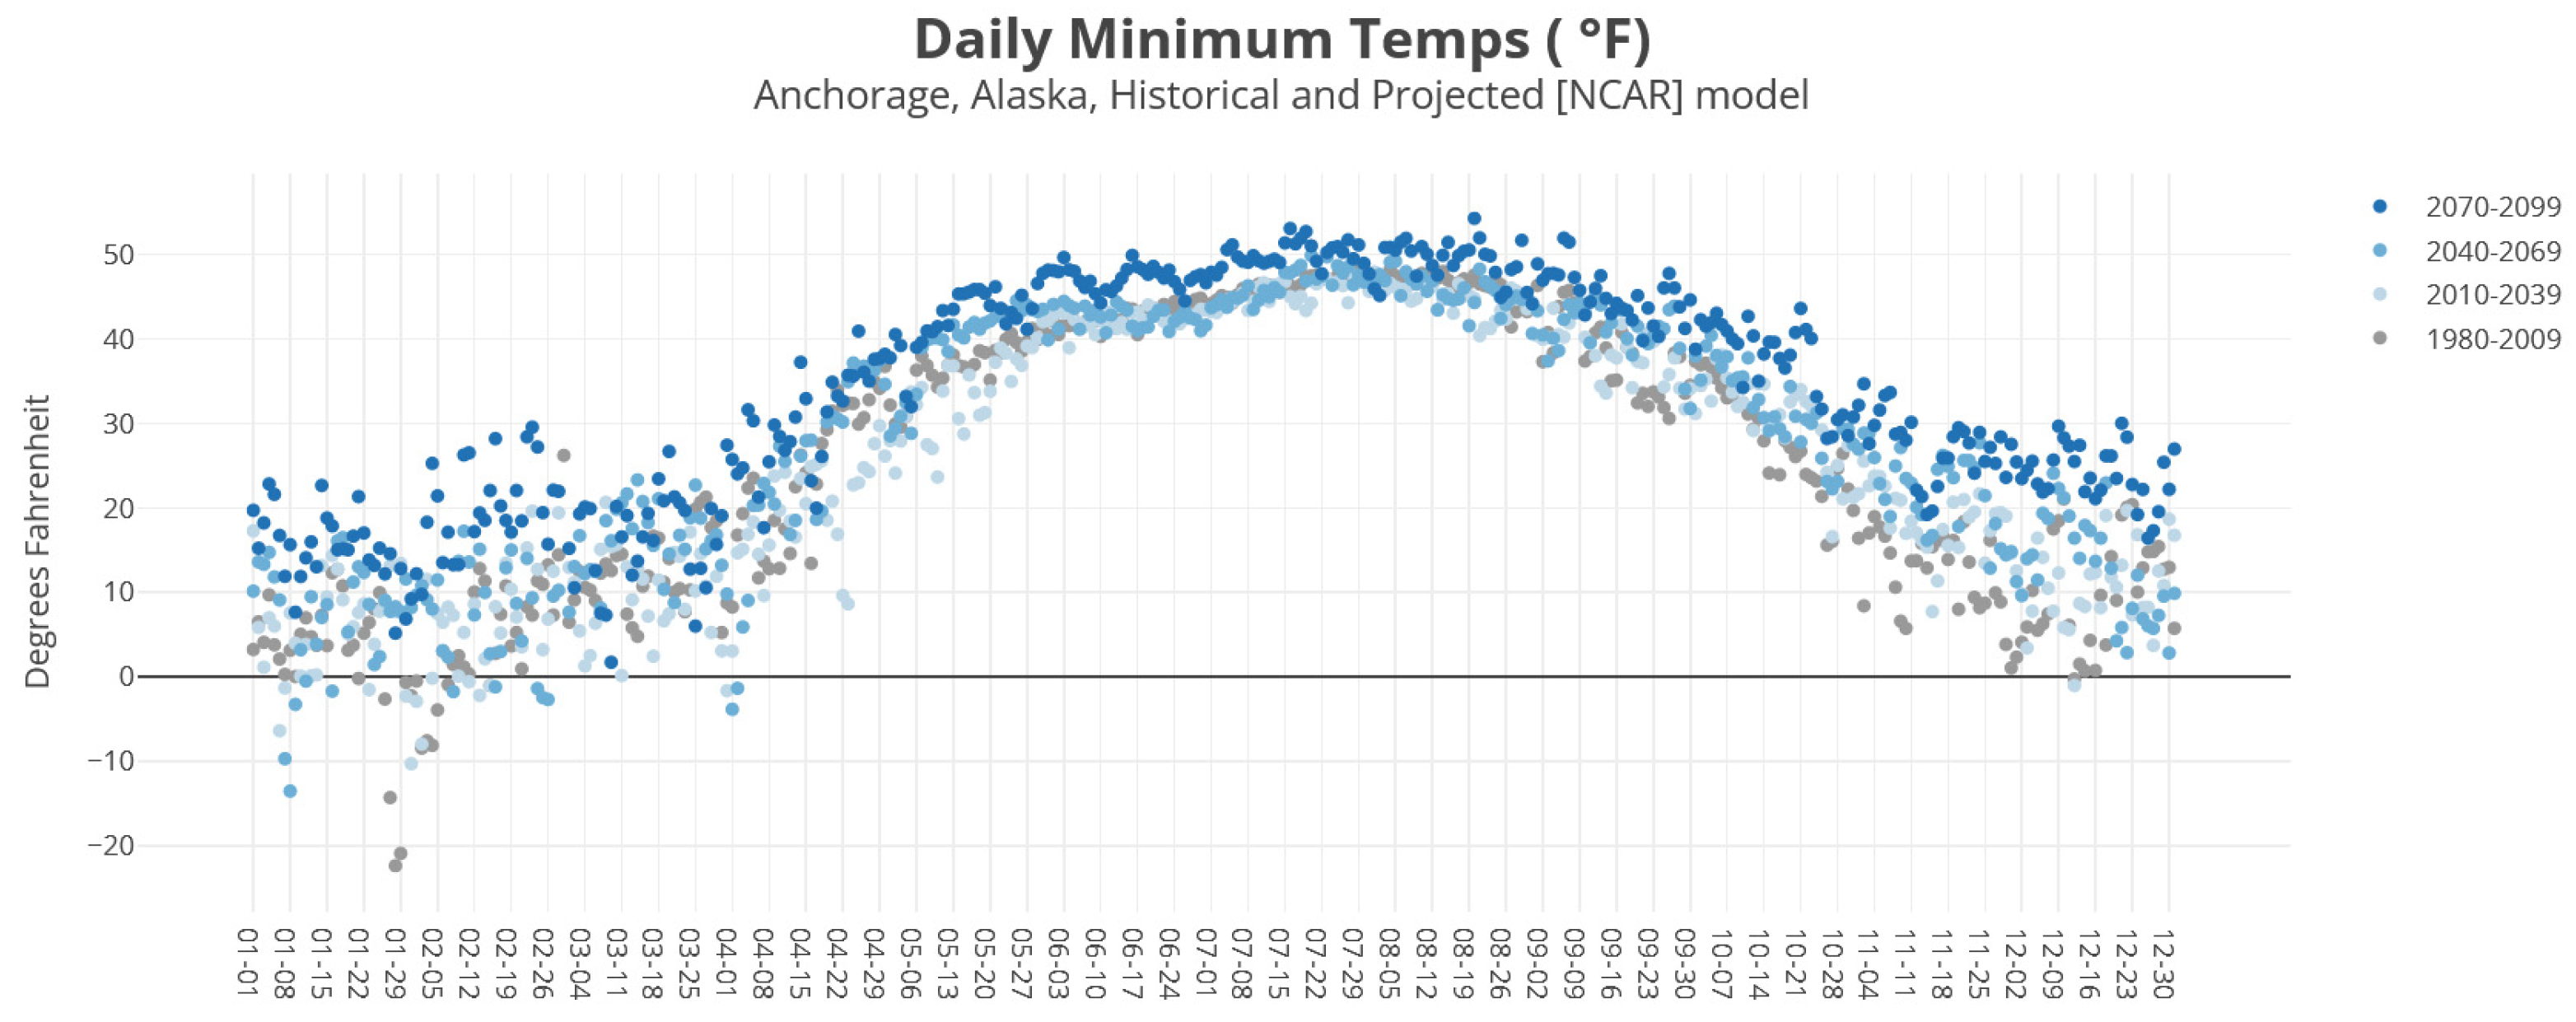
Sample output from the AMT interface is shown in Figure 3. In this case, Anchorage (the largest population center in Alaska) and the NCAR model, which tends to project less extreme climate change than the GFDL model, were selected. However, outputs for other locations and for the GFDL model show similar patterns. While variability is high, as can be seen from the scattering of a few extreme values, and while there is considerable overlap between time periods, even with thirty-year time intervals, the overall pattern of projected warming is clear from time period to time period. Also of note is the fact that although warming is projected across all seasons, winter warming is likely to be much greater than summer warming. In this example, by late this century (2070–2099), very few days are expected to be below 10 °F in Anchorage, which is a stark departure from past extreme lows. In future iterations of this tool, greater contrast in dot colors may improve readability.
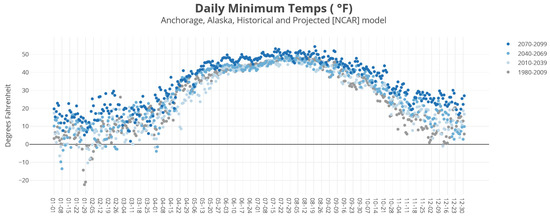
Figure 3.
Sample of Daily Minimum Temperature tool output. Location selected was Anchorage and model selected was NCAR.
3.3. Growing Degree Days (GDD)
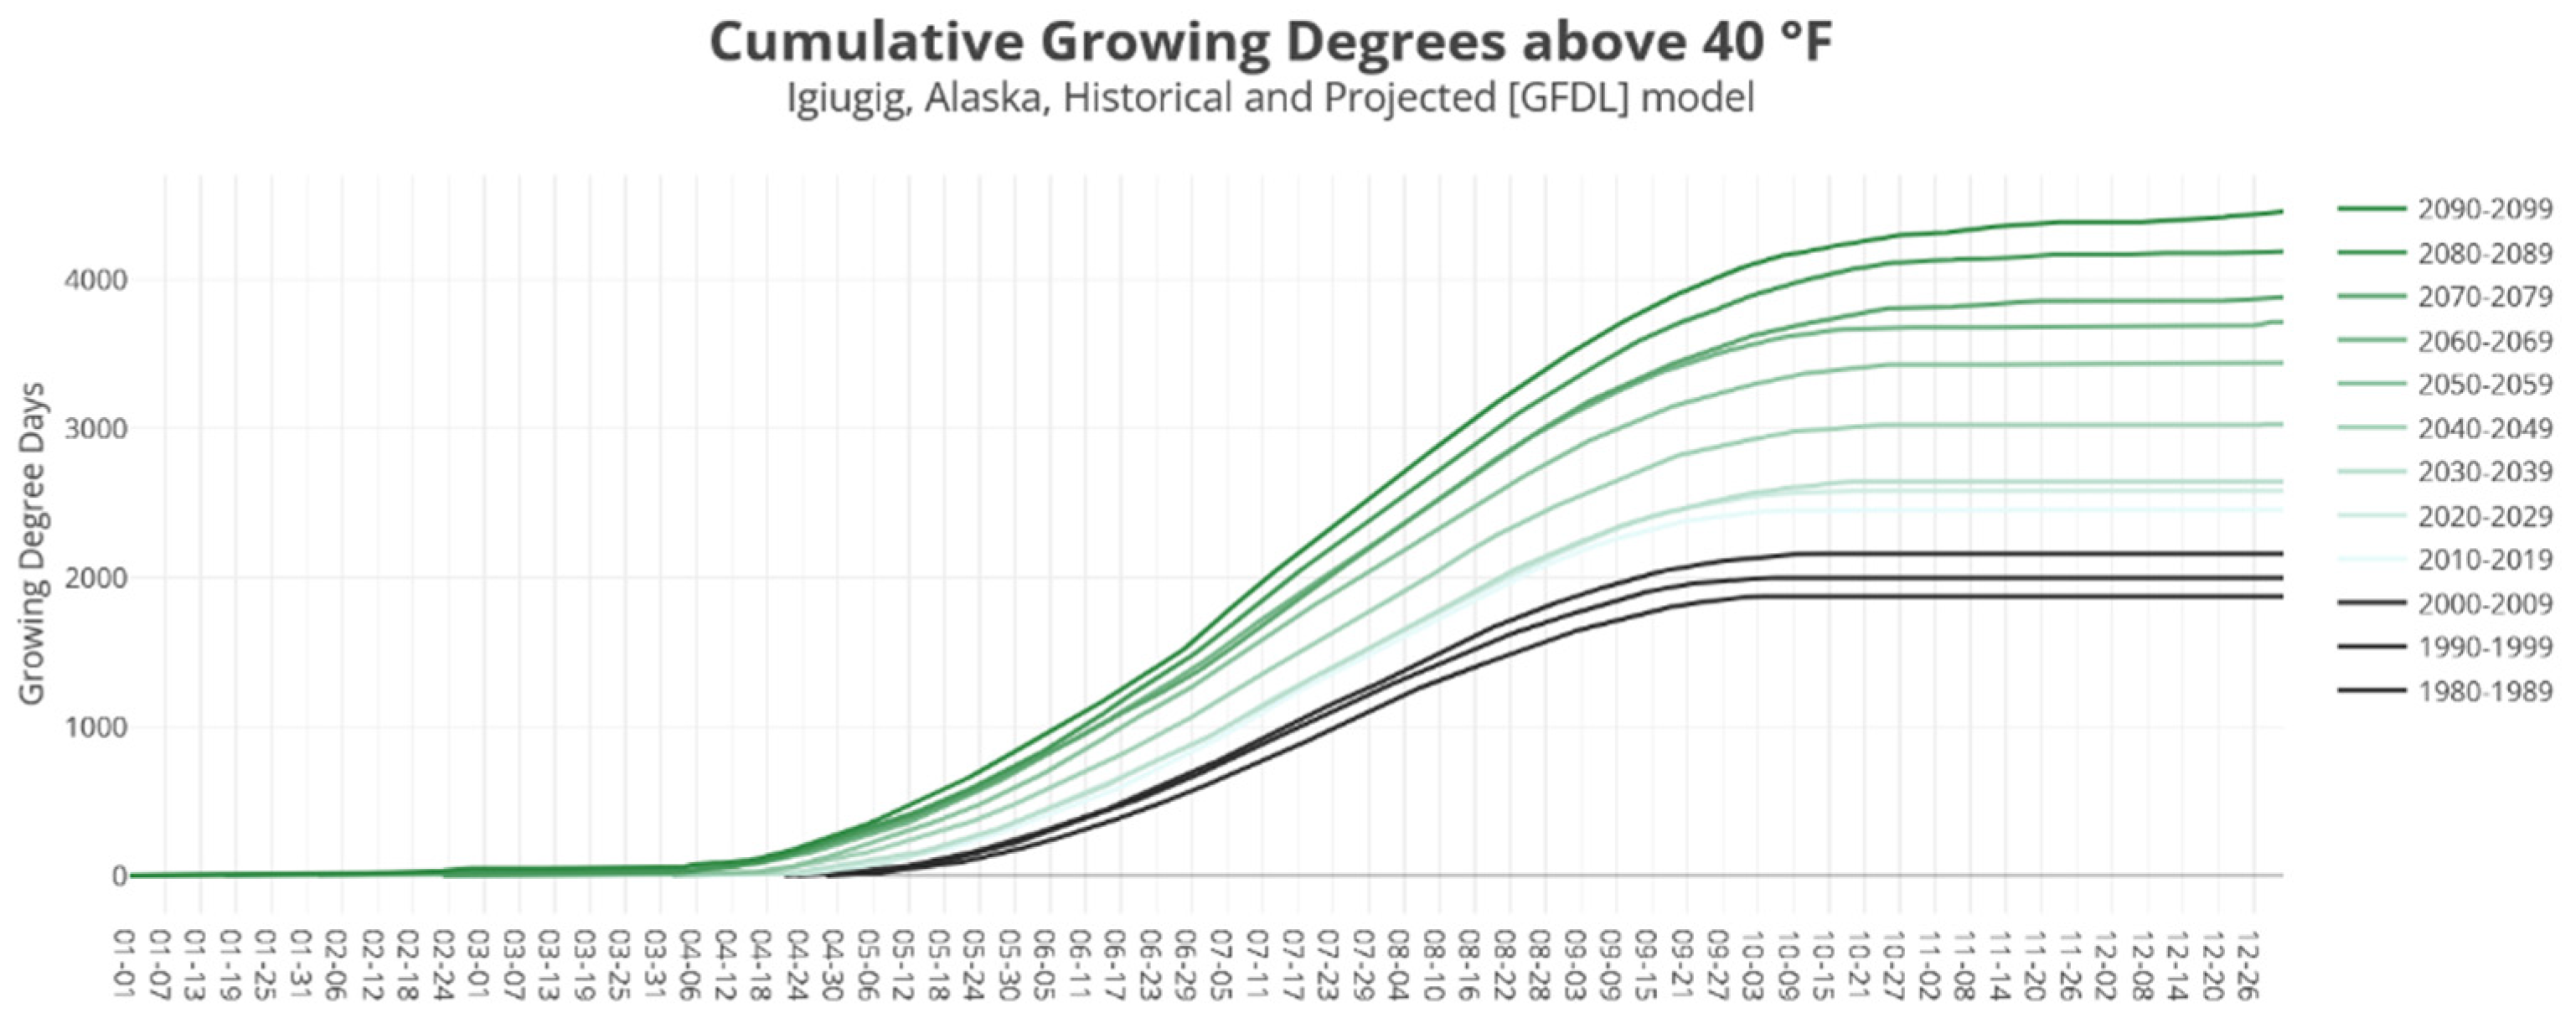
Sample results for the GDD tool are shown in Figure 4. These outputs are for Igiugig, a small remote village with an active community garden. Again, this example shows many features common to outputs from this tool. Heat units are added up day by day to create a cumulative total. Totals increase from 1875 °F (1042 °C) for the earliest baseline decade (1980–1989) to 4454 °F (2474 °C) for the most distant projected decade (2090–2099). The layout of the graph is designed to make the approximate magnitude of this shift clear even to users who are unfamiliar with GDD.
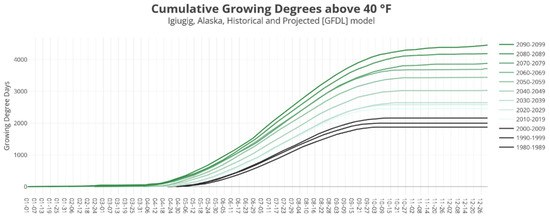
Figure 4.
Sample of Daily Minimum Temperature tool output. Location selected was Igiugig, threshold was 40 °F and model selected was GFDL.
Plants reach particular growth stages when cumulative GDD reaches the necessary values. However, the minimum GDD necessary for growth and development varies by species and, as such, different lower thresholds are used for the calculation of GDD. Many Alaskan wild plants and cultivated crops are cold-hardy, and can take advantage of all above-freezing days, so for these species GDD can be calculated with a baseline of 0 °C (32 °F). Most crops in other regions have higher baseline temperatures, e.g., 5 °C (about 40 °F) for crops considered suitable for cool climates, such as barley and oats, or 10 °C (about 50 °F) for so-called warm-climate crops, such as corn and tomatoes.
Because many tool users may be unfamiliar with GDD and with the thresholds and total GDD needed for crop growth and maturity, we provided an explanatory text, noting that, “plants can grow when the temperature is above some minimum value, which varies by species. Many Alaska plants are cold-hardy and can grow on all above-freezing days. For these, GDD can be calculated with a baseline of 32 °F. Most crops in other regions have higher baseline temperatures, such as 40 °F for barley and oats, or 50 °F for corn and tomatoes. Choose a threshold based on what crop you plan to grow.” We also provided sample tables, based on the literature. These are shown in Table 1, which also shows data on days to maturity. In the online interface, these data are shown in two separate tables associated with the two different tools, in order to avoid confusion.

Table 1.
Common crops and their associated minimum temperature thresholds, days to maturity, and GDD.
3.4. Hardiness Zones
The USDA uses Plant Hardiness Zones as the standard by which growers can determine which plants are likely to thrive at a given location. Many seed manufacturers reference these zones. Hardiness maps are based on the average annual minimum winter temperature. These zones are only a rough guide. Because they are based on winter temperatures, they are of greatest importance for perennials, such as fruit trees or peonies. The four maps shown in Figure 5 use nomenclature and color ramps similar to those used in USDA maps in order to render them more familiar to gardeners and farmers who are accustomed to the USDA zone delineations. These maps represent current estimates of hardiness zones in Alaska, plus projections of how these zones may look in three future time periods, as described in the Methods section.
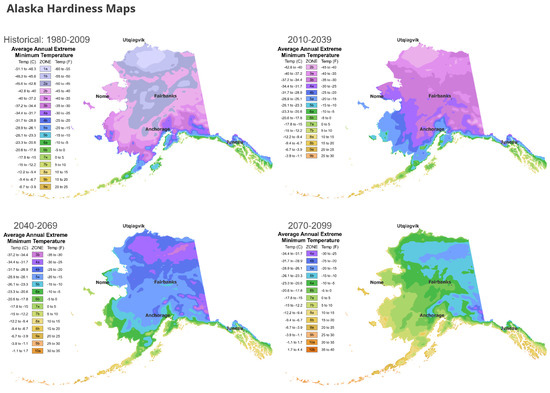
Figure 5.
Alaska Hardiness Maps.
3.5. Peony Case Study
This case study was shared directly with project partners and was summarized for the public and made available here online [26]. The summary highlights some clear continuing advantages for Alaska peony growers, including the fact that although Alaska winters are likely to remain cool enough for peony dormancy, the same may not be true for growers elsewhere. However, it also highlights challenges, particularly for growers in the parts of the state with the warmest summers, as increased spring heat spurs earlier blooming and diminishes the late-summer niche enjoyed by Alaska growers.
Previous studies show that relatively cool winter temperatures are necessary for peony roots to achieve dormancy. However, provided that temperatures are consistently below 6 °C (43 °F) for seventy days, dormancy will be achieved [27]—a condition easily met in most of Alaska. Plants break dormancy as soon as temperatures rise above freezing [28,29,30]. Byrne and Halevy [27] report that flowering can occur in only about 50 days in greenhouse conditions, but suggests that slower growth in cooler temperatures results in less atrophy of buds. Indeed, Kamenetsky et al. [31] found that moderate temperatures with highs of 72 °F and lows of 50 °F were best for enhancing stem length and flowering. When daily highs and lows were 82 °F and 72 °F, flowering was drastically reduced. Hall [27] similarly found that temperatures over 77 °F resulted in reduced blooms. Holloway et al. [28,29,30] found that flowers bloomed in all cases when cumulative GDD above a 32 °F threshold reached between 1734 and 2313. In contrast, the number of days from bud emergence to first cutting ranged from 32 in Fairbanks to 79 in much cooler Kenai.
A further case study linking tool outputs to existing or planned community gardens would offer an excellent area for future investigation.
4. Discussion
These tools have already been discussed, shared, and used as teaching and presentation materials within the Alaska agricultural community, particularly by project partners and participants associated with Cooperative Extension Services and/or the peony growing industry. The results of the peony case study were presented at the annual meeting of the Alaska Peony Growers’ Association in 2020. Outcomes were included in a presentation in June 2021 by Dr. Glenna Gannon and Shannon Powers which focused on Variety Trials in the Matanuska Susitna region. In addition, the Fairbanks Daily Newsminer ran a feature on the tool [32].
Given the goals of this project in relation to stakeholder needs, small-scale gardens and farms, and food security, all of the results must be interpreted within the simultaneous contexts of users’ ability to successfully access the information, correctly understand and interpret the information, and apply the information.
One overarching aspect of model transparency is the clear explanation of data uncertainties. With this in mind, uncertainties are clearly explained in plain language in conjunction with all outputs, including online tools and fact sheets in order to avoid misinterpretation and misapplication. Across all outputs, some uncertainties can be attributed to underlying differences in the complex atmospheric modeling used in the GCMs. By offering two models, we gave users a chance to explore a model that tends to produce more extreme results, and a model that tends to produce conservative results. Additional uncertainty stems from spatial limitations. As noted, all model outputs are at 20 km resolution. Especially in areas of complex topography, growing conditions can vary enormously across areas of this size. As such, users are reminded to consider their local microclimate. Uncertainties inherent to short-term variability in weather are inherent to agriculture. While averaging across decadal or multi-decadal time periods helps smooth data for the purposes of highlighting long-term trends, users are cautioned that short-term variability will nonetheless play a large role in year-to-year gardening and farming outcomes.
All of the tools developed during this research were intended to improve the current state of information readily and easily available to Alaska gardeners. For example, with regard to the season length tool, many seeds offer estimates of how many days the crop may take to mature. Typically, planting guides refer to “last frost” in spring and “first frost” in fall, implying daily minimum temperatures of 0 °C (32 °F). By offering additional thresholds, our tool allows for more flexibility in considering cold-hardy crops that may be harvested only when a hard frost is reached (28 °F), or more delicate crops that cannot effectively grow when temperatures are below a higher threshold. Such plants might be kept as starts in a greenhouse until a later planting date, and harvested earlier. Moreover, the results show that season length is increasing statewide. In many regions, longer frost-free seasons may make it possible to plant crops that were not previously suitable for the region.
Very little information on GDD is currently available to gardeners who do not read the scientific literature. Understanding GDD and knowing the approximate number of growing degree days that can be expected in an area, for a given baseline temperature, can help gardeners plan what to plant, and what not to plant, especially when the length of the frost-free season does not provide enough information. For example, with a baseline temperature of 50 °F and over 2000 GDD necessary for maturation, corn is not likely to be successful in most parts of Alaska, even though many varieties can mature in only 60–80 days, given enough heat. However, the results indicate that GDD is shifting rapidly and dramatically statewide, with values projected to double or even triple by the end of the century. This may prove a productive avenue for additional study and seed trials.
Both the Annual Minimum Temperature tool and the Hardiness Zone Maps offer important information for those who are interested in perennials, such as fruit trees and shrubs, which have to be hardy to survive Alaska winters. Many cannot withstand temperatures below certain thresholds—but model results make it clear that these thresholds are changing rapidly statewide. The results suggest that many perennials that were not suitable to Alaska may soon become potential crops in large areas of the state. This may prove to be an important area for further research and experimentation. However, tool users are reminded that “cold hardiness” is just one gauge of whether a crop is suitable to a particular region. Many other factors affect winter survival, such as the insulating value of snow, the moisture content of the ground, the presence or absence of permafrost, and the number of freeze–thaw cycles that occur. Future versions of this tool may include some of these factors.
Alaska’s peony growers may see both gains and losses due to climate change. Winters are likely to remain cool enough for peony dormancy, while growers in other parts of the world may find challenges in this regard. This may provide some local advantage. Using the Growing Season tool to look at the 32 °F threshold can help to provide an estimate of when peonies are likely to break dormancy in the future in communities around Alaska. However, late springs and cool summer weather are better for Alaska’s peony growers for two reasons: first, because such conditions promote healthier flowering, and second, because they promote later flowering, which allows Alaska to capture the late-season niche market. Given the results obtained by Holloway et al. [28,29,30], using the Growing Degree Days tool to plan for peony growth once buds have emerged is likely to be more effective than using the Growing Season tool. For peony farming, as late springs and cool summers become more elusive, growers may need to adapt. This may be hardest for those who already farm in regions of the state that are warmest in the summer, such as Fairbanks. For new growers who have yet to invest in land, picking cooler parts of the state may be practical if relocation is possible, or selecting cooler sites within a community—such as north-facing slopes—might aid at the local level. New storage methods for cut blooms can also extend the season for sales.
Taken together, the outcomes of this research, as well as the feedback received by tool users, point toward potential refinements in tool development as well as many new possible avenues for expansion of Alaska’s agricultural potential at the local scale. Especially in the context of climate-related agricultural uncertainty, challenges in other regions and possible climate-related needs for greater local autonomy (due to disruptions in supply chains and/or reduced use of fossil fuels for transportation of crops), and the need to diversify Alaska’s economy, such new opportunities for farms and gardens, may prove important areas for further study and development.
Supplementary Materials
The Alaska Garden Helper tool described in this article is available online at https://www.snap.uaf.edu/tools/gardenhelper/ (accessed 3 October 2021).
Author Contributions
Conceptualization, N.F. and A.B.; methodology, N.F. and A.B.; software, A.B.; validation, N.F., A.B., P.B., and C.R.; formal analysis, N.F. and A.B.; investigation, N.F.; resources, N.F., A.B., P.B. and C.R.; data curation, A.B. and P.B.; writing—original draft preparation, N.F.; writing—review and editing, N.F., A.B., P.B. and C.R.; visualization, A.B. and C.R.; supervision, N.F.; project administration, N.F.; funding acquisition, N.F. All authors have read and agreed to the published version of the manuscript.
Funding
This research was funded by the United States Geological Survey (USGS) via the Alaska Climate Adaptation Science Center. The APC was also funded by the USDA via the Alaska Climate Adaptation Science Center.
Informed Consent Statement
Not applicable.
Data Availability Statement
The data presented in this study are openly available in the Scenarios Network for Alaska and Arctic Planning (SNAP) Data Portal at http://ckan.snap.uaf.edu/dataset (accessed 3 October 2021).
Acknowledgments
The authors would like to acknowledge the support of the faculty and staff at UAF’s International Arctic Research Center. All work on this project was built upon past efforts in model selection, model downscaling and data analysis. We would also like to thank all the agriculturalists who contributed their expertise and advice, including the Alaska Peony Growers Association, Community Partnerships for Self-Reliance, Calypso Farm and Ecology Center, Spinach Creek Farm, Arctic Alaska Peonies Co-op, and Tyonek Tribal Conservation District.
Conflicts of Interest
The authors declare no conflict of interest. The funders had no role in the design of the study; in the collection, analyses, or interpretation of data; in the writing of the manuscript, or in the decision to publish the results.
References
- Walsh, J.; Chapman, W.L.; Romanovsky, V.; Christensen, J.H.; Stendel, M. Global Climate Model Performance over Alaska and Greenland. J. Clim. 2008, 21, 6156–6174. [Google Scholar] [CrossRef]
- Wolken, J.M.; Hollingsworth, T.N.; Rupp, T.S.; Chapin, F.S.; Trainor, S.F.; Barrett, T.M.; Sullivan, P.F.; McGuire, A.D.; Euskirchen, E.S.; Hennon, P.E.; et al. Evidence and implications of recent and projected climate change in Alaska’s forest ecosystems. Ecosphere 2011, 2, 1–35. [Google Scholar] [CrossRef]
- Bekryaev, R.V.; Polyakov, I.V.; Alexeev, V. Role of Polar Amplification in Long-Term Surface Air Temperature Variations and Modern Arctic Warming. J. Clim. 2010, 23, 3888–3906. [Google Scholar] [CrossRef]
- AMAP. Arctic Climate Change Update 2021: Key Trends and Impacts. Summary for Policy-Makers; Arctic Monitoring and Assessment Programme (AMAP): Tromsø, Norway, 2021. [Google Scholar]
- Ken, M.; Goldenberg, M.P. Building Food Security in Alaska. Crossroads Resource Center. Minneapolis. Commissioned by the Alaska Department of Health and Social Services, with collaboration from the Alaska Food Policy Council. 2014. Available online: https://www.crcworks.org/akfood.pdf (accessed on 28 September 2021).
- USDA/NASS. 2014 Census of Horticultural Specialties. United States Department of Agriculture National Agricultural Statistics. Service. 2014. Available online: https://www.nass.usda.gov/Publications/AgCensus/2012/Online_Resources/Census_of_Horticulture_Specialties/ (accessed on 8 September 2021).
- Stevenson, K.T.; Alessa, L.; Kliskey, A.D.; Rader, H.B.; Pantoja, A.; Clark, M. Sustainable Agriculture for Alaska and the Circumpolar North: Part I. Development and Status of Northern Agriculture and Food Security. Arctic 2014, 67, 271. [Google Scholar] [CrossRef]
- Swenson, N.Y. Modeling Changes in the Length of the Agricultural Growing Season in Interior Alaska. Master’s Thesis, University of Alaska, Fairbanks, AK, USA, 2013. Available online: http://hdl.handle.net/11122/4604 (accessed on 2 September 2021).
- Lyle, G. Understanding the nested, multi-scale, spatial and hierarchical nature of future climate change adaptation decision making in agricultural regions: A narrative literature review. J. Rural Stud. 2015, 37, 38–49. [Google Scholar] [CrossRef]
- Abid, M.; Schilling, J.; Scheffran, J.; Zulfiqar, F. Climate change vulnerability, adaptation and risk perceptions at farm level in Punjab, Pakistan. Sci. Total Environ. 2016, 547, 447–460. [Google Scholar] [CrossRef] [PubMed]
- Feola, G.; Lerner, A.; Jain, M.; Montefrio, M.J.F.; Nicholas, K. Researching farmer behaviour in climate change adaptation and sustainable agriculture: Lessons learned from five case studies. J. Rural Stud. 2015, 39, 74–84. [Google Scholar] [CrossRef]
- Wheeler, S.; Zuo, A.; Bjornlund, H. Farmers’ climate change beliefs and adaptation strategies for a water scarce future in Australia. Glob. Environ. Chang. 2013, 23, 537–547. [Google Scholar] [CrossRef]
- Mugi-Ngenga, E.W.; Mucheru-Muna, M.W.; Mugwe, J.N.; Ngetich, F.K.; Mairura, F.S.; Mugendi, D.N. Household’s socio-economic factors influencing the level of adaptation to climate variability in the dry zones of Eastern Kenya. J. Rural Stud. 2016, 43, 49–60. [Google Scholar] [CrossRef]
- Sparrow, S.; Lewis, C.E.; Juday, G.P. Climate Change and High Latitude Agriculture; ACIA: Fairbanks, AK, USA, 2007; Available online: http://66.160.145.48/coms/cli/uaf_stephan_sparrow.pdf (accessed on 23 February 2017).
- Holloway, P.S. The Challenge of Cultivating Plants in Cold Soils; Georgeson Botanical Notes No. 12; University of Alaska Fairbanks Agricultural and Forestry Experiment Station: Fairbanks, AK, USA, 1993. [Google Scholar]
- Van Veldhuizen, R.M.; Knight, C.W. Performance of Agronomic Crop Varieties in Alaska 1978–2002; AFEF Bulletin 111:110; School of Agriculture and Land Resources Management, Agricultural and Forestry Experiment Station: Fairbanks, AK, USA, 2004. [Google Scholar]
- Caster, C. Assessing Food Security in Fairbanks, Alaska: A Survey Approach to Community Food Production. Ph.D. Dissertation, University of Alaska, Fairbanks, AL, USA, 2011. [Google Scholar]
- Juday, G.P.; Barber, V.; Duffy, P.; Linderholm, R.T.S.; Sparrow, S.; Yarie, J. Forests, land management, and agriculture. Arct. Clim. Impact Assess. 2005, 205. Available online: https://acia.amap.no/ (accessed on 2 September 2021).
- Hatch, E. Micro-Hardiness Agriculture Zones in the North Star Borough, Alaska: Past and Future Scenarios. Ph.D. Dissertation, University of Alaska, Fairbanks, AK, USA, 2011. [Google Scholar]
- Lader, R.; Walsh, J.E.; Bhatt, U.S.; Bieniek, P.A. Agro-Climate Projections for a Warming Alaska. Earth Interact. 2018, 22, 1–24. [Google Scholar] [CrossRef]
- Skamarock, W.; Klemp, J.; Dudhia, J.; Gill, D.; Barker, D.; Duda, M.; Huang, X.; Wanf, W.; Powers, J. A Description of the Advanced Research WRF Version 3. 2008. Available online: http://www2.mmm.ucar.edu/wrf/users/docs/arw_v3.pdf (accessed on 13 September 2021).
- Dee, D.P.; Uppala, S.M.; Simmons, A.J.; Berrisford, P.; Poli, P.; Kobayashi, S.; Andrae, U.; Balmaseda, M.A.; Balsamo, G.; Bauer, P.; et al. The ERA-Interim reanalysis: Configuration and performance of the data assimilation system. Q. J. R. Meteorol. Soc. 2011, 137, 553–597. [Google Scholar] [CrossRef]
- Donner, L.J.; Wyman, B.L.; Hemler, R.S.; Horowitz, L.; Ming, Y.; Zhao, M.; Golaz, J.-C.; Ginoux, P.; Lin, S.-J.; Schwarzkopf, M.D.; et al. The Dynamical Core, Physical Parameterizations, and Basic Simulation Characteristics of the Atmospheric Component AM3 of the GFDL Global Coupled Model CM3. J. Clim. 2011, 24, 3484–3519. [Google Scholar] [CrossRef]
- Bieniek, P.A.; Bhatt, U.S.; Walsh, J.; Rupp, T.S.; Zhang, J.; Krieger, J.R.; Lader, R. Dynamical Downscaling of ERA-Interim Temperature and Precipitation for Alaska. J. Appl. Meteorol. Clim. 2016, 55, 635–654. [Google Scholar] [CrossRef]
- Taylor, K.E.; Stouffer, R.J.; Meehl, G.A. An Overview of CMIP5 and the Experiment Design. Bull. Am. Meteorol. Soc. 2012, 93, 485–498. [Google Scholar] [CrossRef]
- Peonies in a Changing Climate: A Case Study; Alaska Climate Adaptation Science Center, University of Alaska Fairbanks: Fairbanks, AK, USA; Available online: https://uaf-snap.org/wp-content/uploads/2020/06/Peony-report.pdf (accessed on 9 September 2021).
- Hall, A.; Catley, J.; Walton, E. The effect of forcing temperature on peony shoot and flower development. Sci. Hortic. 2007, 113, 188–195. [Google Scholar] [CrossRef]
- Holloway, P.; Hanscom, J.; Matheke, G. Peonies for Field Cut Flower Production. First-Year Growth; Agricultural and Forestry Experiment Station Research Prog. Report 41; University of Alaska Fairbanks: Fairbanks, AK, USA, 2003; 4p. [Google Scholar]
- Holloway, P.; Hanscom, J.; Matheke, G. Peonies for Field Cut Flower Production. Second-Year Growth; Agricultural and Forestry Experiment Station Research Prog. Report 43; University of Alaska Fairbanks: Fairbanks, AK, USA, 2004; 8p. [Google Scholar]
- Holloway, P.; Matheke, G.; DiCristina, K. Peony Phenology in Alaska; School of Natural Resources and Agricultural Sciences Agricultural and Forestry Experiment Station, University of Alaska Fairbanks: Fairbanks, AK, USA, 2013. [Google Scholar]
- Kamenetsky, R.; Barzilay, A.; Erez, A.; Halevy, A.H. Temperature requirements for floral development of herbaceous peony cv. ‘Sarah Bernhardt’. Sci. Hortic. 2003, 97, 309–320. [Google Scholar] [CrossRef]
- Riley, J. Alaska Garden Helper: A New Computer Tool for Planting in a Changing Climate. Fairbanks Daily Newsminer, 8 March 2020. Available online: https://www.newsminer.com/features/sundays/gardening/alaska-garden-helper-a-new-computer-tool-for-planting-in/article_88cc0f6a-60ee-11ea-be87-bf18cc1e499f.html (accessed on 16 September 2021).


Publisher’s Note: MDPI stays neutral with regard to jurisdictional claims in published maps and institutional affiliations. |
© 2021 by the authors. Licensee MDPI, Basel, Switzerland. This article is an open access article distributed under the terms and conditions of the Creative Commons Attribution (CC BY) license (https://creativecommons.org/licenses/by/4.0/).