1. Introduction
Frequency of agglomerations increased road repair works and a potential reduction in the number of journeys by means of public transport always result in a loss of trust in public transport services. COVID-19 has also contributed to a shift away from mass transit in the UK [
1], Spain [
2], and Switzerland [
3], as a result of people’s fears of spreading the virus when travelling in congested transport, and individual car communication in China [
4] and Italy [
5]. This is a process that goes against the sustainable mobility development plans. Rebuilding this trust is likely to take quite a long time, and the outcome is not obvious. Policymakers need rather to be prepared to modify transport development plans [
6] and adapt them to a permanent change in passenger attitudes [
7]. Still, decision-makers should focus on rebuilding people’s trust in safety when using public transport, in accordance with sustainable mobility development plans [
8], after the COVID-19 period [
9]. It is also important to bear in mind the social consequences of lifestyle changes when switching to widespread use of private cars and thus limiting physical activity [
10]. In order to prevent this occurrence, many of cities are promoting cycling [
11] and walking [
12], which reduces the range of civilization diseases and thus reduces the burden on health care budget. Moreover, as an element of sustainable mobility, it reduces pollutant emissions, achieving the goals of the Sustainable Development Goals [
13] and reducing the carbon footprint of transport companies [
14]. It is common for cities to be attempting to turn the current trends of sustainable mobility and smart city [
15], often fashionable and temporary, into solutions that are permanently embedded in the future. A study in Boston [
16] showed that introducing cycling in cities reduces both the number of kilometres by car and the quarterly greenhouse gas emissions by 3%. At the same time, the number of cars owned by households decreased by 2% in the same period. An important observation from this study is an over 10% drop in the car use, if the distance to the public collective transport transfer station is less than 1 km. Many cities around the world are striving to implement solutions favoring the replacement of cars with bicycles [
17]. The best known solution is the Paris program of the “15-min city” implemented also in Bogota [
18] and Barcelona [
19], in which all services needed by the residents should be available within a 15-min walk or bike ride. London is introducing a program to expand its modern cycle path network and a bicycle hire program [
20]. To promote cycling, Brussels has introduced a speed limit of 20 km/h within the city centre. At the same time, a plan to ban diesel cars in 2030 has been introduced in Brussels. In 2035, this ban is to be applied to all internal combustion cars. In this way, the capital of Belgium plans to fight to improve air quality. There is literature covering multi-criteria decision-making methods in the field of sustainable transport and sustainable mobility in agglomeration areas in Palermo [
21], Chengdu [
22], Kırıkkale [
23], and Bejing [
24].
The methods of multi-criteria analysis are an effective tool used by the management of transport development. They allow to aggregate the collected data and extract invisible trends from it, help in making strategic decisions, as well as shorten and accelerate the decision-making process. In addition, they reduce the risk of making a wrong decision and, consequently, the wrong allocation of funds, personnel and equipment, and the loss of time until the effects of incorrect decisions are repaired. As each decision in the transport industry is usually associated with a large number of criteria, parameters and available alternatives, multi-criteria decision-making methods are particularly useful in this area. Multi-criteria decision supporting methods are often used to build a ranking of available alternatives, key factors and maths coefficients. More than fifty recent articles on MCDM in the transport sector were reviewed by Yannis et al. [
25]. The MCDM list for the purposes of business analysis was presented by Yalicin et al. [
26]. In turn, Wątróbski et al. [
27] presented fifty-six multi-criteria methods together with a proposed mechanism for selecting the appropriate method to be used in specific cases. An example of the practical application of six independent methods for the assessment of BEV (battery electric vehicles) was presented in the work of Ecer [
28]. Moreover, in [
29], six independently applied methods were used to assess the smartness level of selected cities. In the work [
30], seven methods were used to assess communication between two metropolises. The use of MCDM as a support for the decision-making process of selecting means of transport in the Silesian metropolis is the subject of the work [
31]. Decision-makers responsible for the transport policy in metropolitan areas should bear in mind that the development of transport infrastructure, the introduction of comodality [
32], and the introduction of new types of transport, e.g., high-speed rail [
33] affect the population size, spatial layout and development of urban industrial zones through facilitating access to metropolitan areas.
In the field of sustainable transport and mobility, many methods are known to evaluate quantitative, independent of expert knowledge, and qualitative indicators, which may be assumed to be subjective. Additionally, in the literature, there are examples of applications of both quantitative and qualitative indicators [
34]. The mistakes made in the initial phase of the evaluation of alternatives have an impact on the uncertainty of the analysis results, and consequently on incorrect decisions. The most common are averaging the data resulting from expert opinions, the use of a similar evaluation method by a group of experts, subjective assigning weighting coefficients and ineffective change of qualitative to quantitative parameters [
35]. The risk of making a mistake increases when the analysed issue covers several areas of knowledge. Experts usually have specialized knowledge in a narrow field. In this case, hybrid scientific methods that capture the correct data and ensure the evaluation of multidimensional cases should be used.
MCDM methods can be divided into two basic categories: Multi-Attribute Decision Making (MADM) and Multi-Objective Decision Making (MODM). They differ mainly in the number of alternatives. Within the MODM methods, it is infinite, and within MADM it is a countable number of alternatives. In the MODM methods, the decision alternatives are implicitly referred to as mathematical structures. On the other hand, in the group of the MADM methods, the set of alternatives is explicitly defined [
36]. An attempt to divide each of these two groups of methods into subcategories leads to a different number of subgroups depending on the methodology adopted by the authors. The usual division of MADM into four groups is found in [
37,
38]. The latest publications are proposed by six subgroups [
26]: Outranking methods, Interaction-based methods, Pairwise comparison methods, Distance-based methods, Utility-based methods, and Other methods.
Within Outranking methods, the most popular methods are: PROMETHEE, ELECTRE and ORESTE. The methods of this group define the degree of domination of alternatives among each other. PROMETHEE is in practice a group of six methods, from PROMETHEE I to PROMETHEE VI [
39], which use a subjective assessment mechanism and lead to the establishment of rankings of preferred solutions. The method has found a wide range of applications in decision-making processes in business, although it is usually used to support relatively simple decisions. The flowchart of the PROMETHEE method can be easily adapted to individual requirements, also to choose from conflicting criteria. In practice, the method is most useful in combination with other MADM methods. There are many hybrid methods [
39], including α-rough-fuzzy-sets-PROMETHEE [
40] and PROMETHEE-IDEA [
41]. PROMETHEE II, one of the methods of the PROMETHEE group ensures that the assessed alternatives are ranked, is effective in assessing decision parameters of various dimensions and enables the construction of decision matrices. Prioritization of alternatives in PROMETHEE II is done by comparing a pair of alternatives for each of the adopted criteria. This group of features makes it the most frequently used variant in the PROMETHEE family [
42].
The most popular methods in the Interaction-based methods group are: DEMATEL, Gray Relational Analysis, and Choquet Integral. This group of methods is used when the parameters taken into account in the decision-making process influence each other. The DEMATEL [
43] method is particularly useful in the analysis of complex structural models that take into account cause-and-effect relationships. There are also many other hybrid methods, including DEMATEL-based-ANP-PROMETHEE [
44] and N-DEMATEL based TOPSIS [
45]. In the Pairwise comparison methods group, the most important method is the Analytic Hierarchy Process (AHP) [
46], in which a hierarchy is established: starting from a goal, moving to criteria, and finally, alternatives. The Analytic Network Process (ANP) [
47] is an extension and generalization of this method to a network structure instead of a hierarchical structure. Another important method in this group is the Best-Worst Method (BWM) [
48]. The most important methods in Distance-based methods are: TOPSIS, VIKOR, and CODAS. In this group, the choice of an alternative is based on the distance to the optimal solution [
49]. In the Utility-based methods group, the basic WASPAS, SWARA and COPRAS methods are based on the determination of the degree of utility of the parameters studied [
50]. The remaining methodologies were assigned to Other methods. These include, for example: Simple Additive Weighting, Simple Multi-Attribute Rating Technique, and Data Envelopment Analysis [
51].
In turn, the MODM methods are often divided into four groups [
52,
53]: A priori methods, A posteriori methods, Interactive methods, and No-preference methods. In the A priori methods group, popular methods are Goal programming and the Utility function method. At the beginning of the analysis, decision-makers define a set of acceptable solutions and goals that may be contradictory [
54]. In the group of A posteriori methods, popular methods are Epsilon constraint and Evolutionary algorithms. Acceptable solutions in this case are determined by decision-makers at the end of the analysis. One function is optimized, and the rest are boundary conditions for solutions [
26]. In the Interactive methods group, active participation of decision-makers during subsequent iterations of the analysis is required. The preferences are modified based on the results obtained in subsequent iterations. The most commonly used methods are the STEM [
55] and Geoffrion/Dyer/Feinberg algorithms. In the No-preference methods group, no preference information from decision-makers is required. The most frequently used method in this field is the Global criterion [
56].
It should be emphasized that the analysis of sustainability issues, in addition to the basic methods from the MADM and MODM groups, also uses an extensive set of combined hybrid methods combining at least two of the above methods with a large group of fuzzy versions (AHP-VIKOR [
57], AHP-fuzzy TOPISIS [
58], fuzzy AHP-fuzzy TOPSIS [
59], fuzzy BWM-BWM-TOPSIS-GIS [
60], and DEMATEL-PROMETHEE [
61]).
Decision support methods are currently one of the most important management tools in both commercial and public transport companies and in public units managing overall transport development policy in a given area. Almost every entity from these groups collects, processes and provides the management group with aggregated data and final analysis results obtained with various methods. In this respect, the world of commercial companies and public entities permeates. Business analyses are conducted from three perspectives: descriptive, predictive and prescriptive [
62] analyses. Descriptive analytics answers the question of what happened, the predictive one answers what could happen, and finally the prescriptive one responds to what to do after. This allows a good understanding of the current and future needs and behaviours of the participants in transport processes. Currently, the competitive advantage on the transport market and adapting to the needs of the recipient largely depend on the ‘agility’ of the entities. The agility and pace of reaction to new market phenomena largely depend on rational, good and quick decisions made on the basis of hard data, and not on the experience, intuition and historical knowledge of the management staff.
For leaders of modern managed organizations, it is natural to use multi-criteria methods in the decision-making process, data mining, Big Data analysis, the use of intelligent decision support systems combining artificial intelligence and expert systems with fuzzy logic and genetic algorithms [
63]. However, in the context of the speed of decision-making, the key is also the existence of ready-made sets of parameters dedicated to a given issue and an easy-to-implement and reliable numerical evaluation mechanism. This article meets this demand by filling the research gap in the scope of the proposed template of activities necessary to be introduced after the COVID-19 period in order to implement the philosophy of sustainable mobility in metropolitan areas.
The scientific gaps in this regard are unquestionable. Basically, there are no articles examining the subject of metropolitan rail integrated with other means of transport in the context of changes in passenger behaviour in the post COVID-19 period. In practice, there are also no scientific articles proposing a three-dimensional model of factors facilitating the implementation of sustainable mobility in metropolitan area. The article fills this gap, and its main contribution to the literature is to propose a set of parameters, dimensions and groups of measures helpful in the implementation of sustainable transport in the Szczecin Metropolitan Area in the post-COVID-19 era, along with a ranking of these elements obtained using the hybrid multi-criteria method.
The article proposes three groups of instruments influencing sustainable mobility: legal, economic and information regulations. In this context, research questions should be asked: which of them is the most important? What is the correct order of implementation of these groups in a metropolitan area? The work also presents three dimensions and fifteen criteria helpful in the implementation of sustainable transport in the metropolitan area. Therefore, the next research question is: which of the proposed criteria and dimensions are the most important?
The rest of the paper is organized as follows:
Section 2 presents the Szczecin Metropolitan Railway (SMR) in the Szczecin Metropolitan Area (SMA).
Section 3 describes three groups of instruments, three dimensions and fifteen criteria helpful in the implementation of sustainable transport in the Szczecin agglomeration, along with the definitions of their contribution to sustainable development.
Section 4 presents the connected DEMATEL and PROMETHEE II methodologies used to assess the introduced elements.
Section 5 assesses these proposed elements using the presented methodologies.
2. Szczecin Metropolitan Railway (SMR) in Szczecin Metropolitan Area (SMA)
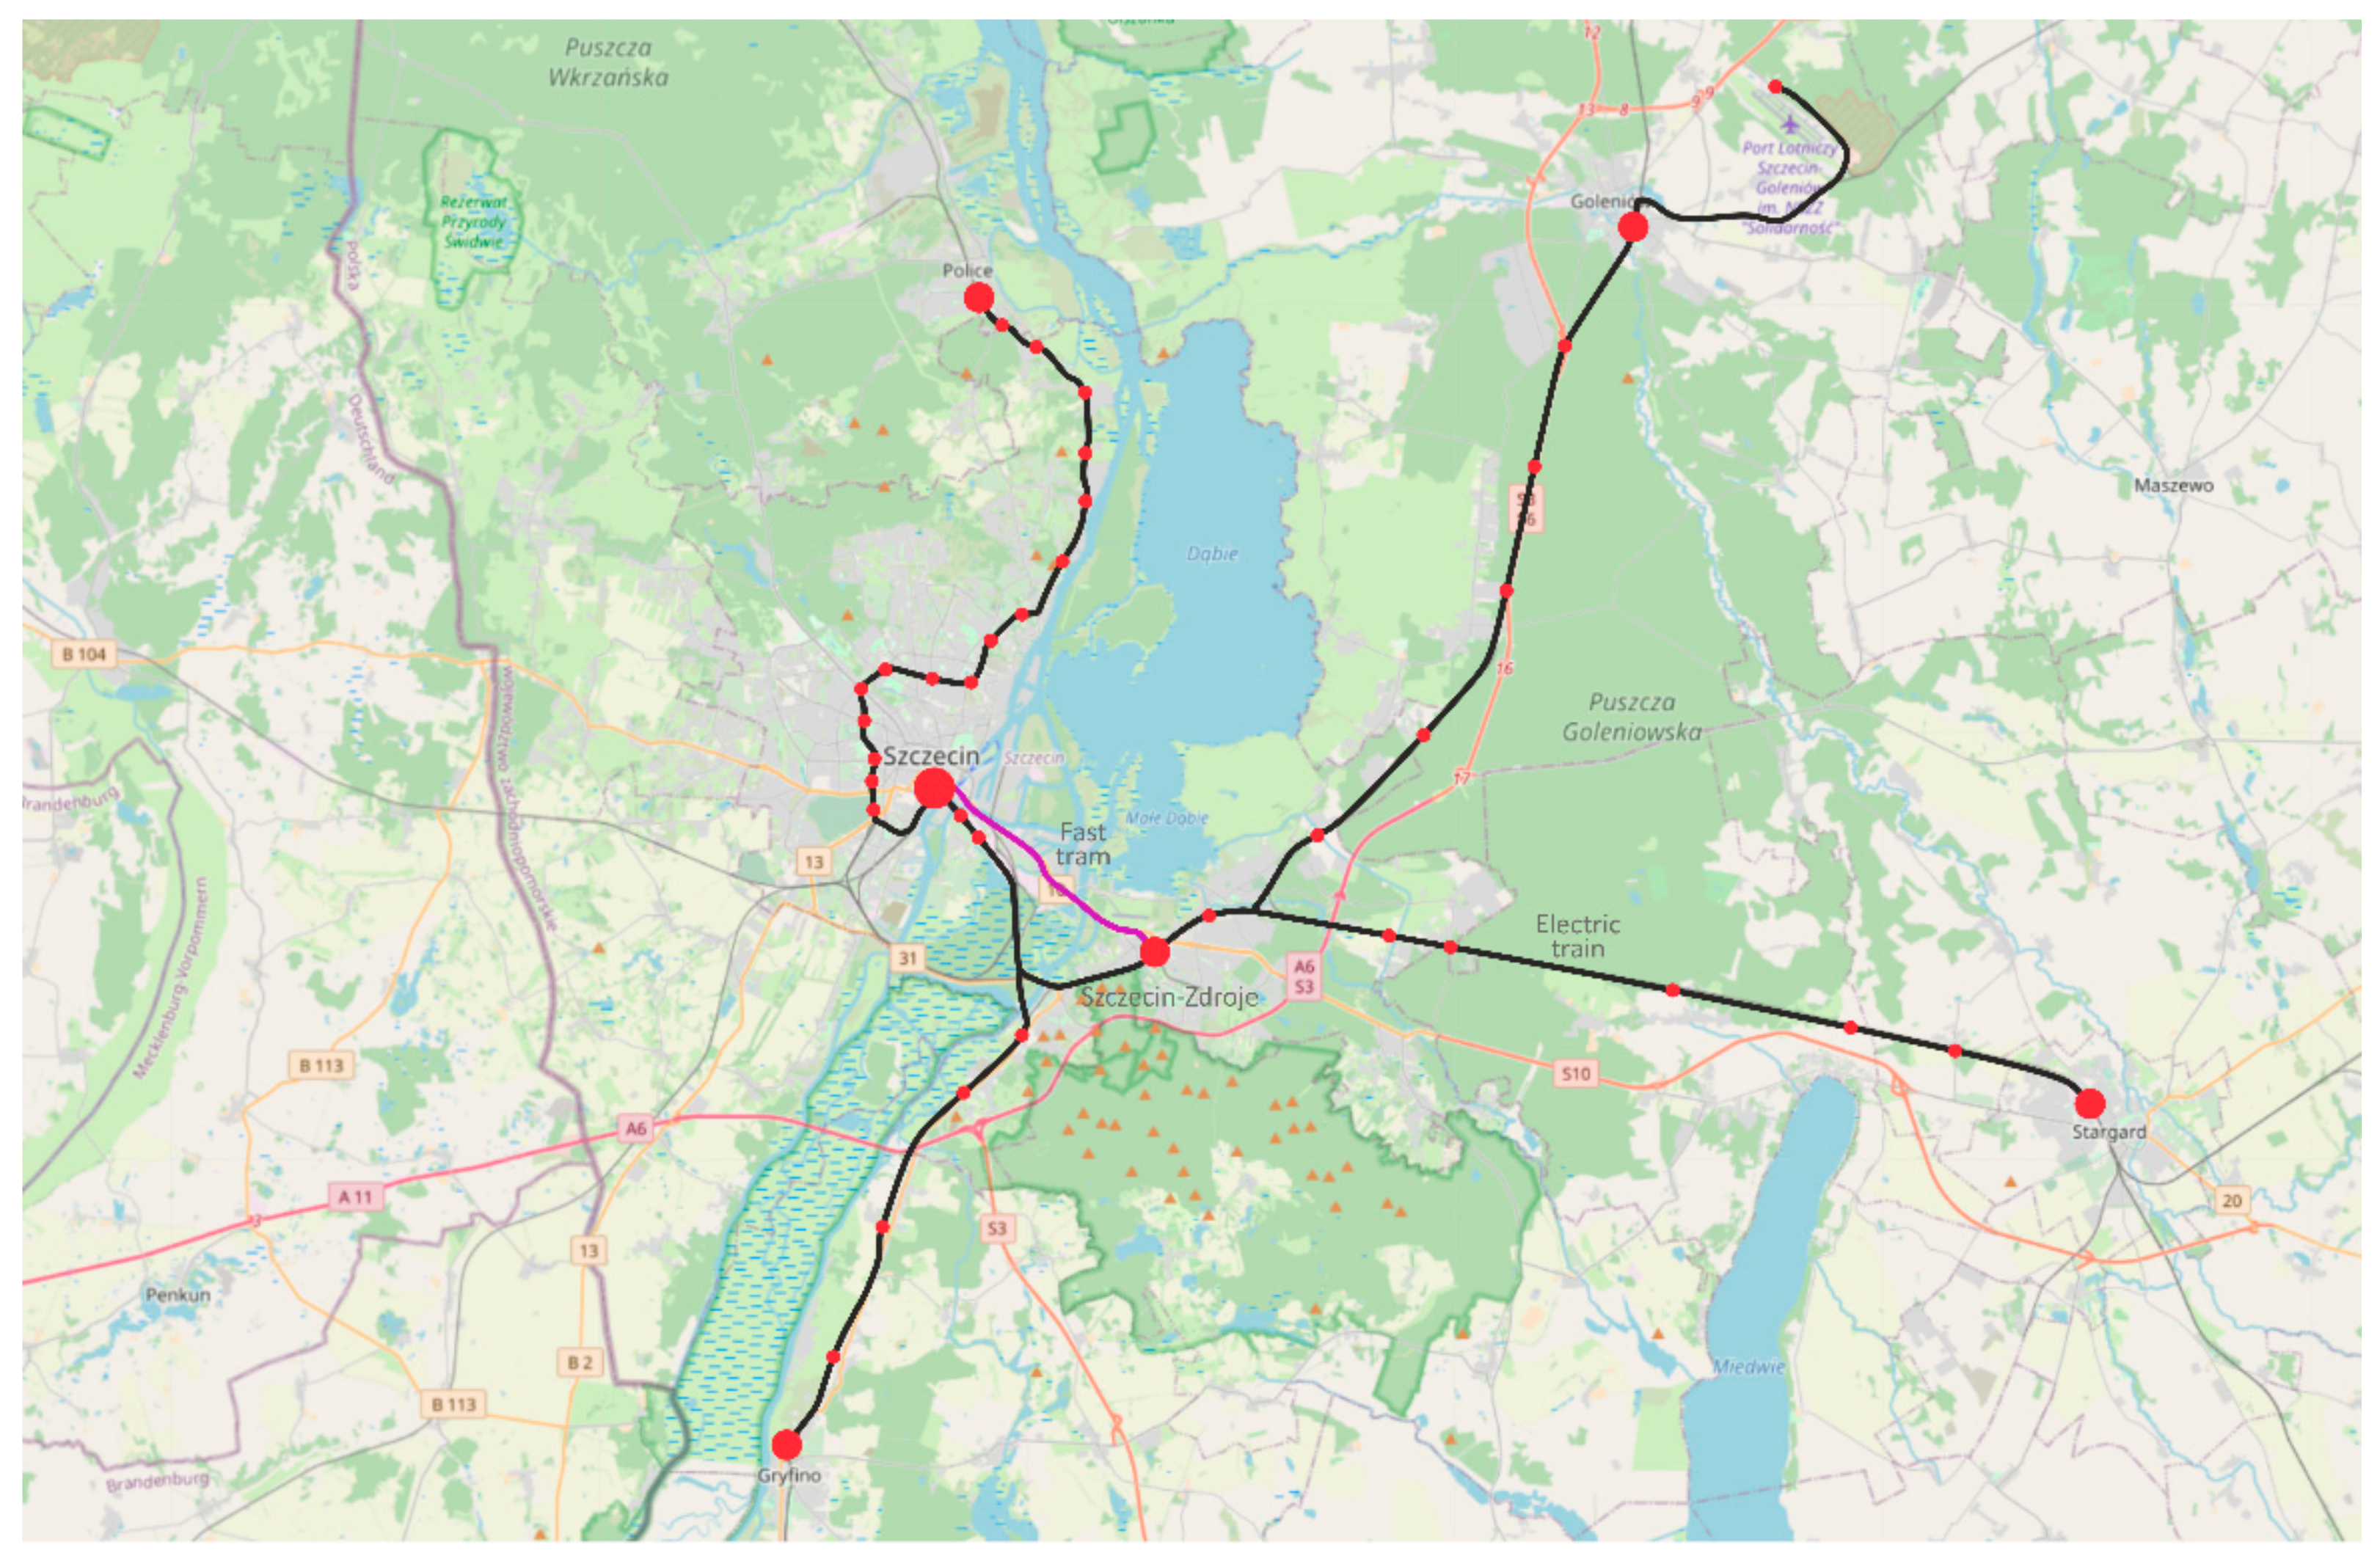
This article focuses on the issue of transport within the Szczecin Metropolitan Area (SMA) covering the largest cities: Szczecin, Stargard, Świnoujście, Police, Goleniów and Gryfino. The center of the area is the city of Szczecin, which is also the capital of the West Pomeranian Voivodeship. It is a region in northwestern Poland through which the Odra River flows into the Baltic Sea. It is characteristic for Szczecin that is the seventh city in Poland in terms of the number of inhabitants (398,000 in 2020), and the third city in terms of the area occupied (301 km2).
The city and regional authorities have decided to implement sustainable public transport, the axis of which in the region is to be the Szczecin Metropolitan Railway (SMR) [
64]. The regional transport with 40 stops and 4 SMR lines are to be carried out by electric railway vehicles (
Figure 1). In the city of Szczecin, the basic means of communication will be local tram communication, supported by bus transport, carried out by electric buses gradually being added to the fleet. Twenty six SMR stops will be located in the city of Szczecin, integrated into interchange nodes connecting the train, tram, bus, car and bicycle.
As a result, the Szczecin Metropolitan Railway is to create a public transport pillar in the Szczecin Metropolitan Area, together with the connected transfer nodes. The system of public rail connections, due to the integration with other types of public transport (trams and buses) as well as individual transport (Park & Ride and Bicycle & Ride parks), guarantees an efficient and sustainable transport system.
Szczecin is divided into two parts located on the left and right banks of the Odra River. The important elements of the transport system are that there are only three road systems connecting both sides of the Odra river with bridges (roads A6, 10, and 31) and a single fast tram line. In this context, the integrated Szczecin-Zdroje transfer station, strategically located on the right bank of the city, is vital for passengers. The participants of the transport process have the opportunity to leave their cars and bicycles there in the P&R and B&R parks and quickly enter the left-bank city center by the ‘Fast tram’ or electric SMR train in accordance with the principles of sustainable development and sustainable mobility. The planned completion of the expansion of all interchange stations and the launch of SMR are scheduled for 2022. The COVID-19 pandemic, however, has caused construction delays, probably until the period after 2023.
The COVID-19 pandemic has also changed the behaviour of participants in transport processes in various ways in Sicily [
66]. The sense of safety of public transport passengers in Krakow was shaken [
67]. In the period before the outbreak of the pandemic, a decrease in the number of participants in public transport had already been observed in large agglomerations [
16], also in the group of regular commuters. After the start of the pandemic, the number of people in public transport decreased by even up to 95% [
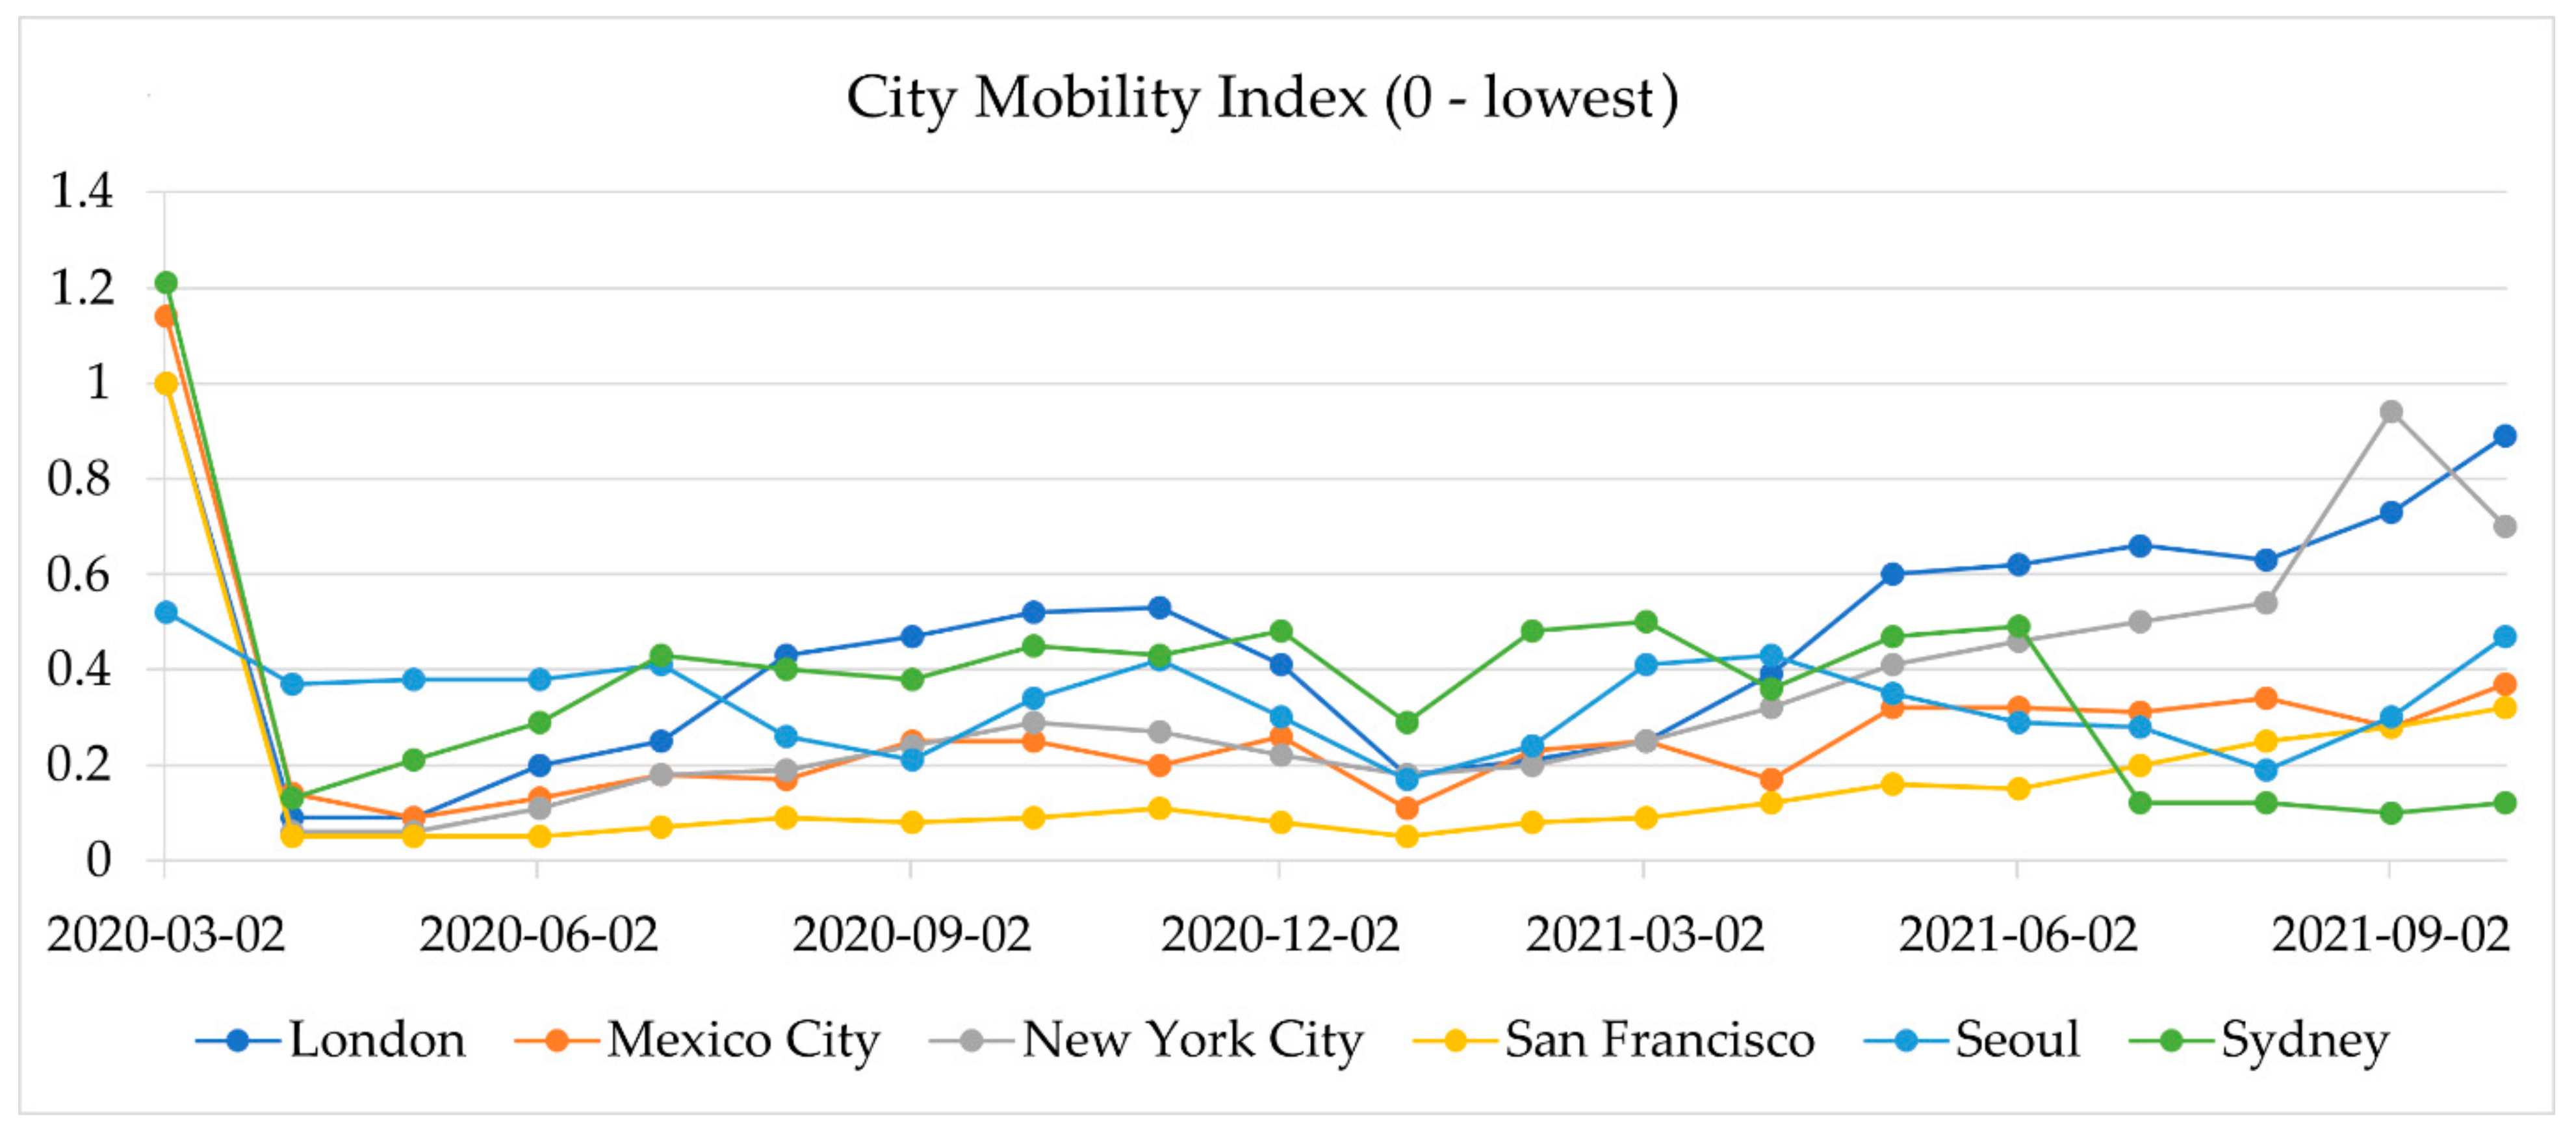
68]. A vast number of passengers have switched from public transport to private cars. Mobility in major cities in the world, restricted during the global lockdown, introduced from March 2020 did not return to pre-pandemic levels by the end of third quarter of 2021 despite the global COVID-19 vaccination campaign and the gradual easing of lockdowns (
Figure 2).
In order to assess what changes have occurred in the perception of the city communication system in Szczecin by passengers, a survey was conducted in the period June-October 2020 in Szczecin-Zdroje among people at two transfer stations Szczecin-Zdroje. One of them connects Park & Ride and Bicycle & Ride with the so-called the second fast tram, the second one with an electric train station. It is worth mentioning that the period of summer 2020 was a period of a decrease in the number of people infected with COVID-19 and various attempts to open the economy.
Analysis of sex, age and other parameters was not performed as it was irrelevant in the study. The only segmentation of the respondents was based on the use of private cars as part of commuting. The idea was to gather views during the COVID-19 pandemic about the use of public transport and private passenger cars and plans for the future concerning the preferred form of transport.
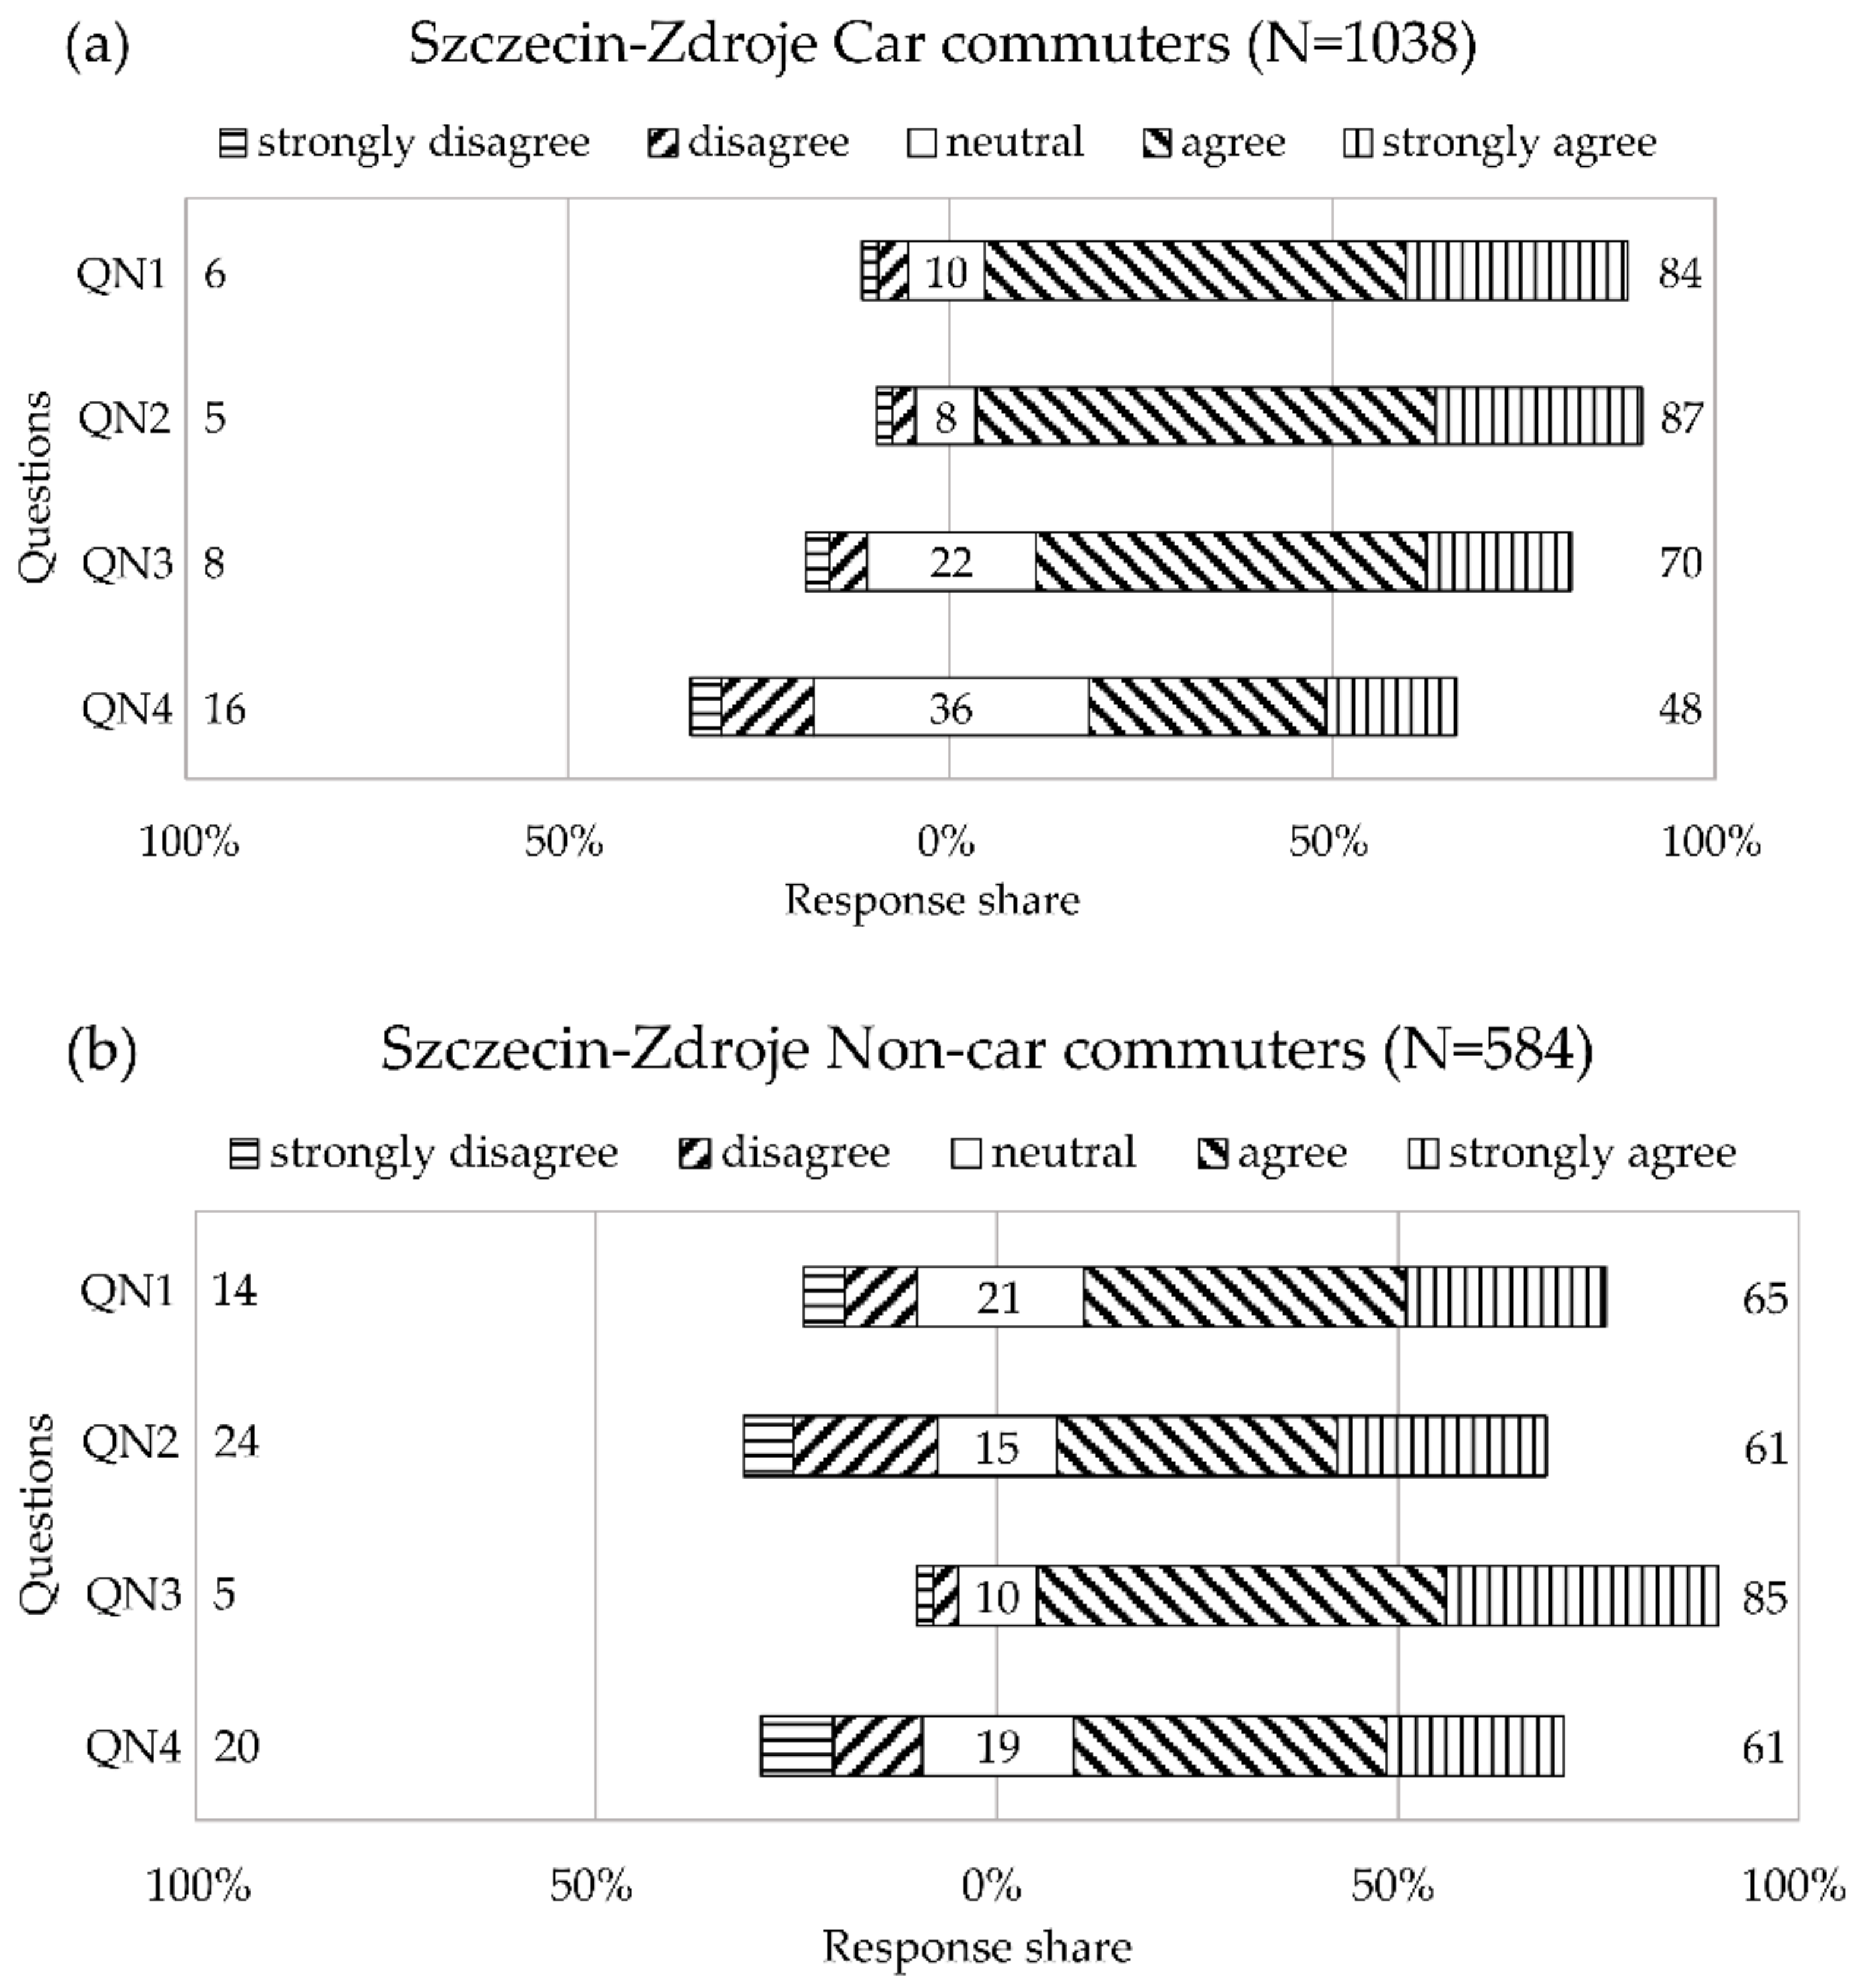
The respondents were asked to express their opinion on four issues (QN1–QN4) using the 5-point Likert scale (strongly disagree, disagree, neutral, agree, strongly agree):
QN1. The SMR public transport is a factor contributing to the transmission of the virus.
QN2. The use of private cars is a factor in reducing the spread of the virus.
QN3. People will return to public transport.
QN4. Eagerness to buy a private car in the next 12 months.
The horizontal axis is the percentage of answers in which the respondents do not agree (left side of the axis) or agree (the right side of the axis) with the question. For each of the four questions QN1–QN4, the three numerical values in the figure represent the total share of respondents who disagree, neutral and agree with the question. The number of the respondents using private cars to commute to work in Szczecin accounted for 64%. Of course, these people could also leave their cars at the transfer stations and continue their journey by public transport. In total, 84% of the commuters are convinced that the SMR public transport is a factor contributing to the transmission of the virus. Only 65% of the people who do not possess their cars are of a similar opinion. Conversely, 87% of the car owners believe that the use of private cars is a factor in reducing the spread of the virus. Overall, 61% of the exclusive public means of transport users are of a similar opinion. The above responses show that private car owners are strongly convinced of the advantages of using private cars in comparison to public transport during the pandemic. In response to the next question of whether people will return to public transport, over 70% of the car users and 85% of the public transport users are convinced of this. The last question was about eagerness to buy a private car in the next 12 months. Only 48% of those commuting in their own cars have such plans, compared to 61% of those who only use public transport. To sum up, car users are convinced of the safety that a private car provides and the lack of security when using public mass transport. Compared to the group of public transport users, even up to 15% fewer responses were convinced that there will be a return to public transport. Fewer than half of those who have already owned a car are considering buying a new car. In turn, the users of public transport are much less afraid of the transmission of the virus in public means of transport. Up to 26% fewer of them, compared to the car users, are certain about the safety of private cars. They are definitely convinced that people will return to public communication although, at the same time, paradoxically, most of them intend to buy a private car. The above replies show that it will be relatively difficult to dissuade private car users from using them, and simultaneously attention should be paid to the increasing risk of current passengers turning away from public transport.
3. Groups of Instruments, Dimensions and Criteria Helpful in Implementing Sustainable Transport in the Szczecin Metropolitan Area
The project of a multimodal approach to transport issues within the SMA should be significantly expanded to reverse the trend towards private cars. Regulatory and technological support should be developed for a package of additional incentives to promote sustainable transport and discourage private car ownership and use. They can include, for example:
parking fees depending on types of cars,
different fees for entering the city centre and using any roads,
IT applications in terms of both information and integration of charges for agglomeration tickets, car parks, and car, bicycles and electric scooters rentals,
introduction of restrictive emission standards for cars,
promoting a car rental,
promoting teleworking and online shopping,
promoting campaigns supporting eco-driving,
promoting ridesharing,
promoting the communication model on demand in remote suburban areas,
plug-in support programs for plug-in electric cars.
Table 1 presents a proposal for group remedial measures in Szczecin Metropolitan Area, the implementation of which should result in an increase in sustainable mobility in the field of metropolitan transport in the post-COVID-19 period. These three groups are legal, economic and information instruments, marked with the codes A1–A3.
Based on the literature research,
Table 2 lists the selected 15 criteria (C11–C35) grouped in 3 dimensions (D1–D3), which serve to achieve the goals of sustainable mobility.
The criteria presented in
Table 2 reflect the view [
84] that the transition to sustainable transport in the metropolitan area is supported by electromobility, the implementation of elements of a low-emission society and public transport. Car manufacturers, politicians, trade unions and analysts are in an agreement that alternative drives, especially electric ones, are the right direction for the development of means of transport. Electric drives will enable the reduction of pollutant emissions in transport, facilitate the achievement of the Sustainable Development Goals and Sustainable Mobility strategies, reduce the carbon footprint of transport companies, as well as facilitate the introduction of Circular Economy to this branch in a wider scope. However, the parties do not agree on the pace of change. In Europe, the European Green Deal strategy is being promoted, by means of which the European Union countries are to achieve climate neutrality by 2050. Part of the project is the planned completion of the production of combustion engines [
85]. The low-carbon society paradigm reflects the model of a society that, in response to climate change, undertakes development and change initiatives in the field of technology, economy and a social system. The criteria related to low-carbon societies in the field of sustainable transport promote projects that limit car traffic, develop infrastructure and are environmentally friendly at the same time, increase the efficiency of transport service providers, as well as raise public awareness with respect to sustainable development. Sustainable collective transport is one of the key and necessary elements in the pursuit of sustainable mobility and a sustainable society. It contributes significantly to the efficient use of any means of transport. The basis of collective transport is public transport and modern supplementary forms (mobility as a Service, carpooling, transport on demand) [
86]. The introduction of tolls directly reduces both private car traffic and CO2 emissions [
87]. Introducing various bans on ICE cars reduces the carbon footprint of the transport sector and helps to achieve sustainability. In many cities all over the world, regulations are introduced simultaneously obliging city authorities to gradually introduce electrification of rolling stock for the purposes of public transport [
88]. Currently, other types of power supply for public transport do not extend beyond pilot and study programs [
89]. The implementation of sustainable collective transport issues forces city authorities to take a new look at the agglomeration development policy, also in terms of architecture, road systems, parking models and the location of charging stations [
90].
5. Results and Discussion
This unit demonstrates the practical use of the proposed method to evaluate sustainable metropolitan transport in the Szczecin Metropolitan Area.
- Stage 1.
DEMATEL method
Based on the literature review, the sets of three instruments (
Table 1) together with fifteen criteria and three dimensions (
Table 2) to be implemented in a metropolitan area in order to facilitate the implementation of the principles of sustainable transport are discussed. Thus, eleven expert interviews are conducted. Four experts have deep knowledge in the field of sustainable mobility in general; the other two are experts in the field of intelligent decision-making systems, expert systems and intelligent transport systems. The next two people are experts in the field of spatial planning of urban areas and the development of public transport. One person is a marketing and advertising expert. The last two people specialize in commercial law and issuing opinions on legal acts issued by public authorities. Owing to the DEMATEL method, the experts assess interactions in pairs of all criteria. They use a range from 0 to 4. The value ‘4’ means the maximum influence of a criterion on another criterion. The aggregation of eleven partitive initial direct influence matrices
allows to obtain a direct influence matrix
Z (
Table A1 in
Appendix A). The normalized direct influence matrix
X is formulated based on (3) and presented in
Table A2 in
Appendix A. Next, the total relations matrix
T (
Table A3 in
Appendix A) is defined by (5). The matrix
T consists of two submatrices
and
. They represent the two sets of three dimensions and fifteen criteria, respectively.
Table 3 presents the two submatrices
and
and coefficients
and
, as well as the position indicators
and relation indictors
.
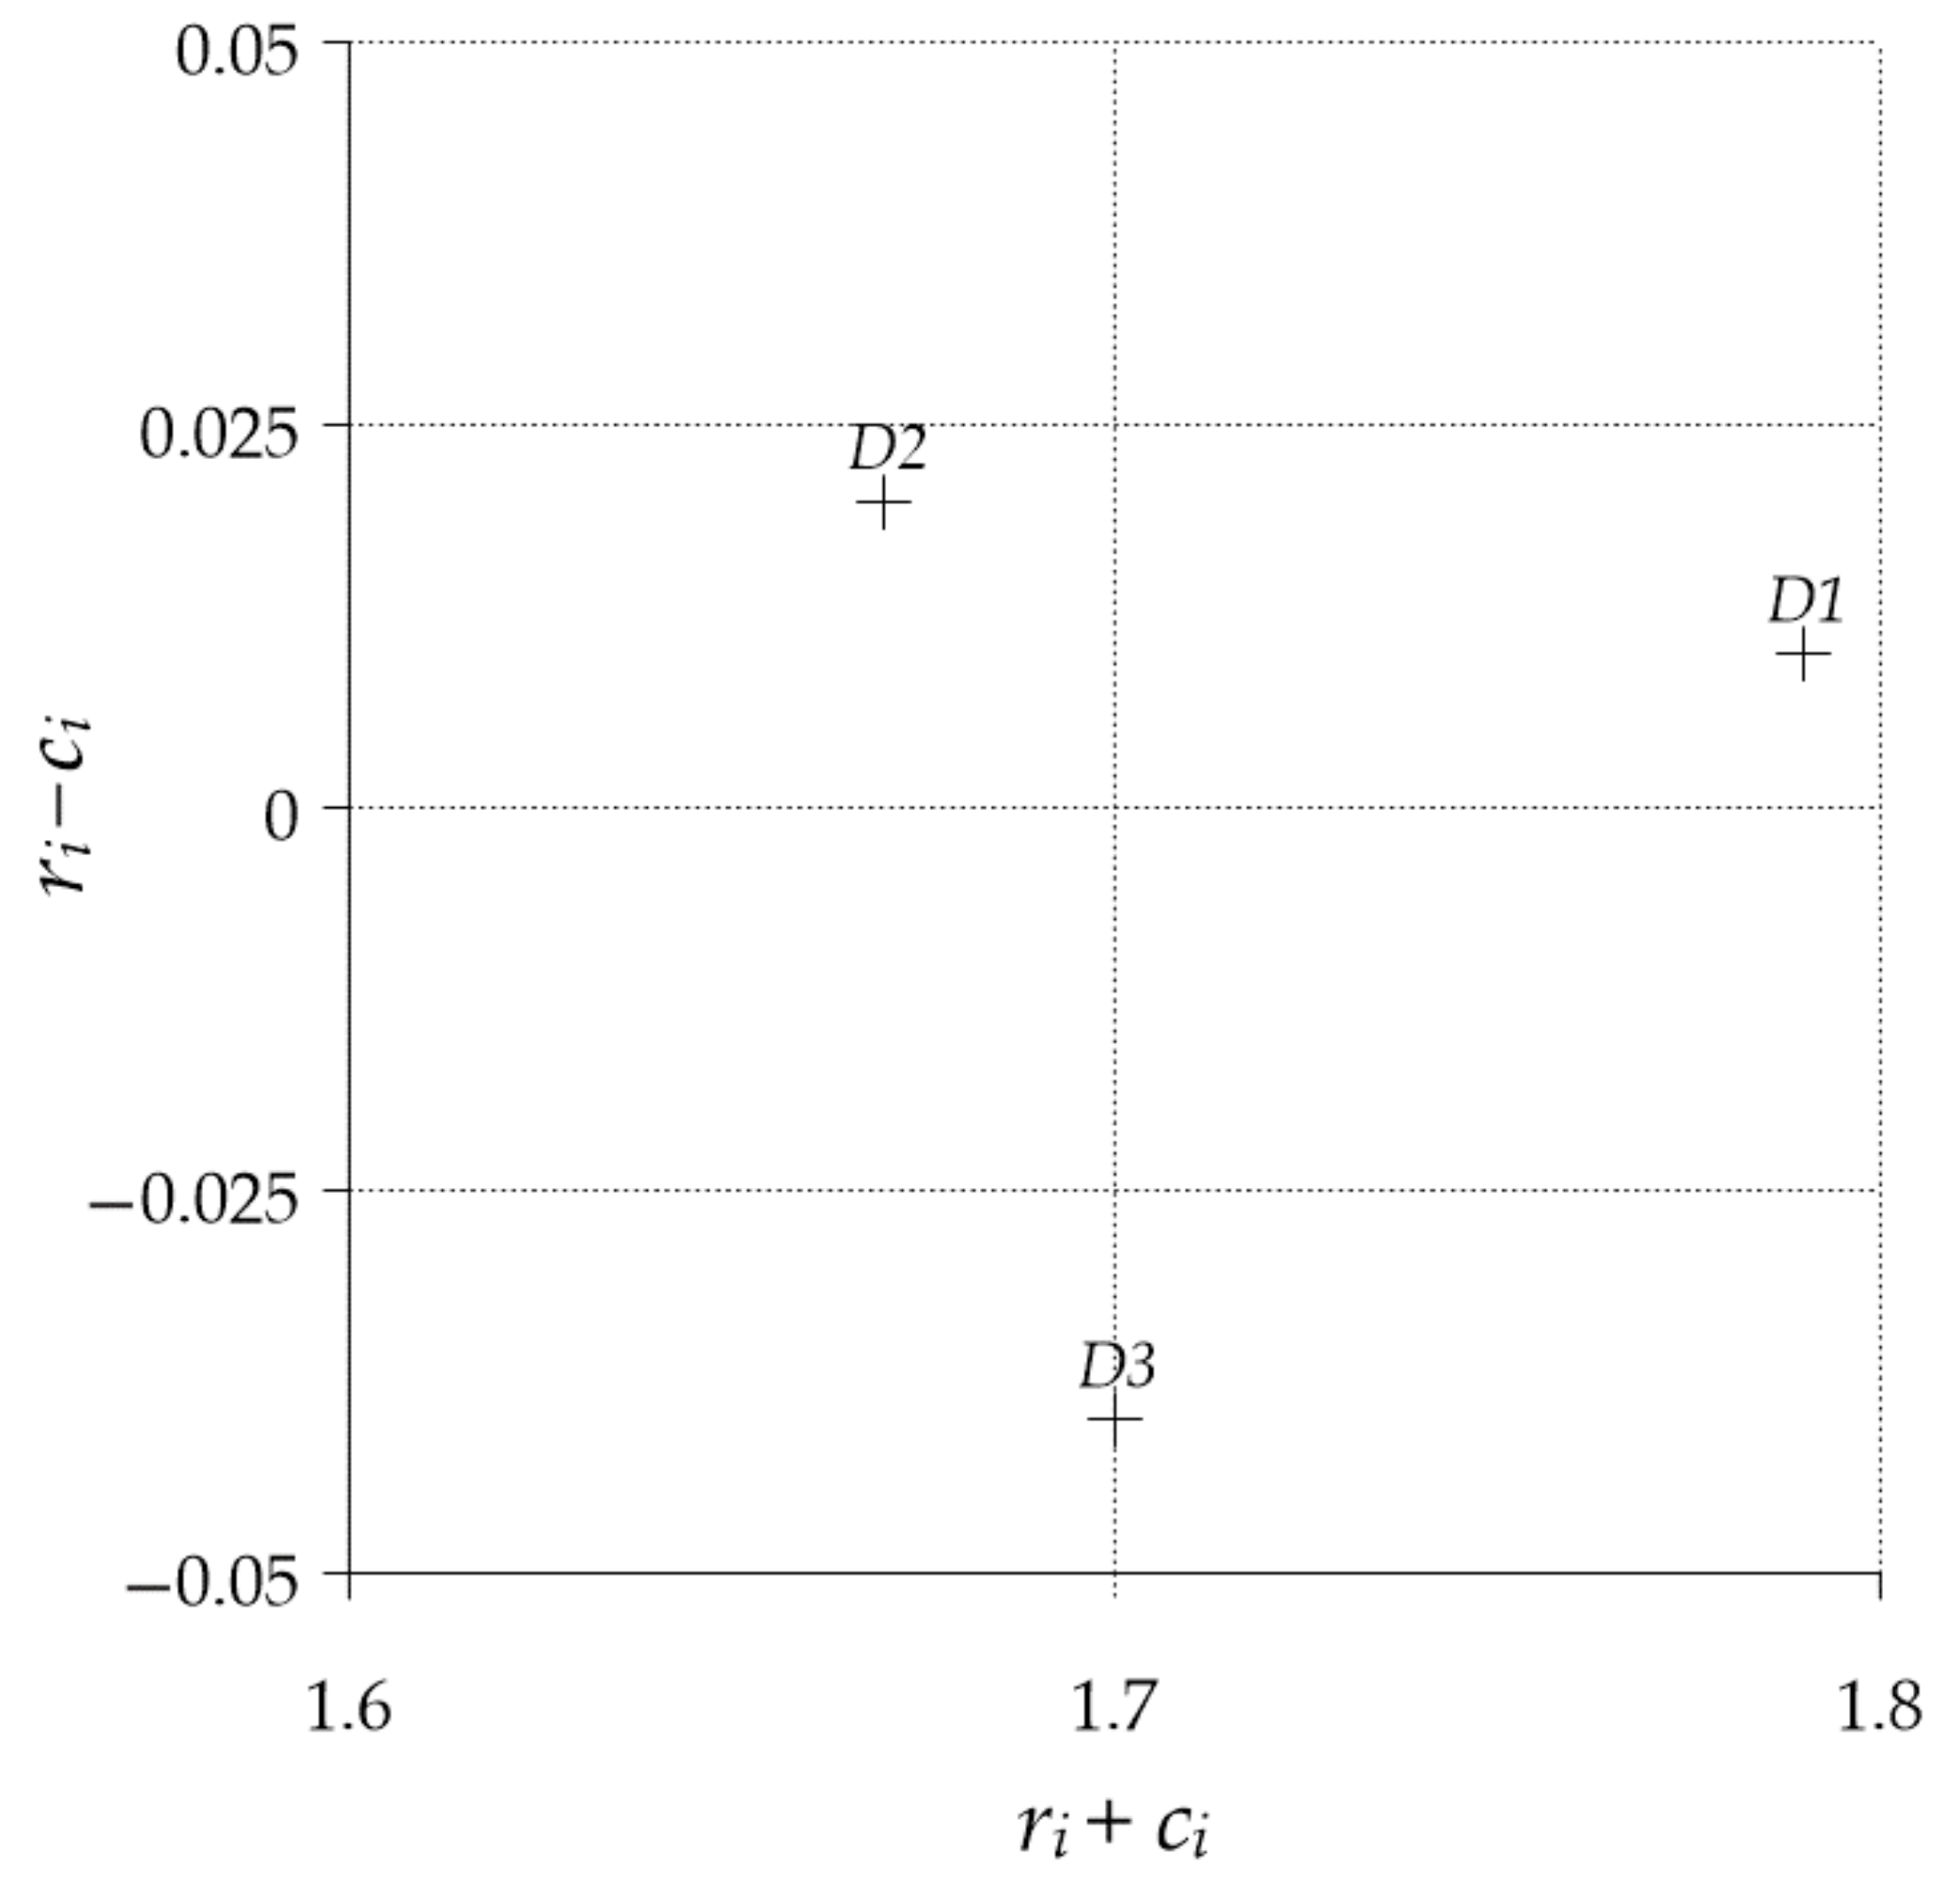
Thus, the diagram of
can be presented (
Figure 4) for the three dimensions D1–D3. The dimension D2 (Low-carbon society) has the highest value of the relation index. Thus, it has the greatest influence on other dimensions. The dimension D3 (Sustainable collective transport) has the lowest negative value of the relation parameter, which means that it receives the greatest impact from the others. To sum up, D1 (Electro-mobility) and D2 (Low-carbon society) are called causal dimensions, while D3 (Sustainable collective transport) is the recipient of the influence of the others. As regards the position coefficient, it shows the importance of each dimension. In
Figure 4, the D1 dimension (Electro-mobility) with the highest value of this coefficient shows the most substantial position as well as the highest level of interconnection among the other dimensions. The D2 dimension (Low-carbon society) has the lowest value of position indicator.
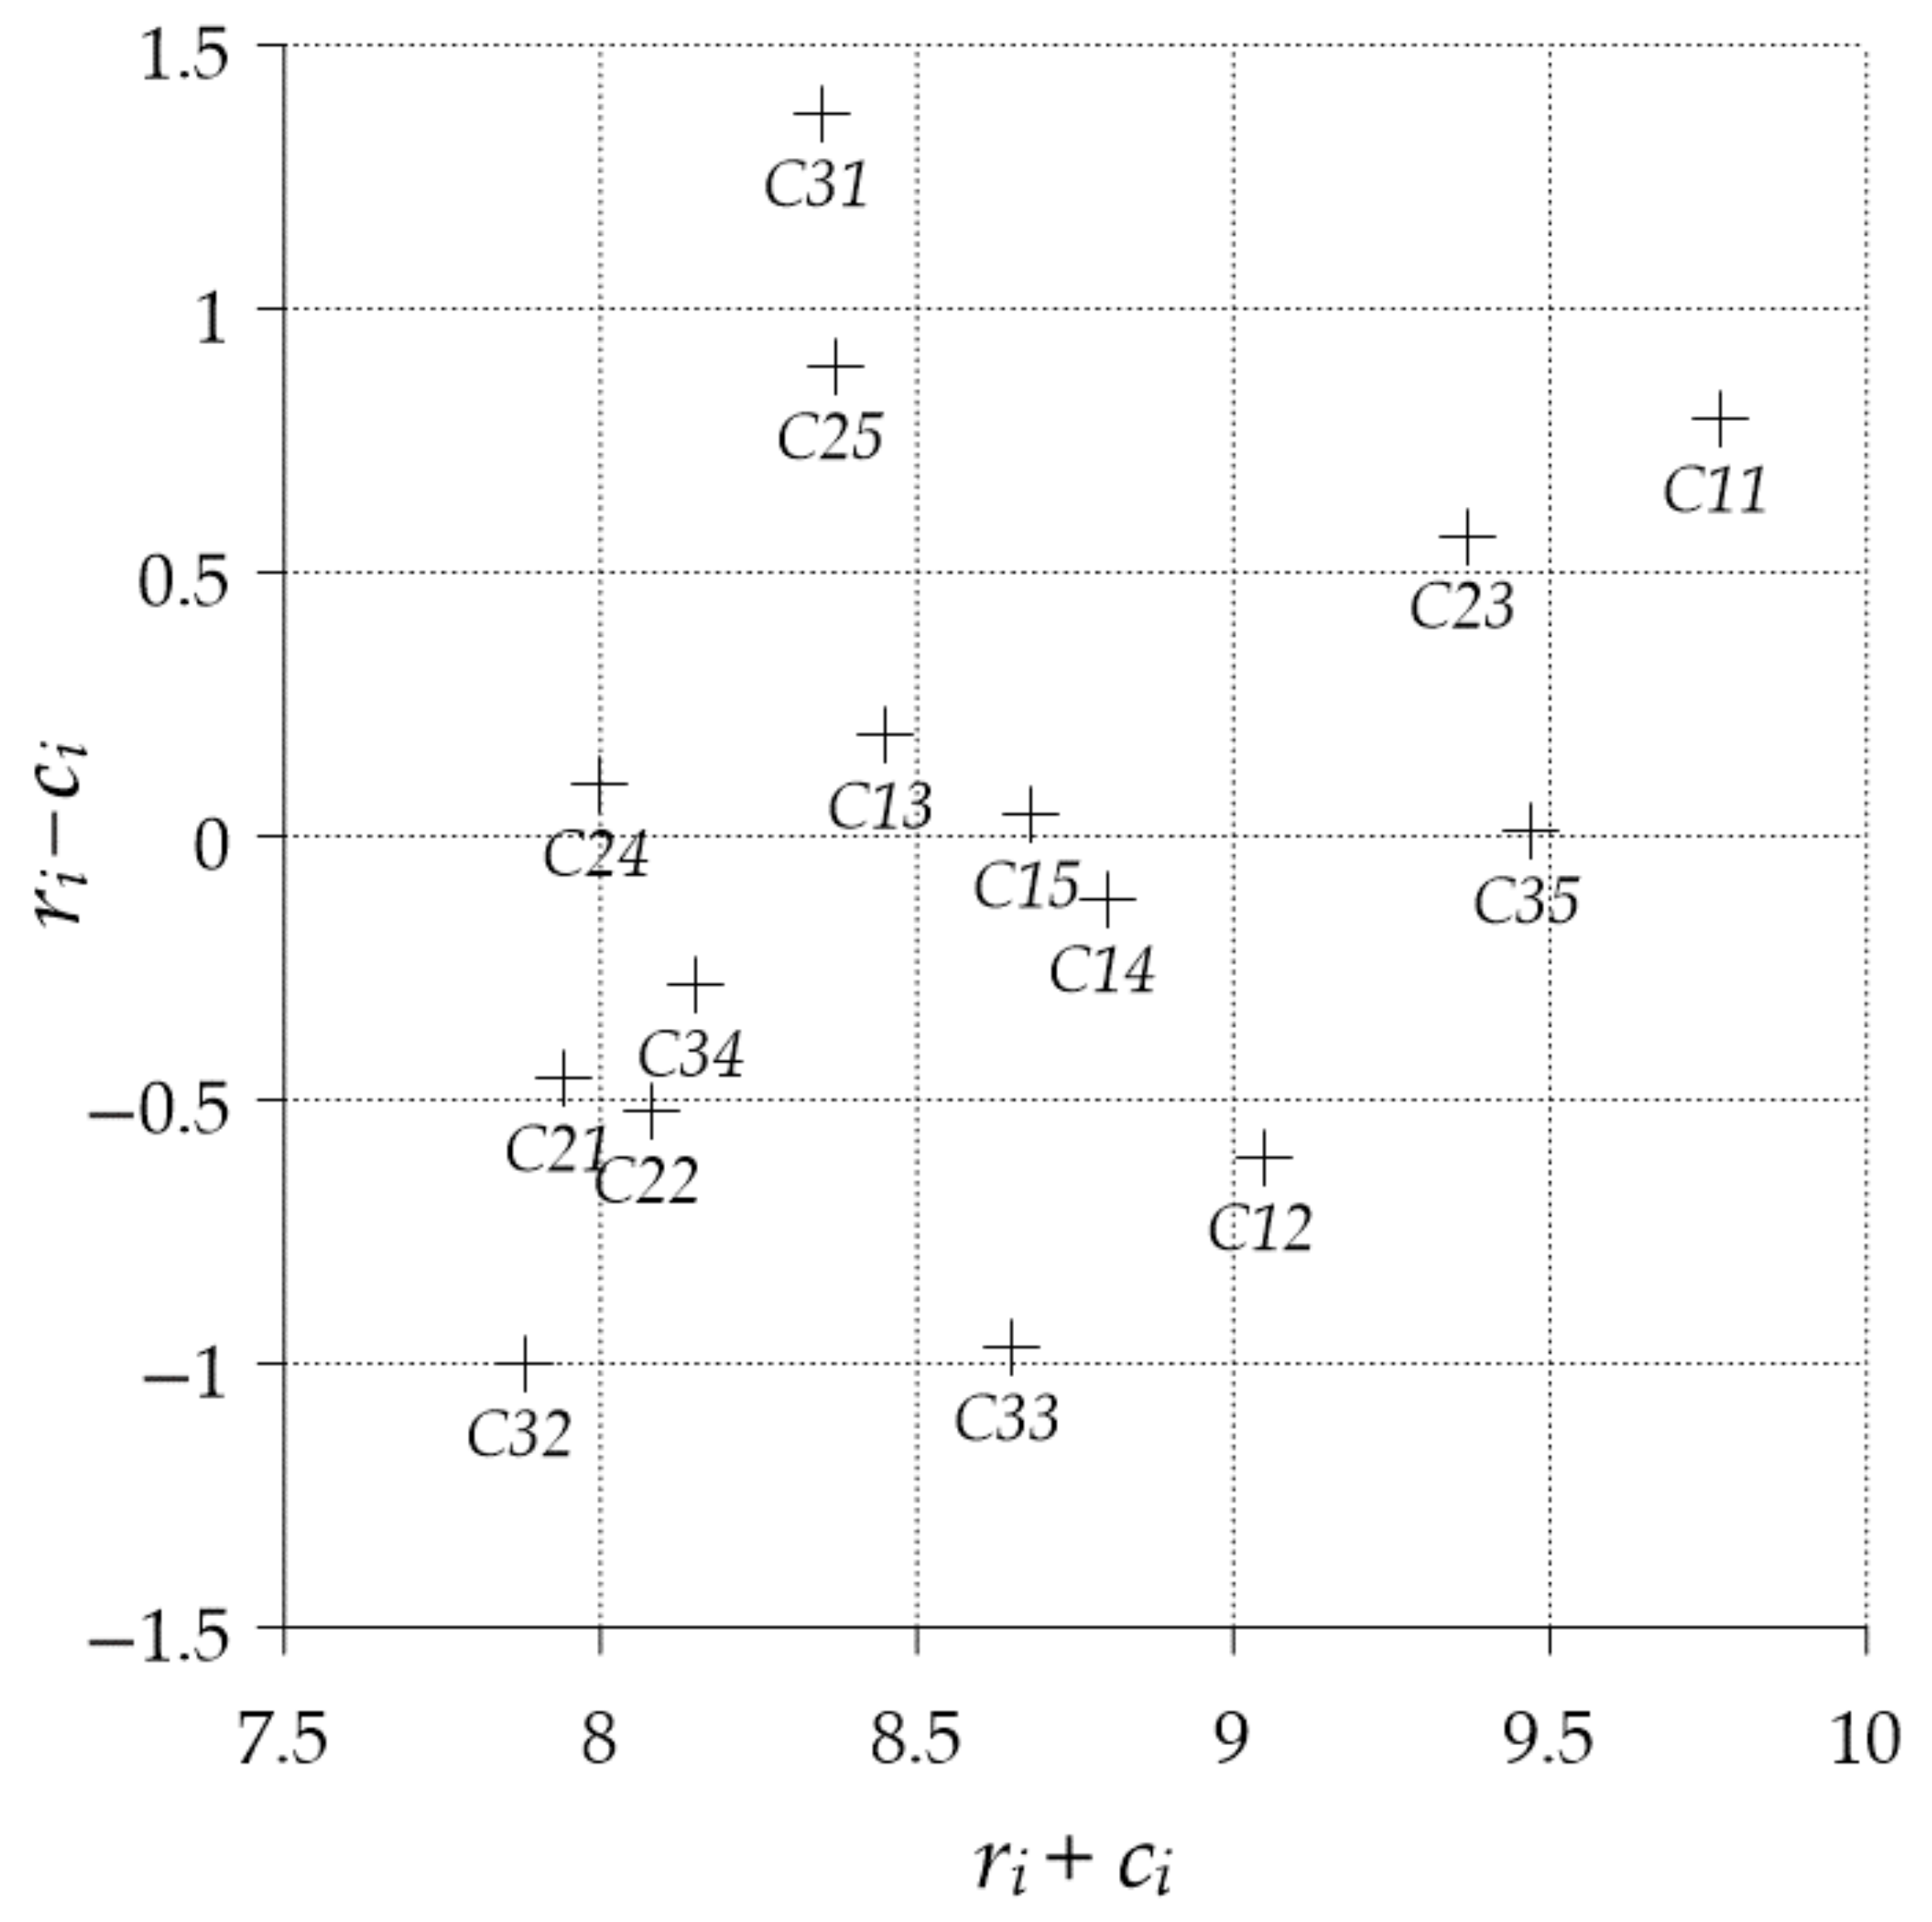
Next, the diagram of
is presented in
Figure 5 for the fifteen criteria. The highest value of the position indicator has the C11 criterion (Standards for Internal Combustion Engine vehicles with access restrictions and phasing out of the market), from the D1 dimension (Electro-mobility). The lowest value of the position factor has the C32 criterion (The post-COVID-19 campaigns for public transport safety), from the D3 dimension (Sustainable collective transport), which is the least significant criterion. When analyzing the relation indicators, it can be stated that the other criteria are most influenced by the C31 (Mobility Platforms as a Service with connectivity between different modes of transport—the rail, shared vehicle, bike) criterion from the D3 dimension. The highest negative value of this parameter for the C32 (The post-COVID-19 campaigns for public transport safety) coefficient, also from the D3 dimension, means that it is the largest recipient of the impact from the remaining criteria.
The following sequence of criteria was obtained: C11 (Standards for Internal Combustion Engine vehicles with access restrictions and phasing out of the market), C35 (Road price list supporting sustainable transport), C23 (Limiting parking spaces and planning the infrastructure layout), C12 (Subsidies for Battery Electric Vehicle and Plug-in Hybrid Electric Vehicle, C14 (Research and development on sustainable transport), C15 (EV charging and hydrogen fuelling infrastructure), and C33 (Fair public transport fares). According to experts, the above criteria with the highest position indicator value should be taken into account in the process of implementing sustainable mobility in metropolitan areas. Experts assess the rest criteria are less important: C13 (Energy-efficiency standards and labels), C25 (Projects to popularize activities towards zero emission, sustainable mobility and mitigating the effects of the COVID-19 crisis), C31 (Mobility Platforms as a Service with connectivity between different modes of transport—the rail, shared vehicle, bike), C34 (Reinvestment of parking fees and tax revenues on non-renewable fuels in sustainable transport), C22 (Intelligent road ICT infrastructure), C24 (Projects to build urban resilience), C21 (Legal regulations reducing the speed of vehicles, privileged vehicles, and traffic hours), and C32 (The post-COVID-19 campaigns for public transport safety). The causal criteria with a positive relationship coefficient are: C31 (Mobility Platforms as a Service with connectivity between different modes of transport—the rail, shared vehicle, bike), C25 (Projects to popularize activities towards zero emission, sustainable mobility and mitigating the effects of the COVID-19 crisis), C11 (Standards for Internal Combustion Engine vehicles with access restrictions and phasing out of the market), C23 (Limiting parking spaces and planning the infrastructure layout), C13 (Energy-efficiency standards and labels), C24 (Projects to build urban resilience), C15 (EV charging and hydrogen fuelling infrastructure), and C35 (Road price list supporting sustainable transport). In turn, the criteria that receive the impact from the others are: C14 (Research and development on sustainable transport), C34 (Reinvestment of parking fees and tax revenues on non-renewable fuels in sustainable transport), C21 (Legal regulations reducing the speed of vehicles, privileged vehicles, and traffic hours), C22 (Intelligent road ICT infrastructure), C12 (Subsidies for Battery Electric Vehicle and Plug-in Hybrid Electric Vehicle), C33 (Fair public transport fares), and C32 (The post-COVID-19 campaigns for public transport safety).
Then, based on (9) and
(from
Table 3), the priority vector
W which represents the final ranking of sustainable mobility criteria is determined, presented in
Table 4.
- Stage 2.
PROMETHEE II method
At the beginning of the PROMETHEE II, experts fill in another questionnaire, using grades 1 to 5. All questionnaires are aggregated and the results are shown in
Table A4 in
Appendix A. The individual items in
Table A4 in
Appendix A indicate to what extent the C11–C35 criteria affect the A1–A3 instruments of sustainable mobility. The greater the value of the criterion, the greater the impact. C12 (Subsidies for Battery Electric Vehicle and Plug-in Hybrid Electric Vehicle) with a value of 4.91 has the biggest impact on A2 (Economic). The next step is to determine the deviation of the analysed measures (10), which are presented in
Table A5 in
Appendix A. Individual items indicate which mobility instrument is more favourable to a given criterion. If an item in the table is positive, it means that the first element in the difference is more preferred than the second one regarding a given parameter. For example, the difference between instruments A1 and A2 is 1.63 for parameter C11. In turn, for C13 this value is 0.64. This means that A1 (Legal) is the most preferred instrument for both criteria. Additionally, C11 (Standards for Internal Combustion Engine) vehicles with access restrictions and phasing out of the market) is the most preferred factor for A1. Then, a preference function, shown in
Table 5, is defined for each criterion.
In the next step, the experts associate the preference functions from
Table 5 for each criterion with the parameter values. The parameter values are associated with the type of criteria. Depending on whether the considered criteria are quantitative or qualitative, the parameter value is determined according to the following rules [
63] for the three types of functions used in the example. For the Type 1 criteria, no parameter value is used. For the Type 2 quasi-criteria, values in the range 0–2 are used. The value of 2 means impartiality regarding the possible use of instruments for this criterion. On the other hand, 0 denotes impartiality regarding the unlikely use of this instrument for a given criterion. For the Type 3 linear distribution criterion, the parameter values in the range 0–2 also apply. The value of 2 means the expected use of a given instrument for a given parameter. Taking the above assumptions into account,
Table A6 in
Appendix A presents the parameter values for individual preference functions determined by a group of experts and related to the deviation of instrument pairs.
Then, the preference functions are aggregated based on Equation (11), using the aggregated rating of the criteria (
Table 4) and the deviations of the instruments in
Table A6 in
Appendix A. The result is presented in
Table A7 in
Appendix A. Then, using the preference functions from
Table A7 in
Appendix A and the Equations (12)–(14), leaving, entering, and final net outranking flow are determined, respectively. The calculation results are presented in
Table 6 as a ranking of the preferred groups of instruments. The higher the net outranking flow value, the greater the weight of the analysed instrument. Finally, a ranking of groups of instruments supporting the deployment of sustainable transport in the order A2 (Economic), A1 (Legal) and A3 (Information) was obtained. The most important among them is the group of A2 (Economic) instruments.
In view of the above ranking, managers of a transport policy in metropolitan areas should take into account that stimulating sustainable transport is a factor that guarantees economic growth, improves the accessibility of transport services to society, integrates many branches of the economy according to the principles of social equality and environmental protection, the improvement of the health of the society and the integration of peri-urban and rural areas.
The three most important criteria related to the A2 (Economic) group occupy the 2nd (C35), 4th (C12), and 5th (C14) positions on the list of the most important criteria in
Table 4. The second most important group of sustainable mobility instruments is A1—the legal group of instruments. Legal regulations in the context of sustainable mobility in metropolitan areas should facilitate the integration of regional centers and eliminate disproportions between them. Out of the second most crucial group A1, the three most important criteria are the 1st (C11), 3rd (C23), and the 14th (C21) in the ranking of the criteria in
Table 4. C11 stands for standards for Internal Combustion Engine vehicles with access restrictions and phasing out of the market, C23 stands for Limiting parking spaces and planning the infrastructure layout, C21 stands for Legal regulations reducing the speed of vehicles, privileged vehicles, and traffic hours.
The least important group of instruments is the Information group (A3). Legal regulations for transport during the recovery from the COVID-19 crisis should facilitate the integration of regional centers and reduce any disproportions between them and indicate how the transport industry should move to sustainable mobility in a new era. Three of the most important criteria related to the A3 group (Information) are the 8th (C13), 9th (C25), and 13th (C24) respectively in the ranking of criteria in
Table 4. C13 means Energy-efficiency standards and labels, C25 is Projects to popularize activities towards zero emission, sustainable mobility and mitigating the effects of the COVID-19 crisis, and C24 is Projects to build urban resilience.
The order of places in the ranking should be respected by decision-makers shaping the directions of the transport policy development. The first step is to define a set of economic incentives for transport companies and users that fully cover sustainable mobility issues. Then, depending on the selected financial solutions, a package of legal regulations must be developed. Next, there must be an information campaign addressed to all the participants of the sustainable mobility process.
6. Conclusions
The COVID-19 pandemic has caused long-term changes in the attitudes of metropolitan residents to public transport. There are indications that citizens’ concerns about their own safety may disrupt the development of sustainable mobility, with the benefit of increased use of private cars. Therefore, it is recommended that city planners take into account these new phenomena and intensify efforts to popularize and introduce incentives to use sustainable measures, such as public transport, electric cars, car sharing, cycling, and pedestrian traffic. In view of such a change in the attitudes of residents, it is necessary to review urban development plans that were created in the period before COVID-19 in order to adjust the assumptions of strategic plans to the real decision-making processes of the choice of means of transport by residents. It is possible to achieve this after examining the preferences of residents and taking the right decisions in the field of metropolitan mobility management. Decision-making by decision makers can be effectively supported by multi-criteria methods.
The scientific goal of the work was achieved by building a mathematical model based on the hybrid DEMATEL-PROMETHEE II method, which was used to build rankings of the assessed planes. The proposed mathematical model takes into account three levels: criteria, dimensions and groups of measures. On the one hand, the criteria are grouped in dimensions, but on the other hand, they are elements of groups of measures, the implementation of which in the right order facilitates the implementation of sustainable mobility in the metropolitan area. Despite the fact that the proposed decision support model includes two multi-criteria methods, each of them is relatively easy to implement, also by city planners and in the business environment. Both groups are looking for solutions that are easy to implement, scalable, flexible and reliable thanks to the included scientific elements. The model also introduces an easy combination of the two, which is achieved through friendly mathematical operations. As a result, the proposed method of analysis using the combined DEMATEL and PROMETHEE II methods is acceptable for city decision-makers, planners, investors, and the sphere of the transport business. The proposed hybrid method of assessing sustainable mobility, based on the Szczecin Metropolitan Area, can also be implemented in other metropolitan areas. The numerical tools proposed in this article allow city decision-makers and planners to properly allocate financial, equipment and human resources so as to avoid making mistakes when implementing the sustainable mobility strategy in metropolitan areas. The presented model was developed for the needs of the Szczecin Metropolitan Area, where the construction of the Szczecin Metropolitan Railway is underway. It is supposed to be the main element of a local sustainable transport system. The construction process is delayed due to the pandemic. Therefore, there is a real possibility of enriching the elements of the local strategic plan with the solutions proposed in the article.
A multi-criteria analysis of groups of measures that, after implementation, support the development of transport tailored to the real needs of residents should form the basis of the decision to adopt strategic plans for investment planning, spatial development, and transport in urban areas. The practical implications of the proposed methodology result from the answers to the research questions posed at the beginning about the most important criteria, dimensions and groups of measures, the introduction of which in the right order will facilitate the introduction of sustainable mobility. Therefore:
the most important criterion is the introduction of restrictions for Internal Combustion Engine vehicles in terms of access to individual areas of the metropolis along with the scheduling of the next stages of withdrawing such vehicles from traffic and the market,
the most important dimension of activities is the introduction of Electro-mobility, to which drivers do not need to be convinced, and for which the obstacle factors are primarily high vehicle prices and the still low development of supporting infrastructure,
the most important group of measures that should be developed in the first place are economic incentives for transport companies and users to introduce and apply sustainable mobility; the packages of legal regulations should be matched to them, and at the end, there should be a broad information campaign addressed to all participants of the sustainable mobility processes.
Scientific gaps in the scope of the research questions posed in the article are indisputable. Basically, there are no articles examining the subject of metropolitan rail in the context of changes in passenger behaviour in the post COVID-19 period. In practice, there are also no scientific articles proposing a three-dimensional model of factors facilitating the implementation of sustainable mobility in the metropolitan area. The article fills this gap, and its main contribution to the literature is to propose a set of parameters, dimensions and groups of measures helpful in the implementation of sustainable transport in the Szczecin Metropolitan Area in the post-COVID-19 era, along with a ranking of these elements obtained using the hybrid multi-criteria method.
The main limitation of the method is the stage of individual evaluation of parameters by a team of experts at the beginning of both the DEMATEL and PROMETHEE II methods. These assessments may be tainted by the subjective approach to the issue or the lack of competence in the selected field. Modification of the scheme in the direction of independence from the risk of objectivity of assessment, the use of other MADM methods and sensitivity analysis are within the scope of further research and development of the proposed model.


