
Simulating the Impacts of Hybrid Campus and Autonomous Electric Vehicles as GHG Mitigation Strategies: A Case Study for a Mid-Size Canadian Post-Secondary School


Abstract
:1. Introduction
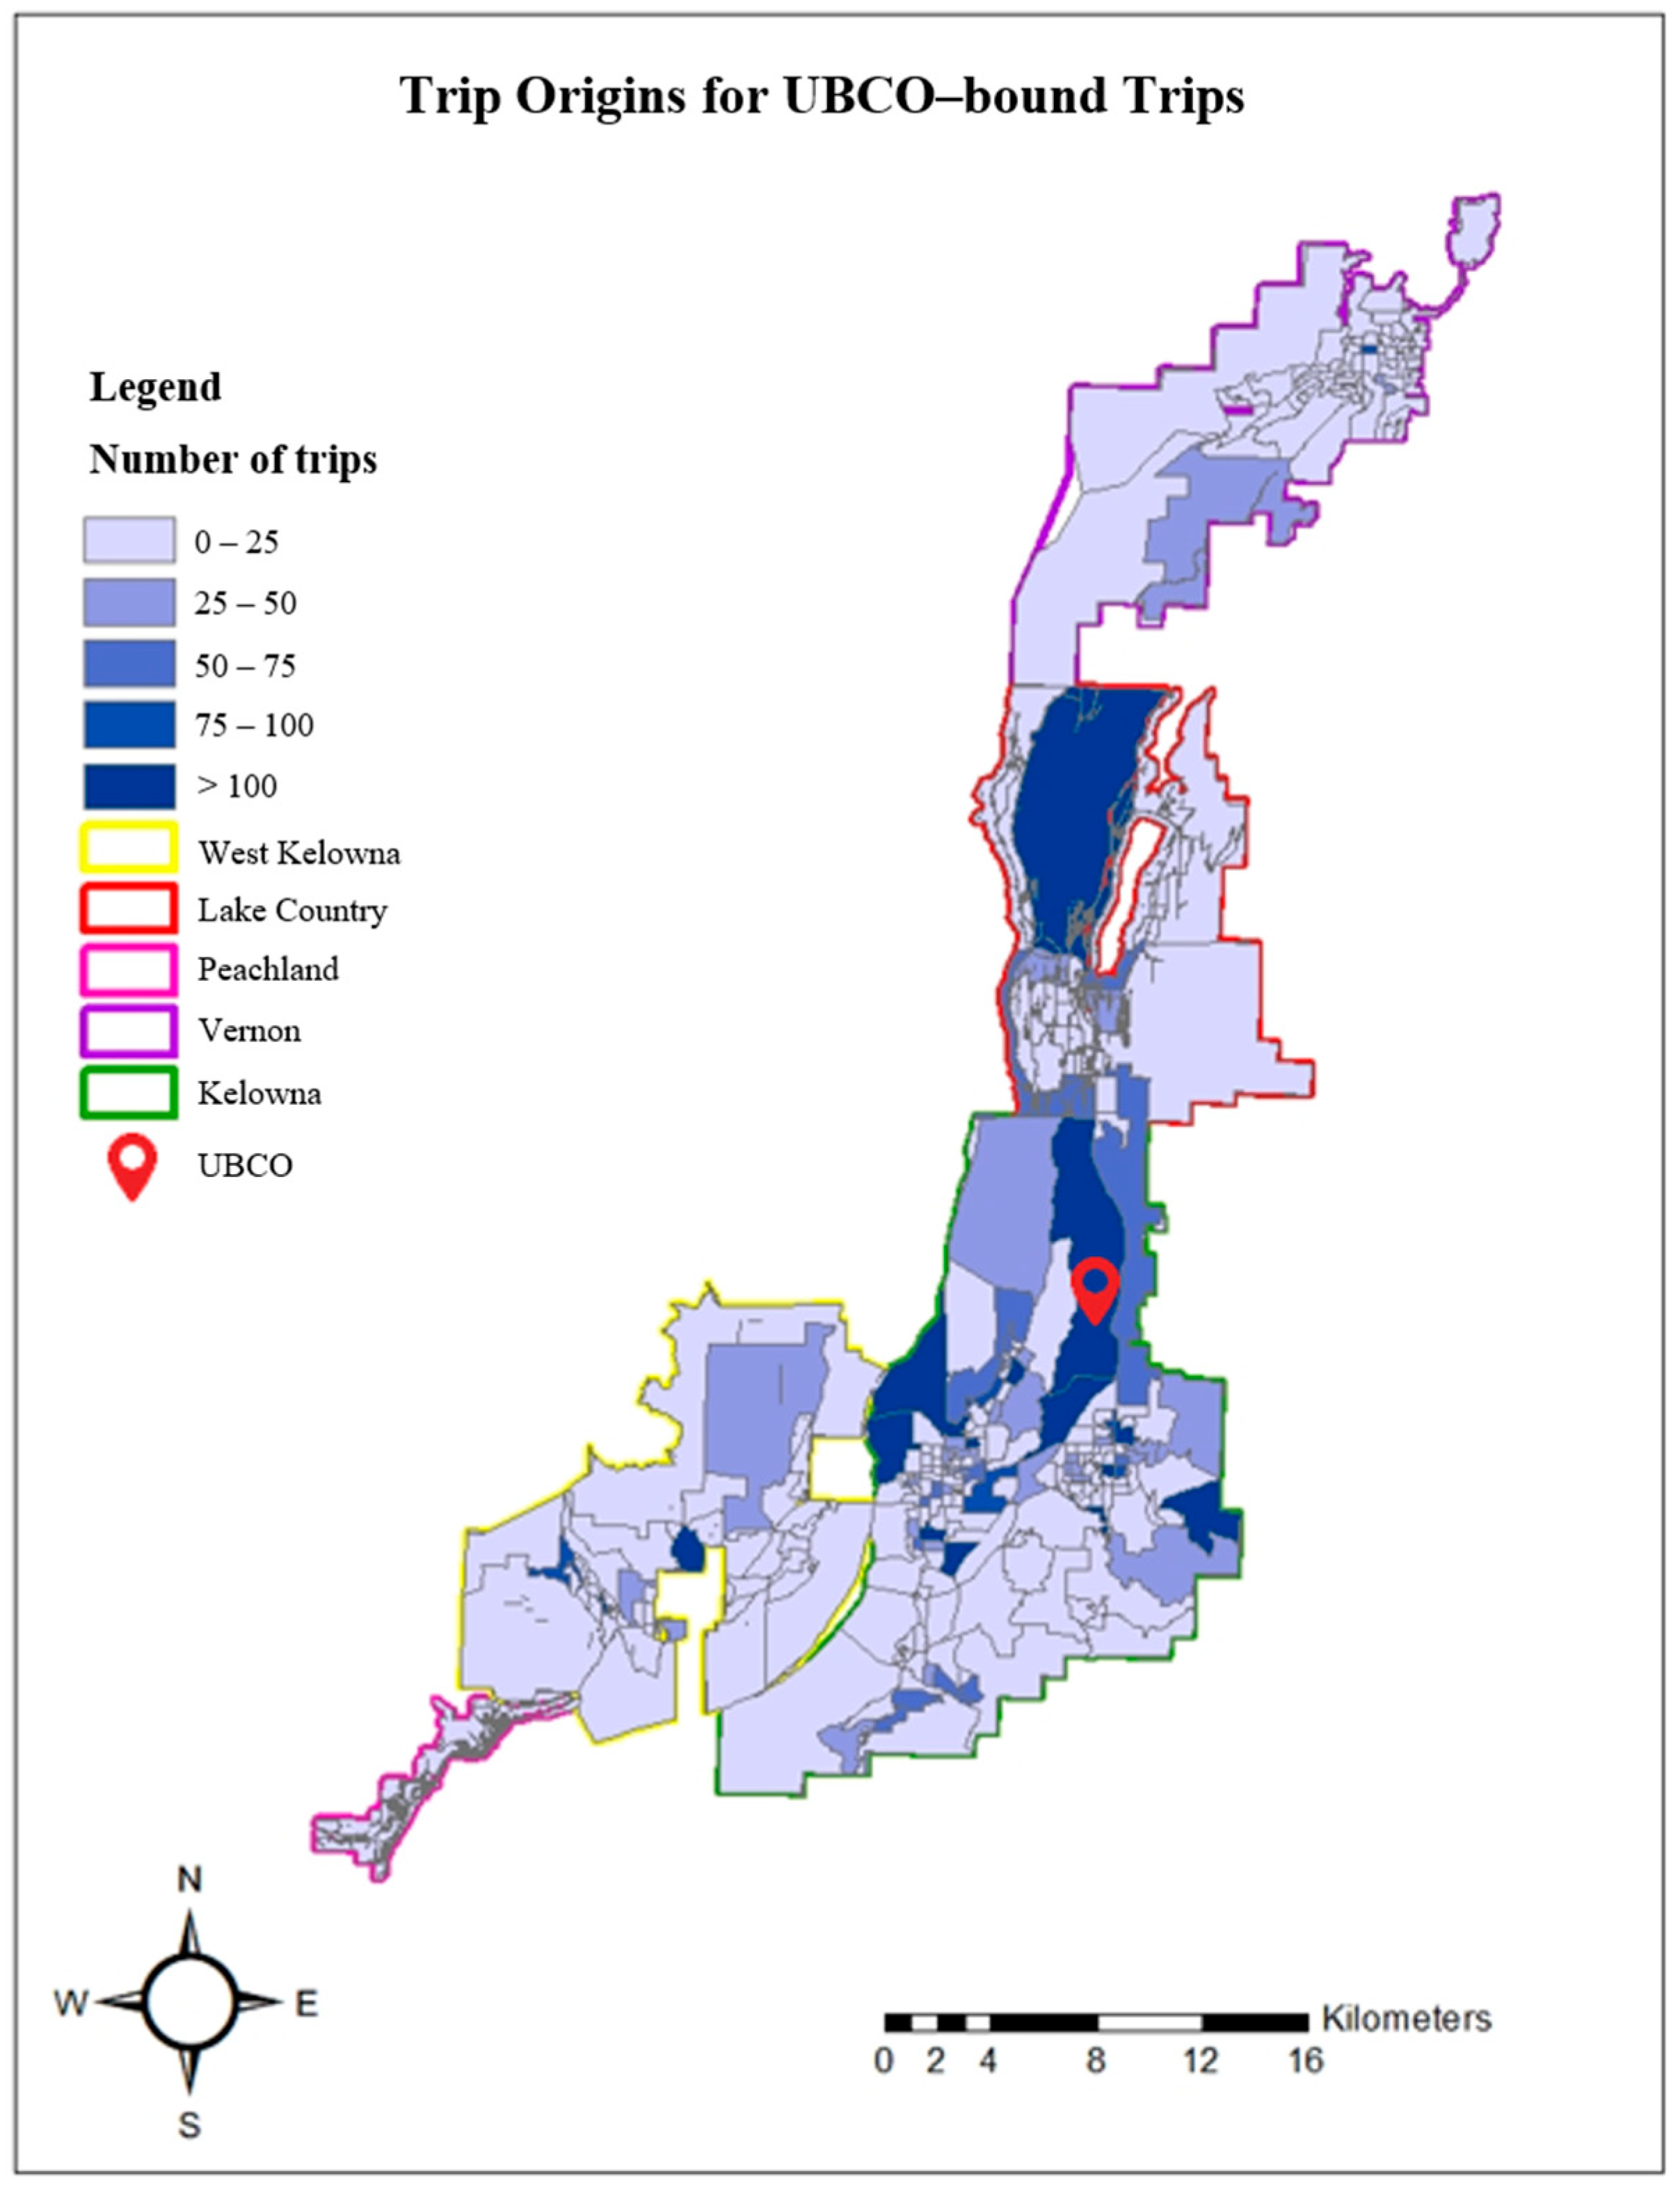
2. Study Area
3. Data
4. Model Development
4.1. Trip Generation and Distribution
4.2. Modal Split
4.3. Trip Assignment
4.4. Calibration and Validation of Model
4.5. Scenario Development
5. Results and Discussions
5.1. Model Choice Model Results
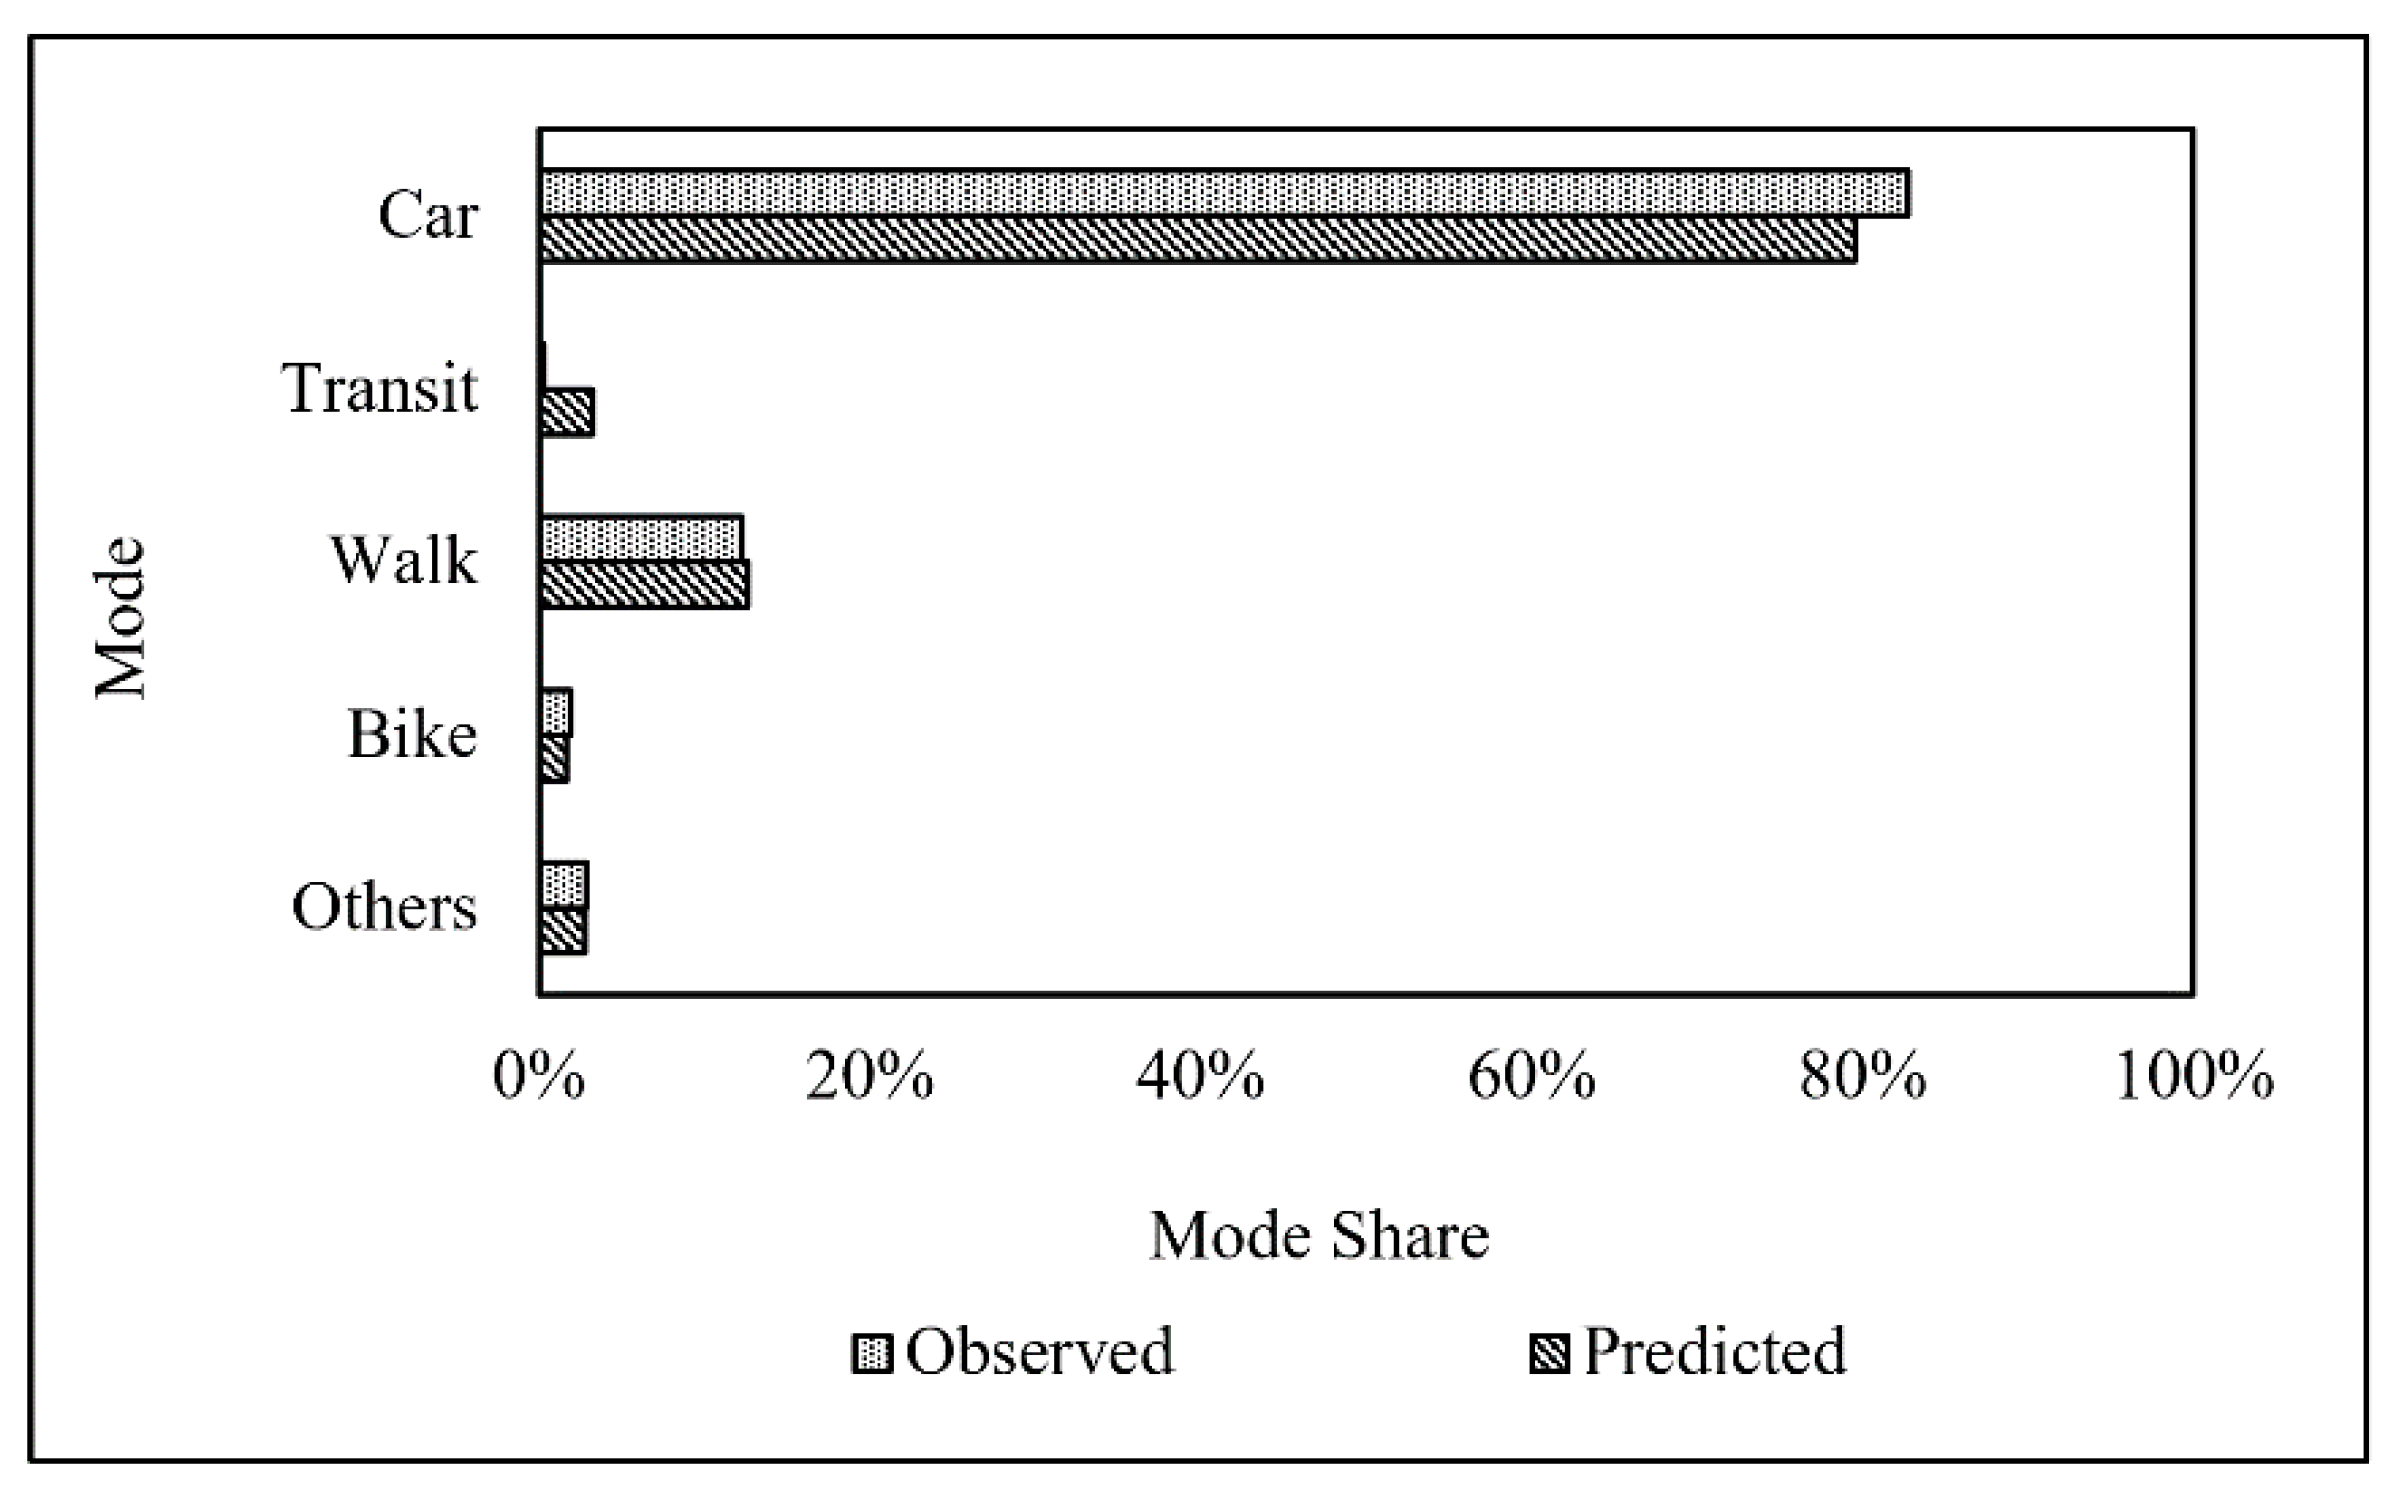
5.2. Mode Choice Validation Results
5.3. Traffic Volume Validation Results
5.4. Discussions on the Simulation Results to Achieve GHG Mitigation Targets
6. Conclusions
Author Contributions
Funding
Institutional Review Board Statement
Informed Consent Statement
Data Availability Statement
Acknowledgments
Conflicts of Interest
References
- Fast Facts: U.S. Transportation Sector Greenhouse Gas Emissions 1990–2019. Available online: https://www.epa.gov/greenvehicles/fast-facts-transportation-greenhouse-gas-emissions (accessed on 19 October 2021).
- Perveen, S.; Yigitcanlar, T.; Kamruzzaman, M.; Agdas, D. How Can Transport Impacts of Urban Growth Be Modelled? An Approach to Consider Spatial and Temporal Scales. Sustain. Cities Soc. 2020, 55, 102031. [Google Scholar] [CrossRef]
- Healthy Environment and a Healthy Economy: Canada’s Strengthened Climate Plan to Create Jobs and Support People, Communities and the Planet. Available online: https://www.canada.ca/content/dam/eccc/documents/pdf/climate-change/climate-plan/healthy_environment_healthy_economy_plan.pdf (accessed on 19 October 2021).
- Government of British Columbia. CleanBC. Available online: https://www2.gov.bc.ca/gov/content/environment/climate-change/planning-and-action (accessed on 19 October 2021).
- Pérez-Neira, D.; Rodríguez-Fernández, M.P.; Hidalgo-González, C. The Greenhouse Gas Mitigation Potential of University Commuting: A Case Study of the University of León (Spain). J. Transp. Geogr. 2020, 82, 102550. [Google Scholar] [CrossRef]
- Climate Action Plan 2030: Emerging Directions and Draft Targets for UBC Vancouver and Okanagan Campuses. Available online: https://bog3.sites.olt.ubc.ca/files/2021/01/6_2021.02_Climate-Action-Plan-2030.pdf (accessed on 19 October 2021).
- UBC Okanagan Transportation Plan—Phase 1: Public Consultation Summary Report. Available online: https://campusplanning.ok.ubc.ca/projects/ubc-okanagan-transportation-plan/ (accessed on 19 October 2021).
- Valtonen, T.; Leppänen, U.; Hyypiä, M.; Kokko, A.; Manninen, J.; Vartiainen, H.; Sointu, E.; Hirsto, L. Learning Environments Preferred by University Students: A Shift toward Informal and Flexible Learning Environments. Learn. Environ. Res. 2020, 24, 371–388. [Google Scholar] [CrossRef]
- Pata, U.K. How Is COVID-19 Affecting Environmental Pollution in US Cities? Evidence from Asymmetric Fourier Causality Test. Air Qual. Atmos. Health 2020, 13, 1149–1155. [Google Scholar] [CrossRef] [PubMed]
- Eregowda, T.; Chatterjee, P.; Pawar, D.S. Impact of Lockdown Associated with COVID19 on Air Quality and Emissions from Transportation Sector: Case Study in Selected Indian Metropolitan Cities. Environ. Syst. Decis. 2021, 41, 401–412. [Google Scholar] [CrossRef] [PubMed]
- Han, P.; Cai, Q.; Oda, T.; Zeng, N.; Shan, Y.; Lin, X.; Liu, D. Assessing the Recent Impact of COVID-19 on Carbon Emissions from China Using Domestic Economic Data. Sci. Total Environ. 2021, 750, 141688. [Google Scholar] [CrossRef] [PubMed]
- Zhang, R.; Zhang, J. Long-Term Pathways to Deep Decarbonization of the Transport Sector in the Post-COVID World. Transp. Policy 2021, 110, 28–36. [Google Scholar] [CrossRef] [PubMed]
- Fernandes, P.; Bandeira, J.M.; Coelho, M.C.; Fernandes, P.; Bandeira, J.M.; Coelho, M.C. A Macroscopic Approach for Assessing the Environmental Performance of Shared, Automated, Electric Mobility in an Intercity Corridor. J. Intell. Transp. Syst. 2021, 1–17. [Google Scholar] [CrossRef]
- Patella, S.M.; Scrucca, F.; Asdrubali, F.; Carrese, S. Carbon Footprint of Autonomous Vehicles at the Urban Mobility System Level: A Traffic Simulation-Based Approach. Transp. Transp. Res. Part D Transp. Environ. 2019, 74, 189–200. [Google Scholar] [CrossRef]
- Pourrahmani, E.; Jaller, M.; Maizlish, N.; Rodier, C. Health Impact Assessment of Connected and Autonomous Vehicles in San Francisco, Bay Area. Transp. Res. Rec. 2020, 2674, 898–916. [Google Scholar] [CrossRef]
- Le Hong, Z.; Zimmerman, N. Air Quality and Greenhouse Gas Implications of Autonomous Vehicles in Vancouver, Canada. Transp. Res. Part D Transp. Environ. 2021, 90, 102676. [Google Scholar] [CrossRef]
- Logan, K.G.; Nelson, J.D.; Osbeck, C.; Chapman, J.D.; Hastings, A. The Application of Travel Demand Management Initiatives within a University Setting. Case Stud. Transp. Policy 2020, 8, 1426–1439. [Google Scholar] [CrossRef]
- Filimonau, V.; Archer, D.; Bellamy, L.; Smith, N.; Wintrip, R. The Carbon Footprint of a UK University during the COVID-19 Lockdown. Sci. Total Environ. 2021, 756, 143964. [Google Scholar] [CrossRef] [PubMed]
- UBC Okanagan 2013 Annual Report on Enrolment: Okanagan Campus. Available online: https://senate.ubc.ca/files/downloads/ok_enrolment_report_2013_2014.pdf (accessed on 19 October 2021).
- The University of British Columbia 2018/19 Annual Enrolment Report. Available online: https://academic.ubc.ca/academic-community/news-announcements/news/read-201819-annual-report-enrolment (accessed on 19 October 2021).
- UBC Okanagan Outlook 2040. Available online: https://okmain.cms.ok.ubc.ca/wp-content/uploads/sites/26/2019/02/UBCO-Outlook-2040.pdf (accessed on 19 October 2021).
- Chalaki, B.; Beaver, L.E.; Remer, B.; Jang, K.; Vinitsky, E.; Bayen, A.M.; Malikopoulos, A.A. Zero-Shot Autonomous Vehicle Policy Transfer: From Simulation to Real-World via Adversarial Learning. In Proceedings of the 2020 IEEE 16th International Conference on Control & Automation (ICCA), Singapore, 9–11 October 2020; pp. 35–40. [Google Scholar] [CrossRef]
- PTV AG. PTV Visum 2021 Manual; PTV AG: Karlsruhe, Germany, 2021. [Google Scholar]
- Lee, D.; Derrible, S.; Pereira, F.C. Comparison of Four Types of Artificial Neural Network and a Multinomial Logit Model for Travel Mode Choice Modeling. Transp. Res. Rec. 2018, 2672, 101–112. [Google Scholar] [CrossRef] [Green Version]
- Wardrop, J.G. Some theoretical aspects of road traffic research. Proc. Inst. Civ. Eng. 1952, 1, 325–362. [Google Scholar] [CrossRef]
- Schneck, A.; Nökel, K. Accelerating Traffic Assignment with Customizable Contraction Hierarchies. Transp. Res. Rec. 2020, 2674, 188–196. [Google Scholar] [CrossRef]
- Van Zuylen, H.J.; Willumsen, L.G. The Most Likely Trip Matrix Estimated from Traffic Counts. Transp. Res. Part B Methodol. 1980, 14, 281–293. [Google Scholar] [CrossRef]
- Li, X.; Lopes, D.; Mok, K.M.; Miranda, A.I.; Yuen, K.V.; Hoi, K.I. Development of a Road Traffic Emission Inventory with High Spatial–Temporal Resolution in the World’s Most Densely Populated Region—Macau. Environ. Monit. Assess. 2019, 191, 239. [Google Scholar] [CrossRef]
- SAE International Taxonomy and Definitions for Terms Related to Driving Automation Systems for On-Road Motor Vehicles. Available online: https://www.sae.org/standards/content/j3016_202104/ (accessed on 19 October 2021).
- Alsalman, A.; Assi, L.N.; Ghotbi, S.; Ghahari, S.; Shubbar, A. Users, Planners, and Governments Perspectives: A Public Survey on Autonomous Vehicles Future Advancements. J. Transp. Eng. 2021, 3, 100044. [Google Scholar] [CrossRef]
- Lim, T.S. A Study of the Scheduling Effect on Shared Autonomous Vehicles Adoption. Transp. Res. Interdiscip. Perspect. 2021, 10, 100394. [Google Scholar] [CrossRef]
- Madadi, B.; van Nes, R.; Snelder, M.; van Arem, B. Assessing the Travel Impacts of Subnetworks for Automated Driving: An Exploratory Study. Case Stud. Transp. Policy 2019, 7, 48–56. [Google Scholar] [CrossRef]
- Environmental Projection Agency Emission Factor for Greenhouse Gas Inventories. Available online: https://www.epa.gov/sites/default/files/2018-03/documents/emission-factors_mar_2018_0.pdf (accessed on 19 October 2021).
- El Hamra, W.; Attallah, Y. The Role of Vehicles’ Identification Techniques in Transportation Planning—Modeling Concept. Alex. Eng. J. 2011, 50, 391–398. [Google Scholar] [CrossRef] [Green Version]
- Tomás, R.F.; Fernandes, P.; MacEdo, E.; Bandeira, J.M.; Coelho, M.C. Assessing the Emission Impacts of Autonomous Vehicles on Metropolitan Freeways. Transp. Res. Procedia 2020, 47, 617–624. [Google Scholar] [CrossRef]
- Guerin, T.F. Policies to minimise environmental and rebound effects from telework: A study for Australia. Environ. Innov. Soc. Transit. 2021, 39, 18–33. [Google Scholar] [CrossRef]
- Khalil, M.A.; Fatmi, M. Developing an Agent-based Model to Simulate Residential Energy Consumptions: Assessing the Impacts of the COVID-19 Pandemic. Transp. Res. Board 2021, 1–23. [Google Scholar]

| Alternative Travel Mode | Variables | Co-Efficient Value |
|---|---|---|
| Car | Constant | 3.92 *** |
| Travel Time (mins) | −0.00665 *** | |
| Low-income Households (below $20,000) in DA | −0.00213 *** | |
| Transit | Constant | −0.512 *** |
| Low-income Households (below $20,000) in DA | 0.0123 *** | |
| Population Density in DA | 0.00012 *** | |
| Walk | Constant | 1.32 *** |
| Travel Time (mins) | −0.0279 *** | |
| Population Density in DA | 0.000215 *** | |
| Bike | Constant | −0.606 *** |
| Population Density in DA | 0.000211 *** | |
| Travel Time (mins) | −0.00630 *** | |
| Number of Education Centre in DA | 0.0257 *** | |
| Others | Travel Time (mins) | −0.000850 *** |
| Low-income Households (below $20,000) in DA | −0.0143 *** | |
| Number of Children in DA | 0.00237 *** |
| % of Students Attending Online Class | % GHG Emission Reduction | % of Faculties/Staffs Working-From-Home | % GHG Emission Reduction | Achievable Targets | % of Students and Faculties/Staffs Learning/Working Remotely | % GHG Emission Reduction | Achievable Targets | |||||
|---|---|---|---|---|---|---|---|---|---|---|---|---|
| (a) | (a) | (b) | (b) | (b) | (c) | (c) | (c) | |||||
| 10% | 2.3% | 10% | 4.4% | 10% | 7.2% | |||||||
| 20% | 4.5% | 20% | 13.8% | 20% | 19.4% | |||||||
| 30% | 7.6% | 30% | 20.4% | 30% | 24.7% | |||||||
| 40% | 8.7% | 40% | 25.6% | 40% | 35.3% | |||||||
| 50% | 11.1% | 50% | 33.3% | 50% | 43.3% | |||||||
| 60% | 12.9% | 60% | 38.3% | 60% | 53.7% | |||||||
| 70% | 17.3% | 70% | 44.3% | 70% | 58.8% | |||||||
| 80% | 19.3% | 80% | 52.6% | 80% | 65.2% | |||||||
| 90% | 22.1% | 90% | 61.1% | 90% | 71.8% | |||||||
| 100% | 23.6% | 100% | 69.8% | 100% | 76.4% | |||||||
| Penetration Rates | AEV Level 2 (PCU = 1.4) | AEV Level 5 (PCU = 0.7) | ||||||||||||
|---|---|---|---|---|---|---|---|---|---|---|---|---|---|---|
| (a) | (b) | (a) | (b) | |||||||||||
| % GHG Reduction | Achievable Targets | % GHG Reduction | Achievable Targets | % GHG Reduction | Achievable Targets | % GHG Reduction | Achievable Targets | |||||||
| 10% | 3.0% | 13.5% | 7.5% | 14.9% | ||||||||||
| 20% | 15.8% | 21.4% | 14.4% | 23.8% | ||||||||||
| 30% | 27.6% | 31.4% | 23.9% | 34.1% | ||||||||||
| 40% | 35.7% | 39.8% | 34.6% | 41.6% | ||||||||||
| 50% | 44.6% | 48.4% | 44.4% | 48.3% | ||||||||||
Publisher’s Note: MDPI stays neutral with regard to jurisdictional claims in published maps and institutional affiliations. |
© 2021 by the authors. Licensee MDPI, Basel, Switzerland. This article is an open access article distributed under the terms and conditions of the Creative Commons Attribution (CC BY) license (https://creativecommons.org/licenses/by/4.0/).
Share and Cite
Saha, B.; Fatmi, M.R. Simulating the Impacts of Hybrid Campus and Autonomous Electric Vehicles as GHG Mitigation Strategies: A Case Study for a Mid-Size Canadian Post-Secondary School. Sustainability 2021, 13, 12501. https://doi.org/10.3390/su132212501
Saha B, Fatmi MR. Simulating the Impacts of Hybrid Campus and Autonomous Electric Vehicles as GHG Mitigation Strategies: A Case Study for a Mid-Size Canadian Post-Secondary School. Sustainability. 2021; 13(22):12501. https://doi.org/10.3390/su132212501
Chicago/Turabian StyleSaha, Bijoy, and Mahmudur Rahman Fatmi. 2021. "Simulating the Impacts of Hybrid Campus and Autonomous Electric Vehicles as GHG Mitigation Strategies: A Case Study for a Mid-Size Canadian Post-Secondary School" Sustainability 13, no. 22: 12501. https://doi.org/10.3390/su132212501
APA StyleSaha, B., & Fatmi, M. R. (2021). Simulating the Impacts of Hybrid Campus and Autonomous Electric Vehicles as GHG Mitigation Strategies: A Case Study for a Mid-Size Canadian Post-Secondary School. Sustainability, 13(22), 12501. https://doi.org/10.3390/su132212501