Abstract
In the face of growing concerns about urban problems, smart cities have emerged as a promising solution to address the challenges, for future sustainable societies in cities. Since the early 2000s, 67 local governments in Korea have been participating in smart city projects, as of 2019. The Sejong 5-1 Living Area smart city was selected as one of two pilot national demonstration smart cities. The main objectives of this study are to introduce the Sejong 5-1 Living Area smart city project that is currently in the planning stage, present travel and mode preferences focusing on external trips in a smart city context to be built, and analyze a mode choice model according to the socioeconomic characteristics of individual travelers. One of the distinguishing features of the Sejong smart city is its transportation design concept of designating a sharing car-only district within the city to limit private vehicle ownership to about one-third of residents, while bus rapid transit (BRT) plays a central role in mobility for external trips among four transport modes including private cars, BRT, carsharing, and ridesharing. This study was analyzed using the stated preference survey data under hypothetical conditions by reflecting the unique characteristics of the Sejong smart city transportation policy. Approximately two-thirds of respondents in the survey preferred to spend less than 1.25 USD, traveling less than 35 min on BRT trips. On the basis of the survey data, we developed a mixed logit mode choice model and found the overall model estimates to be statistically significant and reasonable. All people-specific variables examined in this study were associated with mode choices for external commuting trips, including age, income, household size, major mode, driving ability, and presence of preschoolers.
1. Introduction
The current city—experiencing rapid population growth and urban concentration—faces other complex challenges, such as uncontrolled urban sprawl, traffic congestion, environmental pollution, an aging population, and a lack of urban services [1,2,3]. Accordingly, cities around the world have focused on the concept of smart cities as an alternative to solving complicated urban problems and urban development [4,5]. However, the concept of a smart city—which has been in use since the late 1990s—has not yet been clearly defined [4,6]. Countries and cities around the world implement the concept differently, with there being no uniform or widely accepted smart city definition [2,7]. Although concepts and development goals for smart cities are being applied in various ways, depending on each country’s environment and recognition of its urban challenges, smart cities can be categorized into two types; one type highlights the use of information communication technology (ICT) and modern technologies as a key to successful smart cities, while the other focuses on the role of human capital in improving economic, social, and environmental sustainability in addition to new technologies [6]. Whatever the case, all cities advocating for a smart city have a common objective—that is, to solve urban problems and improve the quality of life of citizens [7]. Consequently, a smart city is an umbrella concept that combines a number of ideas, including a smart economy, smart environment, smart governance, smart living, smart infrastructure, smart mobility, smart technology, smart health, and smart people [7,8,9,10,11,12].
Many countries and cities around the world have been implementing smart city initiatives, policies, plans, and projects. For example, following the Smart London Plan in 2013 (updated in 2016), the city of London launched ‘Smarter London Together’ in 2018 to better integrate data and digital technologies and to build London to be the smartest city in the world [13]. San Francisco is considered to be one of the most successful examples of smart cities in the United States, with the city adopting innovative technologies for smart transportation, smart energy, smart waste management, and smart communities [14]. The city of Barcelona, Spain, integrated ICT to improve the accessibility, transparency, and efficacy of its services. Barcelona’s Smart City initiative—in particular its 22@Barcelona district project in support of various initiatives—has been an effective smart city strategy [14,15]. Singapore established a Smart City initiative in 2014 to cope with the growing urban problems of an aging population, urban density, and energy sustainability. The smart nation program of Singapore incorporates ICT, networks, and data [16].
In Korea, a smart city is defined as “a platform to improve the quality of life for citizens, enhance the sustainability of cities, and foster new industries by utilizing innovative technologies of the Fourth Industrial Revolution era [5].” The Korean government’s smart city initiative—which started in the early 2000s—has progressed in three major stages: (1) the construction stage (from 2003–2013), which created new growth engines by combining ICT with the construction industry, (2) the connecting stage (2014–2016), which focused on connecting smart city services and building a governance structure; and (3) the enhancement stage (2017–2020), which emphasized innovative smart cities and the creation of a smart city ecology [4]. The Korean smart city initiative includes four core features: (1) research and development, (2) the smart solution challenge (where private companies can receive up to 20 million USD over 3 years to develop smart city projects), (3) deregulation, and (4) a national pilot program for smart cities [4]. As of 2019, a total of 67 local governments in Korea had participated in smart city government support projects [5]. In particular, two cities, Sejong and Busan, were selected to be smart city national demonstration cities by the Presidential Committee on the Fourth Industrial Revolution in 2018 [17]. The Korean government supports the national pilot cities, aiming to create world-leading smart cities based on various pioneering technologies by designing urban infrastructure—such as mobility and energy—to improve citizens’ quality of life by exploiting the advantages of greenfield land [17].
The Sejong 5-1 Living Area was selected to be one of the pilot cities as a model of Korea’s future smart cities. The city was planned to lead national balanced development benchmarks for national competitiveness and to create a sustainable model city for future generations [17]. It was designed to be created from greenfield land and to implement the technologies and services of the Fourth Industrial Revolution. The most notable feature related to transportation in Sejong is that urban and transportation planning pursues the development of a pedestrian-oriented city moving away from a vehicle-oriented policy. A ‘sharing car-only district’ will be designated inside the city, while offering various alternative transport modes such as personal mobility (PM) (i.e., electric kickboard) and shared mobility. The Sejong smart city will be designed to promote mobility as a service (MaaS) by developing a platform that facilitates transfers between transportation modes, with bus rapid transit (BRT) playing a central role in mobility for external trips [5].
Many cities are interested in introducing a BRT system as a sustainable transportation mode for urban mobility because of its advantages, including its low cost, operating flexibility, rapid implementation, high performance, and environmental benefits [18,19]. Before introducing a new transport mode, however, it was necessary to establish a transportation plan and economic analysis, with the travel demand forecasting model being a useful tool for accessing transportation projects and policies [20]. Mode choice analysis is one of the most important stages in the traditional four-step travel demand model, having an impact, as it does, on various transportation policies [21,22,23], being the process of estimating the number of trips for each available mode of transport. To quantify this, it is necessary to understand travelers’ mode choice behaviors, obtained through surveys.
The objectives of this study are to introduce the Sejong 5-1 Living Area smart city in Korea to be newly built in the future, to present the travel and mode preferences regarding smart cities, and to model travel mode choice behaviors, focusing on external commuting trips between the Sejong 5-1 Living Area and areas outside of the city. Specifically, we aim to answer the following questions: (1) How important are BRT, ridesharing, and carsharing modes for external commuting trips in smart cities, while accessibility by private cars is limited due to the smart city transportation policies? (2) How are individuals’ socio-demographic characteristics reflected in their travel mode choices? To answer these questions, we used stated preference (SP) survey data as a smart city case study of the Sejong 5-1 Living Area. The survey was conducted to identify user demands and mobility preferences under the hypothetical conditions in a future smart city with the unique characteristics of the transportation policy. In addition to sociodemographic characteristics and general travel behaviors, important travel preferences for external trips connecting to/from the smart city were obtained. Using the data, we developed a mixed logit (ML) model and discussed the results.
The remainder of this paper is organized as follows: Section 2 reviews the literature on mode choice modeling applied to various transportation applications. Section 3 describes the concept of the Sejong 5-1 Living Area smart city and presents the survey methods and an overview of the survey results. Section 4 presents the development and results of mode choice modeling for external trips in smart cities, including BRT. Lastly, Section 5 summarizes the findings and provides insights for future mode choice modeling for smart cities.
2. Literature Review
2.1. Mode Choice Model in General
Several different disaggregate model methodologies have been proposed to date, but logit-based travel mode choice modeling remains the most popular and widely used model because of its simple mathematical and closed form, ease of estimation and interpretation, and the ability to add or remove choice alternatives [24,25,26]. The logit model is a type of econometric model based on the random utility maximization theory [27,28,29]. The multinomial logit (MNL) model is one of the most widely applied logit-based models, assuming that the error terms are independent—that is, independent of irrelevant alternatives, IIA—and follow Weibull distribution. While the MNL model has the advantage of its simple procedure in model estimation, it has been frequently challenged for the IIA assumption and the inability to account for taste variations among different individuals [30,31]. To reflect individuals’ preference heterogeneity, ML and latent class (LC) models have been proposed. The ML model avoids the IIA problem of MNL and allows its parameters associated with the observed variable to vary with a known population distribution across individuals [31,32,33,34]. Alternatively, the LC model has an advantage of a quasi-parametric structure that does not require any prior assumptions about the parametric distribution [31,32]. More recently, additional types of modeling—other than the discrete choice model—have been proposed, such as machine learning algorithms [35,36] and artificial neural networks [37].
Previous studies have shown that variables including travel cost and time, trip distance, and waiting time were statistically significant for mode choice. Al-Salih and Esztergar-Kiss [29] developed MNL and nested logit (NL) models and found that the trip distance variable had the most significant effect on mode choice, followed by travel time and activity purpose variables. Liu et al. [26] investigated travel mode choice behaviors for short-, middle-, and long-distance travel. The NL model showed that cost and waiting time were the most significant factors for short-distance travel, while transfer walking time was the most significant factor for middle- and long-distance travel. While most studies have found that travel cost and time are two of the most important determinants of mode choice, significant research has been conducted to explore factors affecting mode choice behaviors [38,39], as well as the impact of built environment [40,41] and land use and urban form [42] on mode choice decisions.
Early studies on travel mode choice models have been examined in various cases and applications with different research objectives. Many studies have been conducted to understand mode choice behavior for specific modes of transportation. For example, Llorca et al. [20] and Reichert and Holz-Rau [43] examined the mode choices for long-distance travel. Shen et al. [44] studied the effects of rail transit-supported urban expansion in suburban neighborhoods. Chavis and Gayah [45] proposed a mode choice model for transit options, including traditional fixed-route and flexible-route transit systems. Gunay and Gokasar [46] examined the effect of destination type on mode choice for airport access in Istanbul, Turkey, using RP data, as well as MNL and ML models. Ye et al. [47] investigated the impact of bike-sharing on travel mode choices among different resident types using the ML model. Li et al. [25] compared different logit-based and Weibit-based models for the new Swiss metro maglev system. Bastarianto et al. [48] investigated a tour-based mode choice for commuters in Indonesia.
Although there are a considerable number of travel mode choice studies, only a few have developed mode choice modeling for BRT systems, one of the travel mode alternatives in our study. Deng and Nelson [18] examined public attitudes and perceptions to BRT in Beijing, China. However, the study presented a statistical description of the survey and did not develop a mode choice model. Kakar and Prasad [49] developed an MNL model using SP survey data to introduce BRT along with existing transportation modes, such as private vehicles, para-transits, and share-taxis between Kabul airport and the central business district. They found that travel time, cost, and socioeconomic characteristics—such as age, gender, and occupation—were significant factors in terms of modal shifts to the proposed BRT system. The introduction of BRT in Santa Clara County, USA, was analyzed by Chen and Naylor [50] using MNL models for work and nonwork trips. Cao et al. [19] examined transit riders’ satisfaction with BRT compared to conventional bus and metro services in China.
Some studies have analyzed mode choices for intercity travel or within small cities. Hess et al. [51] analyzed intercity mode choices using a hybrid choice model in the USA. Shanmugam and Ramasamy [24] developed an NL model to examine intercity mode choice behavior in India. Mattson et al. [52] developed a mode choice model for rural intercity bus services in North Dakota, USA. The ML model showed that sociodemographic characteristics (gender, age, income, disability), trip characteristics (i.e., trip purpose), and mode characteristics (i.e., travel time, cost, and access distance) significantly impacted mode choice. Hu et al. [53] examined travel mode choices for small cities in China using a multinomial logistic regression model.
2.2. Mode Choice Model Related to Smart Cities
Although there have been many efforts to introduce smart cities around the world, there is a lack of studies on mode choice behavior specifically targeting smart cities or external trips in a smart city context [54,55]. Lee [54] identified the effect of bus information terminal, which can be one of smart city transport service policies, on the increase in public transport use or satisfaction, and discussed the effects and limitations of the smart city transport policy. Using mobile sensed data collected from mobile phones, Semanjski et al. [56] investigated mobility behavior and explored the potential of smart city platform. Bubeliny and Kubina [57] reviewed the factors that smart city construction has on transportation and emphasized that there are positive aspects that can improve the use of public transportation and the quality of life of residents. Battarra et al. [58] also investigated the effect of smart city policy and smart mobility initiatives on efficiency, sustainability, and quality of life in 11 Italian metropolitan cities.
While there has been no research on mode choice model explicitly targeting smart cities, in recent years, emerging new transport modes applicable to smart cities and smart mobility for short-distance travel have been introduced. Studies on travelers’ mode choice preferences for short trips could derive the significance of transportation policy for the future smart cities or smart mobility. Several studies have explored the subject on smart mobility or short-distance travel, although they have not been conducted in the context of a smart city, including personal rapid transit [22], walking and public transport [59], public transport, private car and bicycle-sharing [60], e-scooter, autonomous bus, sharing bicycle and walking [5], and shared automated vehicle [61]. Using multidimensional ML models, Choudhury et al. [62] examined three new and emerging smart mobility options, namely, shared taxi, one-way car rental, and a novel combination of park-and-ride school buses, in Lisbon, Portugal. Using smartphone-based SP data, Danaf et al. [63] developed a binary logit model to consider a new on-demand mobility service in Boston, USA. Yan et al. [64] investigated travelers’ responses to a proposed integrated system of ride-sourcing services—that is, on-demand, app-driven ridesharing services—and public transit. Dias et al. [65] examined the influence of socioeconomic and demographic variables on the choice of ride-sourcing and carsharing services. The authors developed a bivariate ordered probit model using the Puget Sound Regional Travel Study. There have been other applications used to investigate mode choice behaviors in the adoption of the MaaS system [66,67,68] and the use of smartphone GPS data in mode choice modeling [69].
Another research field that has recently gained increasing interest in the transportation sector is the very short-distance trip and associated first and last mile (FLM) strategies, which could be one of the components of a smart city. The transport modes of FLM solutions include PM, autonomous buses, bicycles, and walking [55,70]. For example, Azimi et al. [71] developed MNL models to examine the mode choices of FLM connections for transit services in Orlando, USA. The transport modes included transportation network company services, taxis, drive alone (park-and-ride), carpooling (kiss-and-ride, carpools, or shuttles), micromobility modes (bike-sharing scooters), walking, and wheelchairs. Kim et al. [22] analyzed mode choices in a short-distance trip for a new transport mode—that is, personal rapid transit—using a logistic regression model. Scorrano and Danielis [72] investigated active mobility choices by comparing them before and during the COVID-19 pandemic in Italy, while Memon et al. [21] studied mode choices focusing on park-and-ride services, using logistic regression modeling.
3. Methodology: Study Area and Stated Preference Survey
3.1. Sejong 5-1 Living Area Smart City
Sejong Metropolitan Autonomous City, called Sejong City, is located in the central part of Korea, approximately 120 km south of Seoul (Figure 1). It has been integrated into a single administrative area as a self-governing city since 2012. The Korean government has designated Sejong City as a center of research, education, and high-tech, and Korea’s ministries and executive offices have been relocated from Seoul to Sejong. As a result, the population of Sejong City and vehicle traffic density are continuously increasing. A total of 46 bus routes are in operation in Sejong City, including five types of city buses: express buses, red buses (regional bus), blue buses (operating main lines), green buses (operating branch lines), and shuttle buses.
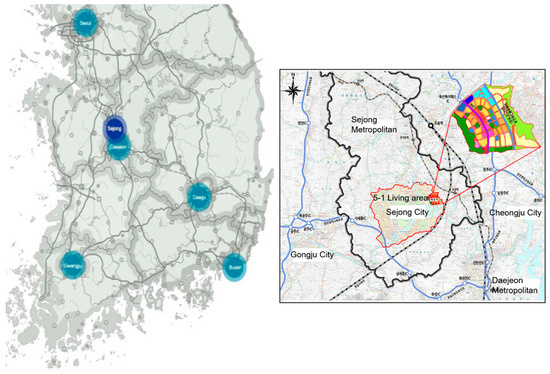
Figure 1.
Locations of Sejong City (left) [73] and study area (right) [74].
This study’s area of interest is the Sejong 5-1 Living Area smart city, located in the northeast of Sejong City, about 10 km from the Daejeon metropolitan area (Figure 1). The Sejong smart city pilot project covers 2741 km2 and plans to have a population of approximately 19,000 residents and 8000 households [4,5]. The land-use plan consisted of mixed use (31.4%), parks and green space (37.6%), facility land (12.5%), and public infrastructure (18.5%).
As a smart city, the Sejong pilot project established key elements with three values and seven innovation factors; the three values were dematerialism, decentralization, and smart technology, and the seven innovation factors were mobility, healthcare, education and jobs, energy and environment, governance, culture and shopping, and life and safety. One of the important elements of the project is mobility, aimed at reducing traffic congestion using innovative smart mobility technologies—such as PM and carsharing services—and an artificial intelligence-embedded traffic management system [4]. One of the objectives of the transportation component of the project is to provide a safe and convenient user-friendly mobility environment, a shared car-based service, smart mobility technology, and a smart transportation system. Consequently, a shared mobility concept was proposed in the master plan, in which the future of the city is that of a shared car-based city. The “owned car-restricted areas” are designated in the city, such that only about one-third of residents own a private car, all owned cars are parked at entrances, and people move inside using autonomous vehicles, shared vehicles, and bicycles [17]. The ultimate impact expected of implementing such a smart city in Sejong is to provide shared-based mobility services and implement an integrated mobility system, supporting a city where mobility services (at the level of owned vehicles) are possible, even without owning vehicles.
The concept of land use and space related to the transportation system in the Sejong 5-1 Living Area was prepared to realize a smart city that applied commercialized, innovative technology, including FLM services, smart personal mobility, shared mobility, autonomous shuttle buses on ring roads, and the expansion of the Sejong City BRT system. In particular, a BRT line with two bus stops in the 5-1 Living Area plays a central role in the transport network, crossing living areas as the central axis of the smart city, connecting to other living areas and Sejong City itself (Figure 2). Ultimately, it is designed to accomplish MaaS through a BRT-based public transportation connection with a convenient transfer system, such that the city has a core in which smart technology and urban activities (living-area-centered facilities) are integrated. Within the 5-1 Living Area, designated autonomous vehicles and shared car-only lanes will be constructed. At the same time, owned-vehicle-restricted zones will be adopted to encourage public transportation, shared vehicles, PM, bicycles, and walking on internal roads. Through the Sejong BRT line, autonomous vehicles, and shared car roads, it is possible to traverse the entire 5-1 Living area within 10 min. Moreover, it will be realized in a pedestrian-based city by building a pedestrian path connecting the BRT stop and the transfer to/from the main parking lot.
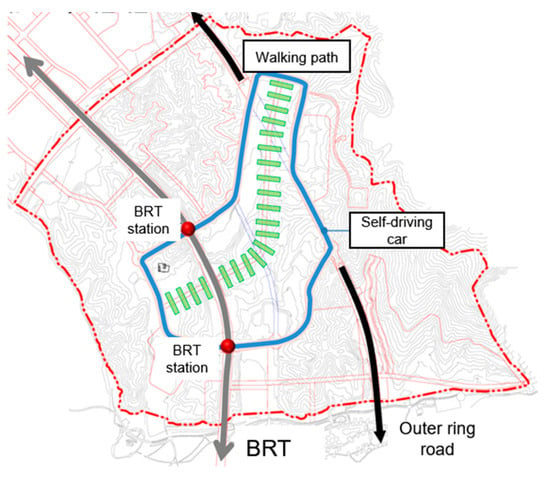
Figure 2.
Design concept of transportation system in Sejong 5-1 Living Area [75].
3.2. Survey
The survey was designed with the goal of creating user-centered smart mobility by identifying user demands and requests through citizen surveys on the introduction of smart mobility. In particular, the survey was conducted to estimate the preference and demand for each transportation mode. It should also be noted that the original survey included both internal trips within the 5-1 Living Area and external trips to/from it. However, this study focuses on external trips because previous studies have focused on mode choice behaviors for smart mobility or short-distance travel, and there has been no research on external trips. In particular, the Sejong 5-1 smart city has the characteristic of introducing the owned car restricted areas to limit private vehicle ownership to about one-third of residents. Therefore, it is very interesting to investigate the effect of the characteristics of smart city transport policy on external travel behaviors. For this purpose, the uniqueness of transport network and policy in the Sejong 5-1 Living Area smart city to be newly built in the future was explained to the survey respondents in advance (Figure 3). Various hypothetical scenarios (i.e., travel time and cost for each mode of transport) were then provided to survey participants to assist them in choosing their travel preferences, having been asked to select the most attractive options in the Sejong smart city. The available external transport modes included BRT, individually owned cars, carsharing, and ridesharing. The travel times for BRT and private car given in the SP survey were decided on the basis of the average external travel times in Sejong City from Korea Transport Database [76], since the two modes are already available in KTDB. The travel times of the carsharing and ridesharing modes in the survey were given as the projected travel times differentiated from the private car and in consideration of operating conditions in the network. As shown in Figure 3, the given travel times for external travel for each mode were fixed as 30 min (car), 25 min (carsharing), 20 min (ridesharing), and 40 min (BRT), while travel costs for all modes were selectively presented. There are various access travel times from very different departure locations, but it is difficult to consider them in the SP survey given limited survey conditions, e.g., a face-to-face interview. Therefore, travel time is understood to be defined as a symbolic concept for differentiation between transport modes regarding operation plan of carsharing and ridesharing modes.
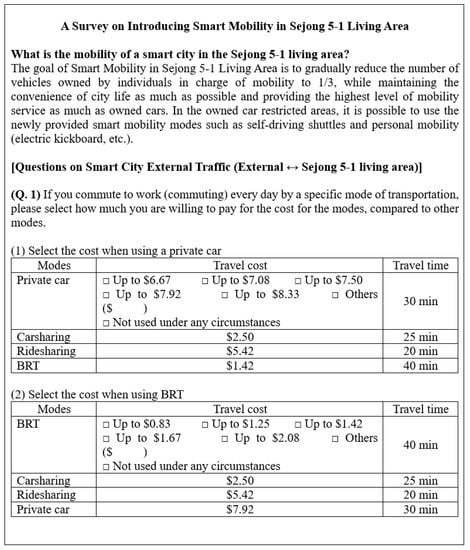
Figure 3.
Example of SP survey questions [77].
The SP survey is the most commonly used method for understanding travel behaviors under hypothetical scenarios [63]. This case study used SP survey data conducted by KOTI [77] for a week, from 2 to 8 August 2018. The survey targeted citizens who worked or lived in Sejong Metropolitan Autonomous City. SP surveys often ask individual respondents multiple questions. In our case, 12 questions were asked for each respondent to choose their preferred mode of transport according to various scenarios (i.e., different travel costs and times for each mode of transport). The SP survey of this study was conducted in a face-to-face interview method in public facilities (railway station, bus terminal, etc.) by a simple random sampling method targeting adults between the ages of 20 and 65. A total of 300 people responded to the survey. We analyzed 3200 SP observations out of a total 3600 observations, excluding 400 nonresponse observations. Louviere et al. [78] presented a formula for calculating the minimum acceptable sample size when a respondent is asked multiple questions. According to the formula (Equation (1)), the minimum number of samples (N) required at the 95% confidence level ( = 1.96) was 45 in our case, considering the number of 12 questions per respondent (S), the true choice proportion of the most important alternative (the share of private car for external trips) of 74% (p) [76], and the allowable deviation level of 5% (α). Because the SP survey in this study asked each of the 300 respondents 12 questions, the deviation was 1.9% at the 95% confidence level.
where N is the minimum acceptable sample size, p is the true choice proportion of the relevant population for an alternative, q is defined as 1 − p, S is the number of choice observations for each respondent, is the inverse cumulative distribution function of a standard normal evaluated at , and α is the level of allowable deviation as a percentage between the desired level of accuracy of the estimated probability, , and p.
SP survey questions were of four main types: (1) socioeconomic characteristics—that is, gender, age, occupation, car ownership, driver’s license status, number of household members, average household income—and travel behavior in general—that is, transport mode used more than three days a week, and preference for convenience, cost, or travel time; (2) preferences for transportation services related to smart cities—that is, the type and priority of services required for smart cities among personal mobility, transportation sharing services, autonomous vehicle services, etc.; (3) travel preferences for external trips; (4) preferred fare system—that is, individual vs. integrated, uniform vs. distance-proportional vs. both time- and distance-proportional.
It should be noted that the available transport mode choices could differ depending on whether a traveler could drive (i.e., choice riders) or not (i.e., captive riders). Accordingly, separate survey questions on their mode preferences were asked of them on the basis of their driving ability.
3.3. Overview of Survey Data
Descriptive statistics of the SP survey conducted under the hypothetical conditions in a new future smart city to be built are shown in Table 1. Among the 300 respondents, the age distribution was highest in the 30s and 40s (63.6%), with office workers accounting for the most (36.3%) in the occupational group. Families with three or more members accounted for 78.3% of the total population. Approximately 72% and 49% of the respondents answered that they could drive and that they used a car more than 3 days a week, respectively.

Table 1.
Sample descriptive statistics of the survey on the hypothetical future smart city.
To identify the mode choice behaviors in general, a question asked respondents to compare the preferences and important factors among convenience, travel time, and travel cost. More than half of the respondents preferred transport modes with shorter travel times than price and convenience, suggesting that convenience was more important if travel times were the same. In the preference survey on two-wheeled vehicles, walking, and autonomous driving, approximately 56% of the respondents said that they were more afraid of two-wheeled vehicles than regular vehicles, with 52% of the respondents preferring to walk rather than use vehicles. In addition, approximately 65% of the respondents responded positively to the safety of autonomous driving systems.
The preference for transportation fare systems was also examined, with the integrated fare system being the most preferred option (65%) for a one-time payment system. Among smart mobility options within the 5-1 Living Area, the preference for autonomous shuttles was the highest option in the case of a flat-rate fare system. However, if the distance-proportional rate system was applied, the preference for carsharing became the highest option. In the case of the time–distance simultaneous fare system, the preference for ridesharing was the highest. As a result of examining the preferences of smart mobility users for various incentive methods, approximately 36% of respondents said that the transfer fare system was the most suitable incentive, followed by the resident discount system (21%) and the mileage system (17%).
3.4. Willingness to Pay and Preferred Travel Time
We asked questions about the maximum fare respondents were willing to pay and their preferred travel time per trip under the unique characteristics of transportation policy and hypothetical conditions in a smart city to be built. Because people had different modes of transport depending on their vehicle ownership or driving ability, a different set of questions was presented for different scenarios. The first set of questions was used when driving a private vehicle was not possible for external trips, with two transport modes, BRT and ridesharing, being available in this case. When the ridesharing travel time was 20 min, the fare and travel times of BRT were 1.42 USD and 40 min, respectively, and approximately 42% and 40% of respondents were willing to pay less than 3 and 4 USD, respectively (Figure 4a). The percentages of respondents willing to pay less than 1, 2, and 3 USD for BRT were 30%, 64%, and 6%, respectively (Figure 4b).
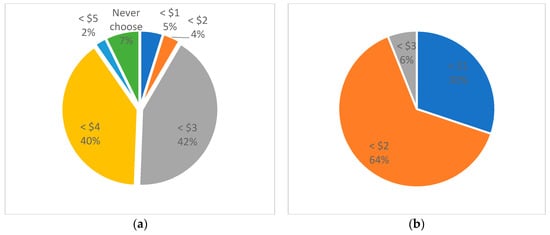
Figure 4.
Response rates of willingness to pay for BRT (a) and ridesharing (b). (a) Ridesharing (20 min), alternative: BRT (1.42 USD, 40 min). (b) BRT (40 min), alternative: ridesharing (5.42 USD, 20 min).
Figure 5 shows the maximum preferred travel time for each transport mode when BRT and ridesharing are available. Given that the travel time and cost of BRT were 40 min and 1.42 USD, respectively, and the travel cost of ridesharing was 5.42 USD, approximately 60% and 19% of respondents chose preferred travel times of 20 min and 30 min for ridesharing, respectively (Figure 5a). Conversely, approximately 37% of respondents preferred up to 30 min for BRT, and approximately 47% of them preferred up to 40 min (Figure 5b).
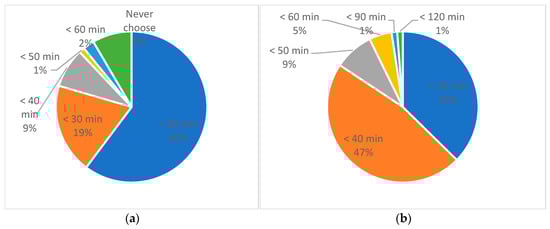
Figure 5.
Response rates of preferred travel time for ridesharing and BRT. (a) Ridesharing (5.42 USD), alternative: BRT (1.42 USD, 40 min). (b) BRT (1.42 USD), alternative: ridesharing (5.42 USD, 20 min).
A second set of questions was used when driving a private vehicle was possible. In this case, four transport alternatives were available—that is, private vehicles, BRT, ridesharing, and carsharing. The survey results are shown in Figure 6 and Figure 7. Regarding the willingness to pay for ridesharing, most respondents (49%) said that they were willing to pay less than 4 USD (Figure 6a). The highest willingness to pay responses for carsharing, BRT, and private cars were 66% (less than 3 USD), 64% (less than 2 USD), and 48% (less than 7 USD), respectively (Figure 6b–d). Figure 7 shows the preferred travel times for each transport mode, given the travel time and cost of alternatives. The preferred travel times for ridesharing varied; 43% of respondents selected up to 20 min, while 35%, 8%, and 4% of respondents selected up to 30 min, 40 min, and 60 min, respectively (Figure 7a). In the case of carsharing, many respondents (41%) responded to a preferred travel time of up to 30 min (Figure 7b). The preferred travel times for BRT and private cars also varied, with 54% of respondents selecting up to 30 min for BRT (Figure 7c), and 40% selecting up to 30 min for private cars (Figure 7d). From these results, we could conclude that respondents tolerated the fact that BRT travel times were longer than those of other modes of transport.
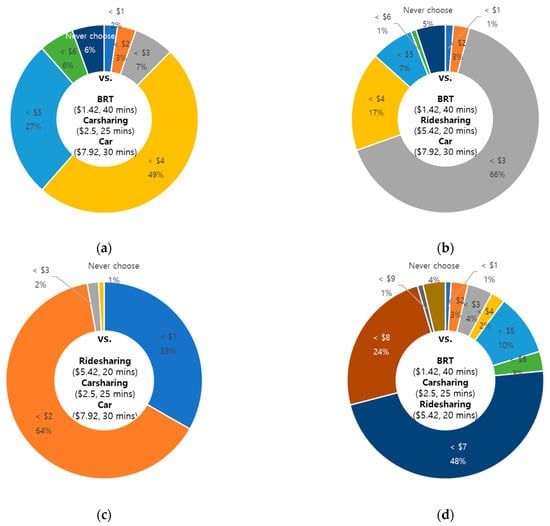
Figure 6.
Response rates of willingness to pay for ridesharing, carsharing, BRT, and private car. (a) Ridesharing (20 min), alternative: BRT, carsharing, private car. (b) Carsharing (25 min), alternative: BRT, ridesharing, private car. (c) BRT (40 min), alternative: ridesharing, carsharing, private car. (d) Private car (30 min), alternative: BRT, carsharing, ridesharing.
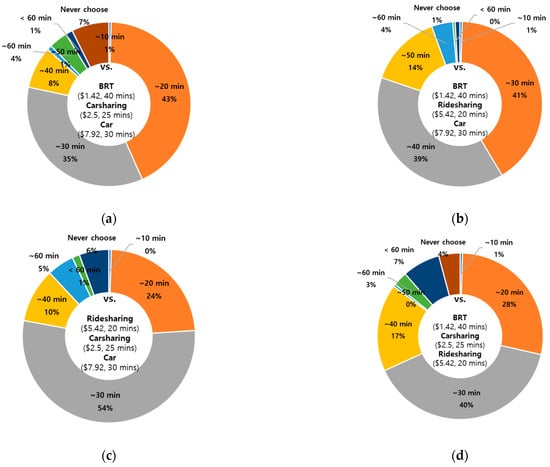
Figure 7.
Response rates of preferred travel time for ridesharing, carsharing, BRT, and private car. (a) Ridesharing (5.42 USD), alternative: BRT, carsharing, private car. (b) Carsharing (2.50 USD), alternative: ridesharing, BRT, private car. (c) BRT (1.42 USD), alternative: ridesharing, carsharing, private car. (d) Private car (7.92 USD), alternative: ridesharing, carsharing, BRT.
4. Mode Choice Modeling and Results
4.1. Mode Choice Modeling Structure and Explanatory Variables
In the SP survey of this study, it was assumed that owned car-restricted areas will be set in order to reduce privately owned cars. This is the uniqueness of the transportation policy in the Sejong 5-1 Living Area smart city to be built in the future. This uniqueness was explained to the survey respondents in advance, and they answered their mode preferences accordingly. Therefore, the mode choice analysis in this study reflects the unique characteristics of the smart city. We employed the discrete choice model to develop a mode choice model for commuting trips between the smart city and external areas. In particular, we used ML modeling of the discrete choice model by using the panel nature of the data (i.e., multiple observations from each individual for BRT and other modes based on time and cost options). The advantage of using ML modeling is its ability to explain the random state variations of each individual with respect to the generic variable [31,79]. In particular, we were interested in exploring the variations in taste preference across individuals (also known as heterogeneity), as well as the potential presence of inter-alternative correlations. Used widely to deal with panel data, ML models are extensions of the multinomial logit model, adding an error term to the utility function as follows: the mode choice behavior of individual can be generally explained using the utility maximization theory, with it being assumed that individual will choose mode if the utility of mode is higher than the other modes.
where is the probability of individual choosing alternative , is the other mode, is the utility function, and is the choice set [28]. The utility function in the ML model can be expressed as follows:
where is the coefficient matrix, . is the vector of explanatory variables, and is the error term. The is the deterministic part of . The random parameter . is not constant and varies among individuals to contain heterogeneity across them. The random . term can be expressed as follows:
where β is the mean, and is the standard deviation of the random parameter . The vector includes heterogeneity with a mean and standard deviation of 0 and 1, respectively. is the error term for [31,34,80].
In this study, the ML model was estimated using the logit R-package [81]. To estimate a model using simulations, pseudo-random numbers must be drawn from a specified distribution. For this purpose, what is needed is a function that draws pseudo-random numbers from a uniform distribution between 0 and 1. These numbers are then transformed using the quantile function of the required distribution. We used Halton draws to estimate the ML model. This study had only a single random parameter for the travel cost variable; hence, we used 100 as the number of Halton draws, as recommended [31].
4.2. Explanatory Variables
The explanatory variables used in this study for the ML model included several individual-specific variables: (1) age and income variables (the middle value of each age and income category was input. The input values for income less than 200 and over 600 were set to be 150 and 650, respectively); (2) car ownership and driving ability variables (if a respondent owned a car and drove it, these variables were equal to 1; otherwise, they were equal to 0); (3) employment dummy variable (if a respondent was an employee or student, this variable was equal to 1; otherwise, it was equal to 0); (4) major mode variable (if a respondent used a car, this variable was equal to 1; otherwise, it was equal 0); (5) presence of preschooler dummy variable (if a respondent ha a preschooler, this variable was equal to 1; otherwise, it was equal to 0).
The generic variable in this study was travel cost selected by respondents to smart cities from external areas when the average travel time was given. The average travel times in the survey were 40, 20, 25, and 30 min for BRT, ridesharing, carsharing, and cars, respectively.
In the SP survey, it was assumed that survey respondents understood the unique characteristics (i.e., introducing smart mobility and setting the owned car-restricted areas to reduce private vehicle ownership to about one-third of residents) and various hypothetical conditions of the Sejong 5-1 smart city to be built in the future. Because the unique characteristics of the smart city were assumed to be reflected in respondents’ preference in the survey, a variable describing the role of the smart city was not separately adopted in the analysis.
4.3. Modeling Results
Table 2 shows the ML model results, which include variables with statistically significant (at least 90%) confidence levels. From the results, we found that variables including age, income, household size, major mode, driving ability, and presence of preschoolers affected the mode choice for external commuting. The ML model output was reasonable in terms of overall model fit, based on chi-square values, and the likelihood ratio test was found to be significant (greater than 99%). The standard deviations of the cost parameters were significant, according to the assumption of a normal distribution. This is because other distributions did not generate significant standard deviations for random parameters, or their empirical distribution shapes did not follow the shapes of specified distribution types.
Table 2.
Summary of the mixed logit model.
Since the purpose of this study was to investigate the SP for smart city external commuting trips, we focused on individual-specific variables. A quick review of the results summarized in Table 2 reveals that including alternative specific attributes and socioeconomic demographic variables showed reasonable coefficient values in terms of both sign and magnitude. Note that because the car was set as the reference mode, alternative specific variables and nonrandom parameters were presented only for the BRT, ridesharing, and carsharing modes. The random variable, i.e., the travel cost, had a negative coefficient, as expected. This means that, as the travel cost increased in a certain mode, that mode was less likely to be chosen over other modes. The p-values of cost in the model were 0.000; consequently, the cost variable was significant. Conversely, another random variable, i.e., travel time, was not included in the final ML model because it caused a singularity problem. When the determinant is equal to zero in a Hessian matrix, called a singularity problem, we cannot obtain the variance matrix, which is equal to the negative inverse of the Hessian. In our SP survey, both travel time and cost were given to the respondents; travel costs for all modes were selectively presented whereas travel times for each mode were fixed. This means that there is absolutely no variation between alternatives to explain choice behavior. This leads to a computationally singular Hessian. In order to have the travel time as a random variable in the model structure, we attempted other modeling methods, including the MNL and latent class logit model, but none of them resulted in meaningful and robust outputs. Similarly, the study of Gunay and Gokasar [46], which developed mode choice models for airport access, had the travel cost as the only generic variable in the final model structure. The total travel time variable was not estimated in the final model, while the duration time variable at the airport for each mode (car, taxi, public transit) was included as a nonrandom variable.
We found that not all coefficient estimates were statistically significantly different from zero for all alternatives. From the coefficients of individual-specific variables, the insights from results can be explained as follows: for the age variable, only the coefficient of BRT was significant, meaning that age was significantly associated with BRT use relative to the baseline (car). This coefficient was negative, suggesting that older people were less likely to use BRT than younger people, meaning that older people were more likely to use cars to commute to smart cities. Similarly, the income variable was positively associated only with BRT at the 90% confidence level, indicating that people were more likely to use the BRT mode as income increased. This suggests that the BRT fare defined here to be 1.42 USD seems to be expensive for residents in smart cities for regular commuting trips. The household size variable was statistically significant for the BRT and carsharing alternatives. The coefficients were positive, suggesting that, as household size increased, BRT and carsharing were more likely to be chosen over cars. It is clear that the greater the number of household members, the more diverse the destinations, making it less likely to choose cars for commuting trips. For the major mode variable, only the BRT was statistically significant. The negative coefficient of the variable shows that people who usually drove a car for commuting trips were less likely to choose the BRT option. As one might expect, car users were less likely to choose the BRT mode. Consequently, the driving ability variable was statistically significant only for the carsharing alternative, indicating that one who is able to drive a car could choose the carsharing option. The carsharing option requires the driving ability of the driver to be appropriately verified according to the driver’s license and physical conditions. Conversely, all coefficients of the presence of the preschool child variable were positively significant. All three modes were more likely to be chosen than cars, suggesting that the easy availability and door-to-door access service from carsharing and ridesharing were more attractive than cars.
5. Discussion and Conclusions
Developing sustainable transportation systems and smart cities can be supported by promoting environmentally friendly transport modes such as walking, cycling, public transport, and other modes using recently developed technology rather than depending on private vehicles. As various urban problems arise, interest in developing smart cities is growing. Along with an increasingly urbanized society, many governments have taken active interest in introducing new transit modes in smart cities.
The Sejong 5-1 Living Area has been established as one of two national pilot cities for future Korean smart cities. In this study, we introduced a smart city, presented travel preferences, and developed a ML model focusing on external trips between the Sejong 5-1 Living Area and those outside the city. Some of the distinguishing features of the Sejong 5-1 Living Area smart city are its transportation and smart mobility design concepts toward the development of a pedestrian-oriented city. A sharing car-only district will be designated inside the city to discourage private cars. About one-third of residents in smart cities will be allowed to own private vehicles inside the city, while PM, carsharing, and ridesharing options are available for door-to-door mobility. Consequently, drivers are encouraged to park their cars at parking lots and transfer to internal transport modes, such as shuttles and PMs, to reach their final destination. The BRT system plays a central role in the mobility of such external trips. While most of previous studies on smart cities have focused on smart transport policy in general, short-distance travels, or smart mobility, there has been no research on external trips in a smart city context. Unlike other smart city transport policy or non-smart cities, the Sejong 5-1 smart city will have unique characteristics of its transport policy such as owned car-restricted areas to limit personal vehicle ownership to about one-third of residents. In this study, we analyzed the effect of these discriminatory smart city transport policy on the mode choice behaviors for external trips according to the socioeconomic characteristics of individual travelers. From the SP survey, we found that the introduction of BRT service as a public transportation for external travel is urgently needed in the smart city, considering travel cost, time, and convenience of BRT.
For further analysis using SP survey data, we developed the ML mode choice model for external trips. The transportation options for external trips included private car, BRT, carsharing, and ridesharing. ML modeling is typically used for explaining the random state variations of each individual with respect to the generic variables such as travel time and cost. We applied other types of modeling, including MNL and latent class logit model to test the generic variables. Unfortunately, none of them resulted in meaningful and robust outputs except the ML model. The ML model only included travel cost as a random variable in the model structure, while both travel time and cost were not meaningful in other methods. However, we were interested in identifying the variations in mode preferences across individuals, as well as the potential presence of inter-alternative correlations in this study. The estimated model output in terms of the likelihood ratio was statistically significant, and the overall model fit was reasonable. All individual-specific variables were found to be significant—that is, variables including age, income, household size, major mode, driving ability, and the presence of preschoolers were significant, with the signs of each coefficient being reasonable. However, the statistical significances of variables differed by alternative mode. In the case of BRT, the significant factors affecting mode choice decisions were age, income, household size, major mode, and the presence of preschoolers. Variables such as household size, driving ability, and the presence of preschoolers were statistically significant for the carsharing alternative, while ridesharing alternatives were significant only in the presence of preschoolers.
Considering the Sejong smart city’s external transportation plan, the following insights were obtained from the results of the mode choice model. The need or preference for public transportation, such as a BRT system, was relatively high because private vehicles would restrict the entry of apartment complexes into smart cities. The preferences for BRT and carsharing increased as the number of household members increased because of the low accessibility of private vehicles. However, it was found that older smart city residents had a lower preference for BRT compared to private cars. Because of a higher income indicating preference for BRT, we suggest decreasing the BRT fare for commuting to work to promote the use of public transportation.
In the case of living with preschool children, the preferences of all three modes were higher than cars, which means that transporting preschoolers was an essential trip for residents in smart cities. As the number of household members increased, the preference for BRT increased, with it being understood that it is difficult to satisfy the travel demands for as many destinations as the number of household members with a car. A significantly high preference for carsharing appears to play a critical role as a transportation mode in situations where the use of passenger cars is limited. However, the statistical significance of ridesharing did not appear in this study, as it seems that it is difficult to find options with a similar destination during commuting times and because the ridesharing experience is unfamiliar to Koreans.
While the results of our study were encouraging for increasing the BRT modal share in our study area, there were limitations that should be addressed in future studies to improve the accuracy and usefulness of the model. First, it was assumed that survey respondents understood the unique characteristics of the Sejong smart city (i.e., introducing smart mobility and setting the owned car restricted areas to reduce private vehicle ownership to about one-third of residents) and various hypothetical conditions of transport modes in the future smart city. The mode choice behaviors in a non-smart city context were not surveyed; hence, a variable describing the role of the smart city was not separately adopted in this analysis. Accordingly, it is difficult to directly compare the results of this study with those of non-smart cities. This study focused on external trips from a smart city. A future study should analyze the internal travel patterns of smart cities and investigate the impact of mode choices on smart mobility within the city, including the PM mode. Our research was based on a single data timeframe, and the sample size was small. For an agency to make better strategic decisions, it would be useful to run the model with large datasets and different dates to reflect the various characteristics of travelers. Moreover, detailed aspects of BRT operations were not considered in this analysis. In reality, operational characteristics such as headway, capacity, and bus or station amenities in the BRT system may also impact users’ decisions. Because the survey in this study was conducted to estimate users’ preferences and transportation demand for each transport mode, various questions related to accessibility and the built environment, as well as exogenous factors such as safety, comfort, convenience, and perception, were not included. In addition to travel cost, time, and personal characteristics, other factors may be important in mode choice decisions. There is also a limitation in that it is difficult to consider the differentiation of travel time variable by means of use by providing fixed relative travel times because there is no experience in access travel times to the smart city for carsharing and ridesharing. For this reason, it is understood that the singularity problem occurred because of the invariant travel time variable in our model. In order to solve this problem, it is necessary to apply the differentiated travel times in the model according to the specific services of carsharing and ridesharing for individuals. This issue is left for future research. Another suggestion for future work includes the transferability of the model. This study is limited to the dataset used in Sejong City, and future studies should be expected to apply the methodology to other areas. Other types of advanced mode choice models can be expected in future studies.
Author Contributions
Conceptualization, J.-K.E. and K.-S.L.; methodology, J.-K.E.; software, J.-K.E.; validation, J.-K.E. and K.-S.L.; formal analysis, J.-K.E.; investigation, K.-S.L.; resources, S.K.; data curation, S.K.; writing-original draft preparation, K.-S.L.; writing-review and editing, K.-S.L. and J.-K.E.; visualization, S.K.; supervision, J.L.; project administration, J.-K.E.; funding acquisition, J.L. All authors have read and agreed to the published version of the manuscript.
Funding
This research was funded by the R&D project “Development of S-BRT Priority Signal and Safety Management Technology (UB22001)” of the Korea Railroad Research Institute, Republic of Korea.
Informed Consent Statement
Not applicable.
Data Availability Statement
Not applicable.
Acknowledgments
This research was supported by the R&D project, “Development of S-BRT Priority Signal and Safety Management Technology” of the Korea Railroad Research Institute, Republic of Korea.
Conflicts of Interest
The authors declare no conflict of interest.
References
- Iqbal, M. Smart city in practice: Learn from Taipei City. J. Gov. Public Policy 2021, 8, 50–59. [Google Scholar] [CrossRef]
- Gupta, K.; Hall, R.P. Understanding the what, why, and how of becoming a smart city: Experiences from Kakinada and Kanpur. Smart Cities 2020, 3, 232–247. [Google Scholar] [CrossRef] [Green Version]
- Winkowska, J.; Szpilko, D.; Pejic, S. Smart city concept in the light of the literature review. Eng. Manag. Prod. Serv. 2019, 11, 70–86. [Google Scholar] [CrossRef] [Green Version]
- OECD. Smart Cities and Inclusive Growth. Available online: https://www.oecd.org/regional/cities/smart-cities.htm (accessed on 20 July 2021).
- MOLIT. Smart City Korea. Ministry of Land, Infrastructure, and Transport, Korea. Available online: https://smartcity.go.kr/en/ (accessed on 19 July 2021).
- Ahvenniemi, H.; Huovila, A.; Pinto-Seppa, I.; Airaksinen, M. What are the differences between sustainable and smart cities? Cities 2017, 60, 234–245. [Google Scholar] [CrossRef]
- Ibrahim, M.; El-Zaart, A.; Adams, C. Smart sustainable cities roadmap: Readiness for transformation towards urban sustainability. Sustain. Cities Soc. 2018, 37, 530–540. [Google Scholar] [CrossRef] [Green Version]
- Wahab, N.S.N.; Seow, T.W.; Radzuan, I.S.M.; Mohamed, S. A systematic literature review on the dimensions of smart cities. IOP Conf. Ser. Earth Environ. Sci. 2019, 498, 012087. [Google Scholar] [CrossRef]
- Stubinger, J.; Schneider, L. Understanding smart city: A data-driven literature review. Sustainability 2020, 12, 8460. [Google Scholar] [CrossRef]
- Aldegheishem, A. Success factors of smart cities: A systematic review of literature from 2000–2018. J. Land Use Mobil. Environ. 2019, 12, 53–64. [Google Scholar]
- Trindade, E.P.; Hinnig, M.P.F.; da Costa, E.M.; Marques, J.S.; Bastos, R.C.; Yigitcanlar, T. Sustainable development of smart cities: A systematic review of the literature. J. Open Innov. Technol. Mark. Complex. 2017, 3, 11. [Google Scholar] [CrossRef] [Green Version]
- Arroub, A.; Zahi, B.; Sabir, E.; Sadik, M. A literature review on Smart Cities: Paradigms, opportunities and open problems. In Proceedings of the 2016 International Conference on Wireless Networks and Mobile Communications (WINCOM), Fez, Morocco, 26–29 October 2016; pp. 180–186. [Google Scholar]
- London. Smart London. Available online: https://www.london.gov.uk/what-we-do/business-and-economy/supporting-londons-sectors/smart-london (accessed on 22 July 2021).
- Silva, B.N.; Khan, M.; Han, K. Towards sustainable smart cities: A review of trends, architectures, components, and open challenges in smart cities. Sustain. Cities Soc. 2018, 38, 697–713. [Google Scholar] [CrossRef]
- Bakiei, T.; Almirall, E.; Wareham, J. A smart city initiative: The case of Barcelona. J. Knowl. Econ. 2013, 4, 135–148. [Google Scholar] [CrossRef]
- Lee, S.K.; Kwon, H.R.; Cho, H.A.; Kim, J.; Lee, D. International Case Studies of Smart Cities: Singapore, Republic of Singapore; IDB discussion paper, IDB-DP-462; Inter-American Development Bank: New York, NY, USA, 2016. [Google Scholar]
- Jeong, J.S. Master Plan Team. Sejong National Pilot Smartcity. The First White Paper, Mater Planner Master Plan Team. Available online: https://www.molit.go.kr/USR/policyData/m_34681/dtl.jsp?id=4524 (accessed on 22 July 2021).
- Deng, T.; Nelson, J.D. The perception of Bus Rapid Transit: A passenger survey from Beijing Southern Axis BRT Line 1. Transp. Plan. Technol. 2012, 35, 201–219. [Google Scholar] [CrossRef]
- Cao, J.; Cao, X.; Zhang, C.; Huang, X. The gaps in satisfaction with transit services among BRT, metro, and bus riders: Evidence from Guangzhou. J. Transp. Land Use 2016, 9, 97–109. [Google Scholar] [CrossRef] [Green Version]
- Llorca, C.; Ji, J.; Molloy, J.; Moeckel, R. The usage of location based big data and trip planning services for the estimation of a long-distance travel demand model: Predicting the impacts of a new high speed rail corridor. Res. Transp. Econ. 2018, 72, 27–36. [Google Scholar] [CrossRef]
- Memon, I.A.; Kalwar, S.; Sahito, N.; Talpur, M.A.H.; Chandio, I.A.; Napiah, M.; Tayyeb, H. Mode choice modeling to shift car travelers towards park and ride service in the City centre of Karachi. Sustainability 2021, 13, 5638. [Google Scholar] [CrossRef]
- Kim, H.; Seok, H.; You, S.I.; Lee, C. An empirical analysis for mode choice in a short-distance trip with personal rapid transit. J. Adv. Transp. 2020, 2020, 7436710. [Google Scholar] [CrossRef]
- Minal; Sekhar, C.R. Mode choice analysis: The data the models and future ahead. Int. J. Traffic Transp. Eng. 2014, 4, 269–285. [Google Scholar] [CrossRef]
- Shanmugam, L.; Ramasamy, M. Study on mode choice using nested logit models in travel towards Chennai metropolitan city. J. Ambient Intell. Humaniz. Comput. 2021, 1, 1–9. [Google Scholar] [CrossRef]
- Li, D.; Wu, W.; Song, Y. Comparative study of Logit and Weibit model in travel mode choice. IEEE Access 2020, 8, 63452–63461. [Google Scholar] [CrossRef]
- Liu, Y.; Chen, J.; Wu, W.; Ye, J. Typical combined travel mode choice utility model in multimodal transportation network. Sustainability 2019, 11, 549. [Google Scholar] [CrossRef] [Green Version]
- McFadden, D. Conditional logit analysis of qualitative choice behavior. Front. Econ. 1974, 105–142. Available online: https://eml.berkeley.edu/reprints/mcfadden/zarembka.pdf (accessed on 16 July 2021).
- Ben-Akiva, M.E.; Leman, S.R. Discrete Choice Analysis: Theory and Application to Travel Demand; MIT Press: Cambridge, MA, USA, 1985; Volume 9. [Google Scholar]
- Al-Salih, W.Q.; Esztergar-Kiss, D. Linking mode choice with travel behavior by using logit model based on utility function. Sustainability 2021, 13, 4332. [Google Scholar] [CrossRef]
- Zhao, X.; Yan, X.; Yu, A.; Van Hentenryck, P. Prediction and behavioral analysis of travel mode choice: A comparison of machine learning and logit models. Travel Behav. Soc. 2020, 20, 22–35. [Google Scholar] [CrossRef]
- Hensher, D.A.; Greene, W.H. The mixed logit model: The state of practice. Transportation 2003, 30, 133–176. [Google Scholar] [CrossRef]
- Shen, J. Latent class model or mixed logit model? A comparison by transport mode choice data. Appl. Econ. 2009, 41, 2915–2924. [Google Scholar] [CrossRef]
- Viton, P.A. Will mixed logit change urban transport policies? J. Transp. Econ. Policy 2004, 38, 403–423. [Google Scholar]
- Greene, W.H.; Hensher, D.A.; Rose, J. Accounting for heterogeneity in the variance of unobserved effects in mixed logit models. Transp. Res. Part B Methodol. 2006, 40, 75–92. [Google Scholar] [CrossRef] [Green Version]
- Pineda-Jaramillo, J.D. A review of Machine Learning (ML) algorithms used for modeling travel mode choice. DYNA 2019, 86, 32–41. [Google Scholar] [CrossRef] [Green Version]
- Wang, F.; Ross, C.L. Machine learning travel mode choices: Comparing the performance of an extreme gradient boosting model with a multinomial logit model. Transp. Res. Rec. 2018, 2672, 35–45. [Google Scholar] [CrossRef] [Green Version]
- Lee, D.; Derrible, S.; Pereira, F.C. Comparison of four types of artificial neural network and a multinomial logit model for travel mode choice modeling. Transp. Res. Rec. 2018, 2672, 101–112. [Google Scholar] [CrossRef] [Green Version]
- Ko, J.; Lee, S.; Byun, M. Exploring factors associated with commute mode choice: An application of city-level general social survey data. Transp. Policy 2019, 75, 36–46. [Google Scholar] [CrossRef]
- Bocker, L.; van Amen, P.; Helbich, M. Elderly travel frequencies and transport mode choices in Greater Rotterdam, The Netherlands. Transportation 2017, 44, 831–852. [Google Scholar] [CrossRef] [Green Version]
- Munshi, T. Built environment and mode choice relationship for commute travel in the city of Rajkot, India. Transp. Res. Part D 2016, 44, 239–253. [Google Scholar] [CrossRef]
- Lu, Y.; Sun, G.; Sarkar, C.; Gou, Z.; Xiao, Y. Commuting mode choice in a high-density city: Do land-use density and diversity matter in Hong Kong? Int. J. Environ. Res. Public Health 2018, 15, 920. [Google Scholar] [CrossRef] [PubMed] [Green Version]
- Guerra, E.; Li, M. The relationship between urban form and mode choice in US and Mexican cities: A comparative analysis of workers commutes. J. Transp. Land Use 2021, 14, 441–462. [Google Scholar] [CrossRef]
- Reichert, A.; Holz-Rau, C. Mode use in long-distance travel. J. Transp. Land Use 2015, 8, 87–105. [Google Scholar] [CrossRef] [Green Version]
- Shen, Q.; Chen, P.; Pan, H. Factors affecting car ownership and mode choice in rail transit-supported suburbs of a large Chinese city. Transp. Res. Part A 2016, 94, 31–44. [Google Scholar] [CrossRef]
- Chavis, C.; Gayah, V.V. Development of a mode choice model for general purpose flexible-route transit systems. Transp. Res. Rec. 2017, 2650, 133–141. [Google Scholar] [CrossRef]
- Gunay, G.; Gokasar, I. Market segmentation analysis for airport access mode choice modeling with mixed logit. J. Air Transp. Manag. 2021, 91, 102001. [Google Scholar] [CrossRef]
- Ye, M.; Zeng, S.; Yang, G.; Chen, Y. Identification of contributing factors on travel mode choice among different resident types with bike-sharing as an alternative. IET Intell. Transp. Syst. 2019, 14, 639–646. [Google Scholar] [CrossRef]
- Bastarianto, F.F.; Irawan, M.Z.; Choudhury, C.; Palma, D.; Muthohar, I. A tour-based mode choice model for commuters in Indonesia. Sustainability 2019, 11, 788. [Google Scholar] [CrossRef] [Green Version]
- Kakar, K.A.; Prasad, C.S.R.K. Introducing of mass rapid transit system (BRT) by using aggregated and disaggregate models. Int. J. Eng. Adv. Technol. 2019, 8, 1687–1696. [Google Scholar]
- Chen, C.-H.P.; Naylor, G.A. Development of a Mode Choice Model for Bus Rapid Transit in Santa Clara County, California. J. Public Transp. 2011, 14, 41–62. [Google Scholar] [CrossRef]
- Hess, S.; Spitz, G.; Bradley, M.; Coogan, M. Analysis of mode choice for intercity travel: Application of a hybrid choice model to two distinct US corridors. Transp. Res. Part A 2018, 116, 547–567. [Google Scholar] [CrossRef] [Green Version]
- Mattson, J.; Hough, J.; Varma, A. Estimating demand for rural intercity bus services. Res. Transp. Econ. 2018, 71, 68–75. [Google Scholar] [CrossRef]
- Hu, H.; Xu, J.; Shen, Q.; Shi, F.; Chen, Y. Travel mode choices in small cities of China: A case study of Changting. Transp. Res. Part D 2018, 59, 361–374. [Google Scholar] [CrossRef]
- Lee, S. The impact of BIT on travel mode choice and bus satisfaction: The implications of smart city policy. J. Korea Plan. Assoc. 2018, 53, 85–103. [Google Scholar]
- Kim, J.; Kim, I.; Yoo, H. Choice behavior analysis for feeder modes on first and last mile with qualitative factors. J. Korean Soc. Transp. 2021, 39, 14–29. [Google Scholar] [CrossRef]
- Semanjski, I.; Aguirre, A.J.L.; De Mol, J.; Gautama, S. Policy 2.0 platform for mobile sensing and incentivized targeted shifts in mobility behavior. Sensors 2016, 16, 1035. [Google Scholar] [CrossRef] [Green Version]
- Bubeliny, O.; Kubina, M. Impact of the concept Smart City on public transport. Transp. Res. Procedia 2021, 55, 1361–1367. [Google Scholar] [CrossRef]
- Battarra, R.; Gargiulo, C.; Tremiterra, M.R.; Zucaro, F. Smart mobility in Italian metropolitan cities: A comparative analysis through indicators and actions. Sustain. Cities Soc. 2018, 41, 556–567. [Google Scholar] [CrossRef]
- Benita, F.; Bansal, G.; Piliouras, G.; Tuncer, B. Short-distance commuters in the smart city. arXiv 2019, arXiv:1902.08028. [Google Scholar]
- Fan, A.; Chen, X.; Wan, T. How have travelers changed mode choices for first/last mile trips after the introduction of bicycle-sharing systems: An empirical study in Beijing, China. J. Adv. Transp. 2019, 2019, 5426080. [Google Scholar] [CrossRef] [Green Version]
- Huang, Y.; Kockelman, K.M.; Garikapati, V.; Zhu, L.; Young, S. Use of shared automated vehicles for first-mile last-mile service: Micro-simulation of rail-transit connections in Austin, Texas. Transp. Res. Rec. 2021, 2675, 135–149. [Google Scholar] [CrossRef]
- Choudhury, C.F.; Yang, L.; Silva, J.; Ben-Akiva, M. Modelling Preferences for smart modes and services: A case study in Lisbon. Transp. Res. Part A 2018, 115, 15–31. [Google Scholar] [CrossRef] [Green Version]
- Danaf, M.; Atasoy, B.; de Azevedo, C.L.; Ding-Mastera, J.; Abou-Zeid, M.; Cox, N.; Zhao, F.; Ben-Akiva, M. Context-aware stated preferences with smartphone-based travel surveys. J. Choice Model. 2019, 31, 35–50. [Google Scholar] [CrossRef]
- Yan, X.; Levine, J.; Zhao, X. Integrating ridesourcing services with public transit: An evaluation of traveler responses combining revealed and stated preference data. Transp. Res. Part C 2019, 105, 683–696. [Google Scholar] [CrossRef]
- Dias, F.F.; Lavieri, P.S.; Garikapati, V.M.; Astroza, S.; Pendyala, R.M.; Bhat, C.R. A behavioral choice model of the use of car-sharing and ride-sourcing services. Transportation 2017, 44, 1307–1323. [Google Scholar] [CrossRef]
- Feneri, A.-M.; Rasouli, S.; Timmermans, H.J.P. Modeling the effect of Mobility-as-a-Service on mode choice decisions. Transp. Lett. 2020, 1–8. [Google Scholar] [CrossRef] [Green Version]
- Kim, Y.; Kim, E.-J.; Kim, D.-K. Developing commuters’ transportation alternative choice model in Seoul Mobility-as-a-Service. J. Korean Soc. Transp. 2020, 38, 292–308. [Google Scholar] [CrossRef]
- Ho, C.Q.; Hensher, D.A.; Mulley, C.; Wong, Y.Z. Potential uptake and willingness-to-pay for Mobility as a Service (MaaS): A stated choice study. Transp. Res. Part A 2018, 117, 302–318. [Google Scholar] [CrossRef]
- Calastri, C.; Hess, S.; Choudhury, C.; Daly, A.; Gabrielli, L. Mode choice with latent availability and consideration: Theory and a case study. Transp. Res. Part B 2019, 123, 374–385. [Google Scholar] [CrossRef] [Green Version]
- Kim, J.Y.; Kim, S.J.; Lee, G.J.; Choo, S. Estimating a mode choice model considering shared E-scooter service–Focused on access travel and neighborhood travel. Korea Inst. Intell. Transp. Syst. 2021, 20, 22–39. [Google Scholar] [CrossRef]
- Azimi, G.; Rahimi, A.; Lee, M.; Jin, X. Mode choice behavior for access and egress connection to transit services. Int. J. Transp. Sci. Technol. 2021, 10, 136–155. [Google Scholar] [CrossRef]
- Scorrano, M.; Danielis, R. Active mobility in an Italian city: Mode choice determinants and attitudes before and during the Covid-19 emergency. Res. Transp. Econ. 2021, 86, 101031. [Google Scholar] [CrossRef]
- NAACC. Mapping the City. National Agency for Administrative City Construction, Korea. Available online: https://www.naacc.go.kr/english/main.jsp (accessed on 21 July 2021).
- KOTI. Project Proposal for Sejong 5-1 Living Area National Pilot Smart City. Project Proposal; Korea Transport Institute: Sejong-si, Korea, 2018. [Google Scholar]
- KOTI. Review of Land Use Plan in 5-1 Living Area for Sejong City (Draft). Internal Report; Korea Transport Institute: Sejong-si, Korea, 2019. [Google Scholar]
- KTDB. National Transportation Statistics 2019; Korea Transport Database: Sejong-si, Korea, 2020. [Google Scholar]
- KOTI. Sejong 5-1 Smart City Transport Planning. Internal Report; Korea Transport Institute: Sejong-si, Korea, 2019. [Google Scholar]
- Louviere, J.J.; Hensher, D.A.; Swait, J.D. Stated Choice Methods: Analysis and Application; Cambridge University Press: Cambridge, UK, 2000. [Google Scholar]
- Hess, S.; Polak, J.W. Accounting for random taste heterogeneity in airport choice modeling. Transp. Res. Rec. 2005, 1915, 36–43. [Google Scholar] [CrossRef]
- Yang, C.W.; Liao, P.H. Modeling the joint choice of access modes and flight routes with parallel structure and random heterogeneity. Transp. Res. Part E Logist. Transp. Rev. 2016, 95, 19–31. [Google Scholar] [CrossRef]
- Croissant, Y. Estimation of Multinomial Logit Models in R: The Mlogit Packages; R Package Version 0.2-2; R Package: Vienna, Austria, 2012. [Google Scholar]
Publisher’s Note: MDPI stays neutral with regard to jurisdictional claims in published maps and institutional affiliations. |
© 2022 by the authors. Licensee MDPI, Basel, Switzerland. This article is an open access article distributed under the terms and conditions of the Creative Commons Attribution (CC BY) license (https://creativecommons.org/licenses/by/4.0/).