Article

More than Bike Lanes—A Multifactorial Index of Urban Bikeability

1
German Aerospace Center (DLR), Institute of Transport Research, 12489 Berlin, Germany
2
Department of Geography, Humboldt University of Berlin, 10099 Berlin, Germany
*
Authors to whom correspondence should be addressed.
Sustainability 2021, 13(21), 11584; https://doi.org/10.3390/su132111584
Submission received: 8 September 2021 / Revised: 8 October 2021 / Accepted: 18 October 2021 / Published: 20 October 2021
(This article belongs to the Special Issue Transport Sustainability and Resilience in Smart Cities)

Abstract

:
The present study aims to deduce bikeability based on a collective understanding and provides a methodology to operationalize its calculation based on open data. The approach contains four steps building on each other and combines qualitative and quantitative methods. The first three steps include the definition and operationalization of the index. First, findings from the literature are condensed to determine relevant categories influencing bikeability. Second, an expert survey is conducted to estimate the importance of these categories to gain a common understanding of bikeability and merge the impacting factors. Third, the defined categories are calculated based on OpenStreetMap data and combined to a comprehensive spatial bikeability index in an automated workflow. The fourth step evaluates the proposed index using a multinomial logit mode choice model to derive the effects of bikeability on travel behavior. The expert process shows a stable interaction between the components defining bikeability, linking specific spatial characteristics of bikeability and associated components. Applied components are, in order of importance, biking facilities along main streets, street connectivity, the prevalence of neighborhood streets, green pathways and other cycle facilities, such as rental and repair facilities. The mode choice model shows a strong positive effect of a high bikeability along the route on choosing the bike as the preferred mode. This confirms that the bike friendliness on a route surrounding has a significant impact on the mode choice. Using universal open data and applying stable weighting in an automated workflow renders the approach of assessing urban bike-friendliness fully transferable and the results comparable. It, therefore, lays the foundation for various large-scale cross-sectional analyses.

1. Introduction

Cycling as an active mode of transport has advantages at societal level in respect of CO2, air pollutant and noise emission as well as space requirements [1,2], and at an individual level when considering physical inactivity as a risk factor for common diseases of affluence [3,4,5]. Most recently, changing conditions in the transport sector caused by the COVID-19 pandemic led to a massive decline in public transport usage [6]. As a consequence, a healthy and environmentally friendly system of individual mobility with low access barriers is even more important. Earlier research found that more than half of the population can be defined as interested but concerned regarding using the bike as a mode of transport [7,8]. The choice of these people to use the bike is affected by policies. One key factor for encouraging bike traffic is the implementation of a bike-friendly built environment, i.e., road infrastructure.
Kellstedt et al. (2020) define bikeability as “the extent to which the actual and perceived environment is conducive and safe for bicycling” [9]. The idea of assessing the bikeability of an area and interrelating such to mobility behavior follows earlier approaches aiming to explain mobility patterns based on structural characteristics [10,11]. From a methodological perspective, the assessment of bikeability has developed from integrating the bicycle as a depending variable into earlier frameworks [12], over-using strongly aggregated data such as bike lanes per square mile or per inhabitant in respect of whole cities or nations to explain cycling levels [13,14,15,16], to complex concepts considering various structural characteristics [17,18,19,20,21]. To date, many studies discussing bikeability are available [9,17,20,21,22,23]. Thereby, the secondary geodata used are mostly specific data obtained from municipal or national sources [13,24] or based on specific software to gather data [25]. At the same time, other studies still include considerable individual effort by raters in the field who collect associated data within an area instead of using secondary data [26,27,28]. Even though some studies follow a detailed data driven approach in local or regional case studies with specific operationalizations [29,30], across most prior studies, the included data are thematically similar overall but may be defined and operationalized differently.
Hence, studies provide valuable insights, but it is often not possible to transfer methodologies to other regions and the comparison of the results has its limitations. In addition, due to differences in data availability, it is almost impossible to apply detailed methodologies on a large-scale when crossing national borders. The lack of compatibility between such approaches highlights the importance of using a comparable and transferable index for the bikeability of urban neighborhoods using data with comprehensive coverage in different regions of the world [24]. Recent studies partly overcome this shortage by using open data but do not use a comprehensive definition of bikeability at the same time [22,31] while others elaborate detailed definitions, which partly rely on municipal data [17,19,32]. Earlier studies identified further research gaps, such as using reliable data and different types of infrastructures [33], integrating other kinds of infrastructure, such as bicycle shops or repair facilities [34], and collecting data with systematic consideration of relevant factors [35]. Unlike a coordinated and consensual consideration of impacting factors, various earlier studies improved our understanding significantly but use bike lanes as single parameters [13,14,15,16,31]. Other studies base weighting on single experiments [17,21] or normatively determine an overall framework [24]. As different types of infrastructure may have varying implications in different groups of cyclists [30,36], it is crucial to develop a consensual and integrative understanding of bikeability [9] and show its influence using statistical models.
The present contribution aims to address the following shortcomings in the field of bikeability identified by authors of prior studies: There is lack of a consensual definition [9] and a structured framework of influencing parameters [35]. Further infrastructures such as rental or repair facilities should be integrated [34]. In addition, using open geodata is desired in order to allow transferability and applicability [24]. Therefore, we aim to develop a method that includes relevant factors of bikeability in a common understanding and to set up a workflow using open data to allow the calculation of bikeability for any urban location. In addition, we aim to assesses the informative value of the resulting index by exemplary applying a multinomial logit mode choice model to describe the enhancements of bikeability on the decision of using a bike as the main transport mode in the city of Berlin.
The manuscript is structured as follows. First, we review the literature. Second, we describe the development of the methodology, containing an expert survey and the analyses of geodata. Afterwards we evaluate the method by quantifying the influences of the developed index in a mode choice model. Then, we describe and discuss the results and draw conclusions.

2. Background: Determinants of Bikeability

It is crucial when deriving bikeability to identify relevant influencing factors. Methodologies vary widely and a growing number of studies are available. Findings are generally obtained from cross-sectional studies [24,28], interventional studies [37,38,39], stated preference studies [40,41,42,43], revealed preference studies [44] and summarizing meta-analysis [10,45,46,47,48]. In the present contribution we focus on determinants evaluating the urban infrastructure, which is to some extent adaptable and lays in the responsibility of city or transport planning. In the following paragraphs, findings from previous research are grouped into five categories: prevalence of neighborhood streets, street connectivity, biking facilities along main streets, green pathways, other facilities and further determinants. These are described below. For the following methodological approach, the most important determinants are used.

2.1. Road Types: Prevalence of Neighborhood Streets

There are various ways to operationalize the predominance of motorized traffic on different roads. Previous studies, using the number of car lanes [49], traffic volumes [50,51,52], permitted speed [53], road categories [54] or a combination of several characteristics [55], deliver varying results. Many interventional or cross-sectional studies prove the importance of calmer streets [56,57,58] while others do not [59]. Some revealed preference studies verify the preference for local roads over arterials [44,60] whereas other studies find diverging results [61] or no interrelations at all [62]. When questioning cyclists’ route preferences in stated preference studies, giving priority to calmer streets over main streets appears obvious [54] even though the preference for dedicated cycle infrastructure or off-street paths might be stronger [63].

2.2. Street Connectivity

Street connectivity or intersection density is an established infrastructural factor associated with mobility behavior [10,11,64]. Many studies prove the significance of higher intersection density on active transport routes [56,64,65,66,67,68]. When operationalizing intersection density as a directness of route in stated preference studies, low directness is found to be a hindering factor for cycling to work [52]. Less confident cyclists on the other hand prefer a low number of junctions [40].

2.3. Biking Facilities along Main Streets

Both stated preference [40,63] and revealed preference studies [44,69,70] conclude that cycle infrastructures are preferable to cycling in mixed traffic and can compensate for the adverse effects of busy streets. Many cross-sectional [13,14,16,71,72] or longitudinal interventional studies [73,74,75] also find correlations between the amount of cycle infrastructure and cycling frequency at different aggregation levels. In contrast, other cross-sectional [64] and revealed preference studies [62] refute such interrelations. One reason for inconsistent results is said to be not distinguishing adequately between different types of infrastructure in known studies [33].

2.4. Green Pathways

Findings related to cycling on green pathways appear inconsistent across all methodological approaches. Stated preference studies range from preferring off-street paths above all other routes [63] to off-street paths being less attractive than paths along arterials [54]. Similarly, revealed preference studies find no [62], low [61] or high [44,60,70] significance for choosing off-street paths. Cross-sectional studies provide contradictory findings ranging from a slightly positive [76] to no [56] or negative correlation [66]. This might be due to operationalization issues or to interrelations with other structural factors.

2.5. Other Cycle Facilities Such as Rental and Repair Facilities

As the number of bike-sharing systems increases, it is becoming increasingly relevant to analyze their impact on bikeability and cycling mode shares. Previous studies concluded that bike-sharing has a positive influence on cycling levels but needs further measures to become effective [77,78,79]. Few results illustrate the positive impact of other kinds of infrastructure, such as availability of repair facilities, air pumps or bicycle shops [79,80]. They are also mentioned as promising areas of interest and research subjects for further studies [34].

2.6. Further Determinants
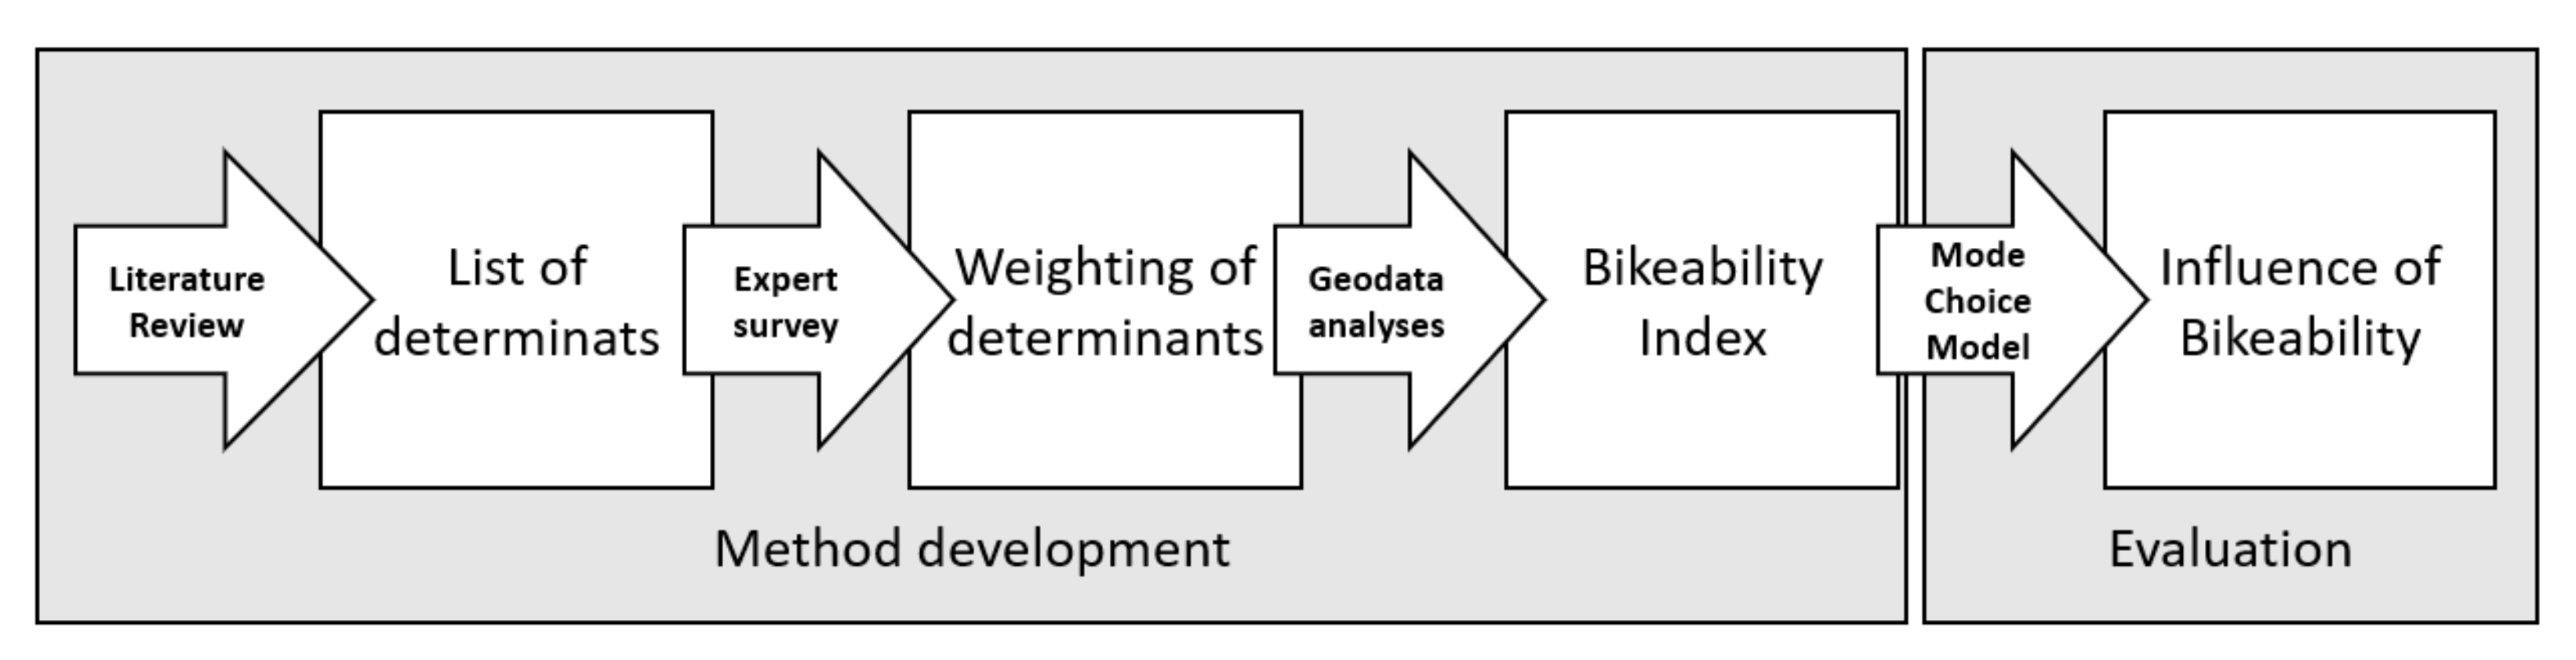
In addition to the categories listed above, several further determinants influence bicycle usage. For example, the quality of service for complementing modes of transport, such as walking or public transport, is stated to interact with cycling levels [71,81,82,83]. Moreover, the natural environment, especially slopes, strongly influences local bike-friendliness [23,24]. In addition, further road characteristic like surface quality [63,84,85] or intersection design [86] may be crucial. When aiming to explain cycling levels it may also be beneficial to include land use or built environment parameters as these influence traffic demand in general [45,87,88]. Furthermore, indicators which are caused by motorized transport such as air pollution [89,90], traffic noise [91,92] or safety considerations/numbers of accidents [93,94] can play a role. Finally, indicators mentioned above cause the specification of depending factors like perceived safety [95,96] or comfort [97,98]. These also strongly depend on individual attitudes towards cycling [7]. Even though perceived safety is a major underlaying motive, research does not prove areas with higher bikeability are objectively safer [99].

3. Methodology

The approach combines different methods and contains four steps which subsequently build on each other. The methodological approach is displayed in Figure 1. Thereby, the first three steps refer to developing the methodology. First, literature is reviewed to determine factors influencing bikeability as described above. This provides a list of determinants influencing bikeability. Second, an expert survey is conducted to rate the importance of deduced categories to arrive at a conceptual bikeability weighting of the determinants. Third, open geodata are used to operationalize parameters for each influencing category and calculate individual values. Single parameters are merged to form an overall bikeability index by using the weighting determined. Fourth, using Berlin as an application example, a model is set up to evaluate the method developed using the bikeability index in a multinomial logit mode choice model.

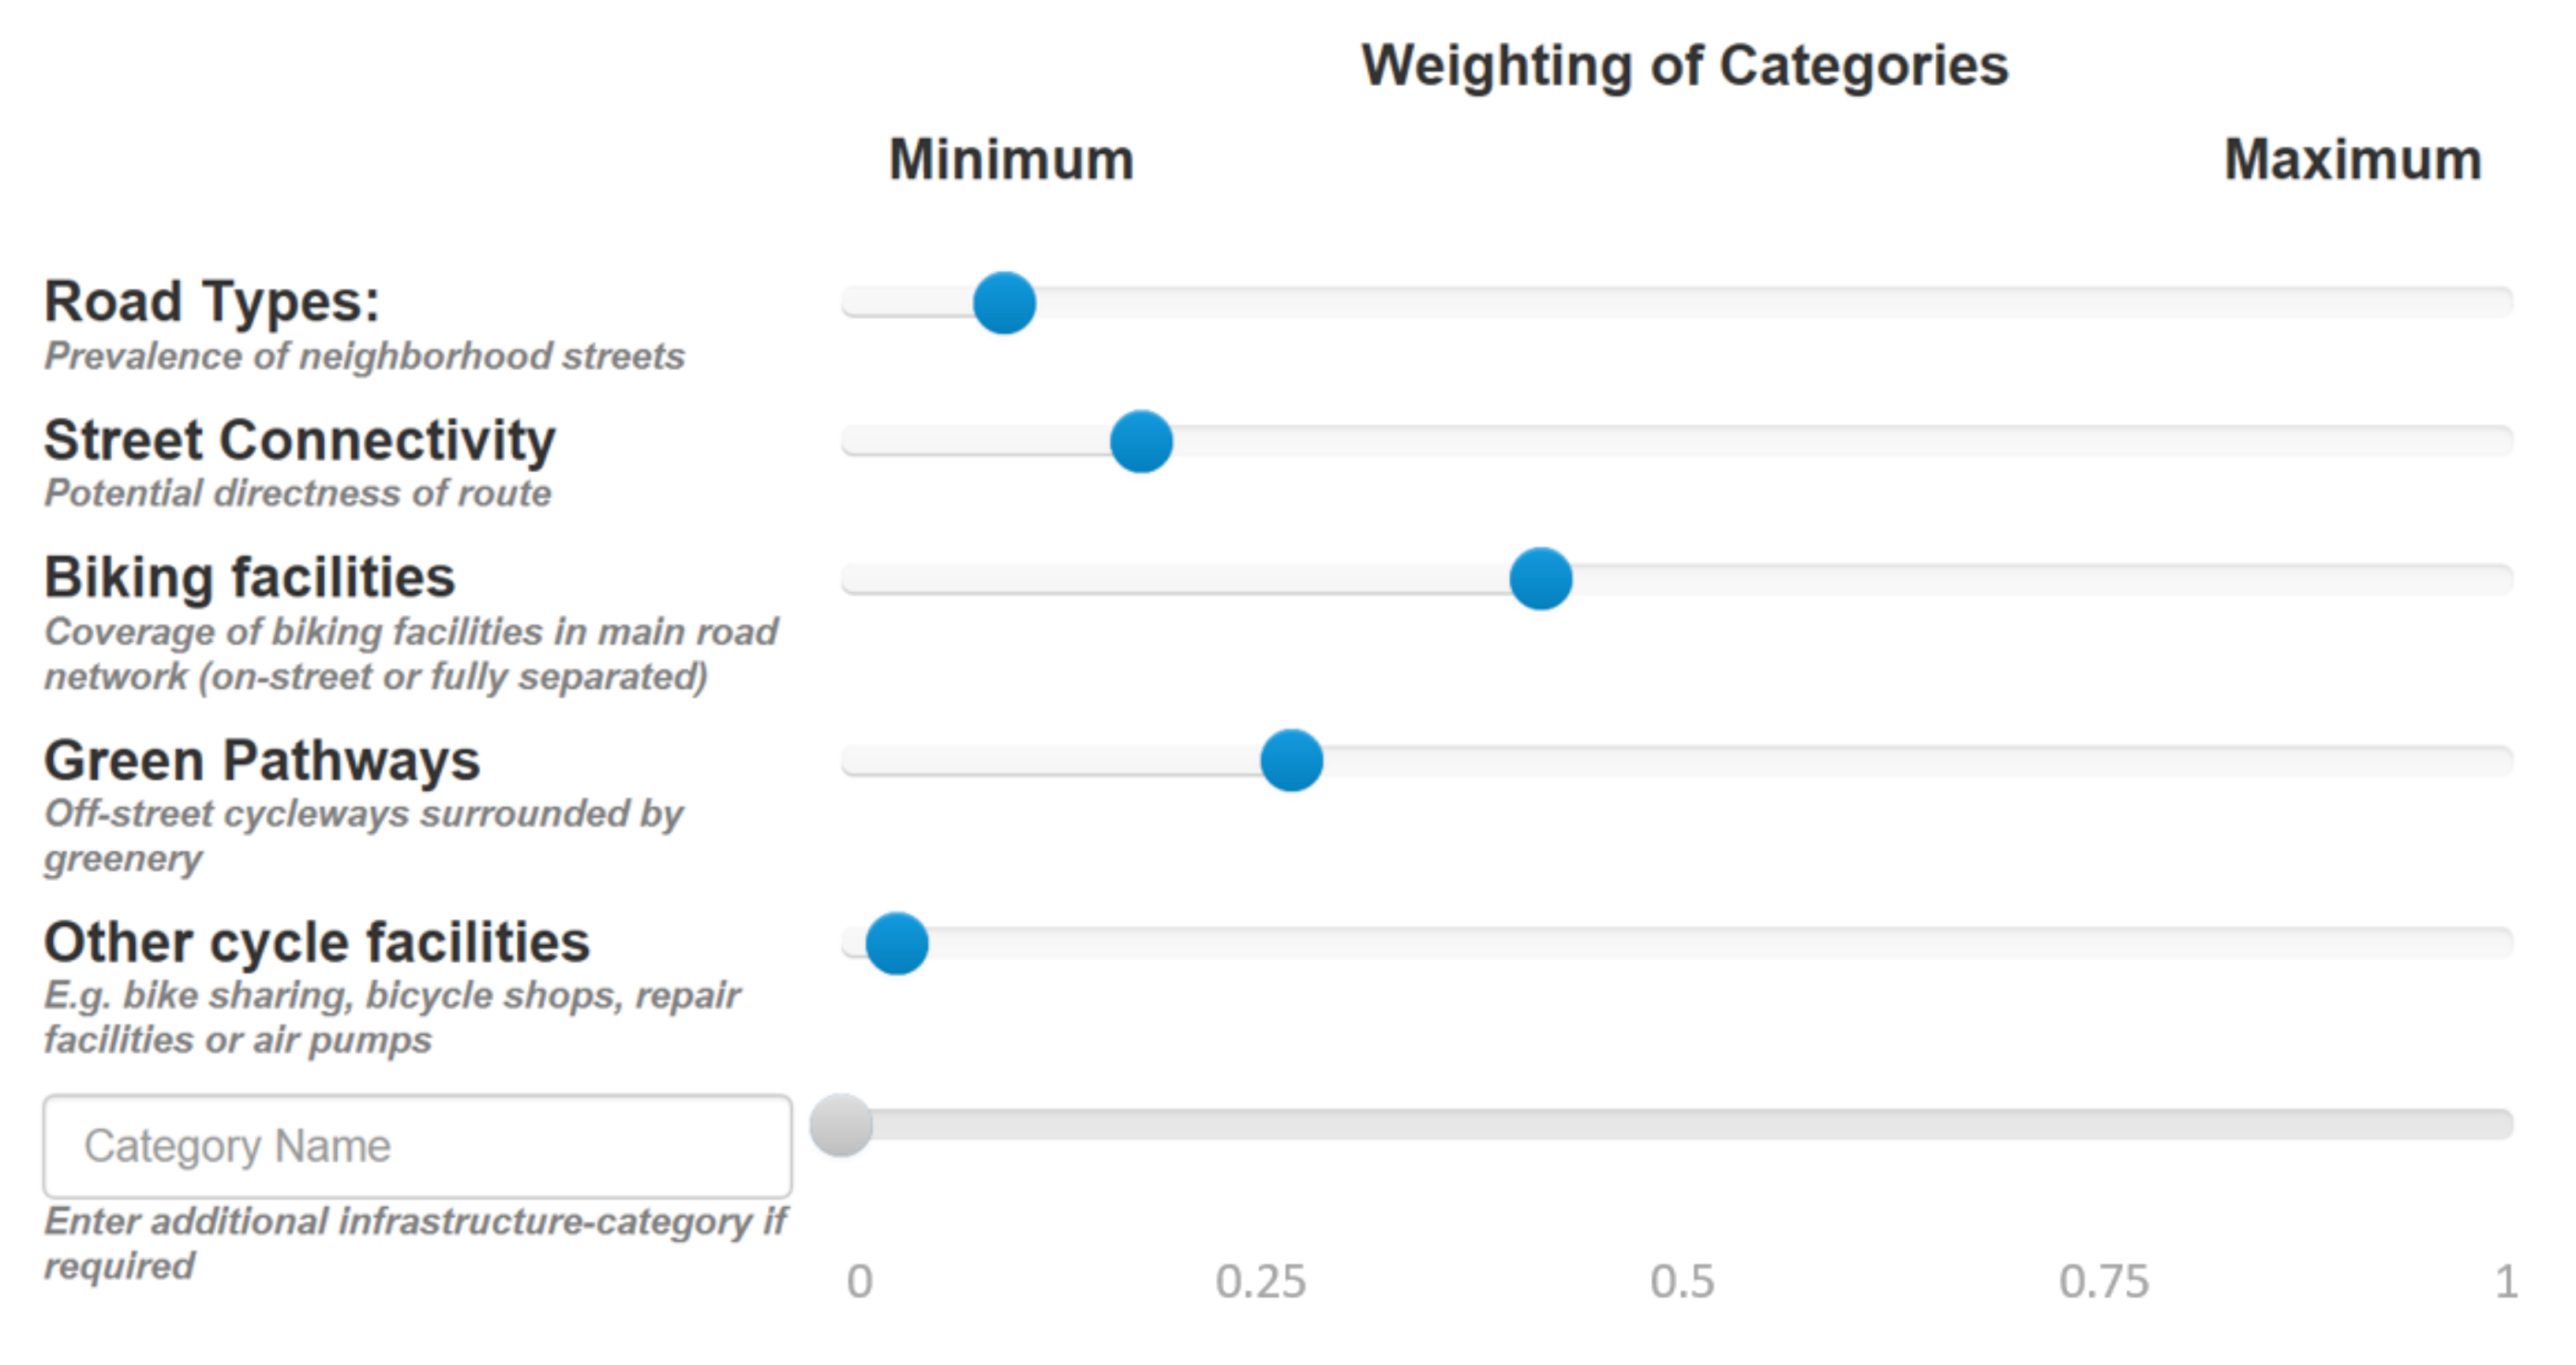
3.1. Expert Survey: Gather Weighting of Determinants

A weighting is needed to merge different environmental parameters according to their specific importance to bikeability. Consulting the authors of many studies and other cycling-experts promises a more stable weighting than referring to a single element experiment. Therefore, an expert survey is conducted to gain a common understanding of bikeability.
The survey uses a website containing one main interactive module as shown in Figure 2. Each of the five influencing categories (see section background: determinants of bikeability) is represented by a slider control. Moving the value of one category scales the other categories accordingly to add up to 100 percent. Participants are asked to apply the tool, specifying a general weighting based on their professional assessment of bikeability. Participants are also invited to add an impacting factor if they feel a category is missing. Providing this option is important in order to allow for stating other influencing factors than those predefined.
A total of 141 experts were personally invited to take part in the survey. The experts were contacted by email between 14 September and 19 September, 2016. Those invited were corresponding authors of the studies reviewed above (74) and published in the last four years, members of the research group of Germany’s National Cycling Plan 2020 (32), and other well-known experts (35). Experts were assigned a personal code relating to a separate database containing information on the reason for selection, country of residence, profession (practical or research) and gender. When answering the survey, experts were asked to “imagine an urban neighborhood which generally invites bike riding in everyday traffic” and “weigh the importance of different elements of urban infrastructure for local bikeability”. The goal was stated as calculating a bikeability index using spatial data.

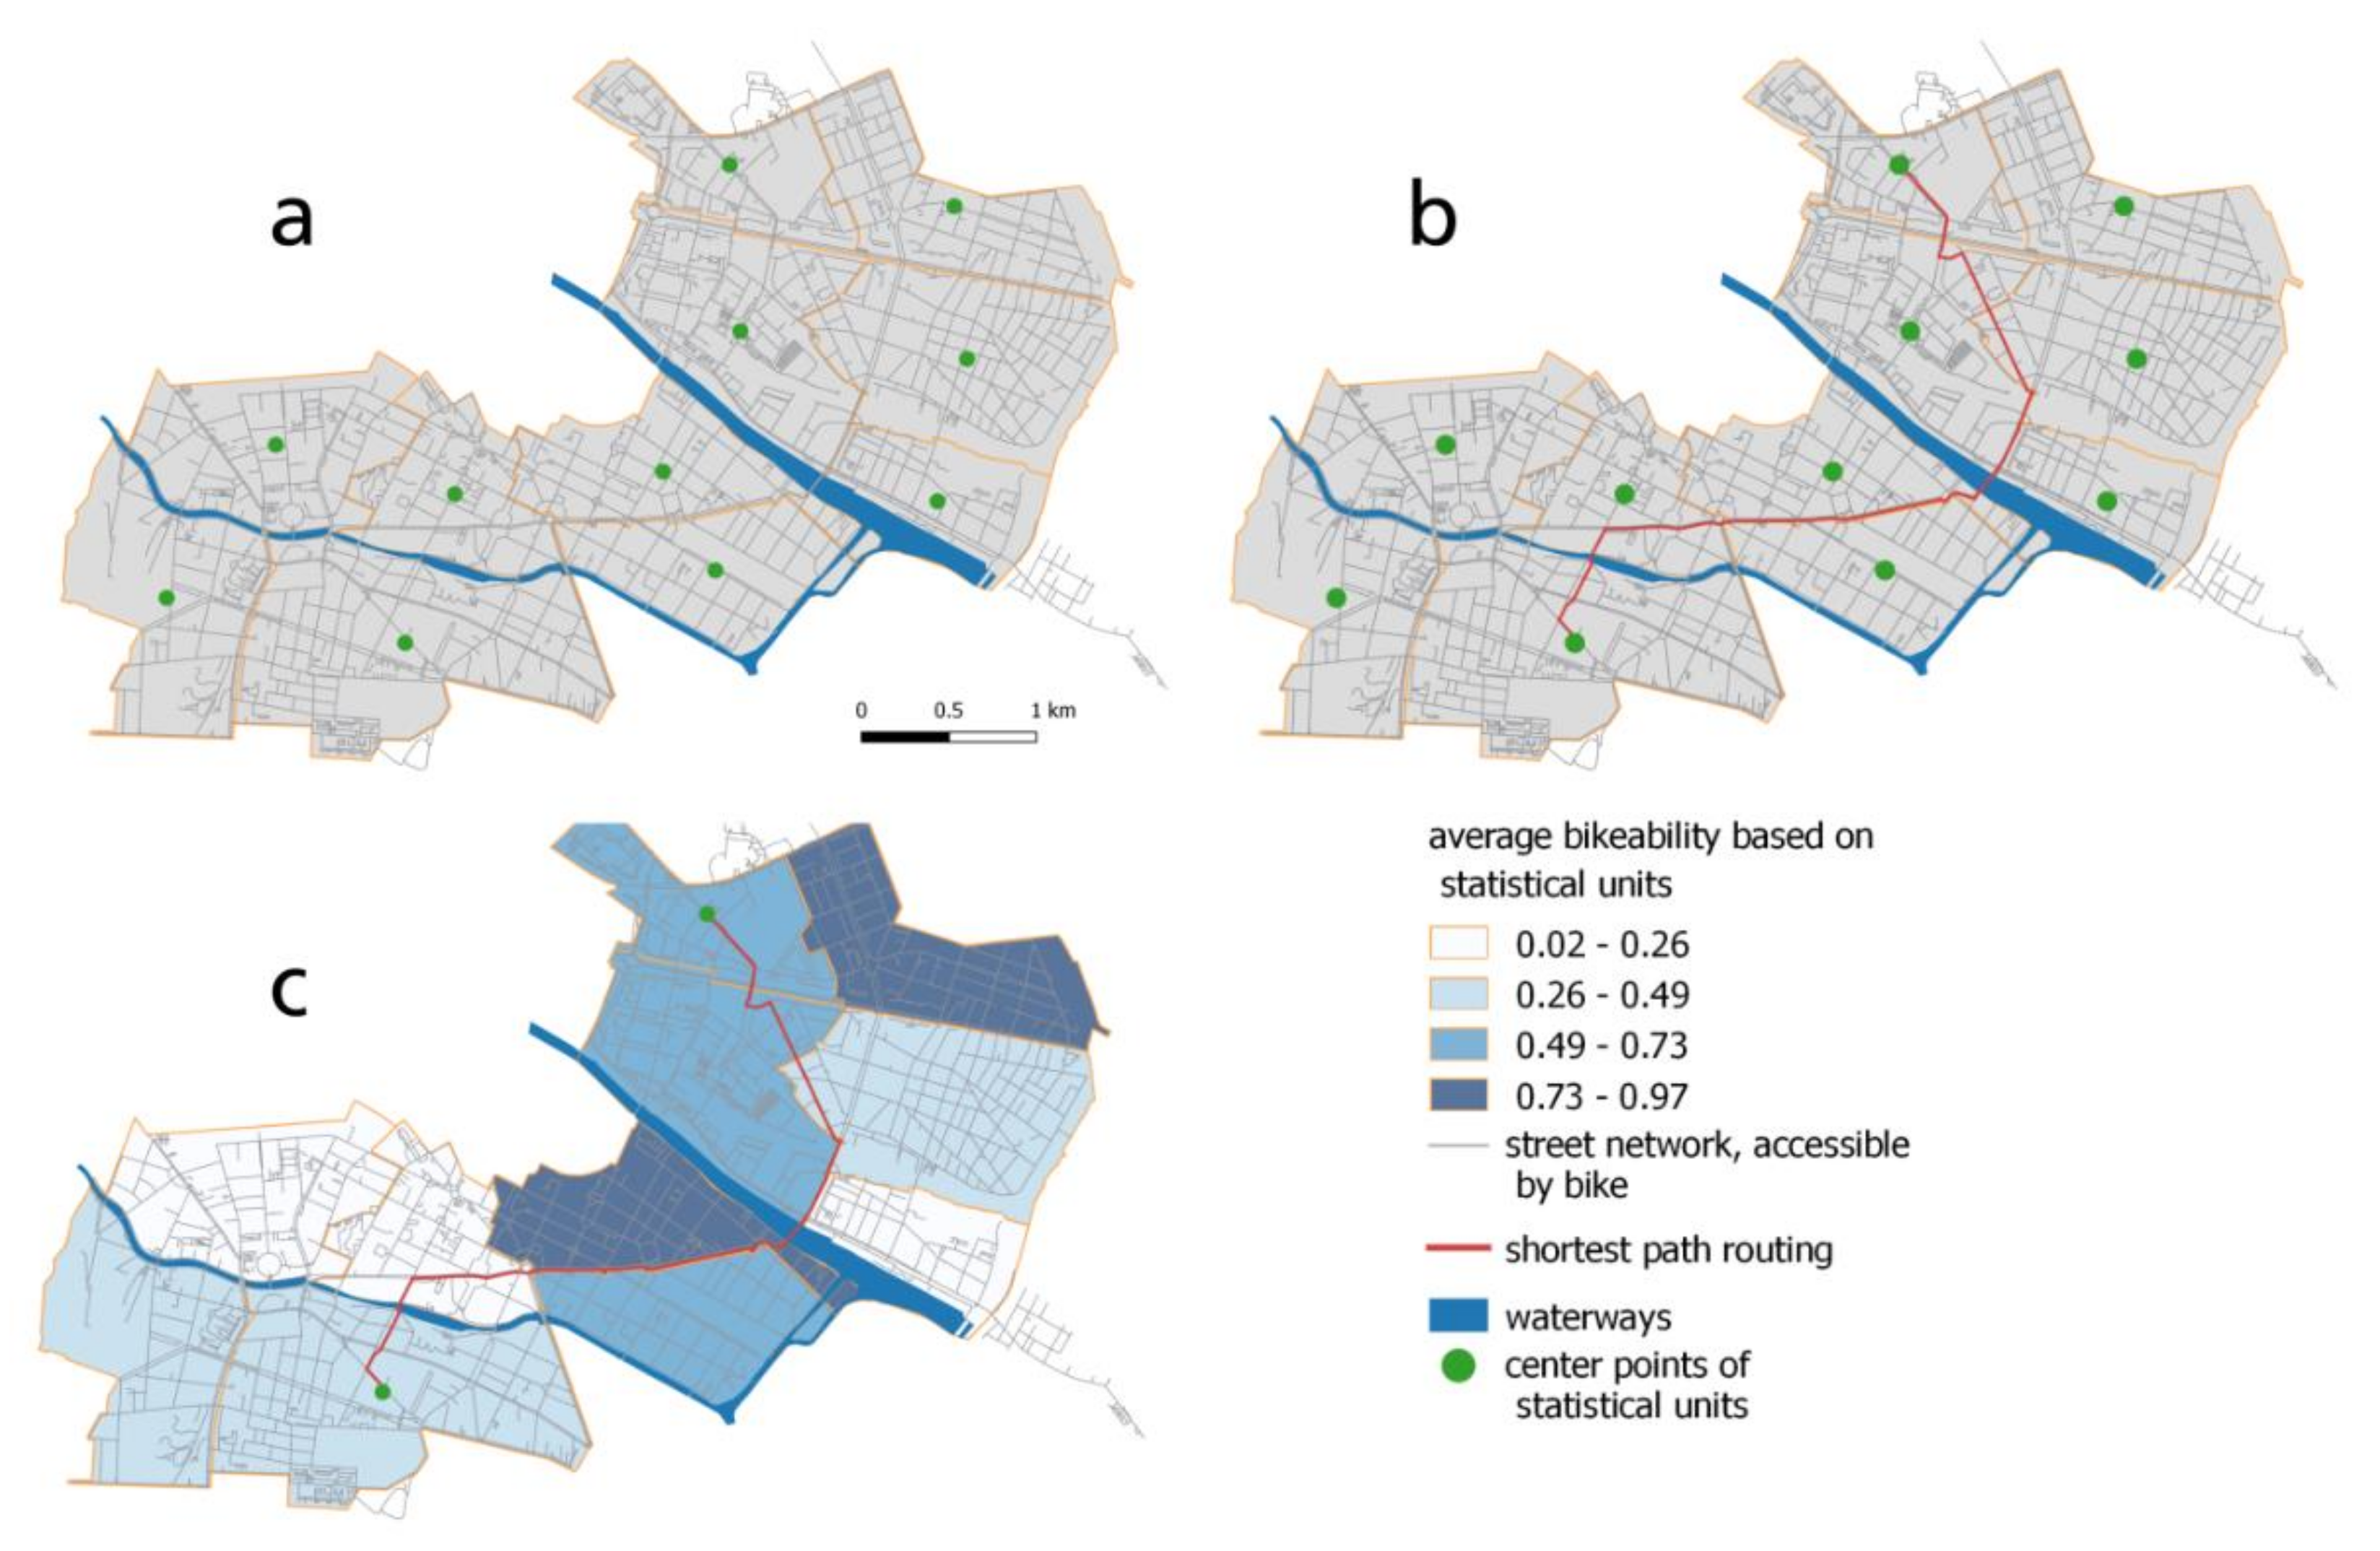
3.2. Geodata Analyses: Calculation of Parameters

To ensure the transferability of the proposed method, data from OpenStreetMap (OSM) are utilized to calculate built environment parameters [100]. OSM represents an ideal basis for this methodology due to its standardization, comprehensive coverage, high level of detail and freedom from financial and legal constraints [101,102,103]. Using OSM data, a workflow is set up to derive spatial parameters which can be calculated for any scale and extent. Each category is operationalized to a conclusive parameter allowing for various ways of tagging different types of infrastructure in the data. Different vector data sets, dividing the investigation area into grids or administrative zones (cells), can be loaded for spatial localization. Different administrative zones can also be extracted directly from OSM. Spatial indices are then calculated for each parameter. As the resulting values include different units and scales, they are standardized to permit unification into one overall bikeability index. Afterwards, the standardized values are merged using the weighting from the expert survey. Computing of individual indices for each category is described below.
To estimate road types, the road’s importance indicated in the network for motorized traffic from motorway to traffic-calmed street is used. It is assumed that the road’s importance to motorized traffic contrasts with the convenience of using that road by bicycle. This interrelation is implied in literature and the expert survey. All road segments are added up for each cell in the relevant category. The percentages of the three smaller road types (traffic-calmed, residential and tertiary streets) are added up to create an index and estimate the prevalence of small streets.
To estimate intersection density, intersections negotiable by bike are counted and the density per square kilometer is calculated. Each node in the data is analyzed. If a node is assigned to more than one highway, it is defined as a crossing street line. As intersections often contain a number of crossing street lines, a cluster algorithm based on the DBSCAN [104] is used. Every cluster identified corresponds to one intersection.
To calculate the coverage of cycle facilities along main streets, the two main street categories usable by bicycle (primary and secondary) are analyzed. When calculating the coverage of biking facilities, both the variety of facilities that exist and different ways of tagging them are taken into account. Here, cycle lanes at street level and separated cycle tracks are considered by analyzing properties of the main street segment. Cycle tracks are also tagged as separate routes adjacent to the road when separated by grass or hedges. To capture these adjacent routes, a 10-meter buffer is placed around each street segment to identify cycle tracks running parallel to that segment. In each cell, the percentage covered by three types of facilities is calculated for both the types of streets and the direction of traffic. When added, the result is the percentage coverage of main streets with cycle infrastructure.
To approximate the prevalence of green pathways, all public green areas accessible by bike are taken into account. In this case, differently tagged areas often overlap. For instance, small-wooded areas within parks consist of two overlay polygons which are considered using an overlay algorithm. The area of public green spaces in each cell is added up and the percentage share of greenery in each cell is calculated. The actual length of trails is not taken into account as there is a significant difference between the density of tracks running through green spaces and local tagging behavior in the OpenStreetMap. In some areas every beaten track is included in the data. In others only official main pathways are tagged. Counting the length of paths would lead to distortions.
The category rental and repair facilities aggregates bike-sharing stations and bicycle shops providing repair or rental services in each cell. The amount is added up and the density per square mile is calculated.

3.3. Mode Choice Model: Influence of the Bikeability

In order to evaluate the influence of the calculated index on choosing the bike for a single trip a mode choice model has been applied. Basis of this analysis is the municipal household travel survey data (SrV) of the year 2008, which provides information about 73,667 valid trips within Berlin, 10,234 of them were covered by bicycle [105]. In our case valid means that all trips start and end within the city border of Berlin, that they do not start and end in the same cell and that they do not include null values or values that are not plausible. The survey includes information about each trip (length, origin and destination area, trip purpose, main transport mode, etc.) and the conducting person (age, employment status, availability of a car or public transport ticket, etc.), aggregated to the spatial level of the 195 statistical units of Berlin (see Figure 3). Therefore, it is not possible to obtain the exact start and end points of single trips. Due to this limitation, center points of the respective districts have been calculated and used as origin and destination locations (see Figure 3a) as an approximation. Afterwards, a shortest path routing on the bike network has been applied between each pair of center points (see Figure 3b) and the obtained routes were subsequently intersected with the districts and associated bikeability values (see Figure 3c). Finally, the bikeability values of the crossed districts have been summed up and averaged for each trip.
In order to evaluate the influence of the calculated bikeability index on the choice of using the bike as primary mode instead of motorized transport for a respective trip a multinominal logit (MNL) model has been applied.
The MNL model is based on the assumption, that an individuum that faces a decision between distinct alternatives chooses the alternative that comes with the highest utility. The random utility theory, under the assumption of additive linearity, states that the utility (U) of one alternative is the sum of their single components (X) and an independent and identically distributed (i.i.d.) error term (ε). The utility of one alternative can then be formulated as:
U = X β + ε
where the parameters β are to be estimated and reflects the influence of the respective components X [106,107].
The dataset used for estimation includes all trips of the trip data described above, which are made by car, bike, public transport or foot as the corresponding main mode. From this, the dataset was cleaned by removing trips with implausible travel speeds (e.g., car trips faster than 100 km/h on average or walking trips over 7 km/h) and trips with distances less than 500 meters, which then reduces the dataset to a final of 48,825 observations. The dataset contains several properties of each conducted trip (the original route and mode), which were stated in the survey. As the model requires information on the alternatives which were not chosen, we calculated these respective route characteristics of the alternatives for each trip using the modes that were not chosen in the observed original trip (e.g., travel times and costs for public transport, car or bicycle).
The components of the utility function used for the estimation consists of trip attributes as well as person attributes. The former includes mode specific cost and travel time of the trip and the bikeability index for bike trips, the latter contains the age of the respondents and the availability of a public transport season ticket. The car availability of participants is considered in the availability of alternatives, i.e., a person without access to a car will not be given an alternative to drive. All attributes used are shown in Table 1, enhanced with a short description and the minimum, maximum and mean value. It is important to note that the statistics are based on the values of all alternatives, including those which were not chosen.

4. Results

4.1. Expert Survey

With 57 valid responses, the return rate for the survey is 40.4%: one third from females and two thirds from males. 33 (58%) respondents are from Germany, 13 (23%) from other European countries and 11 (19%) from America. The profession for 44 (77%) participants is researcher while 13 (23%) are working in practice. One third of all respondents published at least one related peer-reviewed article in the last four years.
Table 2 shows the results of the participants’ assessment of bikeability. Biking facilities along main streets are the most important component of bikeability but also show the highest variations in ratings. Further components are, in order of importance, street connectivity, prevalence of neighborhood streets and green pathways. Other cycle facilities are less important. Apart from assessing the described categories, one third of respondents (19) added and rated an individual category. Six respondents mentioned parking. Surface quality was also mentioned three times. Other categories were entered only once and were partly outside the scope of factors influencing infrastructure. When mentioned, both parking and surface quality attracted relatively high values (18.9 or 20.6 percent, respectively, on average). As most experts did not feel a category in addition to the five predefined important, the mean value for the additional category stays low. Providing this option was important for the process to allow for further determinants. Results show that experts confirm the predefined categories and use the option of adding new categories rarely.
Variances in the experts’ assessments were compared across various groups (gender, profession, location of residence), resulting in no substantial differences regarding the subgroups under consideration. Statistical tests found no significant differences regarding means and variance in any of the components across the groups. Table 3 compares the experts’ assessment in Europe and America as different regions of the world. As seen, there are no structural differences. Experts based in Europe rate the prevalence of neighborhood streets slightly higher while experts based in America value biking facilities along main streets a bit higher.

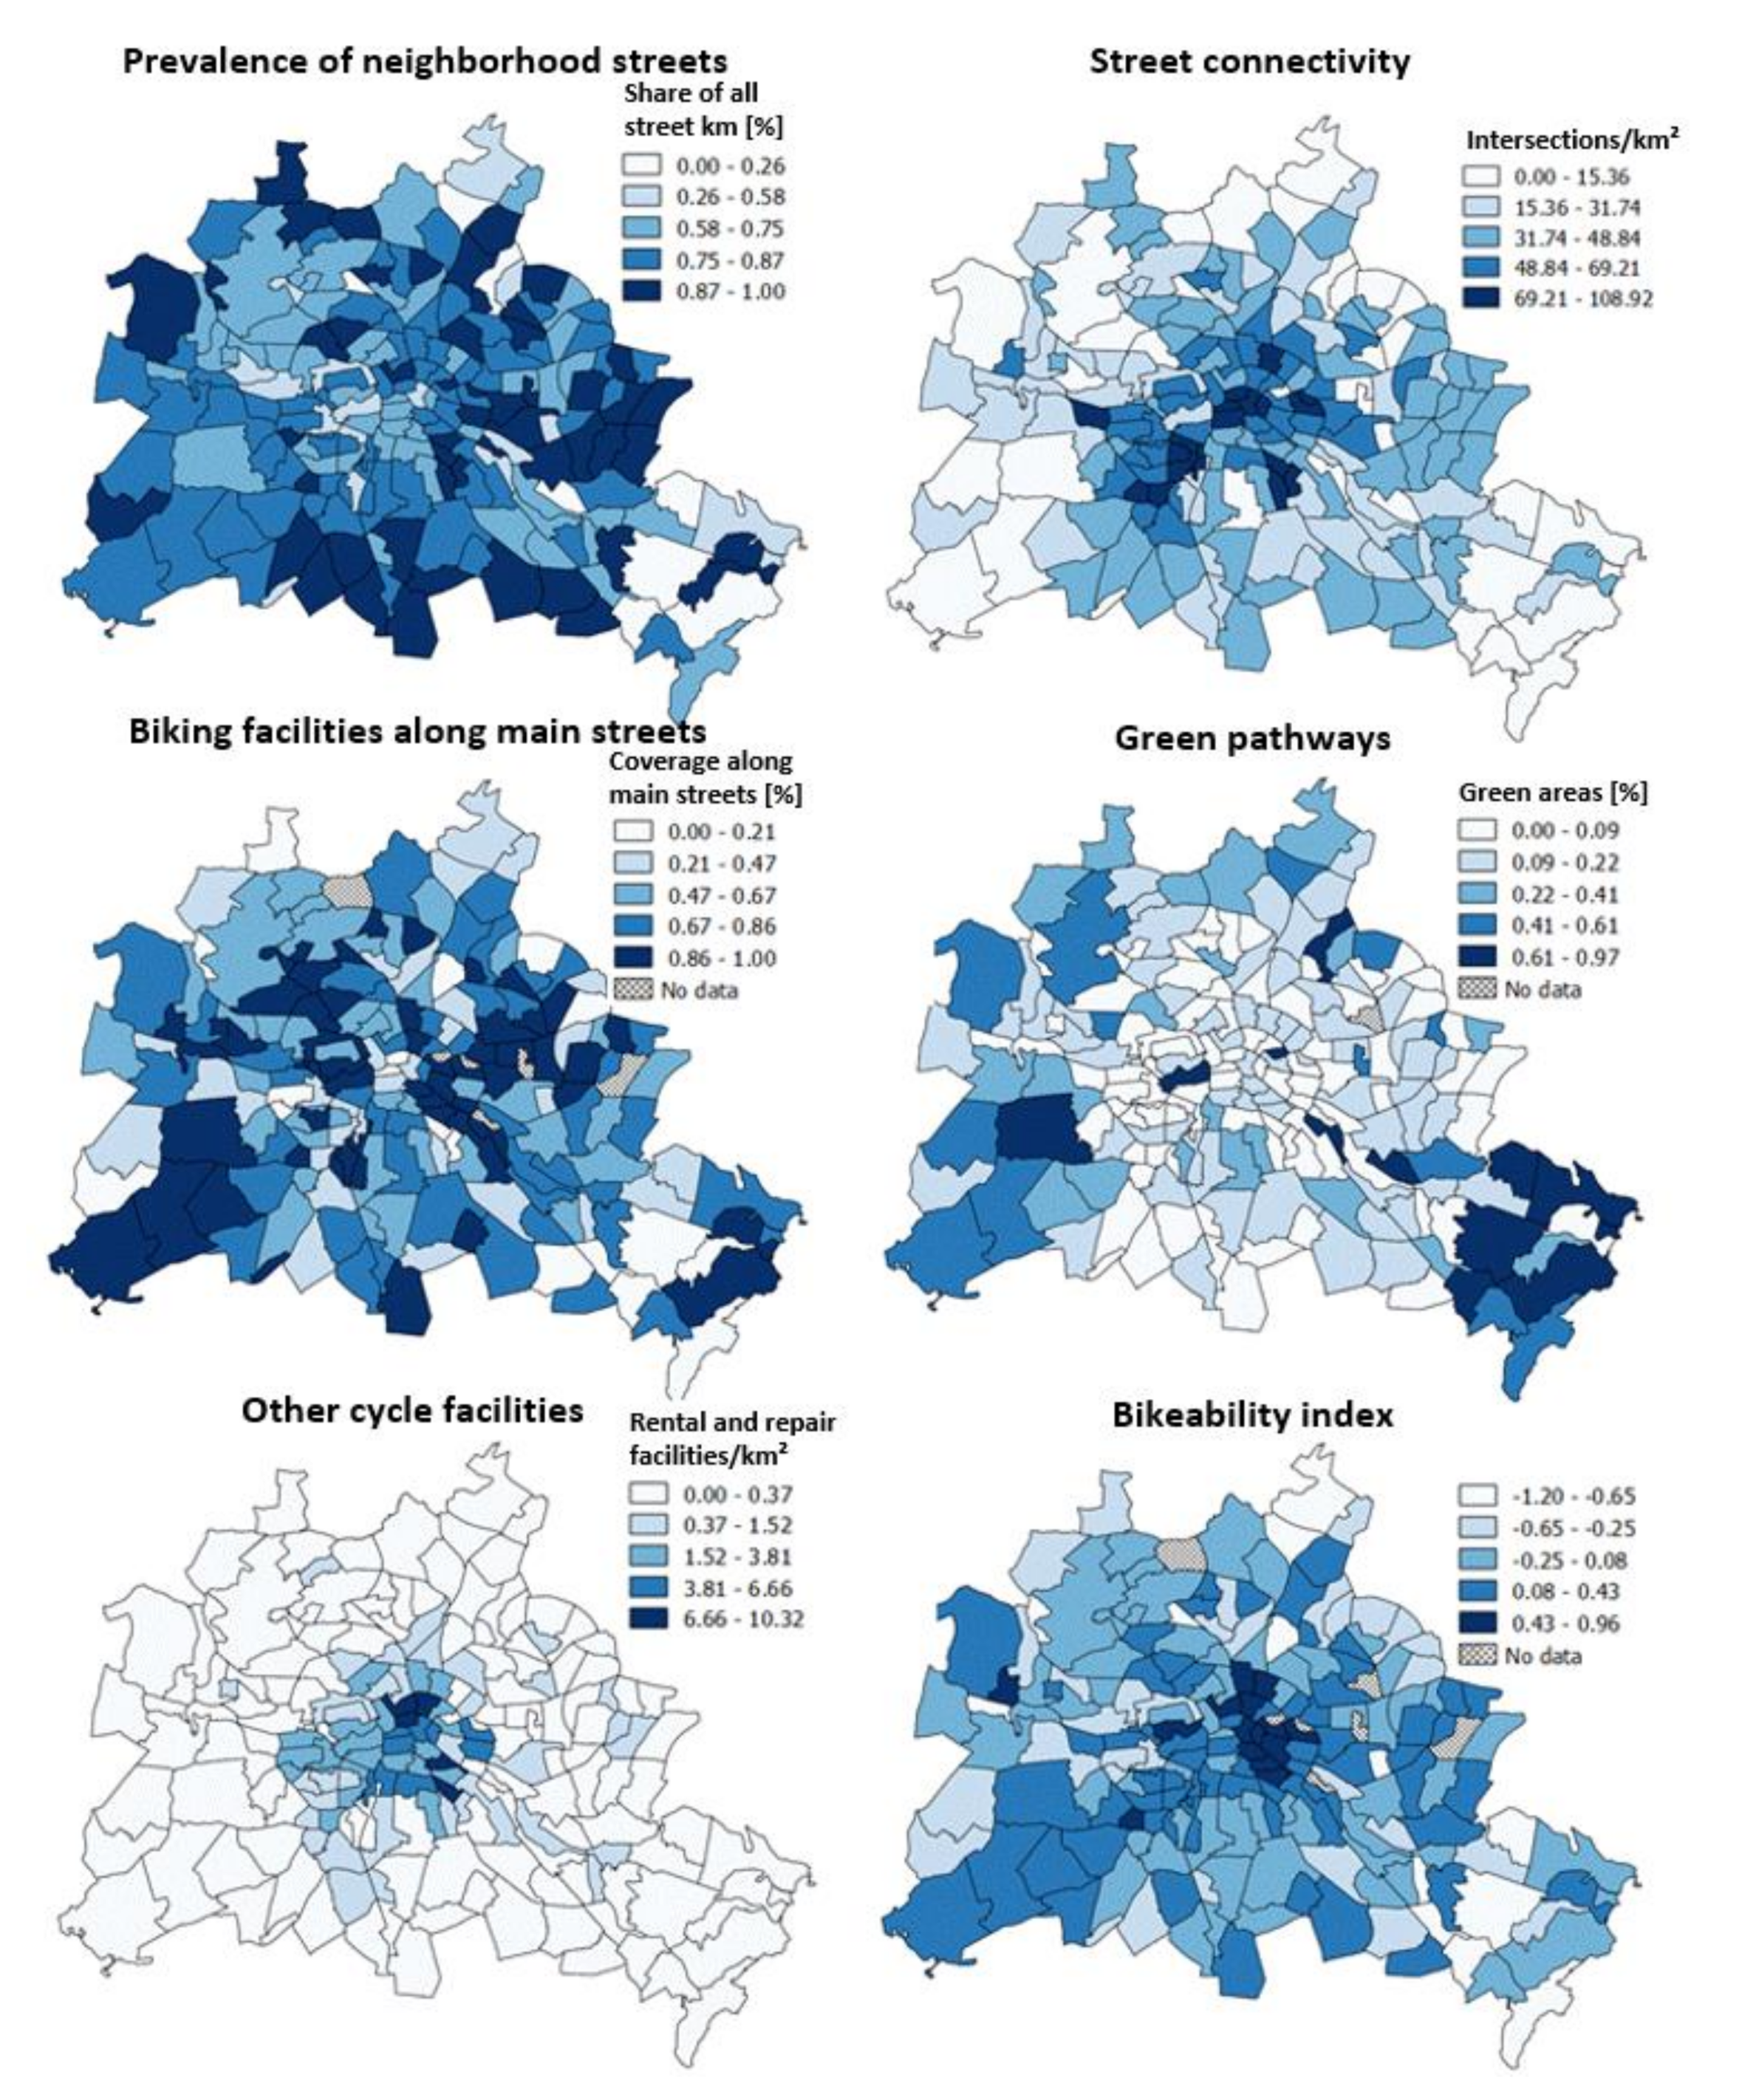
4.2. Characteristics of Parameters

Results are calculated using the example of Berlin, Germany, as proof of concept and to analyze intra-city characteristics and evaluate the methodology.
The structure of the network differs greatly when considering road types. Motorways and trunk roads form a loose network and are only present in a few districts. However, the percentage share of motorways in one particular cell is more than 45%. Primary streets appear as a star-shaped network with relatively low shares of 5% on average and a rather low variation. Secondary and tertiary streets account for substantial shares in the network with 17 and 11 percent, respectively, on average. Residential streets dominate most districts with 62% on average but ranging from 0 to 100%. Traffic-calmed streets account for low shares in many districts and also show dispersed distribution with high shares locally in a few districts. As shown in Table 4, small streets account for large shares in most districts. Table 4 shows the statistical characteristics of all input parameters for bikeability. All values range widely.
Figure 4 shows the spatial characteristics of the inner-city distribution of single values and the overall index based on Berlin. Darker colors indicate higher values. With regard to the individual parameters, the share of small streets (top left) shows a distribution with generally higher values in outer districts. The map of intersection density (top right) shows a centered distribution with the highest values in inner districts. The denser districts in the city center are characterized by a highly connected street network compared to lower intersection density in outer districts. The coverage of main streets with cycle facilities (middle left) appears in a highly dispersed distribution. The share of greenery (middle right) is highest in outer districts with the large green areas in the west and south-east easily recognizable. The spatial density image of rental and repair facilities (bottom left) shows a clear centered distribution with very low values in large parts of the outer city. When considering the distribution of the merged overall bikeability index (bottom right), the highest values are seen in the eastern part of the city center as well as in certain other districts. The trend towards higher values in inner city districts is evident but there are dispersed characteristics as well.

4.3. Influence on Mode Choice

The estimation results of the applied mode choice model presented in Section 3.3 are shown in Table 5, including the value of the estimator, the standard deviation, their respective t-values and p-values. The model was estimated using Biogeme [108]. The overall model performance is good with a rho square of 0.403, while all results are significant at a 5% level. Further, the parameter signs are as expected, i.e., parameter values for travel cost and travel times for all modes are negative. The age parameters indicate that the older a person is, the more likely they are to choose car (0.0254) or bike (0.0251) or even walk (0.0151), rather than use public transport. The availability of a seasonal public transport pass on the other hand reduces the likelihood of using a car (−0.245) compared to public transport, which is in line with expectations. Those respondents having a seasonal public transport pass have also a higher chance to bike (0.332) or walk (2.31). Taking a closer look to the travel time parameters, it can be stated that the time riding a bike is perceived much more negative (−0.299) than time spend on any other mode. The disutility of travel time by public transport comes next with a parameter estimate of −0.0324, while the time spent walking (−0.00271) or driving (−0.01) is perceived less negative. The alternative specific constants (ASC), capturing the utility not included by other variables in the model, show a higher utility for bike and train compared to the car and lower utility for walking.
Regarding the bikeability parameter estimated by the model, a strong positive effect (0.518) of a high bikeability index along the route on choosing the bike as preferred mode can be observed. This confirms that the bikeability along a route has a significant impact on the choice of mode when making a trip. Furthermore, it shows that the bikeability index derived in this paper performs well in collecting and representing the information, which is crucial to describe bike friendliness along spatial areas.

5. Discussion

In this study, an approach to assess the bikeability of urban infrastructures using open data is demonstrated. At the same time, the relevance of individual methodological components is evaluated. These components are built on each other and form the consistent overall framework of this approach. Thereby literature review, expert survey and operationalization of parameters are crucial to establish the index while the model evaluates its applicability by quantifying significant positive influences of bikeability on mode choice.
The results of the conducted expert survey confirm the relevance of parameters determined from the literature. Key insights from the survey are the weighting itself and the consistency of the determined weighting across different subgroups of participants. This stable weighting enables an approximation of bikeability based on the joint assessment of many experts. In contrast to analyzing individual parameters [13,14,15,16], the joint integration of different parameters improves the approximation of bikeability and provides a more realistic overall picture—one main benefit of the present research. If the framework obtained in the expert survey is compared to recent integrative approaches, it is seen that the three most important categories (biking facilities along main streets, street connectivity and prevalence of neighborhood streets) are similar [21] even with some differences in ranking and operationalizing values. Refining previous approaches [24] and basing the calculation on broad expert assessment ensures an appropriate appraisal of bikeability.
Results of geodata analysis in Berlin show that OSM open data cover each part of the city sufficiently and are accurate enough as a basis for the analysis. The method of operationalizing categories to parameters also enables an approximation that characterizes the city well with regard to bikeability and its components. In combination with high accuracy and topicality of the data [101,102,103], it can be assumed that this approach allows transferability and consistency between municipalities and across national borders as desired by previous studies [24]. At present, limitations on data availability still exist, particularly in Asian countries. Using Berlin as an example, it can be seen that indices for individual parameters vary significantly within the city. Each index shows a specific statistical distribution and a characteristic spatial distribution. Remaining area-based, the method is appropriate for abstracting characteristics of points (rental and repair facilities, intersections), lines (road types and coverage of biking facilities) and polygons (green areas) and for merging different parameters at any district level in urban areas.
Overall, the mode choice model confirms the influence of the bikeability index on the choice of using the bicycle as a primary mode of transport for the example of Berlin. Thereby, the model performs quite good as indicated by a rho square value of 0.403. This is especially valid against the background that choosing the bike as a mode of transport generally has several impacting factors. Especially personal attitudes and preferences are difficult to model. Thereby, 56% of the population, the “interested but concerned” are seen to be the key target market to increase cycling and, therefore, accordingly sensitive for the impacts of a bike-friendly urban environment [7]. This conversely means almost half of the population is not sensitive to differences in bikeability. Hence, modeling the usage of bike as based on spatial data is unlikely to show high coefficients of determination. Correspondingly, Winters at al. (2016) found coefficients of determination of about 0.35 [24], Dill and Carr (2003) a range from 0.18 to 0.3 [14]. Relating the results to the “interested but concerned” [7] also emphasizes the importance of the individual when measuring the impact of bikeability on bicycle usage. Prior research found a strong interrelation of objective and subjective risk when cycling even though several specific road attributes are associated with an over- or underestimation of the actual crash risk [96]. However, the areas with higher bikeability are not generally safer [99]. While these considerations are at much higher level of detail than the present index allows to render, linking bikeability and (perceived) safety is a future research topic of interest.
With a closer look, all parameters in the model perform as expected in regard to their sign and value. This is true for both cost and travel time parameters as well as additional parameters such as the availability of a public transport season ticket. The negative parameter values for cost and travel time and the more negative perception of travel time when riding a bike or using public transport compared to driving a car, which can be explained by the effort needed for long bike rides and the discomfort of travelling with other people in crowded vehicles in public transport, which are in line with other literature results [109,110].
According to the field of operation, there are various options to adopt the index: at present, different designs of cycle facilities are analyzed in an aggregated way. Here, differently recorded infrastructures (i.e., bike lane vs. bike path) could be evaluated in detail. The parameter used for road categories indicates the importance of each road for motorized transport. In the present study, this parameter approximates the level of disturbance cyclists experience due to passing vehicles. Results show that the road network configuration differs between statistic units but extreme differences in the results are rare. Future research could take account of road construction standards, such as the number of lanes or speed limits, as shown in earlier studies described in the literature review section, and could evaluate whether significant interrelations can be observed. It could also include parameters approximating bicycle parking and surface quality since these categories were mentioned in the expert survey. This information is not included in OSM in sufficient quantity at present. Due to exponential growth in OSM, the information may be available in the future. Regarding the parameters used, this index focuses on urban infrastructure that is adaptable to a certain extent. It is, therefore, meant to understand bikeability that is in the responsibility of local or regional authorities. When aiming to draw a more comprehensive picture of bikeability than the scope of the present study, future research can easily integrate a control variable such as topography, which may also be extracted from OpenStreetMap.
Compared to earlier research, the present approach addresses shortcomings of prior studies, namely, a common definition of bikeability [9,35], a systematic valuation of relevant factors [34] and the use of open geodata [24]. From a methodological perspective, combining these issues is the main difference to valuable prior approaches, such as [17,21,24]. In addition, the present approach is fully transferable and enables the assessment of bikeability on any spatial level in large parts of the urbanized world. Hence, the present research lays the foundations for diverse large-scale analyses and may upgrade earlier results by refining the approximation of bikeability [13,21,24] and integrating comparable bikeability measures in cross-nation comparisons [12]. Regarding the results, the present study is in line with earlier studies identifying the great importance of dedicated cycle facilities [13,21,24,71] and intersection density [60,66,67,68].
The limitations of the approach are discussed in the following. First, there is always a trade-off between level of detail on one side and transferability and applicability on the other side. As described, in this contribution we focus on the latter. We, therefore, cannot integrate all potentially influencing factors due to limitations in data availability, differences in operationalization and different impacts for specific user groups. Second, experts may have different impression on the factors they rated. Since we aim to define a global definition, we did not predefine the factors or describe the operationalization. It is possible that some experts thought of different pictures than others. Given the large number of experts, their different background and no significant differences across groups, we believe we gathered a good mean weighting of the categories. Third, the geodata analyses limits the ways of operationalization. This is discussed in the methods section for instance regarding the parameter green pathways. Given the data and the objective of ensuring transferability, we believe that, despite uncertainties caused by operationalization issues, the developed index is a proxy for the bike-friendliness of urban infrastructures. Fourth, regarding the model, we do not know the exact routes chosen by the participants of the survey. As an approximation we use a shortest path routing from the start to the destination area. Since we assume that at least some participants accept detours to have a more pleasant routes, the bikeability of some bike trips might be higher than supposed in the model. Therefore, the influence of the bikeability index might be slightly underestimated in the model.

6. Conclusions

In the present contribution, a conceptual approach of deriving bikeability of urban infrastructure is proposed. The multifactor index is based on a literature review and an expert survey followed by geodata analyses. By developing a common weighting assessed by the group of experts, using a systematic framework including various influencing factors and analyses based on open geodata, the approach addresses shortcomings identified in prior research.
Thereby, the results of the expert survey provide a stable weighting of the influencing factors of bikeability, which are, in order of importance, biking facilities along main streets, street connectivity, the prevalence of neighborhood streets, green pathways and other cycle facilities, such as rental and repair facilities. The resulting bikeability in return shows a strong positive effect on choosing the bike as the preferred mode in the mode choice model.
Using open data only guarantees nearly unlimited transferability. Therefore, the method lays the foundation for large-scale analyses to evaluate the impact of bikeability on cycling mode shares and other dependent variables regardless of administrative borders and according to limitations in data availability. Being able to assess bikeability with high spatial resolution in an automated process will make it possible to carry out comprehensive large-scale analyses on interrelations between bikeability and, for example, public health or collision rates. The example of Berlin shows that the index adds a significant parameter with high impact when aiming to explain choosing the bike as a mode of transport.

Author Contributions

Conceptualization, M.H.; methodology, M.H., M.L., S.N. and J.W.; software, S.N. and M.L.; validation, S.N. and M.L.; formal analysis, S.N., M.H., M.L. and J.W.; investigation, M.H.; data curation, M.L. and S.N.; writing—original draft preparation, M.H., S.N. and J.W.; writing—review and editing, M.H.; visualization, S.N.; supervision, M.H.; project administration, M.H.; funding acquisition, M.H. All authors have read and agreed to the published version of the manuscript.

Funding

The project is funded by the German Federal Ministry of Transport and Digital Infrastructure using resources from the National Cycling Plan 2020 (NRVP).

Data Availability Statement

The data that support the findings of this study are available upon reasonable request from the authors.

Acknowledgments

The authors acknowledge all experts who participated in the survey.

Conflicts of Interest

The authors declare no conflict of interests.

References

  1. Ahrens, G.-A.; Becker, U.; Böhmer, T.; Richter, F.; Wittwer, R. Potential of Cycling to Reduce Emissions in Road Transport; Federal Environment Agency (Umweltbundesamt): Dessau-Roßlau, Germany, 2013.
  2. Makarova, I.; Mavrin, V.; Magdin, K.; Shubenkova, K.; Boyko, A. Evaluation of Sustainability of the Transport. System of Urbanized Areas Considering the Development of Bicycle Transport. In TRANSBALTICA XI: Transportation Science and Technology; Springer Nature: Vilnius, Lithuania, 2019. [Google Scholar]
  3. Lee, I.M.; Shiroma, E.J.; Lobelo, F.; Puska, P.; Blair, S.N.; Katzmarzyk, P.T. Effect of Physical Inactivity on Major Non-Communicable Diseases Worldwide: An Analysis of Burden of Disease and Life Expectancy. Lancet 2012, 380, 219–229. [Google Scholar] [CrossRef] [Green Version]
  4. OECD/ITF. Cycling, Health and Safety; Forum, O.I.T., Ed.; OECD Publishing/ITF: Paris, France, 2013. [Google Scholar]
  5. Mueller, N.; Rojas-Rueda, D.; Cole-Hunter, T.; De Nazelle, A.; Dons, E.; Gerike, R.; Goetschi, T.; Panis, L.I.; Kahlmeier, S.; Nieuwenhuijsen, M. Health Impact Assessment of Active Transportation: A Systematic Review. Prev. Med. 2015, 76, 103–114. [Google Scholar] [CrossRef] [PubMed]
  6. Tirachini, A.; Cats, O. COVID-19 and public transportation: Current assessment, prospects, and research needs. J. Public Transp. 2020, 22, 1. [Google Scholar] [CrossRef]
  7. Dill, J.; McNeil, N. Four Types of Cyclists? Transp. Res. Rec. J. Transp. Res. Board 2013, 2387, 129–138. [Google Scholar] [CrossRef] [Green Version]
  8. Cabral, L.; Kim, A.M. An empirical reappraisal of the four types of cyclists. Transp. Res. Part. A: Policy Pract. 2020, 137, 206–221. [Google Scholar]
  9. Kellstedt, D.K.; Spengler, J.O.; Foster, M.; Lee, C.; Maddock, J.E. A Scoping Review of Bikeability Assessment Methods. J. Community Health 2020, 46, 211–224. [Google Scholar] [CrossRef]
  10. Ewing, R.; Cervero, R. Travel and the Built Environment. J. Am. Plan. Assoc. 2010, 76, 265–294. [Google Scholar] [CrossRef]
  11. Cervero, R.; Kockelman, K. Travel demand and the 3Ds: Density, diversity, and design. Transp. Res. Part D Transp. Environ. 1997, 2, 199–219. [Google Scholar] [CrossRef]
  12. Buehler, R. Determinants of transport mode choice: A comparison of Germany and the USA. J. Transp. Geogr. 2011, 19, 644–657. [Google Scholar] [CrossRef]
  13. Buehler, R.; Pucher, J. Cycling to work in 90 large American cities: New evidence on the role of bike paths and lanes. Transportation 2011, 39, 409–432. [Google Scholar] [CrossRef]
  14. Dill, J.; Carr, T. Bicycle Commuting and Facilities in Major U.S. Cities: If You Build Them, Commuters Will Use Them. Transp. Res. Rec. J. Transp. Res. Board 2003, 1828, 116–123. [Google Scholar] [CrossRef]
  15. Nelson, A.; Allen, D. If You Build Them, Commuters Will Use Them: Association Between Bicycle Facilities and Bicycle Commuting. Transp. Res. Rec. 1997, 1578, 79–83. [Google Scholar] [CrossRef]
  16. Pucher, J.; Dijkstra, L. Making Walking and Cycling Safer: Lessons from Europe. Transp. Q. 2000, 54, 1–33. [Google Scholar]
  17. Arellana, J.; Saltarín, M.; Larrañaga, A.M.; González, V.I.; Henao, C.A. Developing an urban bikeability index for different types of cyclists as a tool to prioritise bicycle infrastructure investments. Transp. Res. Part A Policy Pract. 2020, 139, 310–334. [Google Scholar] [CrossRef]
  18. Gu, P.; Han, Z.; Cao, Z.; Chen, Y.; Jiang, Y. Using Open Source Data to Measure Street Walkability and Bikeability in China: A Case of Four Cities. Transp. Res. Rec. 2018, 2672, 63–75. [Google Scholar] [CrossRef]
  19. Porter, A.K.; Kohl, H.W.; Pérez, A.; Reininger, B.; Pettee Gabriel, K.; Salvo, D. Bikeability: Assessing the objectively measured environment in relation to recreation and transportation bicycling. Environ. Behav. 2020, 52, 861–894. [Google Scholar] [CrossRef]
  20. Resch, B.; Puetz, I.; Bluemke, M.; Kyriakou, K.; Miksch, J. An Interdisciplinary Mixed-Methods Approach to Analyzing Urban Spaces: The Case of Urban Walkability and Bikeability. Int. J. Environ. Res. Public Health 2020, 17, 6994. [Google Scholar] [CrossRef] [PubMed]
  21. Winters, M.; Brauer, M.; Setton, E.M.; Teschke, K. Mapping Bikeability: A Spatial Tool to Support Sustainable Travel. Environ. Plan. B Plan. Des. 2013, 40, 865–883. [Google Scholar] [CrossRef]
  22. Schmid-Querg, J.; Keler, A.; Grigoropoulos, G. The Munich Bikeability Index: A Practical Approach for Measuring Urban Bikeability. Sustainability 2021, 13, 428. [Google Scholar] [CrossRef]
  23. Lin, J.-J.; Wei, Y.-H. Assessing area-wide bikeability: A grey analytic network process. Transp. Res. Part A Policy Pract. 2018, 113, 381–396. [Google Scholar] [CrossRef]
  24. Winters, M.; Teschke, K.; Brauer, M.; Fuller, D. Bike Score®: Associations between urban bikeability and cycling behavior in 24 cities. Int. J. Behav. Nutr. Phys. Act. 2016, 13, 1–10. [Google Scholar] [CrossRef] [Green Version]
  25. Rybarczyk, G.; Wu, C. Examining the Impact of Urban Morphology on Bicycle Mode Choice. Environ. Plan. B Plan. Des. 2014, 41, 272–288. [Google Scholar] [CrossRef]
  26. Cain, K.L.; Geremia, C.M.; Conway, T.L.; Frank, L.D.; Chapman, J.E.; Fox, E.H.; Timperio, A.; Veitch, J.; Van Dyck, D.; Verhoeven, H.; et al. Development and reliability of a streetscape observation instrument for international use: MAPS-global. Int. J. Behav. Nutr. Phys. Act. 2018, 15, 1–11. [Google Scholar] [CrossRef] [Green Version]
  27. Day, K.; Rivera, M.; Soler, R.; Kent, C.; Kochtitzky, C.S. Transforming Communities to Make Healthy Living Easier: The Built Environment: An Assessment Tool Manual (an Adaptation of MAPS); National Center for Chronic Disease Prevention and Health Promotion (CDC): Atlanta, GA, USA, 2015. [Google Scholar]
  28. Sallis, J.F.; Cain, K.L.; Conway, T.L.; Gavand, K.A.; Millstein, R.A.; Geremia, C.M. Is Your Neighborhood Designed to Support Physical Activity? A Brief Streetscape Audit Tool. Prev. Chronic Dis. 2015, 12, 150098. [Google Scholar] [CrossRef] [Green Version]
  29. Teschke, K.; Chinn, A.; Brauer, M. Proximity to four bikeway types and neighborhood-level cycling mode share of male and female commuters. J. Transp. Land Use 2017, 10, 695–713. [Google Scholar] [CrossRef] [Green Version]
  30. Salon, D.; Wang, K.; Conway, M.W.; Roth, N. Heterogeneity in the relationship between biking and the built environment. J. Transp. Land Use 2019, 12, 99–126. [Google Scholar] [CrossRef]
  31. Mueller, N.; Rojas-Rueda, D.; Salmon, M.; Martinez, D.; Ambros, A.; Brand, C.; de Nazelle, A.; Dons, E.; Gaupp-Berghausen, M.; Gerike, R.; et al. Health impact assessment of cycling network expansions in European cities. Prev. Med. 2018, 109, 62–70. [Google Scholar] [CrossRef] [PubMed] [Green Version]
  32. Nello-Deakin, S.; Harms, L. Assessing the relationship between neighbourhood characteristics and cycling: Findings from Amsterdam. Transp. Res. Procedia 2019, 41, 17–36. [Google Scholar] [CrossRef]
  33. Forsyth, A.; Krizek, K.J. Promoting Walking and Bicycling: Assessing the Evidence to Assist Planners. Built Environ. 2010, 36, 429–446. [Google Scholar] [CrossRef]
  34. Handy, S.; van Wee, B.; Kroesen, M. Promoting Cycling for Transport: Research Needs and Challenges. Transp. Rev. 2014, 34, 4–24. [Google Scholar] [CrossRef]
  35. Buehler, R.; Götschi, T.; Winters, M. Moving Toward Active Transportation: How Policies Can Encourage Walking and Bicycling; Active Living Research, University of California: San Diego, CA, USA, 2016. [Google Scholar]
  36. Damant-Sirois, G.; El-Geneidy, A.M. Who cycles more? Determining cycling frequency through a segmentation approach in Montreal, Canada. Transp. Res. Part A Policy Pract. 2015, 77, 113–125. [Google Scholar] [CrossRef]
  37. Ghosh, S.; Arnold, P.; Vingrys, S.; Ballis, T. Southall Broadway Public Realm—Post Implementation Study. In Proceedings of the European Transport Conference, Barcelona, Spain, 5–7 October 2016. [Google Scholar]
  38. Thakuriah, P.; Metaxatos, P.; Lin, J.; Jensen, E. An examination of factors affecting propensities to use bicycle and pedestrian facilities in suburban locations. Transp. Res. Part D Transp. Environ. 2012, 17, 341–348. [Google Scholar] [CrossRef]
  39. Heinen, E.; Panter, J.; Mackett, R.; Ogilvie, D. Changes in mode of travel to work: A natural experimental study of new transport infrastructure. Int. J. Behav. Nutr. Phys. Act. 2015, 12, 1–10. [Google Scholar] [CrossRef] [PubMed] [Green Version]
  40. Caulfield, B.; Brick, E.; McCarthy, O.T. Determining bicycle infrastructure preferences—A case study of Dublin. Transp. Res. Part D Transp. Environ. 2012, 17, 413–417. [Google Scholar] [CrossRef] [Green Version]
  41. Hunt, J.D.; Abraham, J.E. Influences on bicycle use. Transportation 2007, 34, 453–470. [Google Scholar] [CrossRef]
  42. Aldred, R.; Elliott, B.; Woodcock, J.; Goodman, A. Cycling provision separated from motor traffic: A systematic review exploring whether stated preferences vary by gender and age. Transp. Rev. 2016, 37, 1–27. [Google Scholar] [CrossRef]
  43. Hardinghaus, M.; Papantoniou, P. Evaluating Cyclists’ Route Preferences with Respect to Infrastructure. Sustainability 2020, 12, 3375. [Google Scholar] [CrossRef] [Green Version]
  44. Broach, J.; Dill, J.; Gliebe, J. Where do cyclists ride? A route choice model developed with revealed preference GPS data. Transp. Res. Part A Policy Pract. 2012, 46, 1730–1740. [Google Scholar] [CrossRef]
  45. Wang, Y.; Chau, C.K.; Ng, W.Y.; Leung, T.M. A review on the effects of physical built environment attributes on enhancing walking and cycling activity levels within residential neighborhoods. Cities 2016, 50, 1–15. [Google Scholar] [CrossRef]
  46. Buehler, R.; Dill, J. Bikeway Networks: A Review of Effects on Cycling. Transp. Rev. 2016, 36, 9–27. [Google Scholar] [CrossRef]
  47. Krizek, K.; Forsyth, A.; Baum, L. Walking and Cycling International Literature Review; Department of Transport: Melbourne, Australia, 2009; pp. 1–104.
  48. Humphrey, N.P. Does the Built Environment Influence Physical Activity? In Examining the Evidence; TRB Special Report; Transportation Research Board: Washington, DC, USA, 2005; Volume 282. [Google Scholar]
  49. Evans-Cowley, J.; Akar, G. Streetseen: Factors influencing the desirability of a street for bicycling. In Proceedings of the 93th Annual Meeting of the Transportation Research Board, Washington, DC, USA, 12–16 January 2014; pp. 1–20. [Google Scholar]
  50. Foster, C.E.; Panter, J.R.; Wareham, N.J. Assessing the impact of road traffic on cycling for leisure and cycling to work. Int. J. Behav. Nutr. Phys. Act. 2011, 8, 1–5. [Google Scholar] [CrossRef] [Green Version]
  51. Vandenbulcke, G.; Dujardin, C.; Thomas, I.; Geus, B.d.; Degraeuwe, B.; Meeusen, R.; Panis, L.I. Cycle commuting in Belgium: Spatial determinants and ‘re-cycling’ strategies. Transp. Res. Part A Policy Pract. 2011, 45, 118–137. [Google Scholar] [CrossRef] [Green Version]
  52. Wahlgren, L.; Schantz, P. Exploring Bikeability in a Suburban Metropolitan Area Using the Active Commuting Route Environment Scale (ACRES). Int. J. Environ. Res. Public Health 2014, 11, 8276–8300. [Google Scholar] [CrossRef]
  53. Rowangould, G.M.; Tayarani, M. Effect of Bicycle Facilities on Travel Mode Choice Decisions. J. Urban Plan. Dev. 2016, 142, 4016019. [Google Scholar] [CrossRef]
  54. Abraham, J.E.; McMillan, S.; Brownlee, A.T.; Hunt, J.D. Investigation of Cycling Sensitivities. Transp. Res. Board Annu. Conf. 2002, 81, 1–12. [Google Scholar]
  55. Birk, M.; Voros, K.; Rose, M.; Geller, R.; Igarta, D.; Patterson, B. Cycle Zone Analysis: An Innovative Approach to Bicycle Planning. In Proceedings of the TRB 2010 Annual Meeting, Washington, DC, USA, 10–14 January 2010. [Google Scholar]
  56. Winters, M.; Brauer, M.; Setton, E.; Teschke, K. Built Environment Influences on Healthy Transportation Choices: Bicycling versus Driving. J. Urban Health 2010, 87, 969–993. [Google Scholar] [CrossRef] [PubMed] [Green Version]
  57. Hou, N.; Popkin, B.M.; Jacobs Jr, D.R.; Song, Y.; Guilkey, D.; Lewis, C.E.; Gordon-Larsen, P. Longitudinal associations between neighborhood-level street network with walking, bicycling, and jogging: The CARDIA study. Health Place 2010, 16, 1206–1215. [Google Scholar] [CrossRef] [Green Version]
  58. Caulfield, B. Re-cycling a city—Examining the growth of cycling in Dublin. Transp. Res. Part A: Policy Pract. 2014, 61, 216–226. [Google Scholar] [CrossRef]
  59. Cairns, J.; Warren, J.; Garthwaite, K.; Greig, G.; Bambra, C. Go slow: An umbrella review of the effects of 20 mph zones and limits on health and health inequalities. J. Public Health 2015, 37, 515–520. [Google Scholar] [CrossRef] [Green Version]
  60. Winters, M.; Teschke, K.; Grant, M.; Setton, E.M.; Brauer, M. How far out of the way will we travel? Built environment influences on route selection for bicycle and car travel. Transp. Res. Rec. J. Transp. Res. Board 2010, 2190, 1–10. [Google Scholar] [CrossRef]
  61. Aultmann-Hall, L. Commuter Bicycle Route Choice: Analysis of Major Determinants and Safety Implications, in School of Graduate Studies; McMaster University: Hamilton, ON, USA, 1996; p. 224. [Google Scholar]
  62. Moudon, A.V.; Lee, C.; Cheadle, A.D.; Collier, C.W.; Johnson, D.; Schmid, T.L.; Weather, R.D. Cycling and the built environment, a US perspective. Transp. Res. Part D: Transp. Environ. 2005, 10, 245–261. [Google Scholar] [CrossRef]
  63. Winters, M.; Teschke, K. Route Preferences Among Adults in the Near Market for Bicycling: Findings of the Cycling in Cities Study. Am. J. Health Promot. 2010, 25, 40–47. [Google Scholar] [CrossRef]
  64. Cervero, R.; Sarmiento, O.L.; Jacoby, E.; Gomez, L.F.; Neiman, A. Influences of built environments on walking and cycling: Lessons from Bogotá. Int. J. Sustain. Transp. 2009, 3, 203–226. [Google Scholar] [CrossRef]
  65. Badland, H.M.; Schofield, G.M.; Garrett, N. Travel behavior and objectively measured urban design variables: Associations for adults traveling to work. Health Place 2008, 14, 85–95. [Google Scholar] [CrossRef] [PubMed]
  66. Fan, J.X.; Wen, M.; Kowaleski-Jones, L. An ecological analysis of environmental correlates of active commuting in urban U.S. Health Place 2014, 30, 242–250. [Google Scholar] [CrossRef] [Green Version]
  67. Schoner, J.E.; Levinson, D.M. The missing link: Bicycle infrastructure networks and ridership in 74 US cities. Transportation 2014, 41, 1187–1204. [Google Scholar] [CrossRef] [Green Version]
  68. Fan, J.X.; Wen, M.; Kowaleski-Jones, L. Environmental correlates of cycling: Evaluating urban form and location effects based on Danish micro-data. Transportation Research. Part D Transp. Environ. 2013, 22, 40–44. [Google Scholar]
  69. Garrard, J.; Rose, G.; Lo, S.K. Promoting transportation cycling for women: The role of bicycle infrastructure. Prev. Med. 2008, 46, 55–59. [Google Scholar] [CrossRef] [Green Version]
  70. Ghanayim, M.; Bekhor, S. Modelling bicycle route choice using data from a GPS-assisted household survey. EJTIR 2018, 18, 158–177. [Google Scholar]
  71. Bopp, M.; Gayah, V.; Campbell, M. Examining the Link Between Public Transit Use and Active Commuting. Int. J. Environ. Res. Public Health 2015, 12, 4256. [Google Scholar] [CrossRef] [Green Version]
  72. Krizek, K.J.; Johnson, P.J. Proximity to Trails and Retail: Effects on Urban Cycling and Walking. J. Am. Plan. Assoc. 2006, 72, 33–42. [Google Scholar] [CrossRef]
  73. Henao, A.; Piatkowski, D.; Luckey, K.S.; Nordback, K.; Marshall, W.E.; Krizek, K.J. Sustainable transportation infrastructure investments and mode share changes: A 20-year background of Boulder, Colorado. Transp. Policy 2015, 37, 64–71. [Google Scholar] [CrossRef]
  74. Li, H.; Graham, D.J.; Liu, P. Safety effects of the London cycle superhighways on cycle collisions. Accid. Anal. Prev. 2017, 99, 90–101. [Google Scholar] [CrossRef]
  75. Gu, J.; Mohit, B.; Muennig, P.A. The cost-effectiveness of bike lanes in New York City. Inj. Prev. 2017, 23, 239–243. [Google Scholar] [CrossRef] [PubMed]
  76. Parkin, J.; Wardman, M.; Page, M. Estimation of the determinants of bicycle mode share for the journey to work using census data. Transportation 2008, 35, 93–109. [Google Scholar] [CrossRef] [Green Version]
  77. Ricci, M. Bike sharing: A review of evidence on impacts and processes of implementation and operation. Res. Transp. Bus. Manag. 2015, 15, 28–38. [Google Scholar] [CrossRef]
  78. Midgley, P. Bicycle-Sharing Schemes: Enhancing Sustainable Mobility in Urban Areas; United Nations, Department of Economic and Social Affairs: New York, NY, USA, 2011; pp. 1–26. [Google Scholar]
  79. Pucher, J.; Dill, J.; Handy, S. Infrastructure, programs, and policies to increase bicycling: An international review. Prev. Med. 2010, 50, 106–125. [Google Scholar] [CrossRef] [PubMed]
  80. Pratt, R.H.; Evans, J.; Levinson, H.S.; Turner, S.M. Pedestrian and Bicycle Facilities, in Traveler Response to Transportation System Changes; National Research Council, Transportation Research Board, Transit Cooperative Research Program United States, Federal Transit Administration Transit Development Corporation, Eds.; National Academies Press: Washington, DC, USA, 2012. [Google Scholar]
  81. La Paix Puello, L.; Geurs, K. Modelling observed and unobserved factors in cycling to railway stations: Application to transit-oriented-developments in the Netherlands. Eur. J. Transp. Infrastruct. Res. 2015, 15, 27–50. [Google Scholar]
  82. Goodman, A.; Sahlqvist, S.; Ogilvie, D. New Walking and Cycling Routes and Increased Physical Activity: One-and 2-Year Findings From the UK iConnect Study. Am. J. Public Health 2014, 104, e38–e46. [Google Scholar] [CrossRef] [PubMed]
  83. Djurhuus, S.; Hansen, H.S.; Aadahl, M.; Glümer, C. Individual public transportation accessibility is positively associated with self-reported active commuting. Front. Public Health 2014, 2, 240. [Google Scholar] [CrossRef] [PubMed] [Green Version]
  84. Kaplan, S.; Nielsen, T.A.S.; Prato, C.G. Youth walking and cycling: The relationship between active travel and urban form. In Proceedings of the Transportation Research Board 95th Annual Meeting, Washington, DC, USA, 10–14 January 2016. [Google Scholar]
  85. Thigpen, C.G.; Li, H.; Harvey, J. Modeling the Impact of Pavement Roughness on Bicycle Ride Quality. In Proceedings of the Transportation Research Board 94th Annual Meeting, Washington, DC, USA, 11–15 January 2015; pp. 1–21. [Google Scholar]
  86. Caviedes, Á. Measuring Stress Levels for Real-World On-Road Cyclists: Do Bicycle Facilities, Intersections and Traffic Levels Affect Cyclists’ Stress? In Proceedings of the Transportation Research Board 95th Annual Meeting, Washington, DC, USA, 10–14 January 2016. [Google Scholar]
  87. Prato, C.G.; Halldórsdóttir, K.; Nielsen, O.A. Evaluation of land-use and transport network effects on cyclists’ route choices in the Copenhagen Region in value-of-distance space. Int. J. Sustain. Transp. 2018, 12, 770–781. [Google Scholar] [CrossRef] [Green Version]
  88. Stewart, O.T.; Moudon, A.V. Using the built environment to oversample walk, transit, and bicycle travel. Transp. Res. Part D: Transp. Environ. 2014, 32, 15–23. [Google Scholar] [CrossRef]
  89. Bickerstaff, K.; Walker, G. Public understandings of air pollution: The ‘localisation’ of environmental risk. Glob. Environ. Chang. 2001, 11, 133–145. [Google Scholar] [CrossRef]
  90. Kelly, F.J.; Fussell, J.C. Air pollution and public health: Emerging hazards and improved understanding of risk. Env. Geochem Health 2015, 37, 631–649. [Google Scholar] [CrossRef] [PubMed] [Green Version]
  91. Camusso, C.; Pronello, C. A study of relationships between traffic noise and annoyance for different urban site typologies. Transp. Res. Part D: Transp. Environ. 2016, 44, 122–133. [Google Scholar] [CrossRef] [Green Version]
  92. Gössling, S.; Humpe, A.; Litman, T.; Metzler, D. Effects of Perceived Traffic Risks, Noise, and Exhaust Smells on Bicyclist Behaviour: An Economic Evaluation. Sustainability 2019, 11, 408. [Google Scholar] [CrossRef] [Green Version]
  93. Koorey, G.; Parsons, J. The Effect of Cycle Lanes on Cycling Numbers and Safety. In Proceedings of the Transportation Research Board 95th Annual Meeting, Washington, DC, USA, 10–14 January 2016. [Google Scholar]
  94. Thompson, J.H.; Wijnands, J.S.; Mavoa, S.; Scully, K.; Stevenson, M.R. Evidence for the ‘safety in density’ effect for cyclists: Validation of agent-based modelling results. Inj. Prev. 2018, 25, 379–385. [Google Scholar] [CrossRef]
  95. Manton, R.; Rau, H.; Fahy, F.; Sheahan, J.; Clifford, E. Using mental mapping to unpack perceived cycling risk. Accid. Anal. Prev. 2016, 88, 138–149. [Google Scholar] [CrossRef]
  96. von Stülpnagel, R.; Lucas, J. Crash risk and subjective risk perception during urban cycling: Evidence for congruent and incongruent sources. Accid. Anal. Prev. 2020, 142, 105584. [Google Scholar] [CrossRef]
  97. Calvey, J.; Shackleton, J.; Taylor, M.; Llewellyn, R. Engineering condition assessment of cycling infrastructure: Cyclists’ perceptions of satisfaction and comfort. Transp. Res. Part A Policy Pract. 2015, 78, 134–143. [Google Scholar] [CrossRef]
  98. Ayachi, F.; Dorey, J.; Guastavino, C. Identifying factors of bicycle comfort: An online survey with enthusiast cyclists. Appl. Ergon. 2015, 46, 124–136. [Google Scholar] [CrossRef]
  99. Osama, A.; Albitar, M.; Sayed, T.; Bigazzi, A. Determining if walkability and bikeability indices reflect pedestrian and cyclist safety. Transp. Res. Rec. 2020, 2674, 767–775. [Google Scholar] [CrossRef]
  100. OpenStreetMap-Contributers, Planet Dump. Available online: https://planet.openstreetmap.org (accessed on 14 October 2017).
  101. Arsanjani, J.J.; Barron, C.; Bakillah, M.; Helbich, M. Assessing the Quality of OpenStreetMap Contributors together with their Contributions. In Proceedings of the AGILE, Leuven, Belgium, 14–17 May 2013. [Google Scholar]
  102. Neis, P.; Zielstra, D.; Zipf, A. The Street Network Evolution of Crowdsourced Maps: OpenStreetMap in Germany 2007–2011. Future Internet 2012, 4, 1–21. [Google Scholar] [CrossRef] [Green Version]
  103. Haklay, M. How Good is Volunteered Geographical Information? A Comparative Study of OpenStreetMap and Ordnance Survey Datasets. Environ. Plan. B Plan. Des. 2010, 37, 682–703. [Google Scholar] [CrossRef] [Green Version]
  104. Ester, M.; Kriegel, H.-P.; Sander, J.; Xu, X. A density-based algorithm for discovering clusters in large spatial databases with noise. In Proceedings of the Second International Conference on Knowledge Discovery and Data Mining; AAAI Press: Portland, ON, USA, 1996; pp. 226–231. [Google Scholar]
  105. Ahrens, G.-A. Endbericht zur Verkehrserhebung, Mobilität in Städten—SrV 2008‘ in Berlin; Technische Universität Dresden: Dresden, Germany, 2009; pp. 1–87. [Google Scholar]
  106. de Dios Ortuzar, J.; Willumsen, L.G. Modelling Transport; John Wiley & Sons: Hoboken, NJ, USA, 2011. [Google Scholar]
  107. McFadden, D. Conditional Logit Analysis of Qualitative Choice Behavior; Academic Press: New York, NY, USA, 1973. [Google Scholar]
  108. Bierlaire, M. A Short Introduction to PandasBiogeme; Transport, E., Ed.; Mobility Laboratory: Lausanne, Switzerland, 2020. [Google Scholar]
  109. König, A.; Axhausen, K.W.; Abay, G. Zeitkostenansaetze im Personenverkehr; Vereinigung Schweizerischer Verkehrsingenieure: Bern, Switzerland, 2004; pp. 1–221. [Google Scholar]
  110. Koppelman, F.S.; Bhat, C. A Self Instructing Course in Mode Choice Modeling: Multinomial and Nested Logit Models; Federal Transit Administration: Washington, DC, USA, 2006.
Figure 1. Methodological approach.
Sustainability 13 11584 g001
Figure 2. Interactive web module.
Sustainability 13 11584 g002
Figure 3. Process of averaging bikeability values of each trip. The figure shows all statistical units of the district “Friedrichshain-Kreuzberg” as an example. In this illustration one of the 38,025 regarded trips is visualized. The process includes the calculation of area centroids (a), the routing between one pair of centroids (b) and the averaging of bikeability values based on the crossed units (c). In this example the bikeability values of the regarded statistical units range between 0.02 and 0.97, the average value for the observed trip is 0.53.
Sustainability 13 11584 g003
Figure 4. Spatial distributions of indicators.
Sustainability 13 11584 g004
Table 1. Attribute table.
AttributeDescriptionMinMaxMean
AGEAge of the person observed in years69544.74
PT_TICKETPublic transport season pass available010.48
COST PTCosts of the trip with public transport in €0.212.151.73
COST CARCosts of the trip by car in €0.0056.530.66
BIKEABILITYBikeability index of the route−0.870.970.18
TIME_BIKETravel time by bike in minutes2.08130.0114.39
TIME_CARTravel time by car in minutes1.13111.1119.75
TIME_TRAINTravel time by public transport in minutes3.95741.268.73
TIME_WALKTravel time by foot in minutes8.33133.3324.36
Table 2. Expert survey: resulting interaction of components of bikeability.
Prevalence of Neighborhood StreetsStreet ConnectivityBiking Facilities along Main StreetsGreen PathwaysOther Cycle Facilities
Mean0.170.230.280.160.08
Median0.140.240.270.160.07
Standard-
deviation
0.100.900.110.090.06
Min.00000
Max.0.450.450.520.360.25
* percent missing up to 100: additional category.
Table 3. Experts’ assessment in different geographical regions.
RegionPrevalence of Neighborhood StreetsStreet ConnectivityBiking Facilities along Main StreetsGreen PathwaysOther Cycle Facilities
America
(n = 11)
0.140.230.310.160.09
Europe
(n = 46)
0.170.230.280.150.08
* percent missing up to 100: additional category.
Table 4. Statistical key figures of individual parameters.
Prevalence of Neighborhood Streets
(Percentage Share of All Street km)
Street Connectivity (Intersections per km2)Biking Facilities along Main Streets (Percentage Coverage)Green Pathways
(Percentage in Area)
Other Cycle Facilities (Rental and Repair Facilities per km2)
Mean0.7637.60.650.180.91
Median0.8135.90.690.110.16
Standard
-deviation
0.1822.20.280.211.78
Min.0000.010
Max.1108.910.9710.32
Table 5. Model results.
VariableEstimatorStandard Deviationt-Valuep-Value
ASC Bike1.17(0.0684)17.1<2.2 × 10⁻¹⁶
ASC Car0(fixed)fixed-
ASC Train1.87(0.058)32.4<2.2 × 10⁻¹⁶
ASC Walk−2.03(0.0537)−37.8<2.2 × 10⁻¹⁶
Age Bike0.0251(0.00093)27.1<2.2 × 10⁻¹⁶
Age Car0.0254(0.00091)27.8<2.2 × 10⁻¹⁶
Age Train0(fixed)fixed-
Age Walk0.0151(0.00083)18.1<2.2 × 10⁻¹⁶
Travel Cost−0.839(0.0291)−28.8<2.2 × 10⁻¹⁶
PT Ticket Bike0.332(0.0391)8.49<2.2 × 10⁻¹⁶
PT Ticket Car−0.245(0.0352)−6.96<3.38 × 10⁻¹²
PT Ticket Train0(fixed)fixed-
PT Ticket Walk2.31(0.0349)66.1<2.2 × 10⁻¹⁶
Travel Time Bike−0.299(0.00508)−58.9<2.2 × 10⁻¹⁶
Travel Time Car−0.01(0.0033)−3.030.00243
Travel Time Train−0.0324(0.00109)−29.8<2.2 × 10⁻¹⁶
Travel Time Walk−0.00271(0.00051)−5.321.01 × 10−7
Bikeability0.518(0.0623)8.49<2.2 × 10⁻¹⁶
Observations48,825
Rho Square0.403
Log-likelihood−37,466.51
Publisher’s Note: MDPI stays neutral with regard to jurisdictional claims in published maps and institutional affiliations.

