
The Influence of Farm Characteristics and Feed Compositions on the Environmental Impact of Pig Production in Flanders: Productivity, Energy Use and Protein Choices Are Key


Abstract
:1. Introduction
2. Materials and Methods
2.1. Goal and Scope
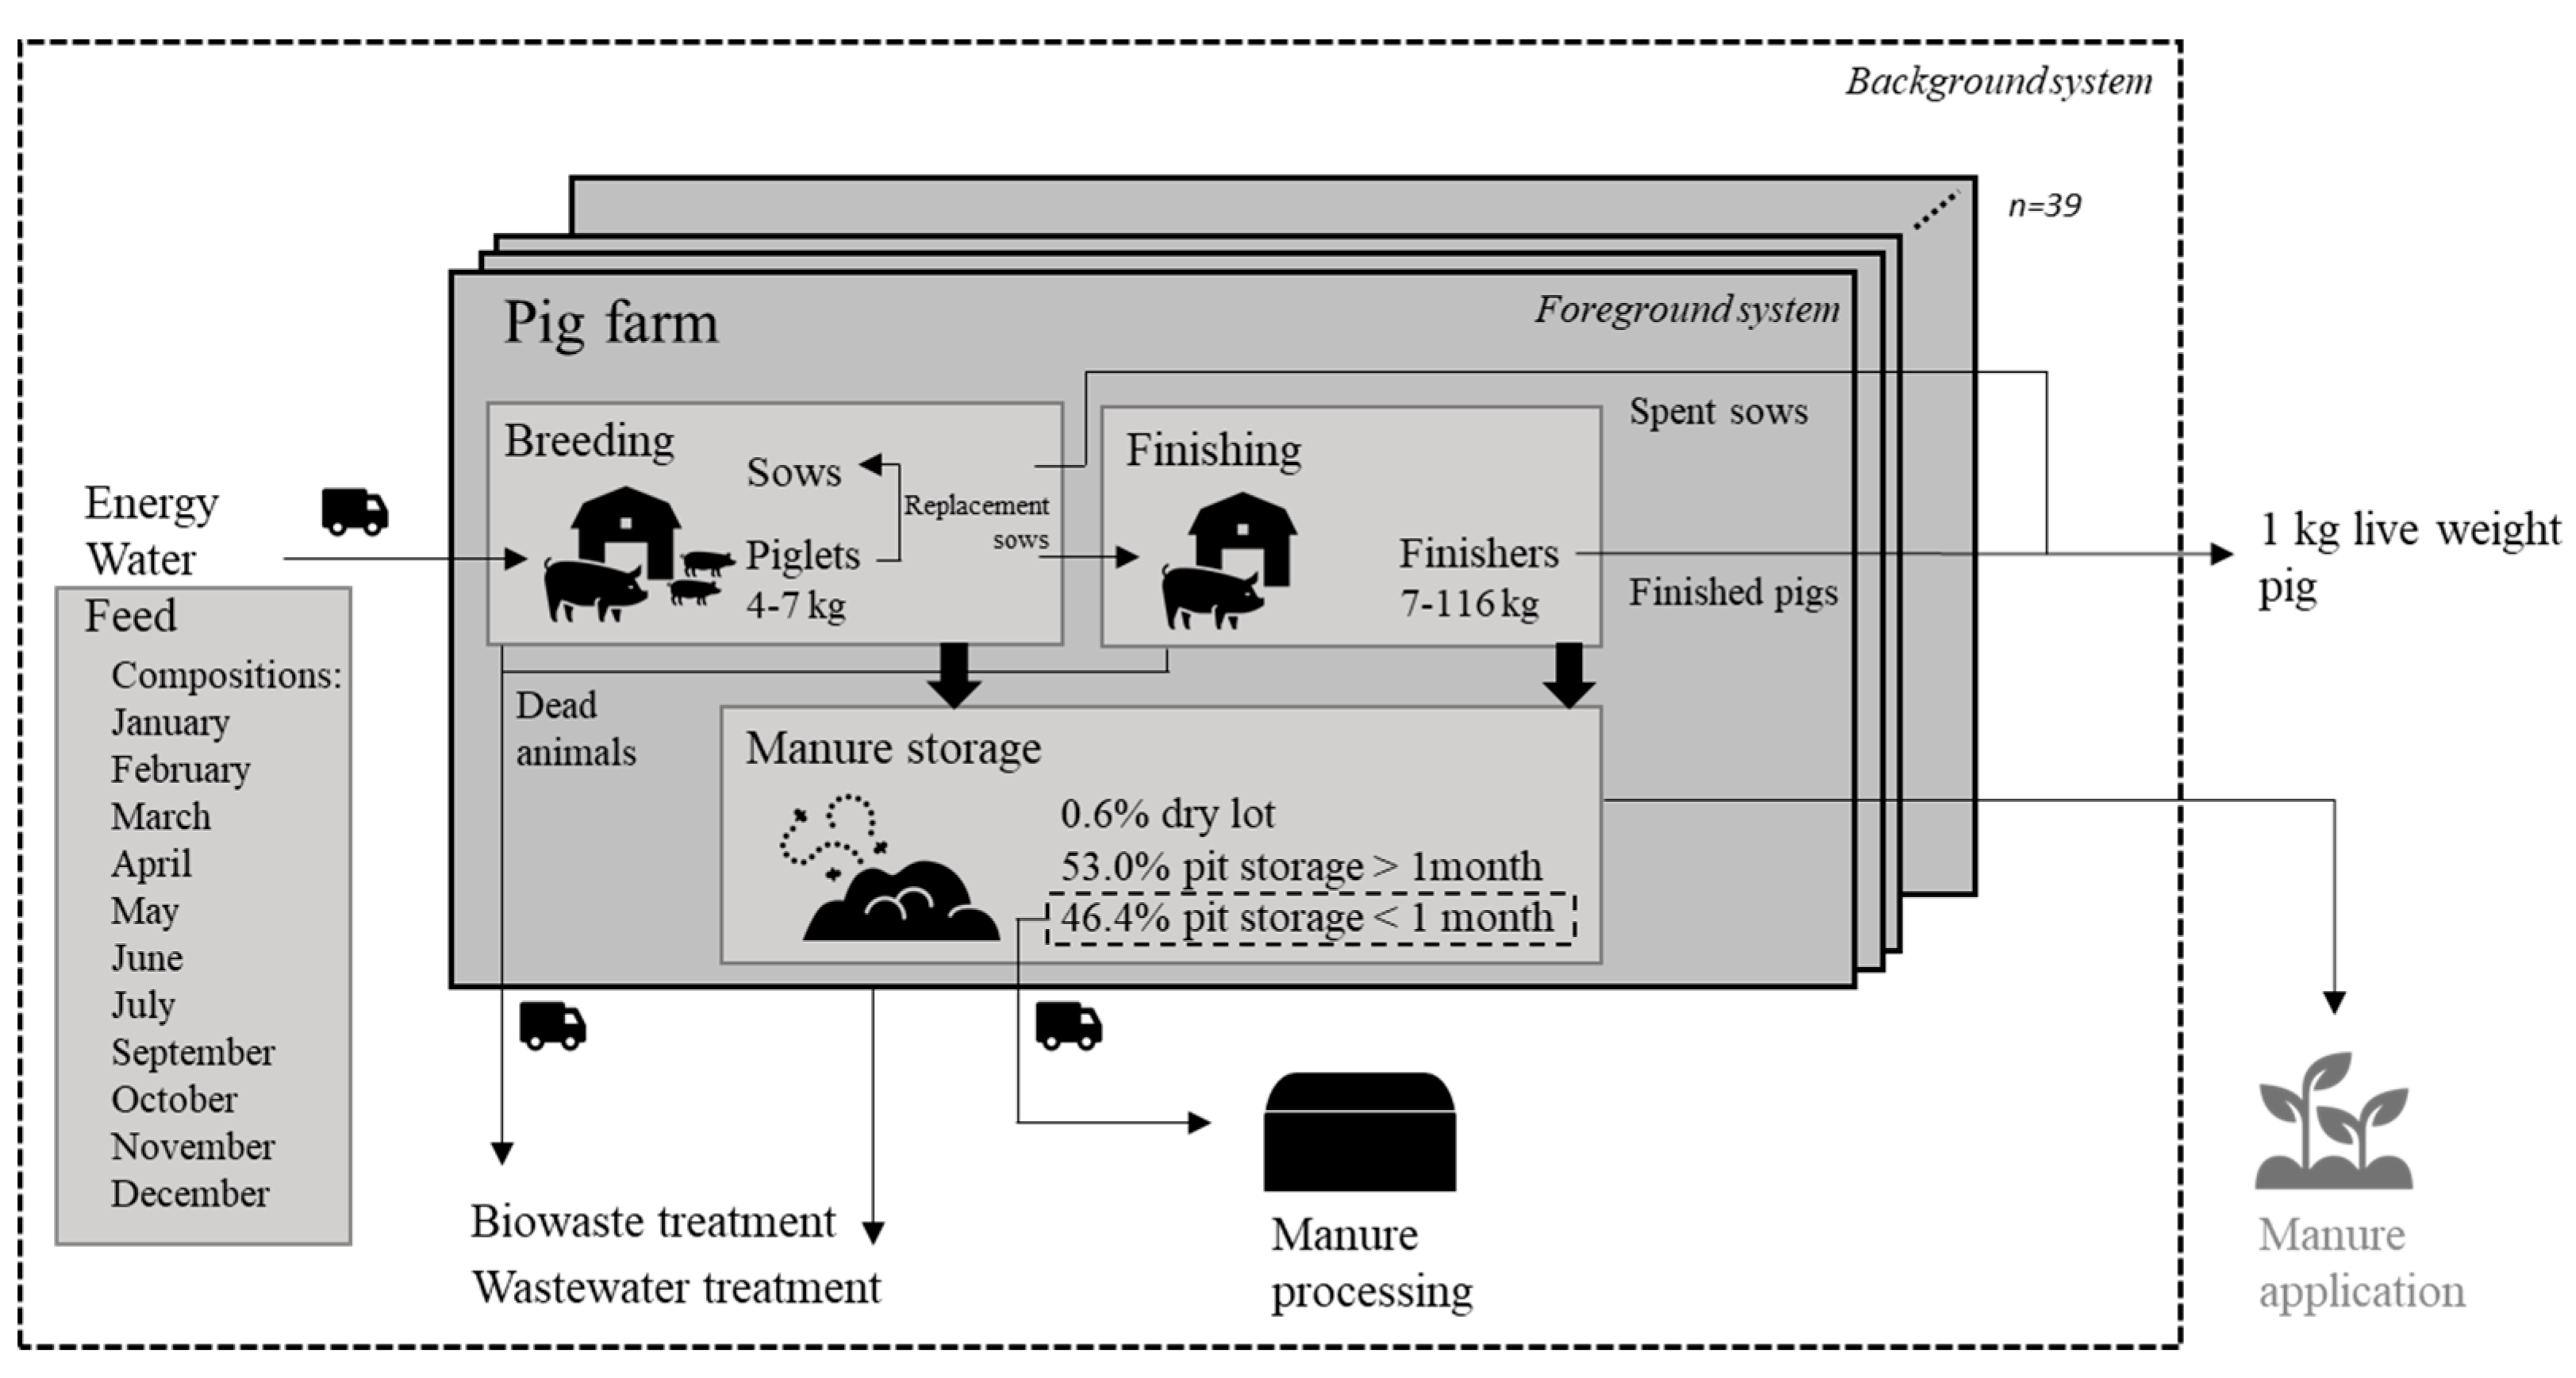
2.1.1. System Boundaries
2.1.2. Functional Unit
2.1.3. Allocation
2.2. Data Collection on Farm Characteristics
2.2.1. Manure Management
2.2.2. Energy and Water Use
2.2.3. Transport
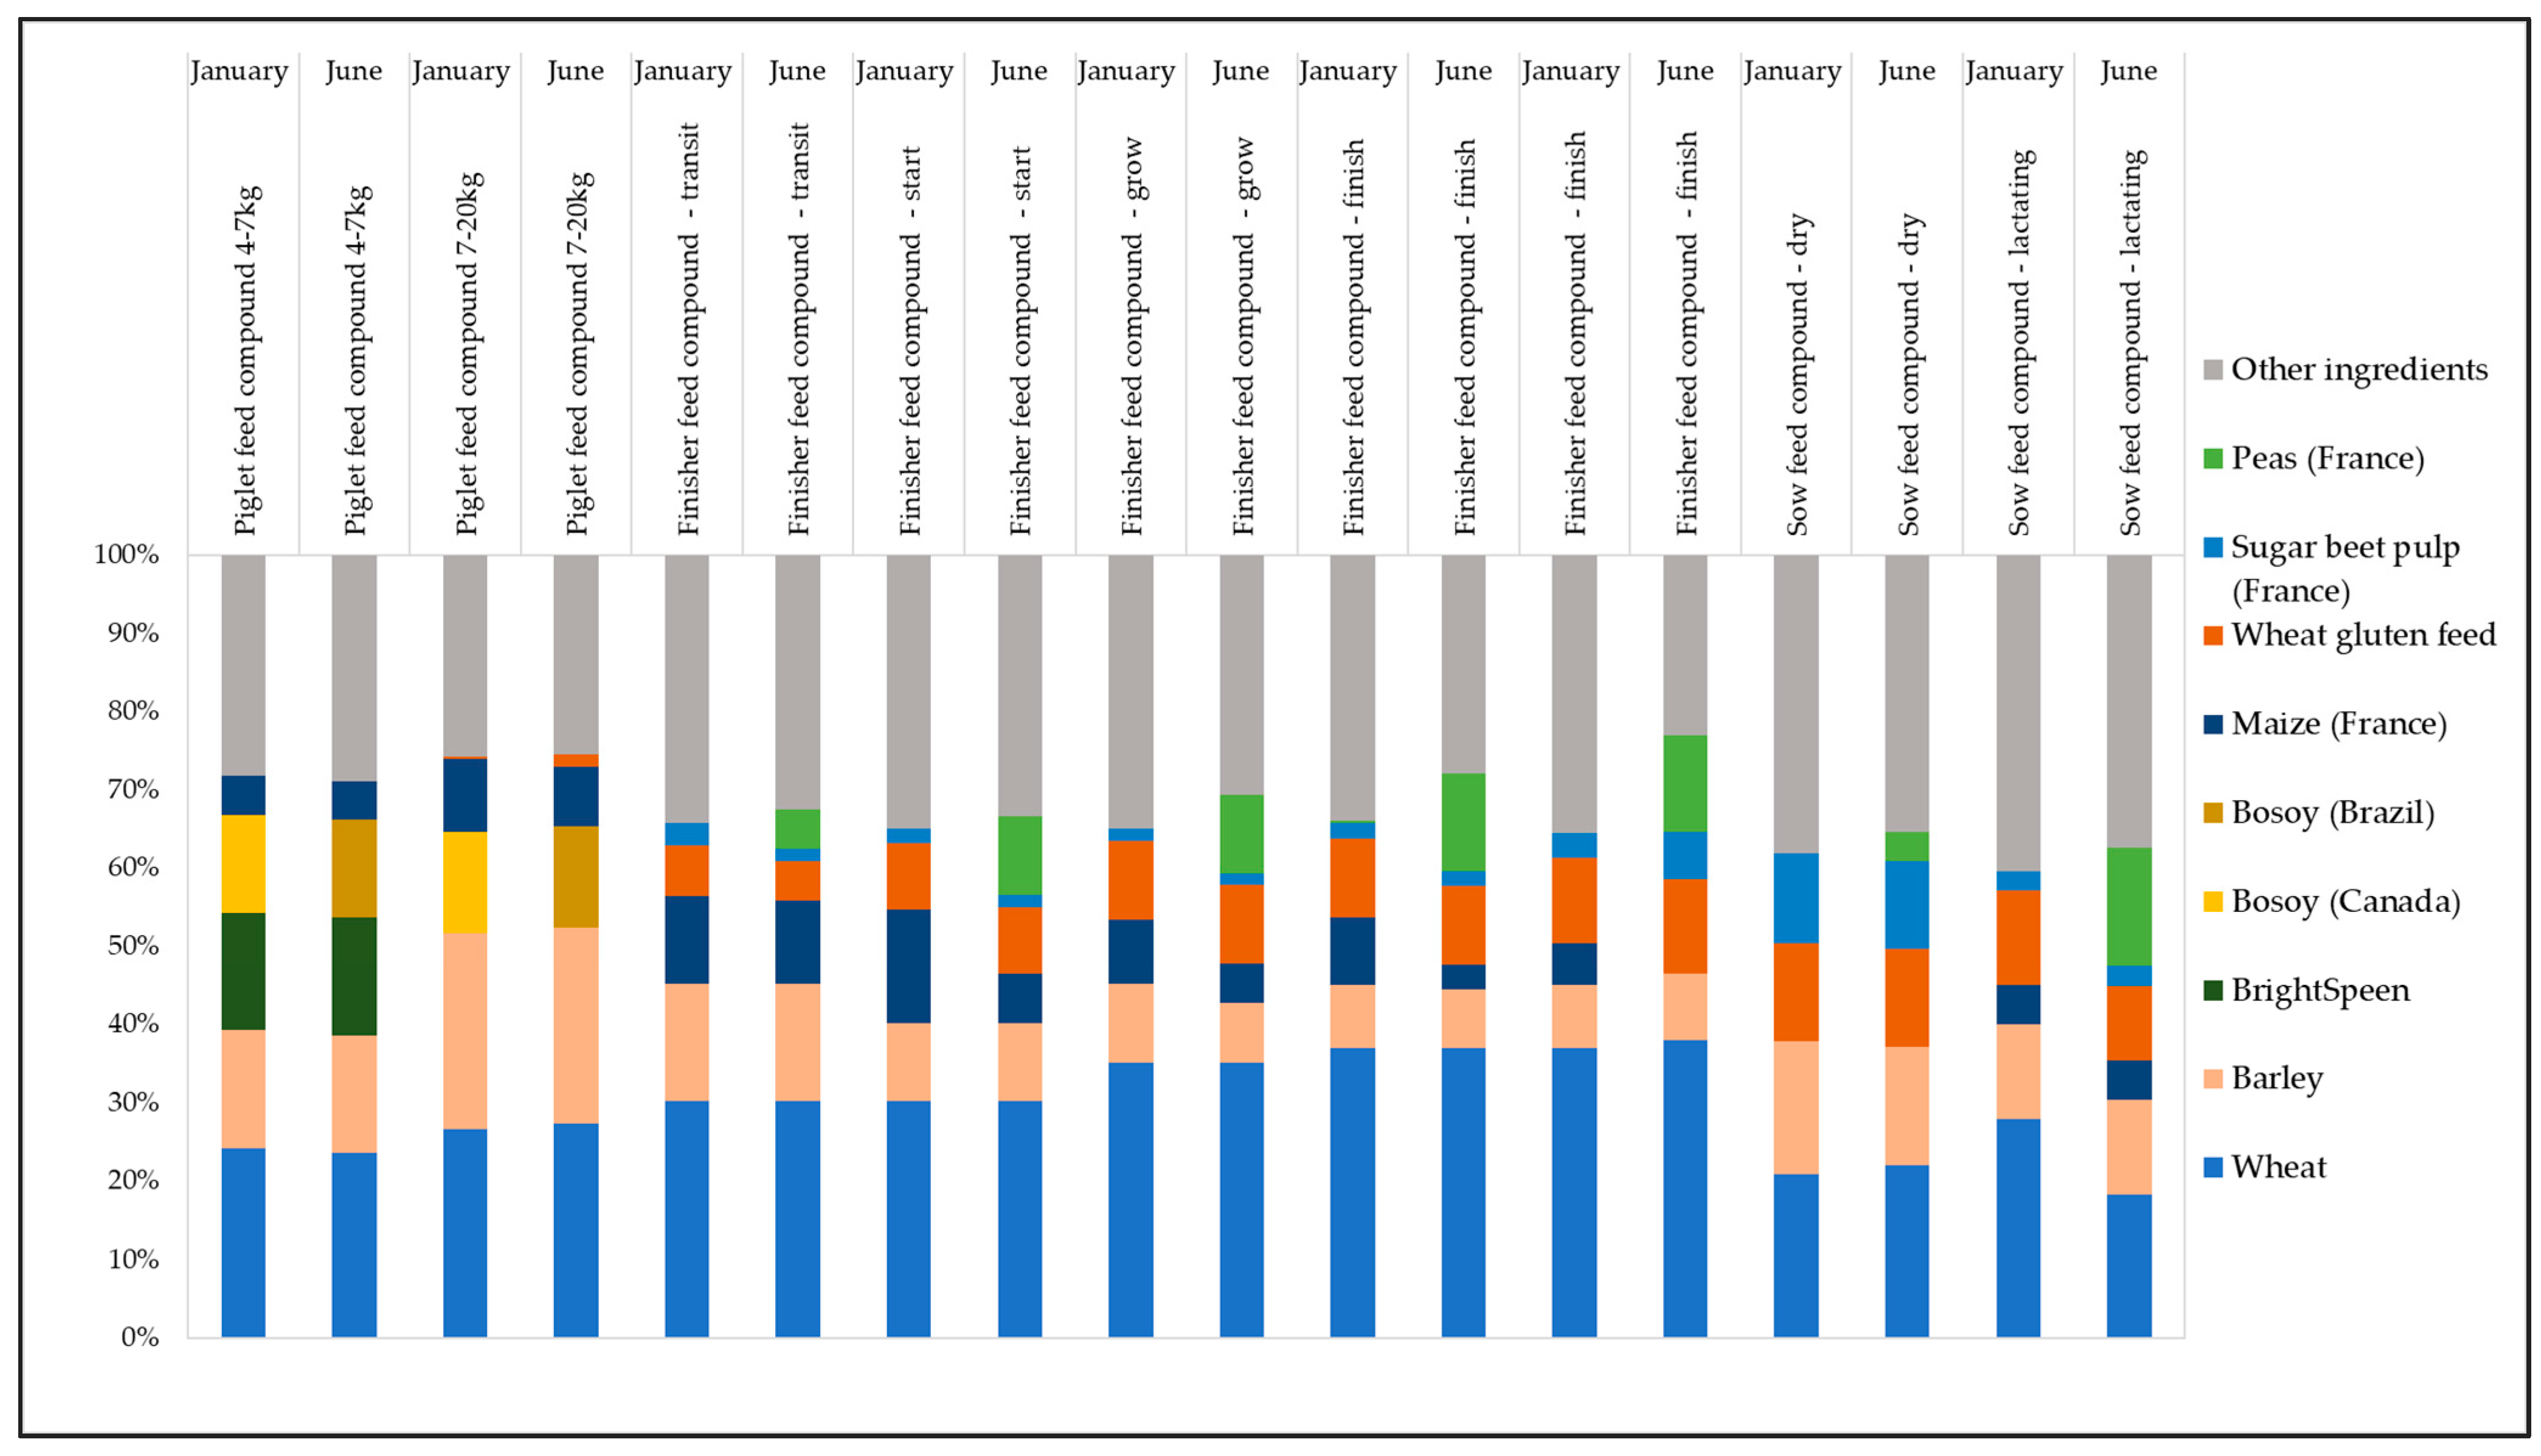
2.3. Data Collection on Feed Consumption and Compositions
2.4. Life Cycle Impact Assessment (LCIA)
3. Results
3.1. Environmental Impacts of Belgian Pig Production
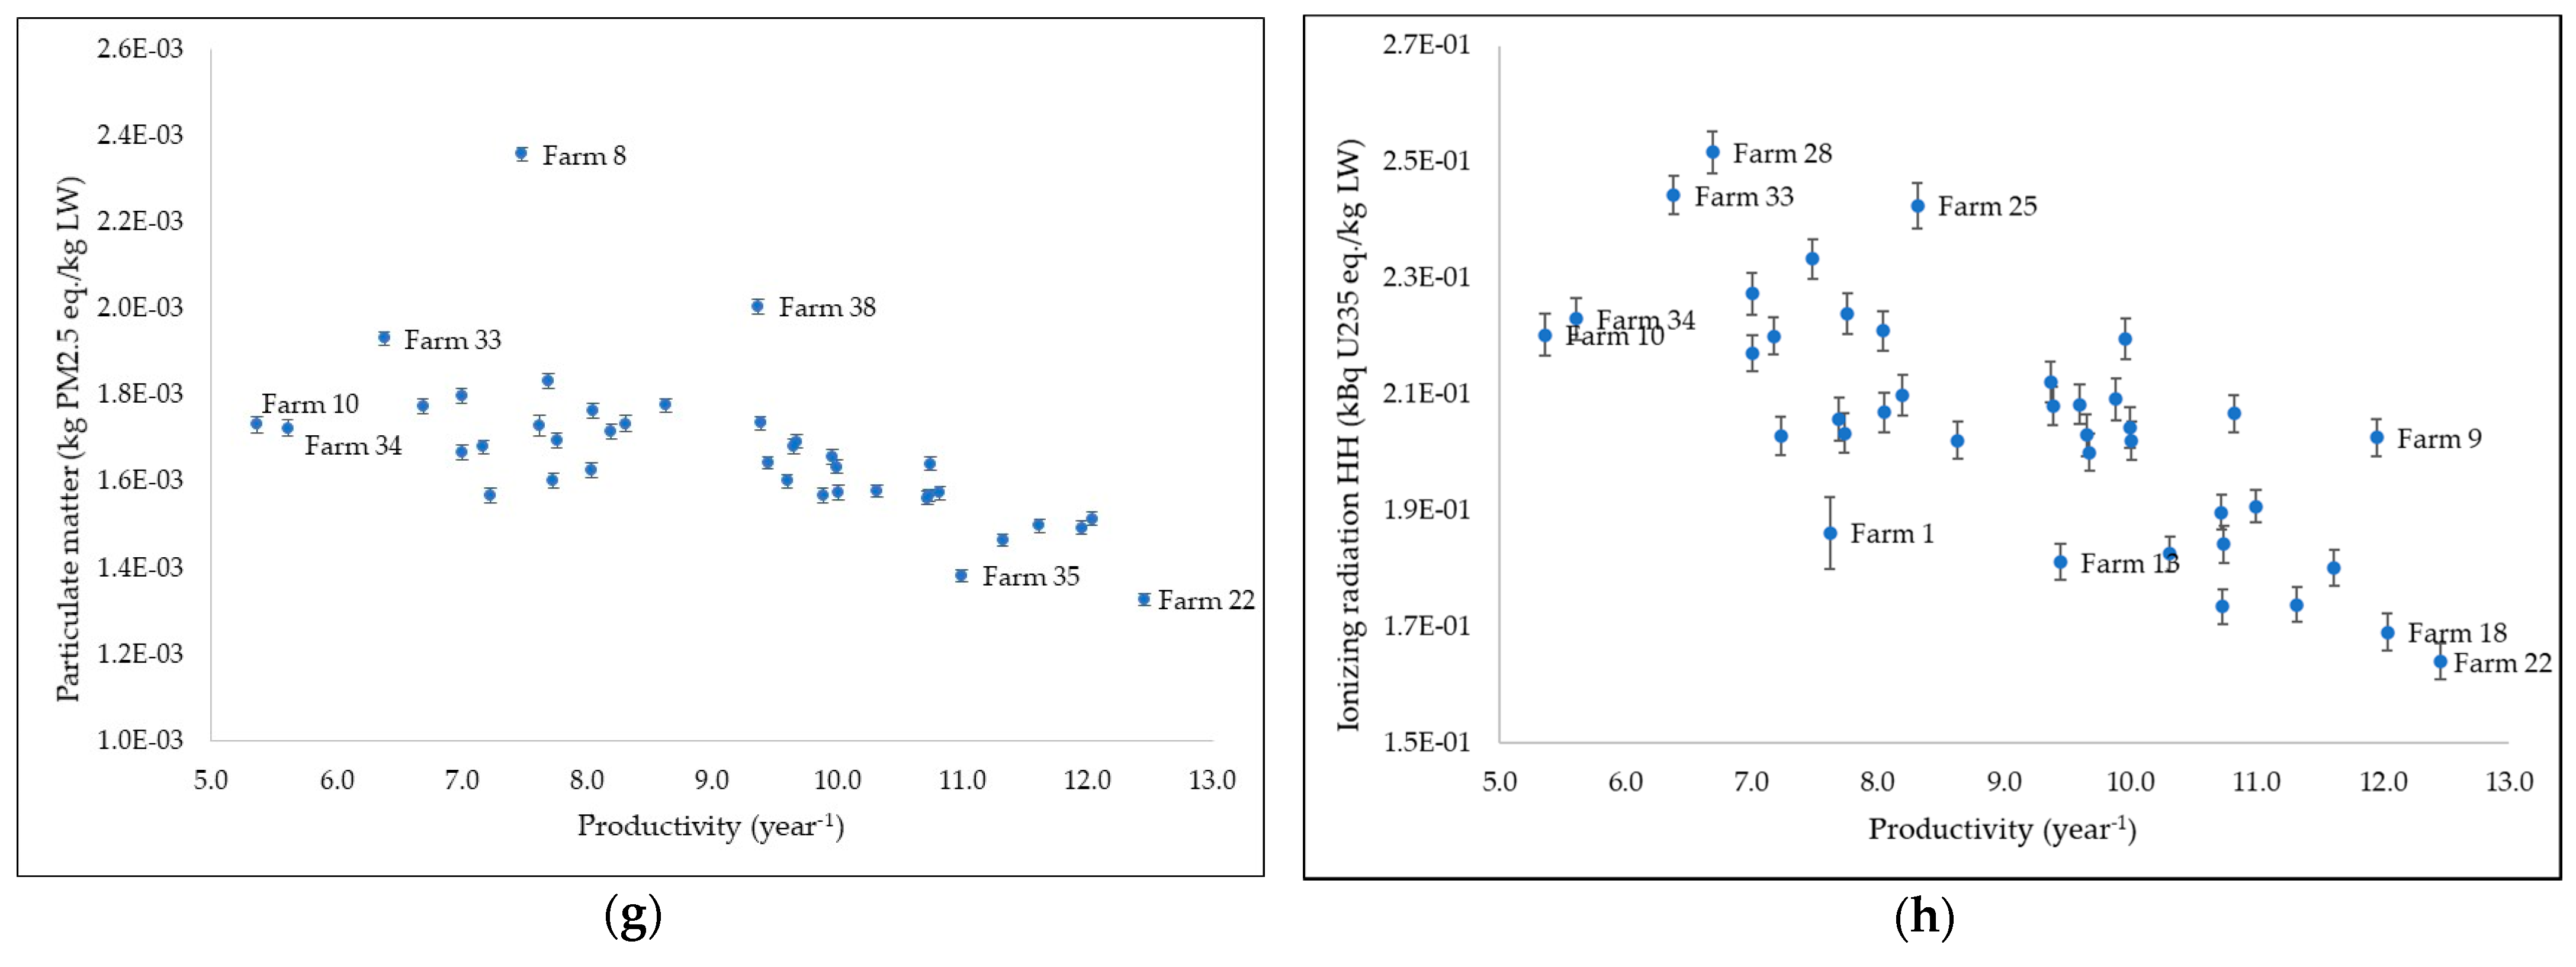
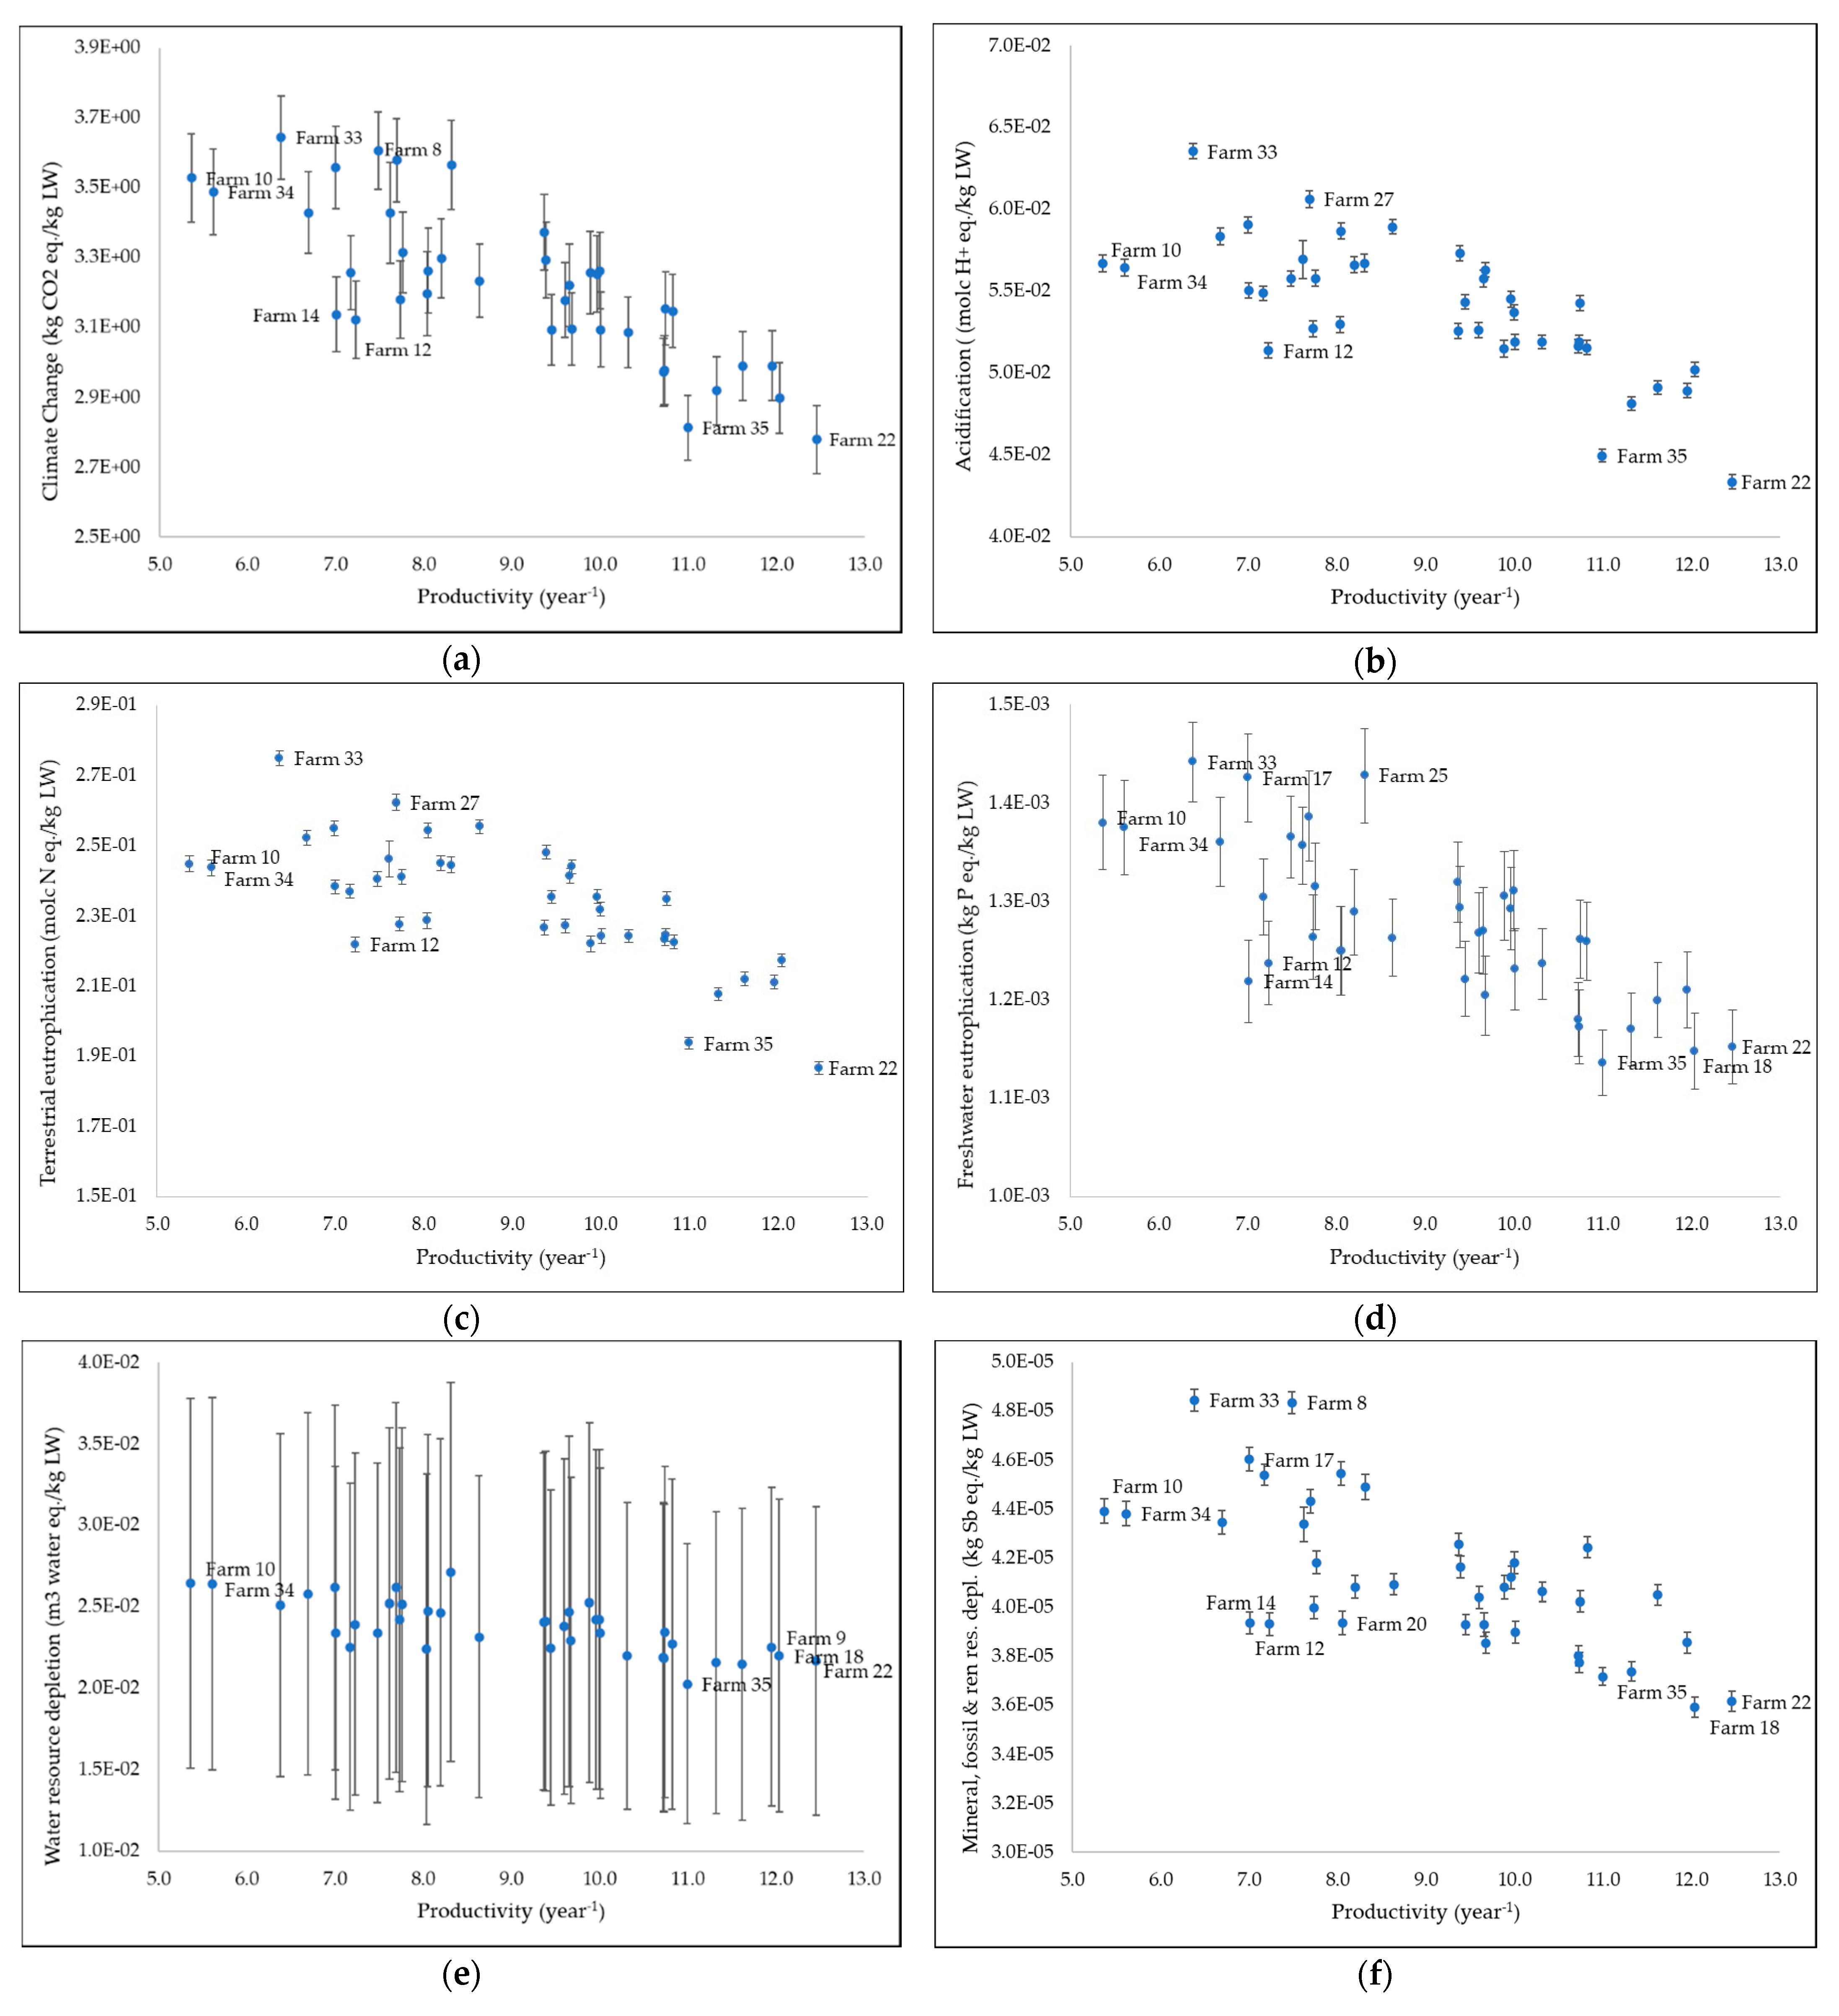
3.2. Environmental Impacts of Studied Farms in Relation to Their Productivity
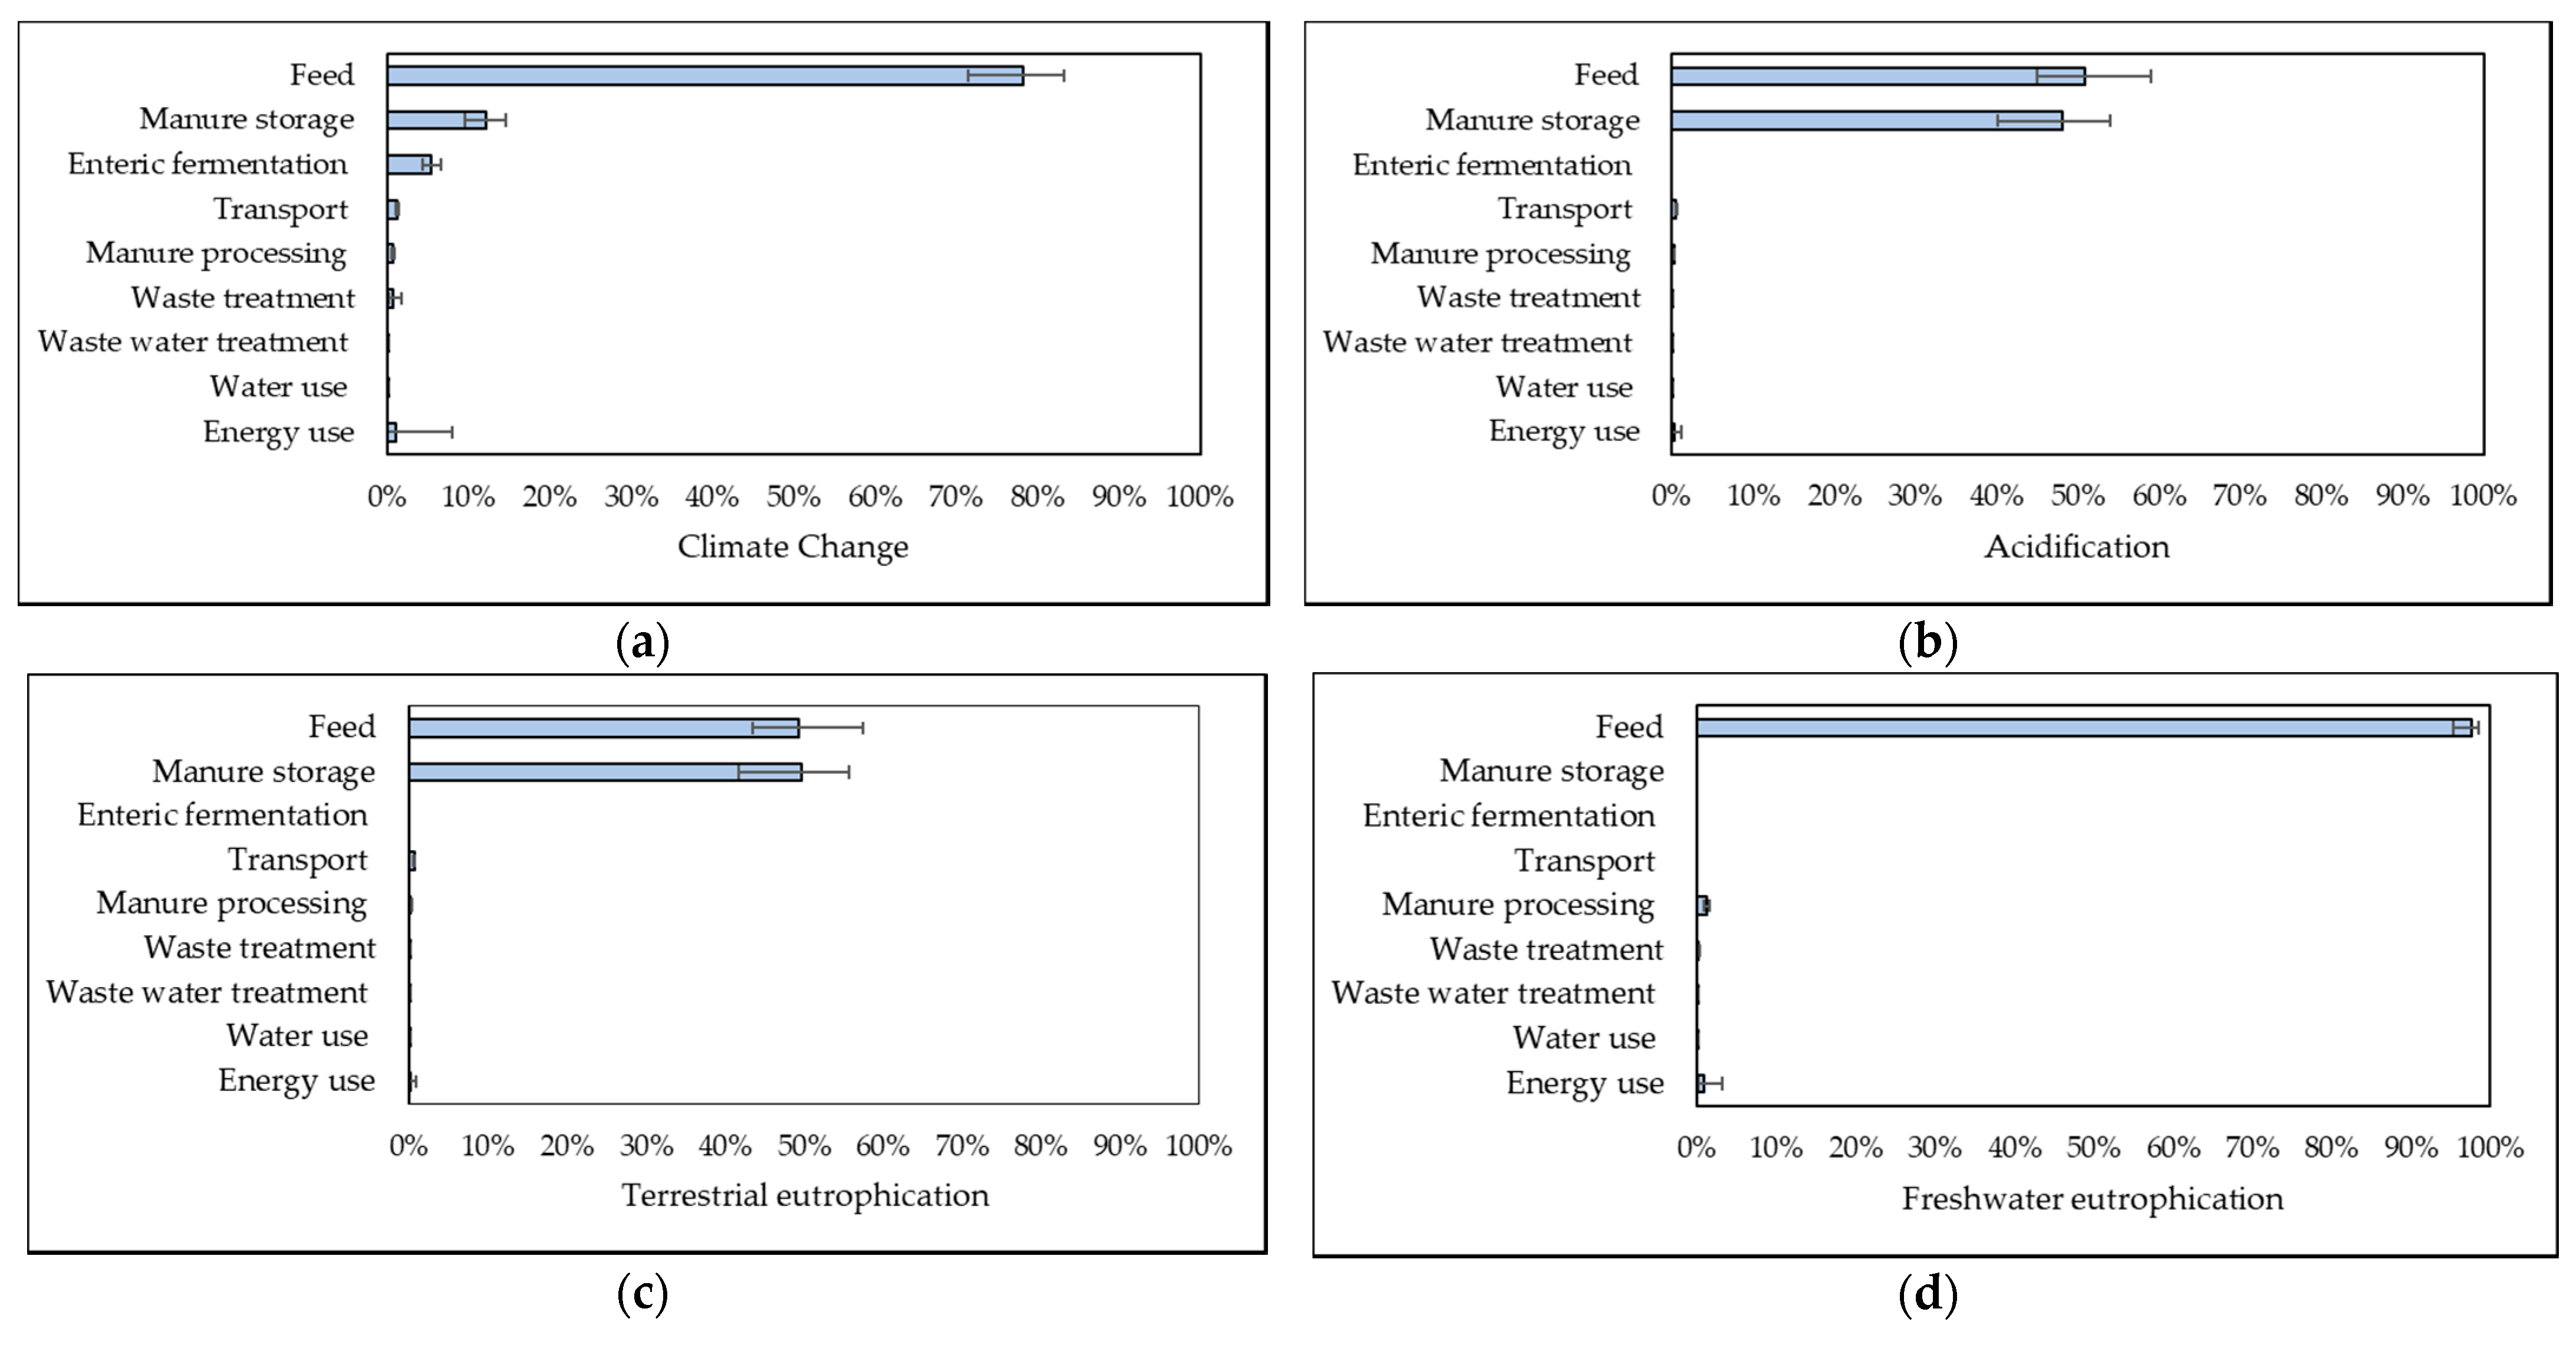
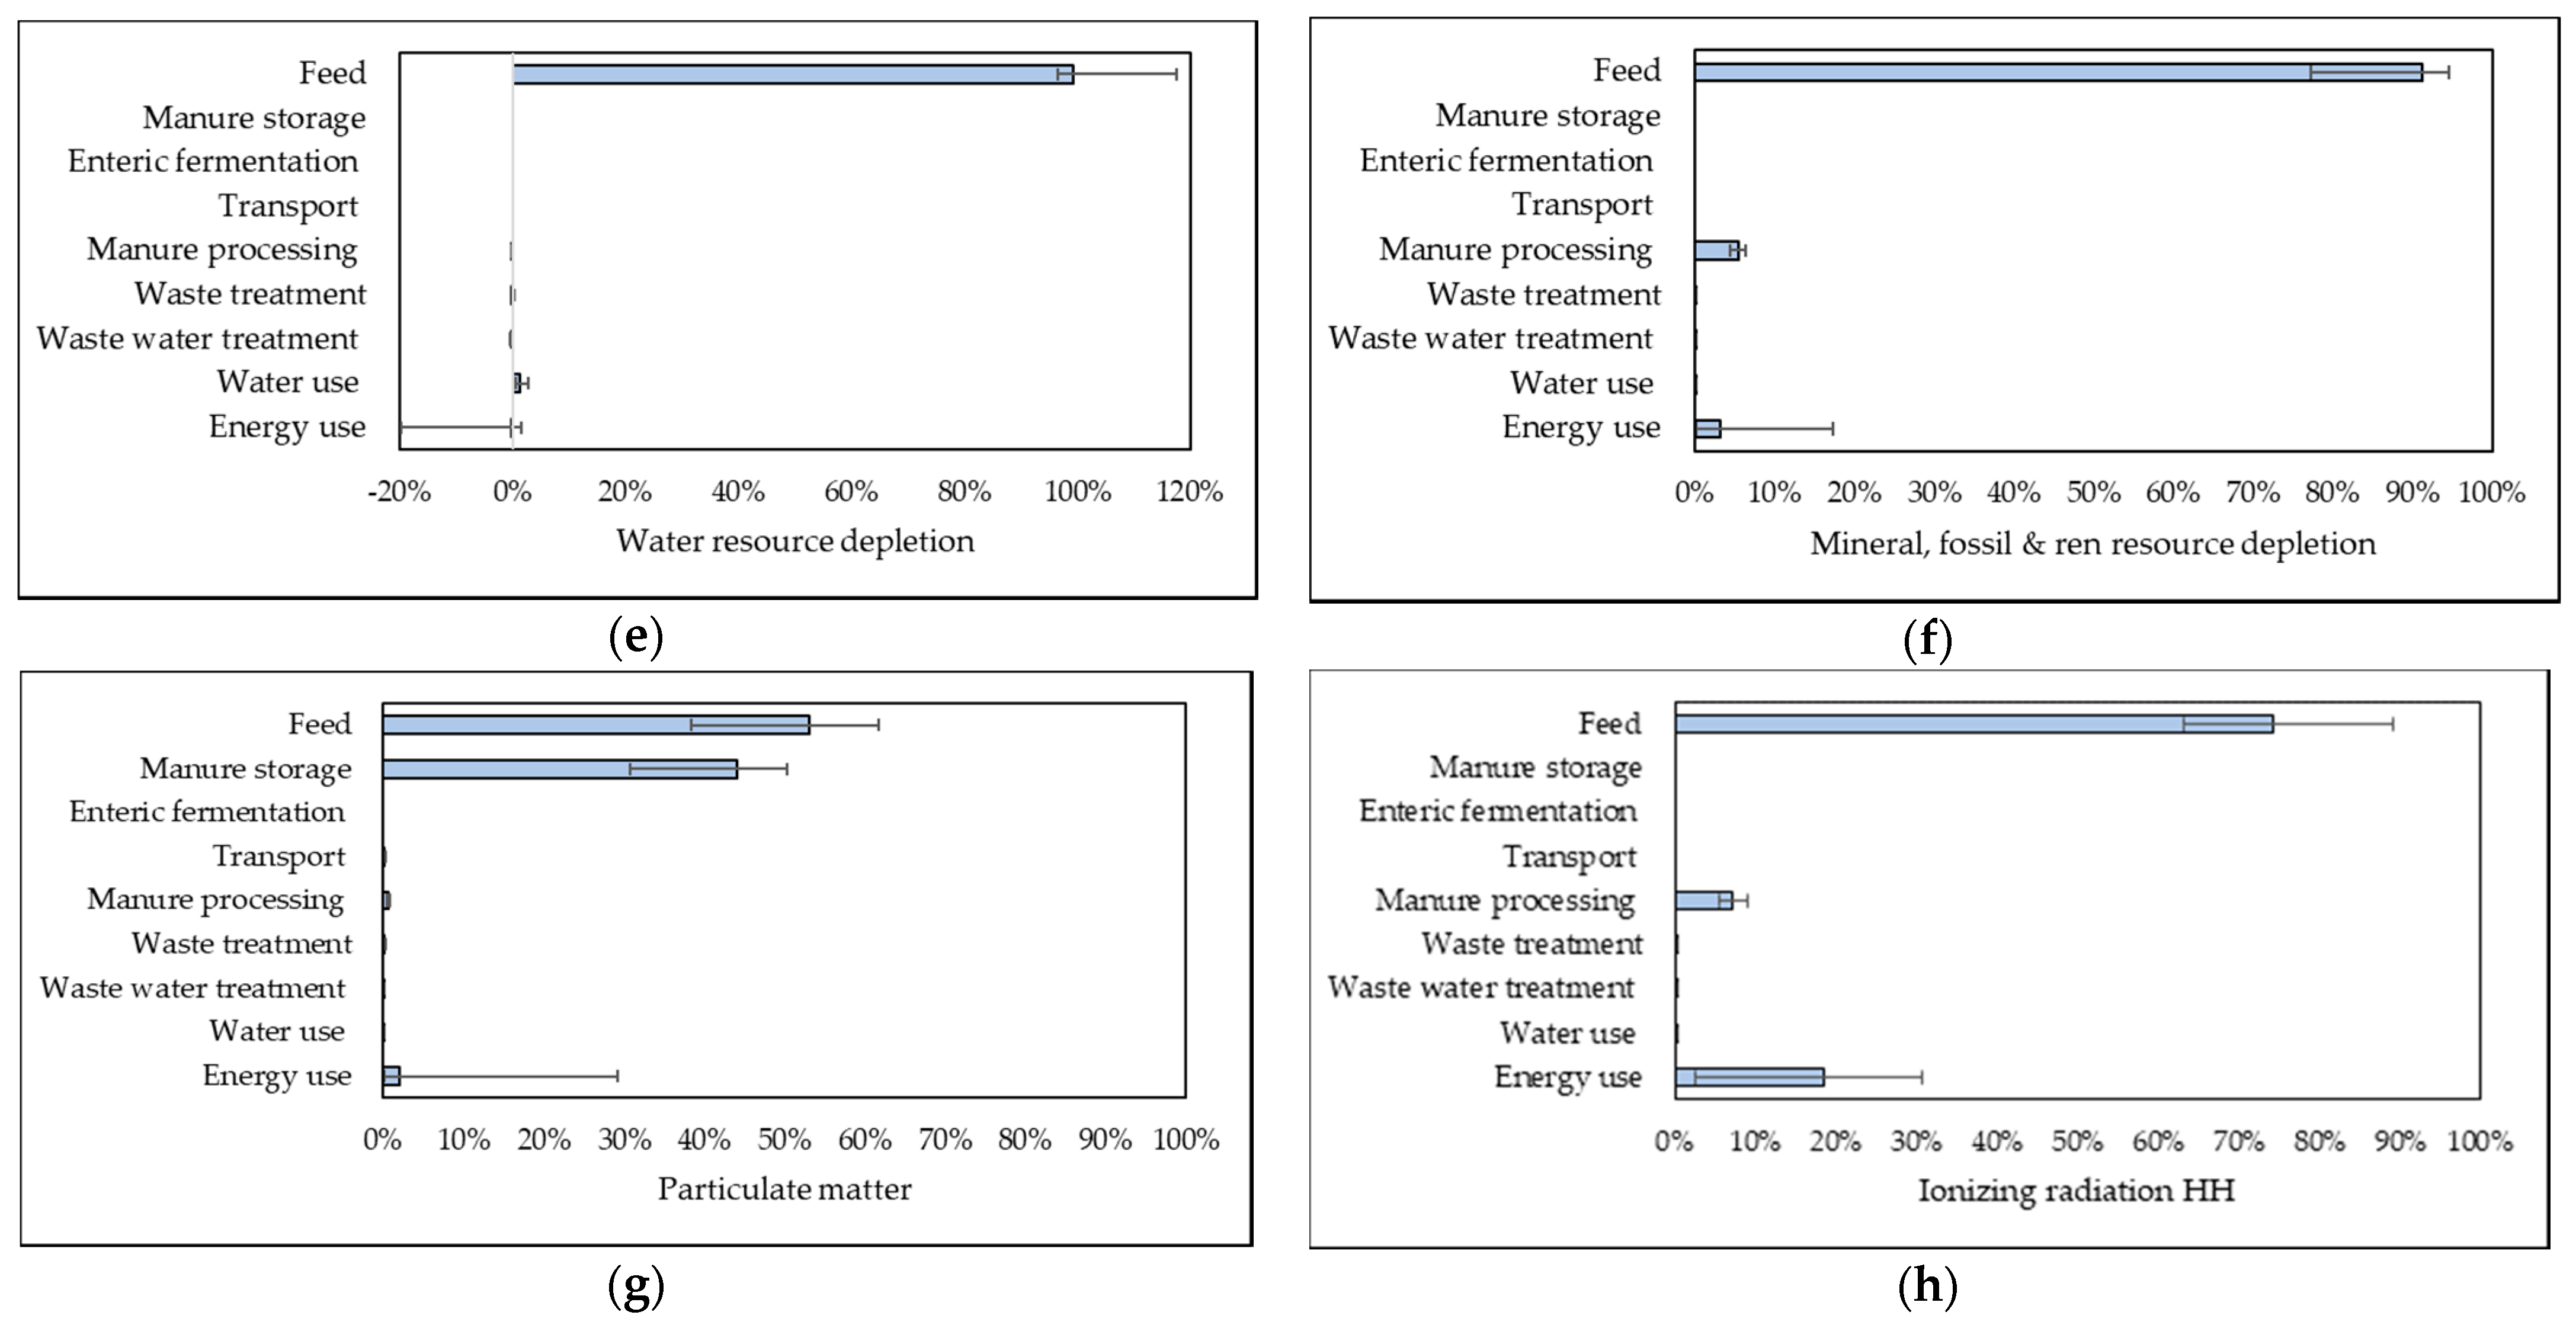
3.3. Contribution Analysis of the Environmental Impacts of the Studied Farms
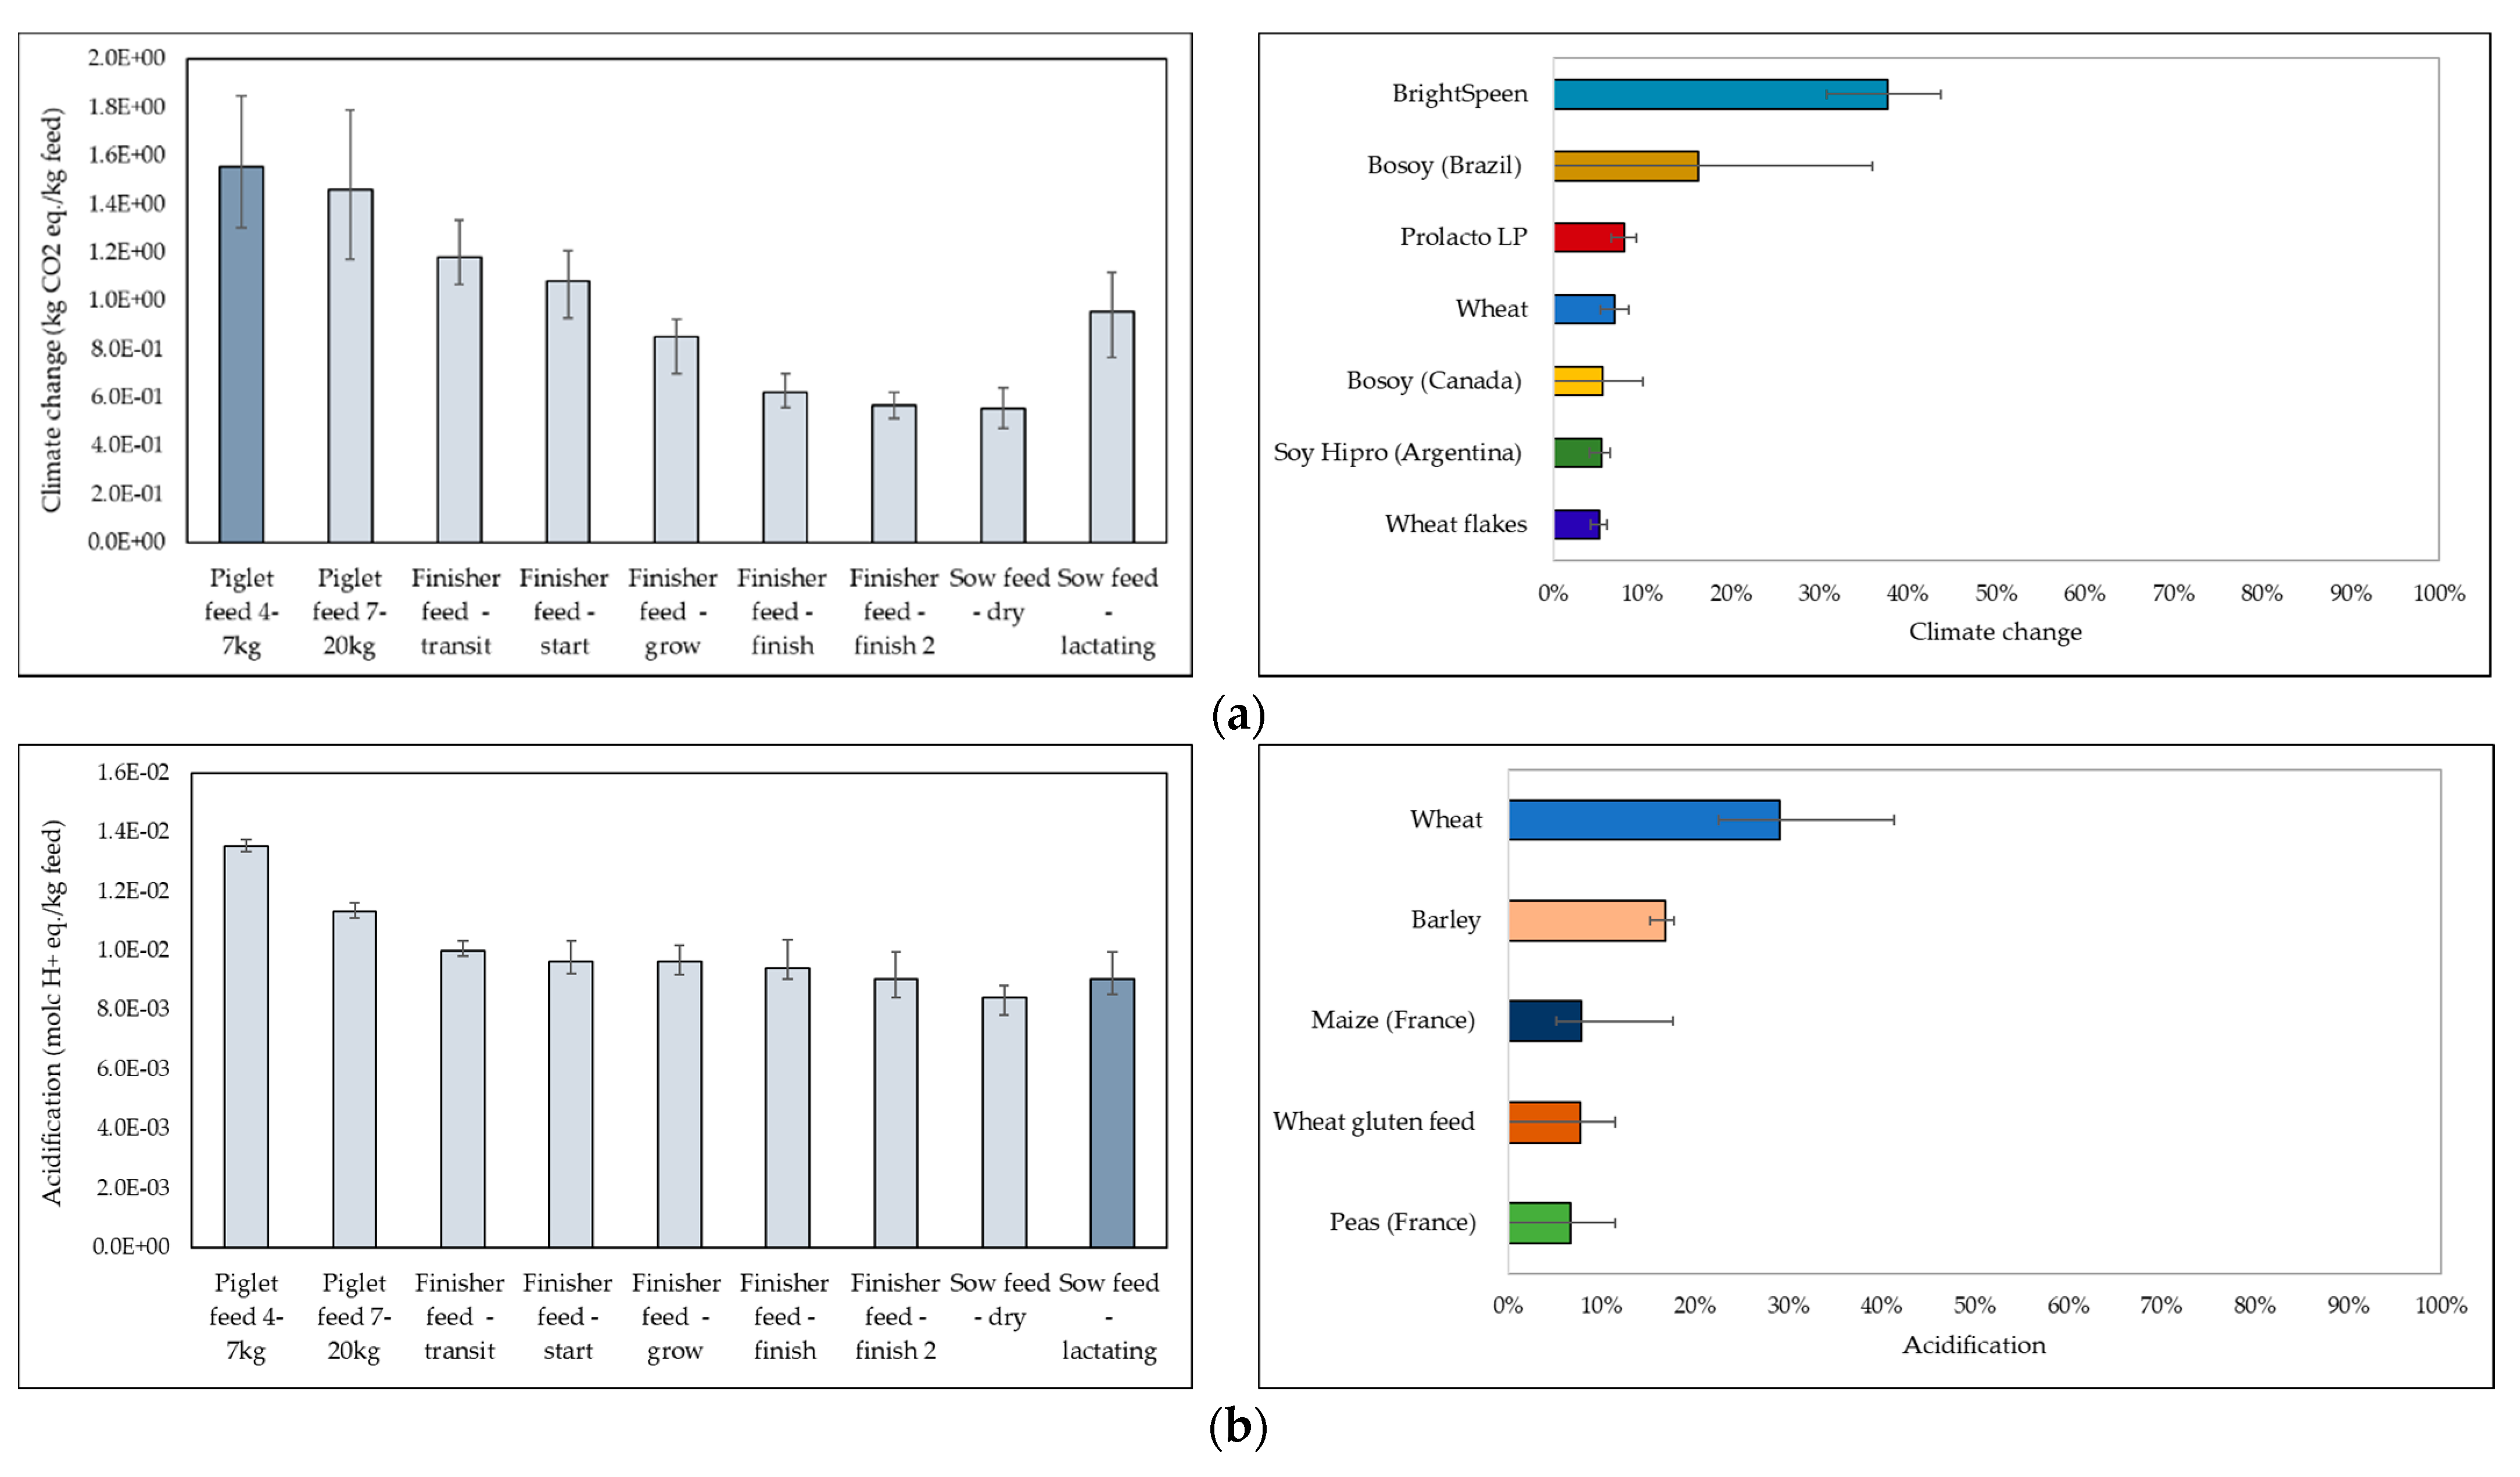
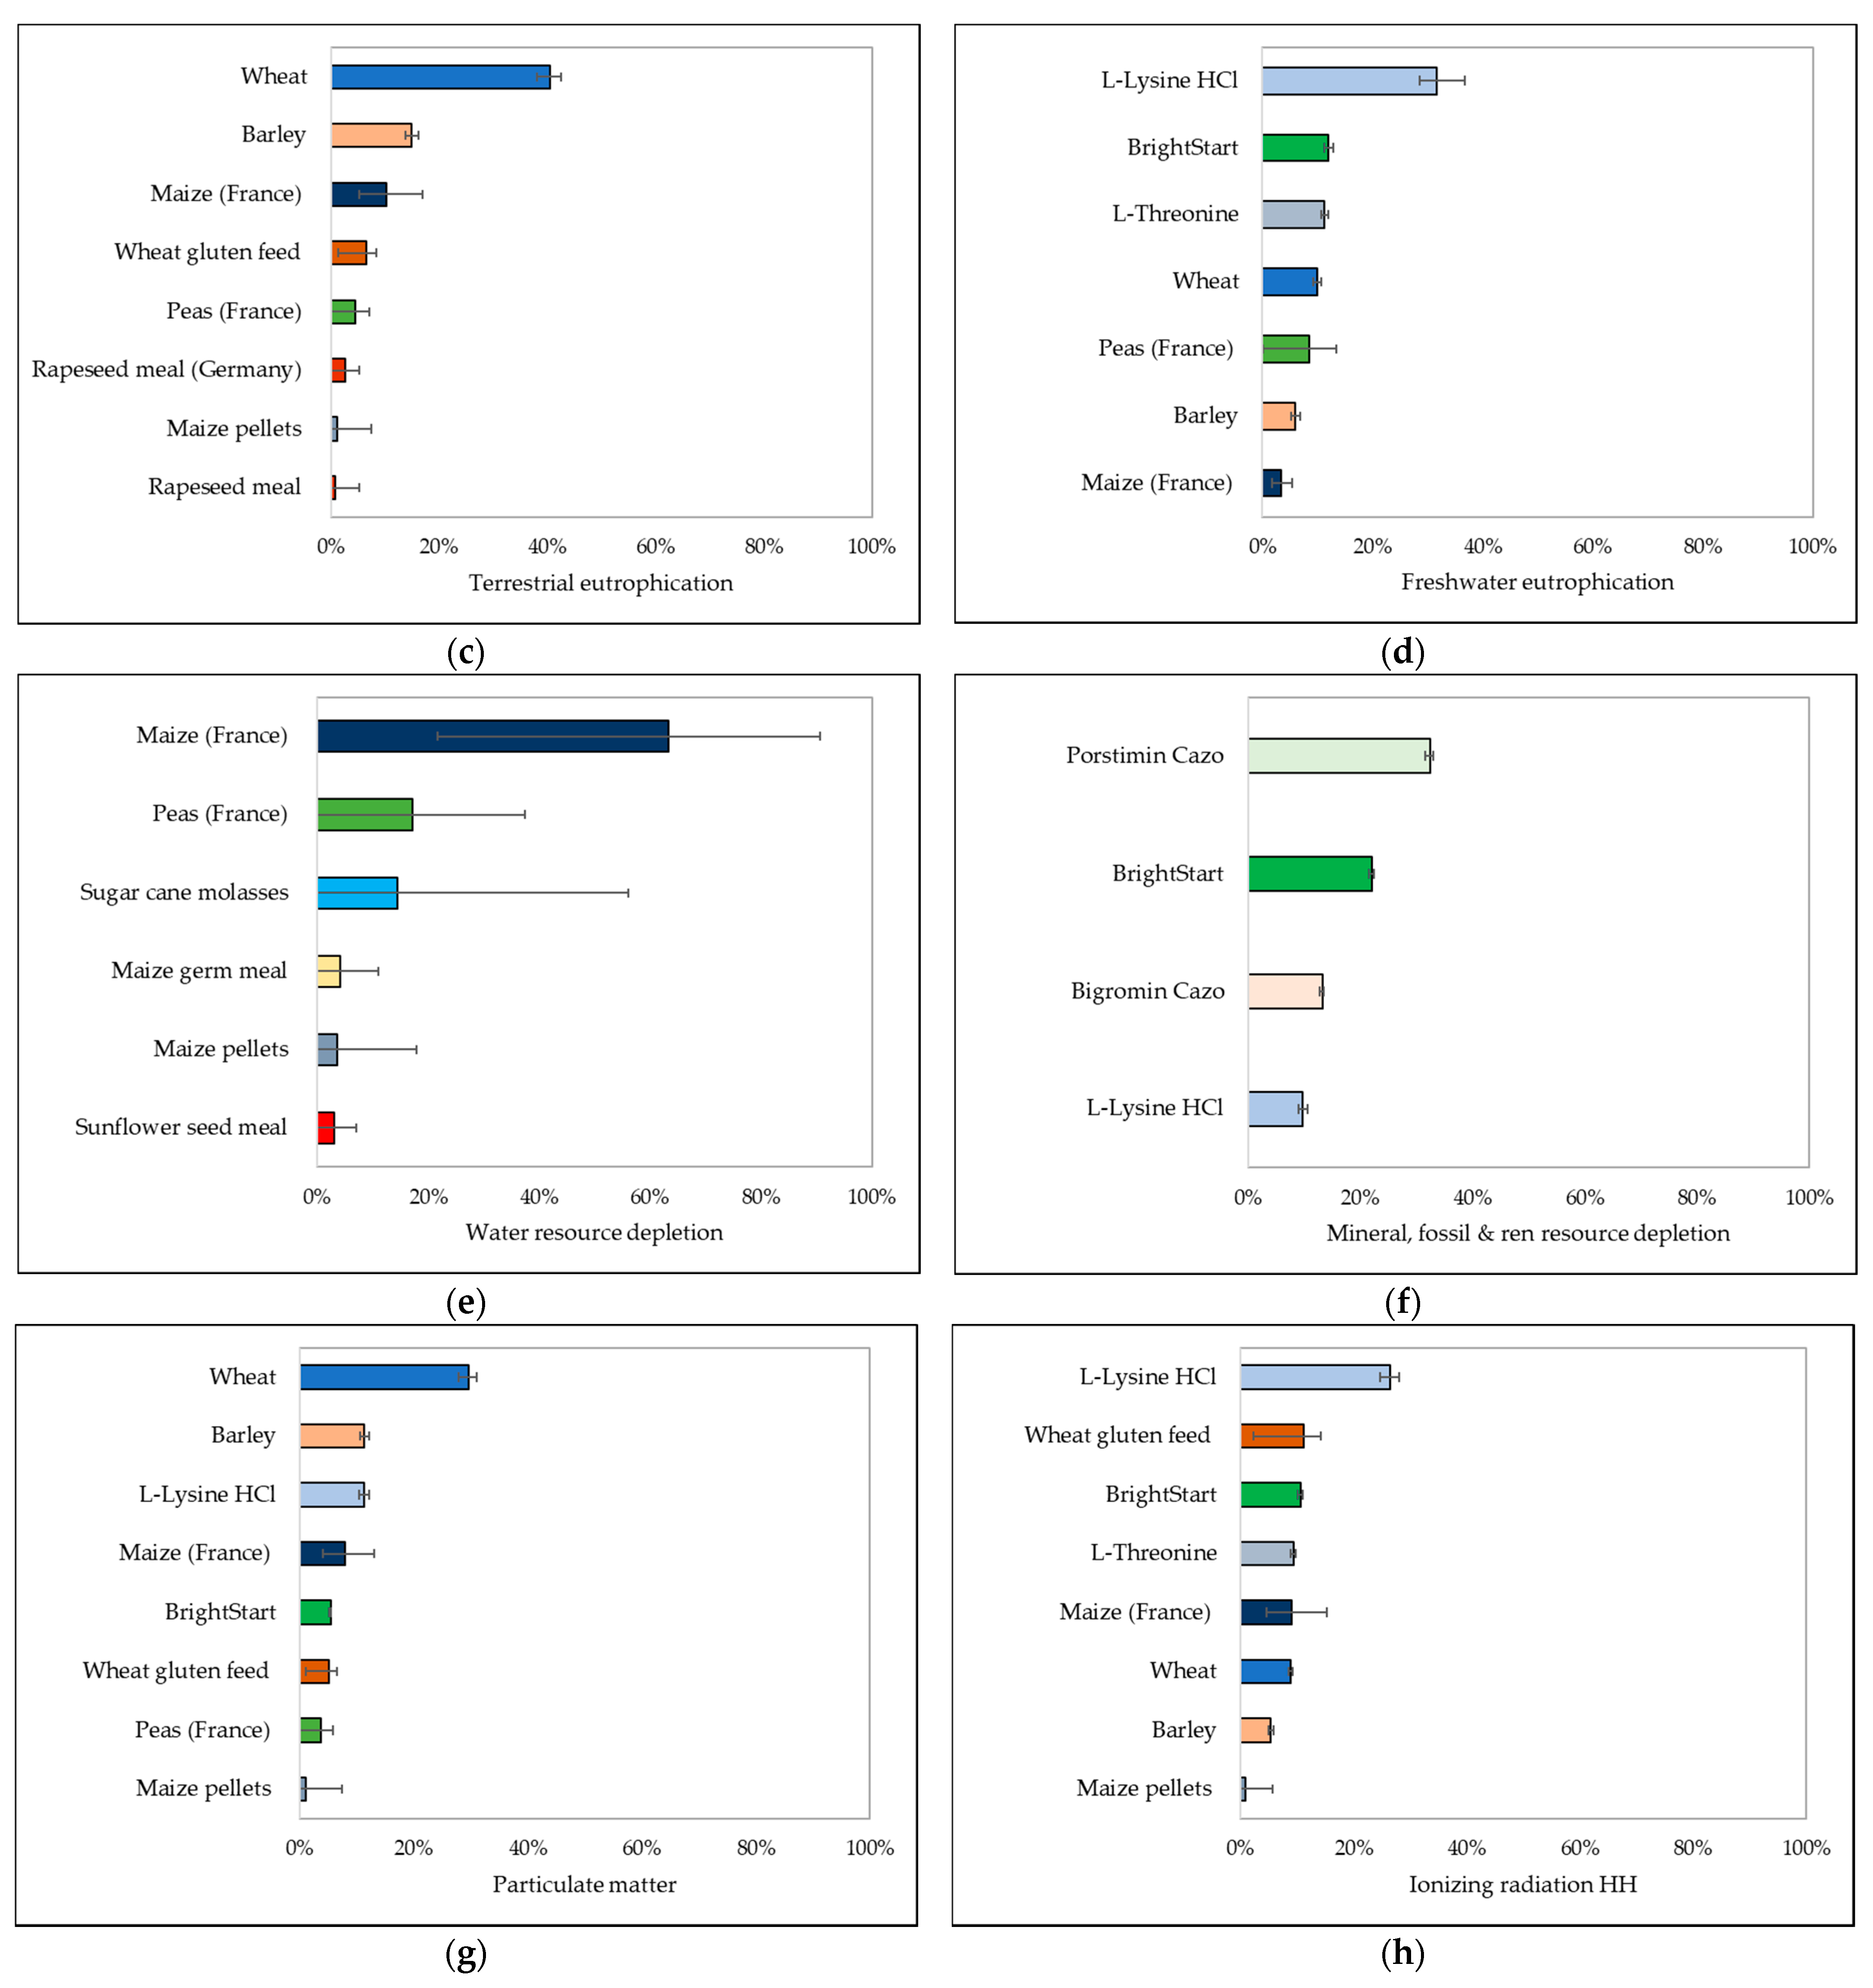
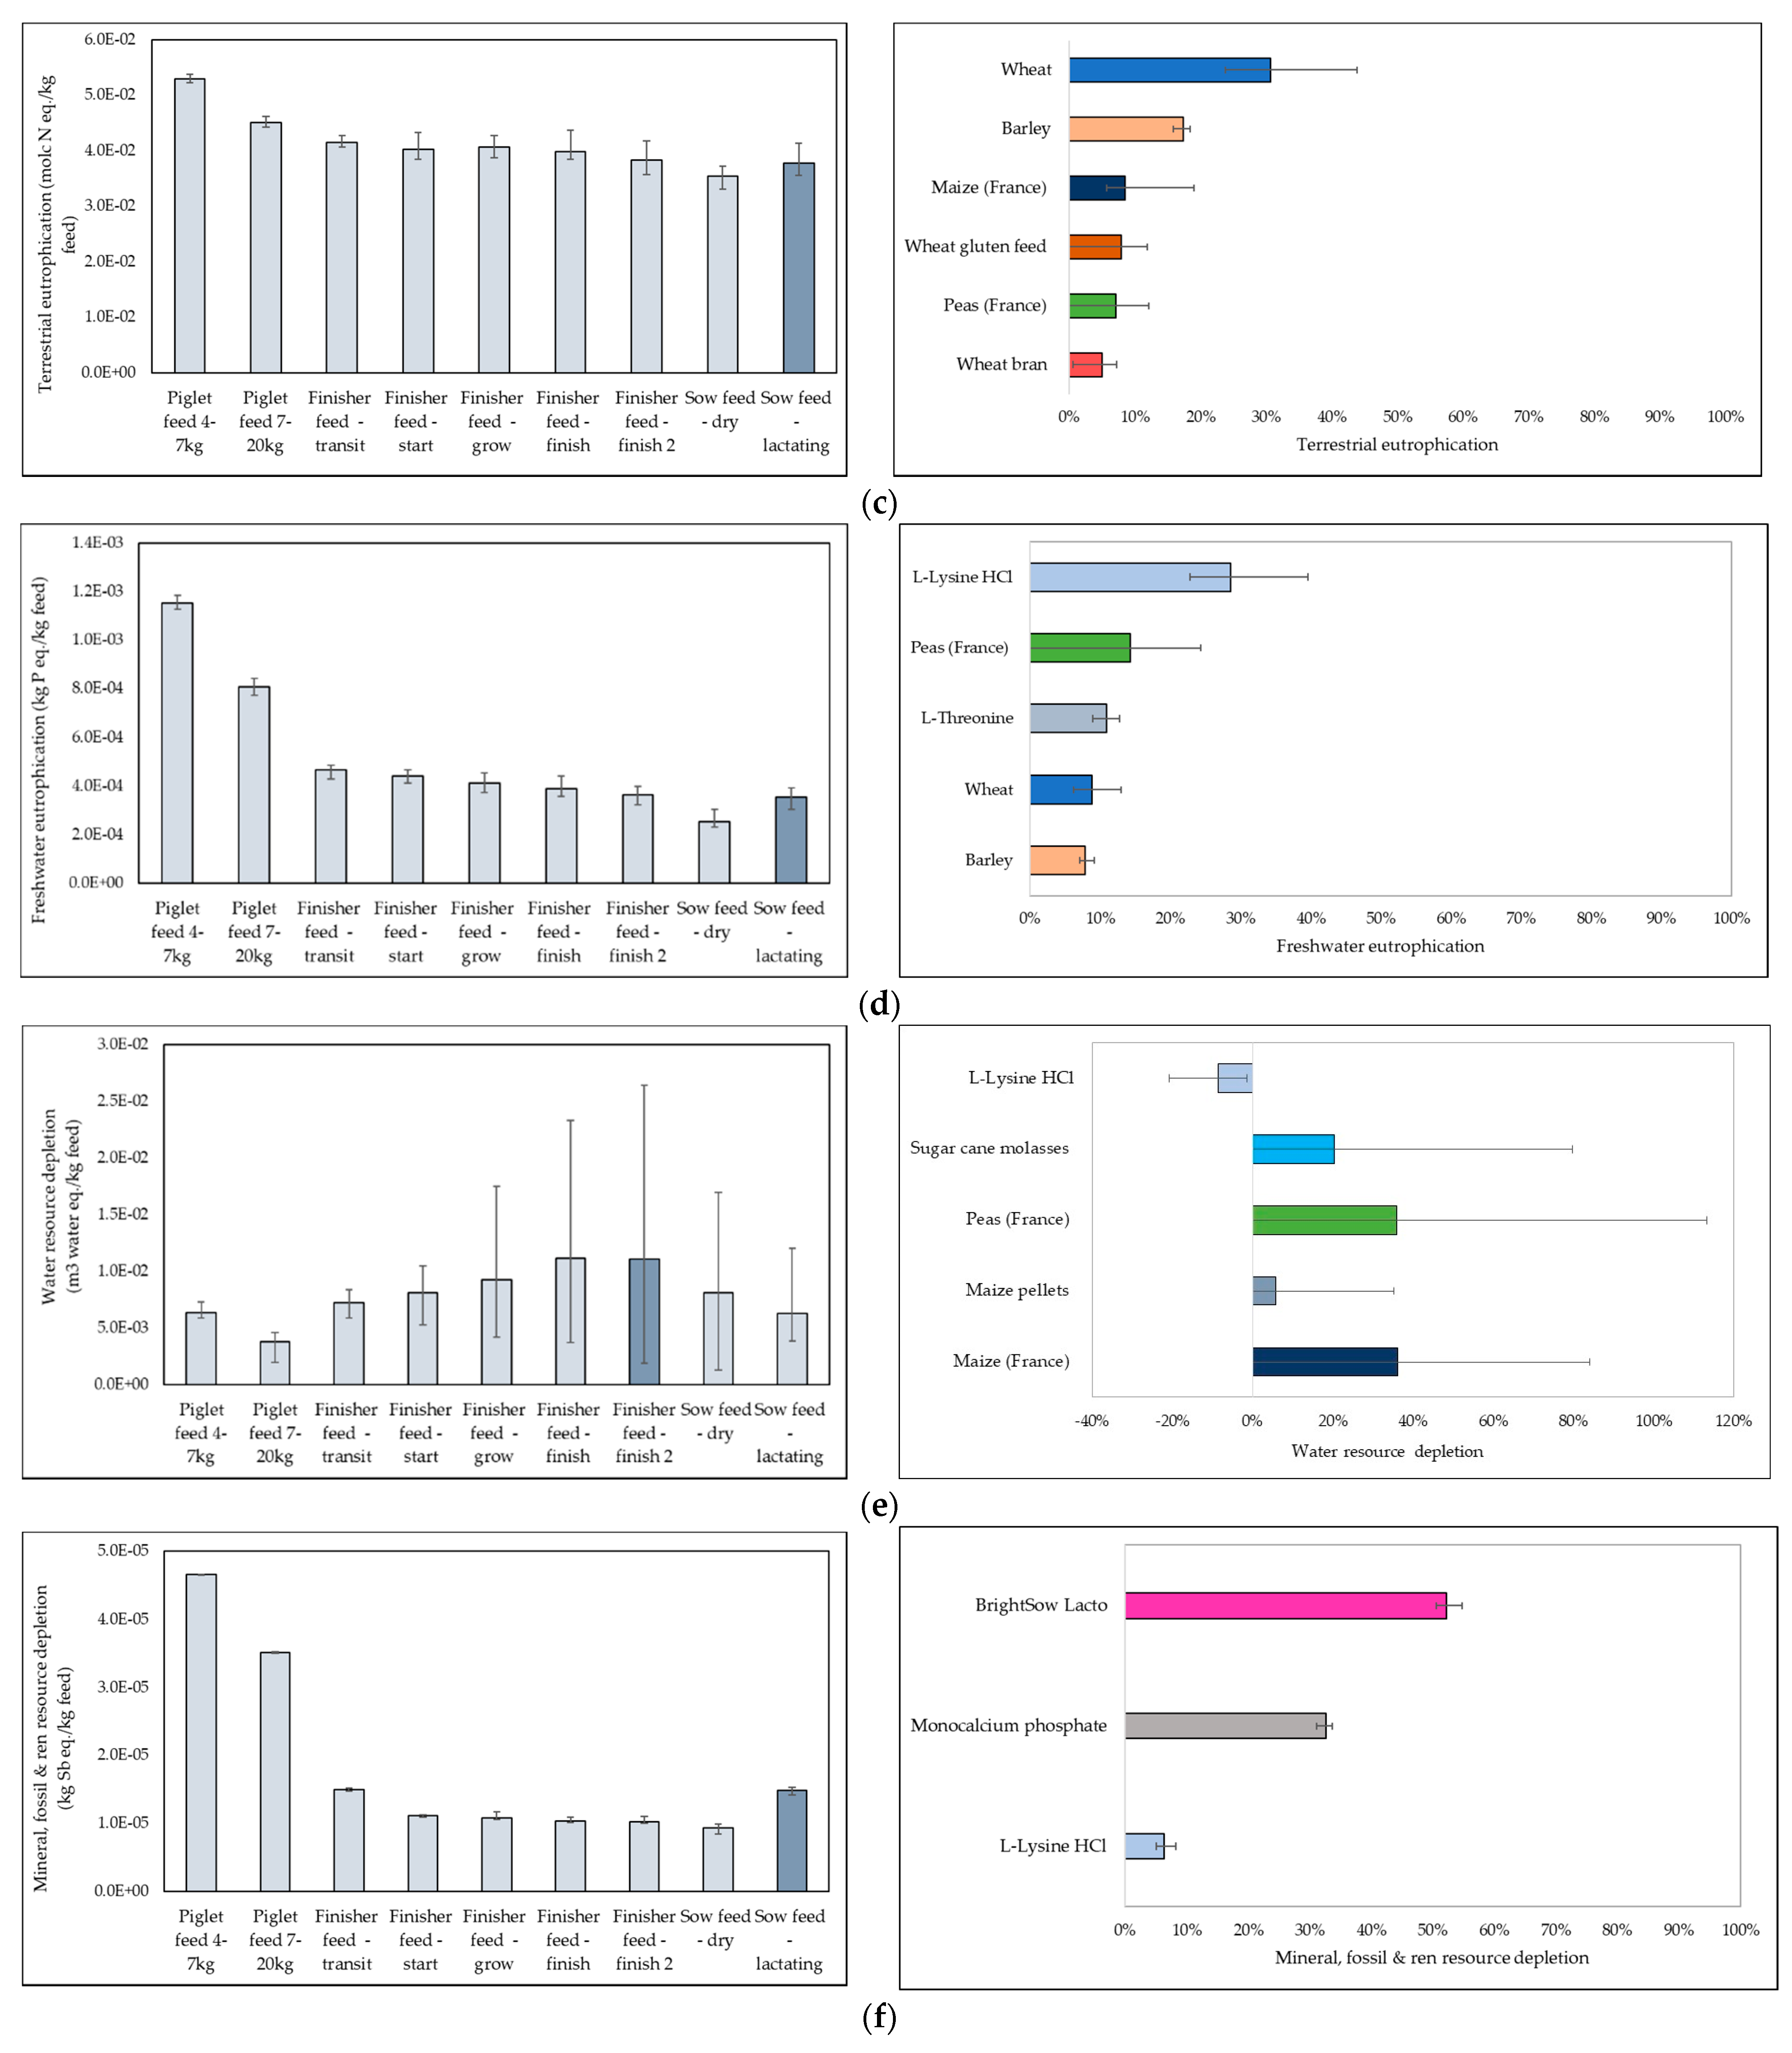
3.4. Environmental Impacts of Feed Products
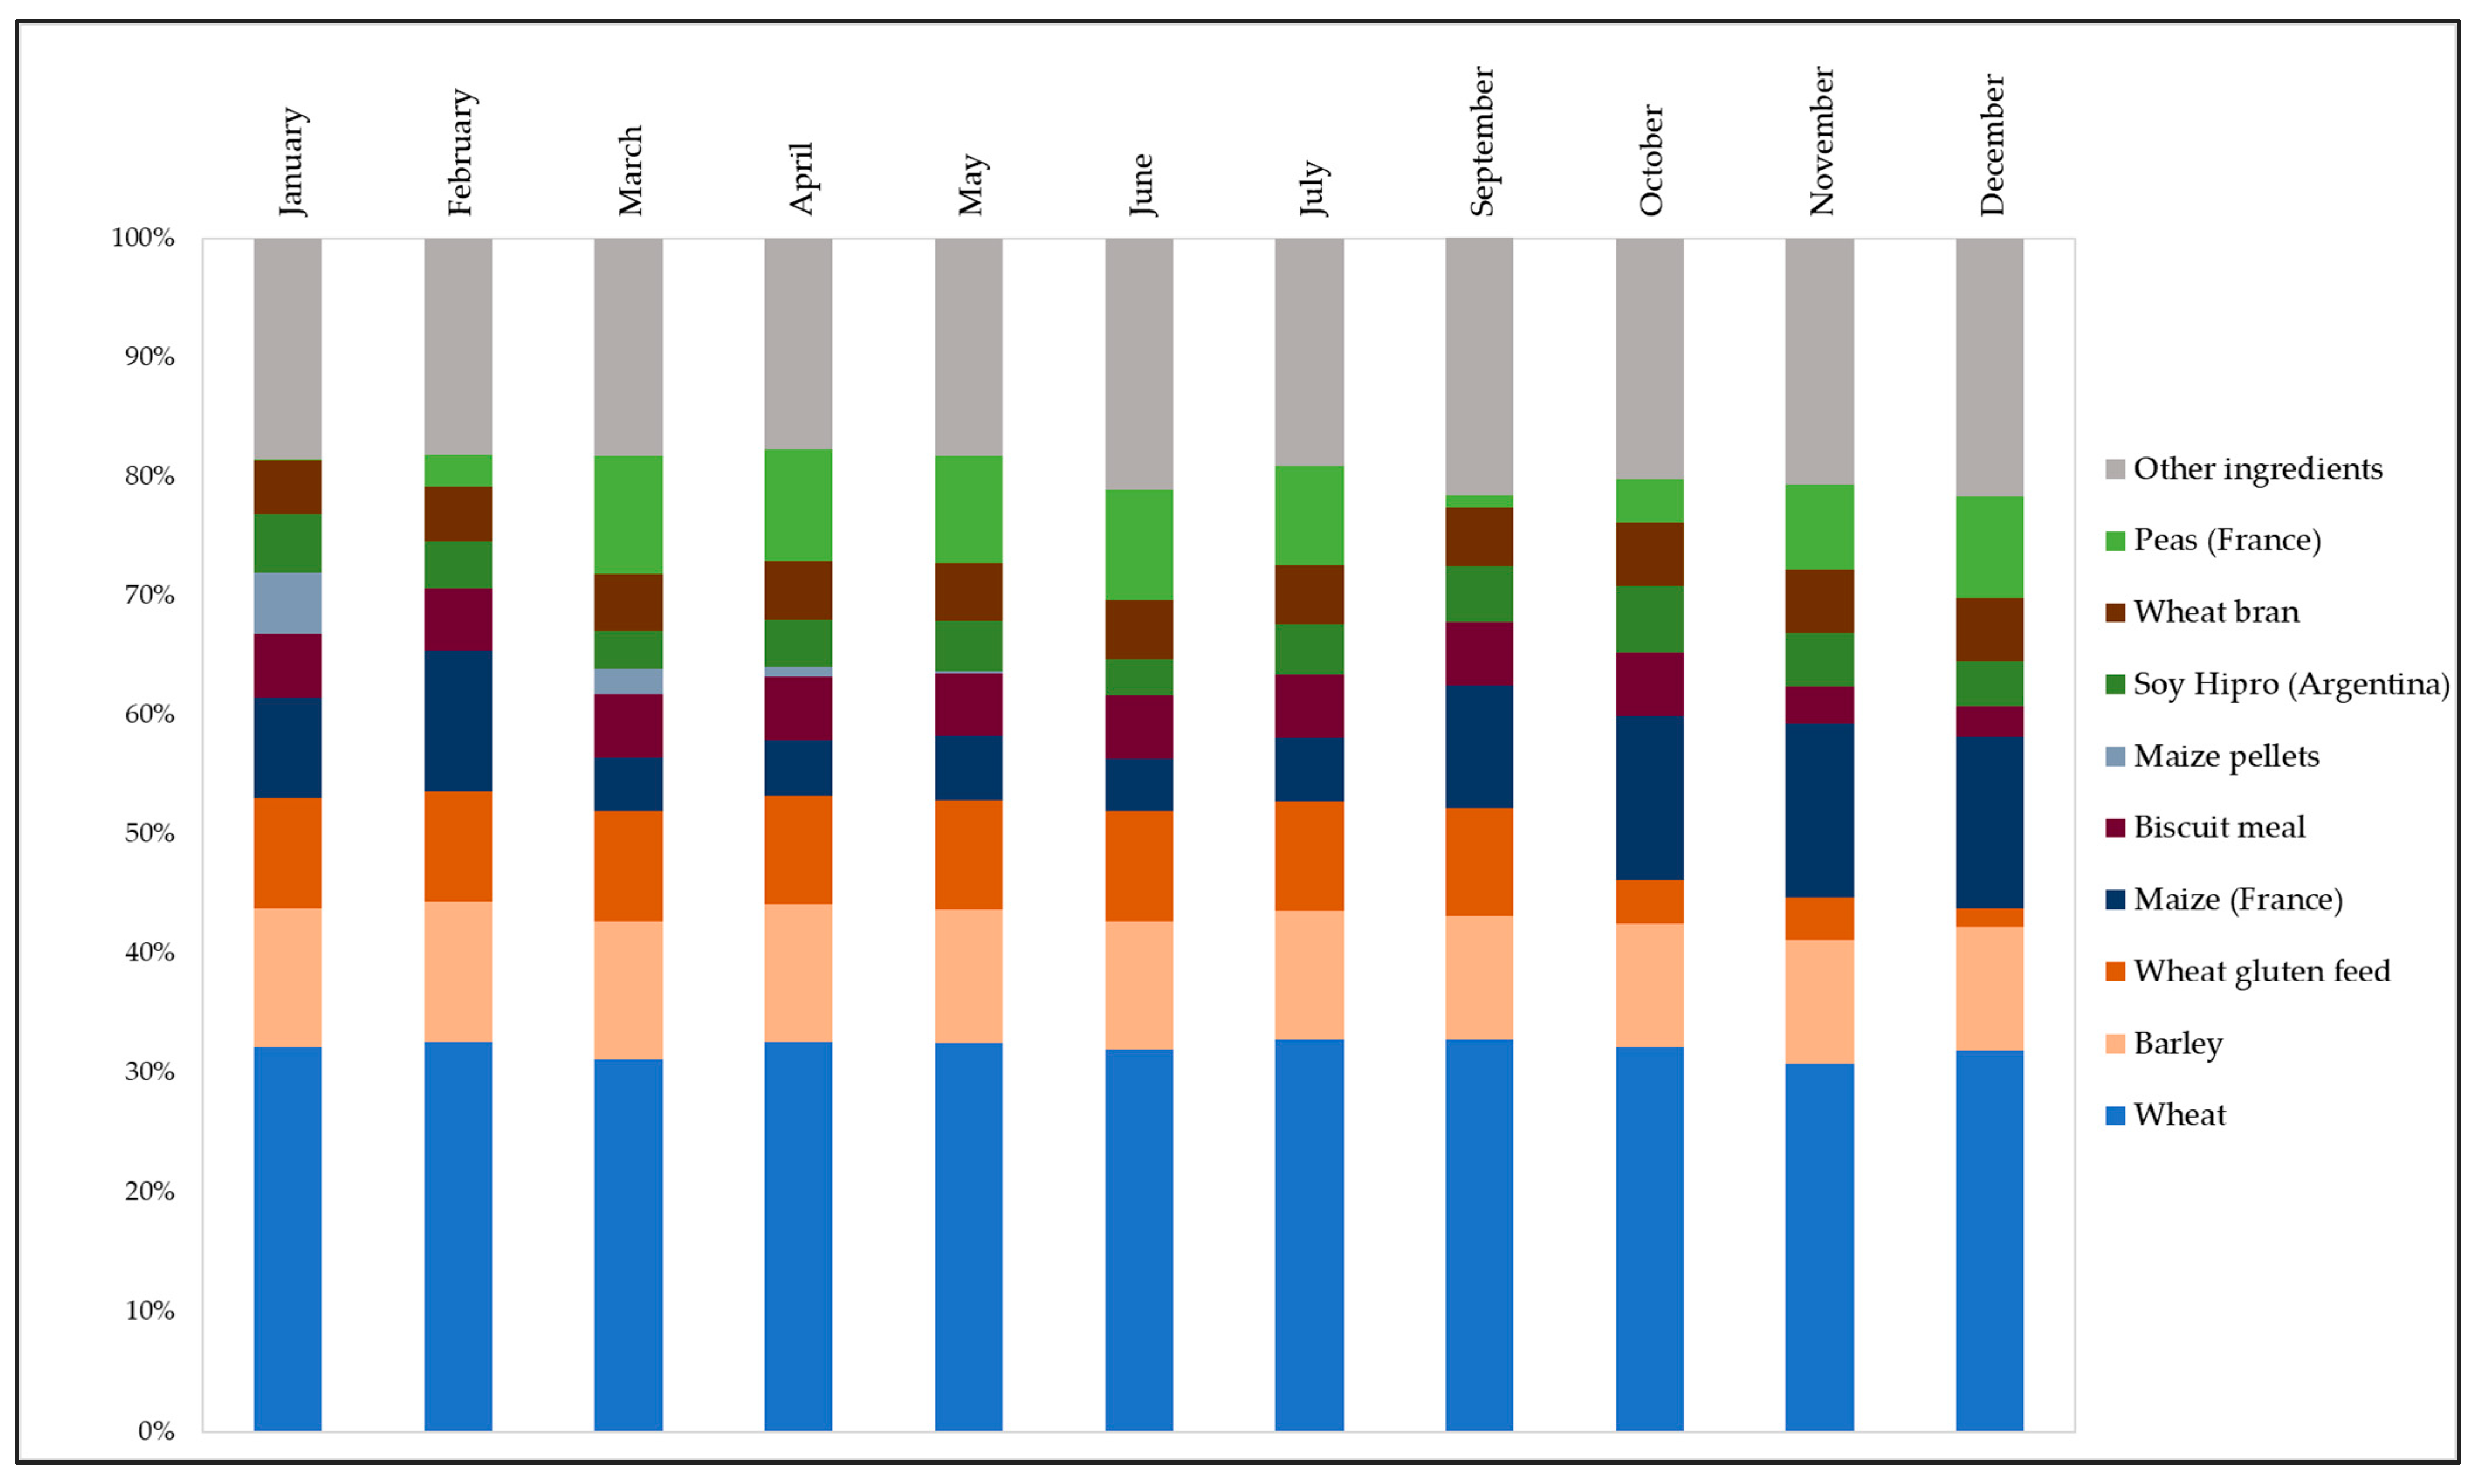
3.5. Environmental Impacts of Feed Consumption
4. Discussion
4.1. Environmental Impacts of Belgian Pig Production
4.2. Variability in Impact Results Due to Varying Farm Characteristics and Feed Compositions
4.3. The Environmental Impact of Feed and Its Contribution to the Environmental Impact of Pig Production
4.4. Limitations of This Study and Future Research
5. Conclusions
Supplementary Materials
Author Contributions
Funding
Institutional Review Board Statement
Informed Consent Statement
Data Availability Statement
Acknowledgments
Conflicts of Interest
References
- MacLeod, M.; Gerber, P.; Mottet, A.; Tempio, G.; Falcucci, A.; Opio, C.; Vellinga, T.; Henderson, B.; Steinfeld, H. Greenhouse Gas Emissions from Pig and Chicken Supply Chains; Food and Agriculture Organization of the United Nations: Rome, Italy, 2013; p. 196. [Google Scholar]
- FAOSTAT. FAO Statistical Database. 2021. Available online: https://www.fao.org/faostat/en/#data (accessed on 1 August 2021).
- OECD. Meat Consumption. 2021. Available online: https://data.oecd.org/agroutput/meat-consumption.htm (accessed on 1 August 2021).
- OECD/FAO. OECD-FAO Agricultural Outlook 2020–2029; FAO, Rome/OECD Publishing: Paris, France, 2020. [Google Scholar] [CrossRef]
- Departement Landbouw en Visserij. Uitdagingen voor de Vlaamse land- en tuinbouw-Landbouwrapport 2018. 2018. Available online: https://rundveeloket.be/sites/default/files/inline-files/2018%20Landbouwrapport.pdf (accessed on 1 August 2021).
- Departement Landbouw en Visserij. Landbouwrapport 2020. 2020. Available online: https://landbouwcijfers.vlaanderen.be/landbouwrapport-2020-lara (accessed on 1 August 2021).
- European Commission. The Nitrates Directive. 2020. Available online: https://ec.europa.eu/environment/water/water-nitrates/index_en.html (accessed on 1 August 2021).
- McAuliffe, G.; Takahashi, T.; Mogensen, L.; Hermansen, J.; Sage, C.; Chapman, D.; Lee, M. Environmental trade-offs of pig production systems under varied operational efficiencies. J. Clean. Prod. 2017, 165, 1163–1173. [Google Scholar] [CrossRef]
- Six, L.; De Wilde, B.; Vermeiren, F.; Van Hemelryck, S.; Vercaeren, M.; Zamagni, A.; Masoni, P.; Dewulf, J.; De Meester, S. Using the product environmental footprint for supply chain management: Lessons learned from a case study on pork. Int. J. Life Cycle Assess. 2017, 22, 1354–1372. [Google Scholar] [CrossRef] [Green Version]
- ERM en Universiteit Gent. Toepassen van de Carbon Footprint methodologie op Vlaamse Veehouderijproducten. Rapport in opdracht van Beleidsdomein Landbouw en Visserij, Afdeling Monitoring en Studie, Brussel. 2011. Available online: https://www.vlaanderen.be/publicaties/toepassen-van-de-carbon-footprint-methodologie-op-vlaamse-veehouderijproducten (accessed on 1 August 2021).
- Devers, L.; Kleynhans, T.; Mathijs, E. Comparative life cycle assessment of Flemish and Western Cape pork production. Agrekon 2012, 51, 105–128. [Google Scholar] [CrossRef]
- BFA. Samenstelling Diervoeding: Het Gebruik van Nevenstromen in de Diervoeding. 2015. Available online: https://bfa.be/BFA_Fact_Sheet (accessed on 1 August 2021).
- Departement Landbouw en Visserij. Kennis van Varkensvoeding Als Sleutel tot Rendabel Voederen. 2014. Available online: https://lv.vlaanderen.be/nl/voorlichting-info/publicaties/dier/varkens/kennis-van-varkensvoeding-als-sleutel-tot-rendabel (accessed on 1 August 2021).
- Soleimani, T.; Hermesch, S.; Gilbert, H. Economic and environmental assessments of combined genetics and nutrition optimization strategies to improve the efficiency of sustainable pork production. J. Anim. Sci. 2021, 99, 1–14. [Google Scholar] [CrossRef]
- de Quelen, F.; Brossard, L.; Wilfart, A.; Dourmad, J.-Y.; Garcia-Launay, F. Eco-Friendly Feed Formulation and On-Farm Feed Production as Ways to Reduce the Environmental Impacts of Pig Production Without Consequences on Animal Performance. Front. Vet. Sci. 2021, 8, 689012. [Google Scholar] [CrossRef]
- Monteiro, A.N.T.R.; Wilfart, A.; Utzeri, V.J.; Lukač, N.B.; Tomažin, U.; Costa, L.N.; Čandek-Potokar, M.; Fontanesi, L.; Garcia-Launay, F. Environmental impacts of pig production systems using European local breeds: The contribution of carbon sequestration and emissions from grazing. J. Clean. Prod. 2019, 237, 117843. [Google Scholar] [CrossRef]
- Dourmad, J.; Ryschawy, J.; Trousson, T.; Bonneau, M.; Gonzalez, J.; Houwers, H.; Hviid, M.; Zimmer, C.; Nguyen, T.L.T.; Morgensen, L. Evaluating environmental impacts of contrasting pig farming systems with life cycle assessment. Animal 2014, 8, 2027–2037. [Google Scholar] [CrossRef] [PubMed] [Green Version]
- Makara, A.; Kowalski, Z.; Łukasz, L.; Kulczycka, J. Comparative analyses of pig farming management systems using the Life Cycle Assessment method. J. Clean. Prod. 2019, 241, 118305. [Google Scholar] [CrossRef]
- Soleimani, T.; Gilbert, H. An approach to achieve overall farm feed efficiency in pig production: Environmental evaluation through individual life cycle assessment. Int. J. Life Cycle Assess. 2021, 26, 455–469. [Google Scholar] [CrossRef]
- Bandekar, P.A.; Leh, M.; Bautista, R.; Matlock, M.D.; Thoma, G.; Ulrich, R. Life cycle assessment of alternative swine management practices. J. Anim. Sci. 2018, 97, 472–484. [Google Scholar] [CrossRef]
- FAO. Environmental Performance of Pig Supply Chains: Guidelines for Assessment (Version 1). Livestock Environmental Assessment and Performance Partnership; FAO: Rome, Italy, 2018; Available online: https://www.fao.org/3/i8686en/I8686EN.pdf (accessed on 1 August 2021).
- Hauschild, M.Z.; Rosenbaum, R.K.; Olsen, S.I. . Life Cycle Assessment—Theory and Practice; Springer: Berlin/Heidelberg, Germany, 2018. [Google Scholar]
- ISO. ISO 14040 Environmental Management—Life Cycle Assessment—Principles and Framework. 2006. Available online: https://www.iso.org/standard/37456.html (accessed on 1 August 2021).
- ISO. ISO 14044, Environmental Management—Life Cycle Assessment—Requirements and Guidelines; ISO: Geneva, Switzerland, 2006. [Google Scholar]
- Wernet, G.; Bauer, C.; Steubing, B.; Reinhard, J.; Moreno-Ruiz, E.; Weidema, B. The ecoinvent database version 3 (part I): Overview and methodology. Int. J. Life Cycle Assess. 2016, 21, 1218–1230. [Google Scholar] [CrossRef]
- Durlinger, B.; Koukouna, E.; Broekema, R.; van Paassen, M.; Scholten, J. Agri-Footprint 4.0, Part 1: Methodology and Basic Principles. 2017. Available online: https://www.agri-footprint.com/wp-content/uploads/2018/03/Agri-Footprint-4.0-Part-1-Methodology-and-basic-principles-2018.pdf (accessed on 1 August 2021).
- Koch, P.; Salou, T. Agribalyse: Methodology—Version 1.3. Ademe. 2016. Available online: https://www.ademe.fr/sites/default/files/assets/documents/agribalyse_v1_3_methodology.pdf (accessed on 1 August 2021).
- European Commission. PEFCR Guidance Document—Guidance for the Development of Product Environmental Footprint Category Rules (PEFCRs), Version 6.3, December 2017. 2017. Available online: https://ec.europa.eu/environment/eussd/smgp/pdf/PEFCR_guidance_v6.3.pdf (accessed on 1 August 2021).
- FAO. Environmental Performance of Animal Feeds Supply Chains: Guidelines for Assessments. Livestock Environmental Assessment and Performance Partnership; FAO: Rome, Italy, 2016; Available online: https://www.fao.org/3/i6433e/i6433e.pdf (accessed on 1 August 2021).
- Corbala-Robles, L.; Sastafiana, W.; Van Linden, V.; Volcke, E.; Schaubroeck, T. Life cycle assessment of biological pig manure treatment versus direct land application—A trade-off story. Resour. Conserv. Recycl. 2018, 131, 86–98. [Google Scholar] [CrossRef]
- Flemish government—Department of Agriculture and Fisheries. Landbouwcijfers-Sectoroverzichten-Varkens. 2020. Available online: https://lv.vlaanderen.be/nl/voorlichting-info/publicaties-cijfers/landbouwcijfers#overzichtsrapporten (accessed on 1 August 2021).
- Danckaert, S.; Lenders, S. Waterverbruik en -Beschikbaarheid in Landbouw en Agrovoeding, Departement Landbouw en Visserij, Brussel. 2018. Available online: https://landbouwcijfers.vlaanderen.be/waterverbruik-en-beschikbaarheid-landbouw-en-agrovoeding (accessed on 1 August 2021).
- VLM Mestbank. Mestrapport 2019. 2019. Available online: https://publicaties.vlaanderen.be/view-file/38730 (accessed on 1 August 2021).
- VMM; VITO; AWAC; IBGE-BIM; IRCEL-CELINE; ECONOTEC. Belgium’s Greenhouse Gas Inventory (1990–2018) (NIR). 2020. Available online: https://climat.be/doc/nir-15-april-2020-final.pdf (accessed on 1 August 2021).
- McAuliffe, G.; Chapman, D.V.; Sage, C. A thematic review of life cycle assessment (LCA) applied to pig production. Environ. Impact Assess. Rev. 2016, 56, 12–22. [Google Scholar] [CrossRef]
- IPCC. Chapter 10: Emissions from Livestock and Manure Management. IPCC Guidelines for National Greenhouse Gas Inventories. 2006. Available online: https://www.ipcc-nggip.iges.or.jp/public/2006gl/ (accessed on 1 August 2021).
- EMEP/EEA. EMEP/EEA Air Pollutant Emission Inventory Guidebook 2019, 3.B Manure Management. 2019. Available online: https://www.eea.europa.eu/publications/emep-eea-guidebook-2019 (accessed on 1 August 2021).
- S&P Global. Portworld. 2021. Available online: https://www.portworld.com/map (accessed on 1 August 2021).
- Borlix. Soybeans. 2021. Available online: www.borlix.be/soybeans (accessed on 1 August 2021).
- European Commission—Joint Research Centre. ILCD Handbook: Framework and Requirements for LCIA Models and Indicators; Publications Office of the European Union: Luxembourg, 2010. [Google Scholar] [CrossRef]
- Kikuchi, Y. Life Cycle Assessment. In Plant Factory; Elsevier BV: Amsterdam, The Netherlands, 2016; pp. 321–329. [Google Scholar]
- European Commission; Joint Research Centre; Institute for Environment and Sustainability. Characterisation Factors of the ILCD Recommended Life Cycle Impact Assessment Methods, Database and Supporting Information, First; Publications Office of the European Union: Luxembourg, 2012. [Google Scholar] [CrossRef]
- VLM Mestbank. Mestbank 2010: Voortgangrapport over Het Mestbeleid in Vlaanderen. 2010. Available online: https://www.vlaanderen.be/publicaties/mestrapport (accessed on 1 August 2021).
- Itten, R.; Frischknecht, R.; Stucki, M.; Scherrer, P.; Psi, I. Life Cycle Inventories of Electricity Mixes and Grid; Paul Scherrer Inst.: Villigen, Switzerland, 2014; pp. 1–229. [Google Scholar]
- Pexas, G.; Mackenzie, S.G.; Wallace, M.; Kyriazakis, I. Environmental impacts of housing conditions and manure management in European pig production systems through a life cycle perspective: A case study in Denmark. J. Clean. Prod. 2020, 253, 120005. [Google Scholar] [CrossRef]
- Blonk Consultants. Direct Land Use Change Assessment Tool. 2016. Available online: https://www.agri-footprint.com/wp-content/uploads/2016/06/White-paper-Direct-Land-Use-Change-Tool-version-2016.1.pdf (accessed on 1 August 2021).
- van Zanten, H.H.E.; Bikker, P.; Meerburg, B.; De Boer, I. Attributional versus consequential life cycle assessment and feed optimization: Alternative protein sources in pig diets. Int. J. Life Cycle Assess. 2018, 23, 1–11. [Google Scholar] [CrossRef] [Green Version]
- Garcia-Launay, F.; van der Werf, H.; Nguyen, T.; Le Tutour, L.; Dourmad, J. Evaluation of the environmental implications of the incorporation of feed-use amino acids in pig production using Life Cycle Assessment. Livest. Sci. 2014, 161, 158–175. [Google Scholar] [CrossRef]
- Ogino, A.; Osada, T.; Takada, R.; Takagi, T.; Tsujimoto, S.; Tonoue, T.; Matsui, D.; Katsumata, M.; Yamashita, T.; Tanaka, Y. Life cycle assessment of Japanese pig farming using low-protein diet supplemented with amino acids. Soil Sci. Plant Nutr. 2013, 59, 107–118. [Google Scholar] [CrossRef]
- European Commission. Environmental Factsheet: Amino Acids. 2014. Available online: https://ec.europa.eu/jrc/sites/default/files/QMS_H08_BISO_D.8_BISO-EnvSust-Bioproducts-Amino-Acids_150513.pdf (accessed on 1 August 2021).
- Marinussen, M.; Kool, A. Environmental Impacts of Synthetic Amino Acid Production; Blonk Milieu Advies: Gouda, The Netherlands, 2010. [Google Scholar]
- Salemdeeb, R.; zu Ermgassen, E.K.; Kim, M.H.; Balmford, A.; Al-Tabbaa, A. Environmental and health impacts of using food waste as animal feed: A comparative analysis of food waste management options. J. Clean. Prod. 2017, 140, 871–880. [Google Scholar] [CrossRef] [Green Version]
- Boonen, R.; Aerts, S.; Meganck, M.; De Tavernier, J.; Lips, D.; Decuypere, E. Feed efficiencies in animal production: A non-numerical analysis. In Climate Change and Sustainable Development; Wageningen Academic Publishers: Wageningen, The Netherlands, 2012; pp. 196–201. [Google Scholar]
- Vrolijk, H.C.J.; de Bont, C.J.A.M.; van der Veen, H.B.; Wisman, J.H.; Poppe, K.J.; Volatility of Farm Incomes, Prices and Yields in the European Union. The Hague. 2009. Available online: https://edepot.wur.nl/11973 (accessed on 1 August 2021).
- Maes, D.; Vancauteren, M.; Van Passel, S. Correction to: Investigating market power in the Belgian pork production chain. Rev. Agric. Food Environ. Stud. 2019, 100, 119. [Google Scholar] [CrossRef] [Green Version]
- Asselin-Balençon, A.; Broekema, R.; Teulon, H.; Gastaldi, G.; Houssier, J.; Moutia, A. Agribalyse 3.0: The French Agricultural and Food LCI Database. Methodology for the Food Products. 2020. Available online: https://doc.agribalyse.fr/documentation-en/agribalyse-data/documentation/ (accessed on 1 August 2021).
- De Vries, J.W.; Melse, R. Comparing environmental impact of air scrubbers for ammonia abatement at pig houses: A life cycle assessment. Biosyst. Eng. 2017, 161, 53–61. [Google Scholar] [CrossRef]
- Scherer, L.; Tomasik, B.; Rueda, O.; Pfister, S. Framework for integrating animal welfare into life cycle sustainability assessment. Int. J. Life Cycle Assess. 2018, 23, 1476–1490. [Google Scholar] [CrossRef] [PubMed] [Green Version]


| Breeding | ||||
| Median | Mean | Min | Max | |
| Average number of sows | 2.41 × 10² | 2.73 × 10² | 8.78 × 101 | 7.82 × 10² |
| Average number of piglets < 7 kg | 4.65 × 10² | 5.41 × 10² | 1.29 × 10² | 1.74 × 10³ |
| Average number of replacement sows | 1.10 × 10² | 1.26 × 10² | 2.90 × 101 | 3.73 × 10² |
| Number of pigs produced per sow per year | 2.70 × 101 | 2.58 × 101 | 1.71 × 101 | 3.26 × 101 |
| Litters per sow per year | 2.36 | 2.33 | 2.08 | 2.52 |
| Weaning age (days) | 7.00 | |||
| Piglet mortality (%) | 1.34 × 101 | 1.43 × 101 | 3.56 | 2.42 × 101 |
| Finisher mortality (%) | 6.73 | 6.91 | 2.15 | 1.51 × 101 |
| Sow culling rate (%) | 4.40 × 101 | 4.46 × 101 | 3.16 × 101 | 6.03 × 101 |
| Sow mortality (%) | 6.72 | 6.65 | 2.28 | 1.23 × 101 |
| Feed intake per sow per year (kg) | 1.22 × 10³ | 1.22 × 10³ | 9.98 × 10² | 1.44 × 10³ |
| Total number of culled sows sold for meat per year | 1.10 × 10² | 1.26 × 10² | 2.90 × 101 | 3.73 × 10² |
| Fattening | ||||
| Average number of piglets 7–22 kg | 5.28 × 10² | 6.88 × 10² | 1.19 × 10² | 2.55 × 10³ |
| Average number of fattening pigs | 2.80 × 10³ | 2.96 × 10³ | 6.56 × 10² | 9.17 × 10³ |
| Weaning weight (kg) | 7.00 | 7.01 | 5.50 | 8.71 |
| Live weight at sale (kg) | 1.16 × 10² | 1.16 × 10² | 1.09 × 10² | 1.27 × 10² |
| Feed intake per finisher per year (kg) | 2.48 × 10² | 2.48 × 10² | 2.03 × 10² | 2.82 × 10² |
| Average daily gain (g) | 5.96 × 10² | 5.94 × 10² | 5.12 × 10² | 7.06 × 10² |
| Total number of fattened pigs sold for meat | 6.24 × 10³ | 7.20 × 10³ | 1.82 × 10³ | 2.29 × 10⁴ |
| Number of pigs produced per sow | 2.70 × 101 | 2.58 × 101 | 1.71 × 101 | 3.26 × 101 |
| Feed conversion efficiency (-) * | 3.4 × 10⁻¹ | 3.5 × 10⁻¹ | 3.1 × 10⁻¹ | 4.0 × 10⁻¹ |
| Productivity (year−1) ** | 9.4 | 9.0 | 5.4 | 1.2 × 101 |
| Inputs (per Year) | Selected Process | Database | ||||
| Energy | ||||||
| Median | Mean | Min | Max | |||
| Grid electricity (kWh) | 5.7 × 10⁴ | 7.5 × 10⁴ | 9.0 × 10³ | 2.3 × 10⁵ | Electricity, low voltage {BE}| market for | APOS, U | Ecoinvent v3 |
| Fuel oil (kg) | 1.6 × 10⁴ | 1.9 × 10⁴ | 0.0 | 6.3 × 10⁴ | Heavy fuel oil {Europe without Switzerland}| market for | APOS, U | Ecoinvent v3 |
| Diesel fuel (MJ) | 0.0 | 1.7 × 10² | 0.0 | 2.2 × 10³ | Diesel, burned in agricultural machinery {GLO} | APOS U | Ecoinvent v3 |
| Petroleum (kg) | 0.0 | 2.2 × 10² | 0.0 | 3.5 × 10³ | Petroleum {GLO}| market for | APOS, U | Ecoinvent v3 |
| Natural gas (kWh) | 0.0 | 4.0 × 10³ | 0.0 | 1.6 × 10⁵ | Heat, central or small-scale, natural gas {Europe without Switzerland}| market for heat, central or small-scale, natural gas | APOS, U | Ecoinvent v3 |
| Propane (MJ) | 0.0 | 3.3 × 101 | 0.0 | 1.3 × 10³ | Propane, burned in building machine {GLO} | market for | APOS U | Ecoinvent v3 |
| Wood pellets (kWh) | 0.0 | 6.0 × 10³ | 0.0 | 1.7 × 10⁵ | Heat, central or small-scale, other than natural gas {Europe without Switzerland}| heat production, wood pellet, at furnace 9 kW | APOS, U | Ecoinvent v3 |
| Water | ||||||
| Median | Mean | Min | Max | |||
| Tap water (m3) | 4.4 × 10² | Tap water {Europe without Switzerland}| market for | APOS, U | Ecoinvent v3 | |||
| Ground water, shallow (m3) | 3.4 × 10³ | Water, well, in ground, BE | Raw material | |||
| Ground water, deep (m3) | 4.6 × 10³ | Water, well, in ground, BE | Raw material | |||
| Rain water (m3) | 1.1 × 10³ | Water, rain | Raw material | |||
| Feed | ||||||
| Median | Mean | Min | Max | |||
| Piglet feed compound 4–7 kg (kg) | 2.0 × 10³ | 3.2 × 10³ | 0.0 | 2.0 × 10⁴ | Composed process, see Figure 2 and Table S1 in the supplementary material | / |
| Piglet feed compound 7–20 kg (kg) | 1.8 × 10⁵ | 2.1 × 10⁵ | 3.3 × 10⁴ | 7.4 × 10⁵ | Composed process, see Figure 2 and Table S1 in the supplementary material | / |
| Finisher feed compound—transit (17–30 kg) (kg) | 6.7 × 10⁴ | 7.8 × 10⁴ | 1.9 × 10⁴ | 2.6 × 10⁵ | Composed process, see Figure 2 and Table S1 in the supplementary material | / |
| Finisher feed compound—start (25–50 kg) (kg) | 4.0 × 10⁵ | 4.7 × 10⁵ | 1.1 × 10⁵ | 1.6 × 10⁶ | Composed process, see Figure 2 and Table S1 in the supplementary material | / |
| Finisher feed compound—grow (50–80 kg) (kg) | 6.7 × 10⁵ | 7.8 × 10⁵ | 1.9 × 10⁵ | 2.6 × 10⁶ | Composed process, see Figure 2 and Table S1 in the supplementary material | / |
| Finisher feed compound—finish (80–100 kg) (kg) | 2.5 × 10⁵ | 2.9 × 10⁵ | 7.3 × 10⁴ | 9.5 × 10⁵ | Composed process, see Figure 2 and Table S1 in the supplementary material | / |
| Finisher feed compound—finish 2 (100–120 kg) (kg) | 2.5 × 10⁵ | 2.9 × 10⁵ | 7.3 × 10⁴ | 9.5 × 10⁵ | Composed process, see Figure 2 and Table S1 in the supplementary material | / |
| Sow feed compound—dry (kg) | 1.9 × 10⁵ | 2.1 × 10⁵ | 6.4 × 10⁴ | 6.0 × 10⁵ | Composed process, see Figure 2 and Table S1 in the supplementary material | / |
| Sow feed compound—lactating (kg) | 1.1 × 10⁵ | 1.2 × 10⁵ | 3.6 × 10⁴ | 3.4 × 10⁵ | Composed process, see Figure 2 and Table S1 in the supplementary material | / |
| Replacement sow feed compound (kg) | 4.8 × 10³ | 5.4 × 10³ | 1.3 × 10³ | 1.6 × 10⁴ | Equal to sow feed compound—dry | / |
| Transport | ||||||
| Median | Mean | Min | Max | |||
| Feed from feed plant to farm (tkm) | 4.9 × 10⁴ | 6.4 × 10⁵ | 1.7 × 10⁵ | 2.0 × 10⁵ | Transport, truck 10–20 t, EURO5, 80%LF, default/GLO Economic | Agrifootprint v4.0 |
| Animal waste from farm to incineration (tkm) | 1.0 × 10³ | 1.2 × 10³ | 1.2 × 10² | 3.9 × 10³ | Transport, truck 10–20 t, EURO5, 80%LF, default/GLO Economic | Agrifootprint v4.0 |
| Manure from farm to manure processing | 1.1 × 10⁴ | 1.4 × 10⁵ | 4.0 × 10⁴ | 4.4 × 10⁴ | Transport, truck 10–20 t, EURO5, 80%LF, default/GLO Economic | Agrifootprint v4.0 |
| Waste: outputs to technosphere | ||||||
| Median | Mean | Min | Max | |||
| Waste water (m3) | 2.14 × 10² | Wastewater, average {Europe without Switzerland}| market for wastewater, average | APOS, U | Ecoinvent v3 | |||
| Culled animals, not sold/not edible (kg) | 3.4 × 10⁴ | 3.9 × 10⁴ | 3.9 × 10³ | 1.3 × 10⁵ | Biowaste {GLO}| treatment of biowaste, municipal incineration | APOS, U | Ecoinvent v3 |
| Manure (kg) | 1.3 × 10⁶ | 1.4 × 10⁶ | 3.6 × 10⁵ | 4.6 × 10⁶ | Manure processing: biological removal of nitrogen from the thin fraction of manure after mechanical separation and composting of the solid fraction | Process based on [30] |
| Useful Outputs | ||||||
| Median | Mean | Min | Max | |||
| Live weight pigs to slaughtering (kg) | 7.3 × 10⁵ | 8.6 × 10⁵ | 2.1 × 10⁵ | 2.7 × 10⁶ | / | / |
| Environmental Impact Category | Unit | Mean | Min | Max | CV |
|---|---|---|---|---|---|
| Climate change | kg CO2 eq. | 3.22 | 2.57 | 3.89 | 7.55% |
| Ozone depletion | kg CFC-11 eq. | 1.07 × 10⁻⁷ | 8.87 × 10⁻⁸ | 1.28 × 10⁻⁷ | 7.91% |
| Human toxicity, non-cancer effects | CTUh | 5.37 × 10⁻⁶ | 4.36 × 10⁻⁶ | 6.32 × 10⁻⁶ | 7.46% |
| Human toxicity, cancer effects | CTUh | 7.55 × 10⁻⁸ | 6.24 × 10⁻⁸ | 8.90 × 10⁻⁸ | 7.41% |
| Particulate matter | kg PM2.5 eq. | 1.67 × 10⁻³ | 1.31 × 10⁻³ | 2.38 × 10⁻³ | 10.38% |
| Ionizing radiation HH | kBq U235 eq. | 2.05 × 10⁻¹ | 1.60 × 10⁻¹ | 2.58 × 10⁻¹ | 10.07% |
| Ionizing radiation E (interim) (CTUe) | CTUe | 1.11 × 10⁻⁶ | 9.28 × 10⁻⁷ | 1.34 × 10⁻⁶ | 7.77% |
| Photochemical ozone formation | kg NMVOC eq. | 5.64 × 10⁻³ | 4.60 × 10⁻³ | 6.77 × 10⁻³ | 7.95% |
| Acidification | molc H+ eq. | 5.40 × 10⁻² | 4.28 × 10⁻² | 6.43 × 10⁻² | 7.49% |
| Terrestrial eutrophication | molc N eq. | 2.34 × 10⁻¹ | 1.84 × 10⁻¹ | 2.78 × 10⁻¹ | 7.57% |
| Freshwater eutrophication | kg P eq. | 1.28 × 10⁻³ | 1.07 × 10⁻³ | 1.50 × 10⁻³ | 6.97% |
| Marine eutrophication | kg N eq. | 3.01 × 10⁻² | 2.54 × 10⁻² | 3.47 × 10⁻² | 6.45% |
| Freshwater ecotoxicity | CTUe | 4.51 × 101 | 3.63 × 101 | 5.43 × 101 | 7.84% |
| Land use | kg C deficit | 4.16 × 101 | 3.39 × 101 | 5.05 × 101 | 7.85% |
| Water resource depletion | m3 water eq. | 2.38 × 10⁻² | 1.04 × 10⁻² | 4.97 × 10⁻² | 42.11% |
| Mineral, fossil and renewable resource depletion | kg Sb eq. | 4.12 × 10⁻⁵ | 3.53 × 10⁻⁵ | 4.95 × 10⁻⁵ | 7.46% |
Publisher’s Note: MDPI stays neutral with regard to jurisdictional claims in published maps and institutional affiliations. |
© 2021 by the authors. Licensee MDPI, Basel, Switzerland. This article is an open access article distributed under the terms and conditions of the Creative Commons Attribution (CC BY) license (https://creativecommons.org/licenses/by/4.0/).
Share and Cite
Van Mierlo, K.; Baert, L.; Bracquené, E.; De Tavernier, J.; Geeraerd, A. The Influence of Farm Characteristics and Feed Compositions on the Environmental Impact of Pig Production in Flanders: Productivity, Energy Use and Protein Choices Are Key. Sustainability 2021, 13, 11623. https://doi.org/10.3390/su132111623
Van Mierlo K, Baert L, Bracquené E, De Tavernier J, Geeraerd A. The Influence of Farm Characteristics and Feed Compositions on the Environmental Impact of Pig Production in Flanders: Productivity, Energy Use and Protein Choices Are Key. Sustainability. 2021; 13(21):11623. https://doi.org/10.3390/su132111623
Chicago/Turabian StyleVan Mierlo, Klara, Louise Baert, Ellen Bracquené, Johan De Tavernier, and Annemie Geeraerd. 2021. "The Influence of Farm Characteristics and Feed Compositions on the Environmental Impact of Pig Production in Flanders: Productivity, Energy Use and Protein Choices Are Key" Sustainability 13, no. 21: 11623. https://doi.org/10.3390/su132111623
APA StyleVan Mierlo, K., Baert, L., Bracquené, E., De Tavernier, J., & Geeraerd, A. (2021). The Influence of Farm Characteristics and Feed Compositions on the Environmental Impact of Pig Production in Flanders: Productivity, Energy Use and Protein Choices Are Key. Sustainability, 13(21), 11623. https://doi.org/10.3390/su132111623