Abstract
The growing pig production sector is a large contributor of negative impacts to the environment and feed production is responsible for a large part of these impacts. Pig production systems, including feed compositions, are variable, resulting in variable potential environmental impacts. This study investigated the influence of different farm characteristics and feed compositions on the environmental impact of pig production in Flanders. A Life Cycle Assessment approach was followed, including data from 39 farms and monthly feed compositions in the year 2018. Even though feed production contributes significantly to the overall environmental impact of pig production, the results show that environmental impacts are more affected by variabilities in farm characteristics than by fluctuating feed compositions. A higher productivity, in terms of feed conversion efficiency and the number of pigs produced per sow, is generally related to lower environmental impacts. Another influencing factor is the type and amount of energy used. For feed consumption, high variabilities are observed for water use, mainly caused by varying levels of sugar cane molasses. Climate change impacts and variabilities are mainly caused by soy ingredients and their origin. Finally, amino acids show large contributions to the environmental impact of pig feed consumption. Our research highlights that future developments for reducing the environmental impact of pig production should target animal productivity, the type and amount of energy used and selection of protein sources in pig feed.
1. Introduction
The growing livestock sector is a large contributor to environmental problems, such as climate change, resource depletion and biodiversity change. In terms of climate change, the livestock sector is responsible for 14.5% of global greenhouse gas emissions [1]. Although pig production only contributes 9% of the livestock sector’s emissions [1], it represents the largest share of global meat production, with 37% in 2018 [2], and is consumed in relatively high amounts compared with other types of meat, with 12.3 kg/capita in 2018 [3]. Furthermore, the global production of pig meat is growing, with an increase of 17% between 2008 and 2018 [2], and is expected to grow further in the coming decade [4]. Because of the high production and consumption share of pig meat, it is of interest to identify improvement options in pig production to mitigate its environmental impacts.
In Flanders (Belgium), pig production is an important industry, with the largest production value among agricultural products. Pig production in Flanders is characterized by large-scale, intensive and specialized systems, with on average 1514 pigs per farm in 2017 [5]. In recent years, the average number of pigs per farm has increased, while the number of farms has decreased. The productivity of Flemish pig production farms has increased as well, with risen sow fertility and improved Feed Conversion Ratios (FCRs). The FCR reflects the amount of consumed feed compared with the amount of produced meat and is the inverse of feed conversion efficiency, which reflects the amount of meat produced compared with the amount of consumed feed. The self-sufficiency of Belgium in terms of pork is very high; in 2016 it was 252%, indicating large export streams [5,6].
Similar to the global scale, Flemish livestock is a large contributor to both local and global environmental problems. Although there has been a net decrease in greenhouse gas emissions from Flemish livestock production and a decrease in emissions per animal in the last decade, mostly due to manure policies and changing manure management, livestock production contributes significantly to greenhouse gas emissions, and its mitigation remains a challenge [6]. Flemish livestock production also contributes largely to acidification and eutrophication impacts, caused by surpluses of nitrogen and phosphorus [5,6]. Following the European Nitrate Directive, which indicated Flanders to be a Nitrate Vulnerable Zone [7], the Flemish government develops so-called manure action plans (MAP) to mitigate these impacts. However, in recent years, the imposed emission boundaries were exceeded, indicating that the mitigation of acidification and eutrophication impacts remains a local challenge in Flanders [5,6].
Feed production, together with manure management, is a major contributor to climate change, eutrophication and acidification impacts of pig production [1,8], which also holds specifically for Belgian pig production [9,10,11]. Pig feed in Flanders consists of multiple ingredients, such as grains, by-products, minerals and vitamins [12]. Feed products for different growing phases are composed according to specific factors, such as nutritional needs and the price and availability of the feed ingredients. The optimal composition is usually determined by means of linear programming, incorporating cost and nutritional constraints. Due to fluctuations in prices and availabilities of feed ingredients on the world market, the optimal feed compositions are variable [13]. The variability in feed compositions influences the environmental impact of feed consumption and therewith the environmental impact of pig production [14,15].
Additionally, variabilities in farm characteristics, such as the number of animals on the farm and their growth rate, also influence the environmental impacts of pig production. Macleod et al. (2013) analyzed underlying system parameters affecting greenhouse gas emissions of pig production. An important influencing factor was found to be the feed conversion ratio (FCR), reflecting the efficiency of the conversion of feed into meat [1]. Another important factor in greenhouse gas emissions is land use change, because a number of feed ingredients originate from countries where major land use changes occur. Related to manure management, important influencing factors are the amounts of volatile solids (VS) and nitrogen excreted by the animals, which are affected by the FCR and digestibility of the consumed feed. The applied system of manure storage also affects emission intensities, as it influences the extent to which the VS are converted to methane and dinitrogen oxide. A more general factor influencing emissions is the “breeding overhead”, which relates to the amount of breeding animals compared with growing pigs on the farm and therewith the efficiency of the system. Macleod et al. found that a low FCR, high feed digestibility and low breeding overhead are related to lower emission intensities. They also discovered differences between regions, mainly caused by differing feed compositions, productivities and applied manure management systems. The differences in contributions of feed are reflected in differing FCRs and the emissions per kg feed, particularly affected by the fraction of soybean from countries where land use change occurs [1]. McAuliffe et al. (2017) similarly found that higher production efficiencies of pig production farms, reflected in feed conversion efficiencies and the number of pigs produced per sow, are related to lower climate change, eutrophication and acidification impacts [8].
Multiple studies have investigated the environmental impact of pig production [8,16,17,18], including studies that particularly focus on the environmental impact of feed production [14,15,19,20]. While some of these studies include a comparison of different systems, for example between countries [16] or between different production systems [8,18,20], they do not consider variability in system characteristics between individual pig production farms, which also differ within countries and production systems. Moreover, most of the studies take into account one single or average feed composition, while feed compositions vary in time, according to the price and availability of feed ingredients [13]. Since feed has an important contribution to the environmental impact of pig production, and feed compositions affect this contribution, it is of paramount importance to take this variability in feed compositions into account.
A few studies assessed the environmental impact of Flemish pig production. These studies [9,10,11] also considered only a limited number of farms [9], or an average Flemish farm [10], which does not allow differences in environmental impacts to be revealed and linked to underlying farm characteristics. Finally, most studies on the environmental impact of pig production only include a few environmental impact indicators, of which climate change is the most frequent one, while pig production also affects other environmental areas of concern [21].
Therefore, the goal of this study is to investigate the combined effect of farm characteristics and feed compositions on the environmental impact of typical specialized, closed pig production systems in Flanders. Life Cycle Assessment, a tool to evaluate environmental impacts of products during their life cycle [22], is applied to quantify the environmental impacts in terms of multiple environmental impact indicators and to identify hotspots in the system. By linking the environmental impact of pig production to farm characteristics and feed compositions, actions to reduce environmental impacts of pork production are formulated.
2. Materials and Methods
To assess the environmental impact of Flemish pig production, this study followed a Life Cycle Assessment approach. The applied methods are in line with the international guidelines ISO 14040:2006 [23] and 14044:2006 [24], and follow as much as possible the guidelines for assessment of the environmental performance of pig supply chains of the FAO [21], as detailed below. Analyses were executed in SimaPro version 9.0.0.49 (Pré Sustainability, The Netherlands).
2.1. Goal and Scope
2.1.1. System Boundaries
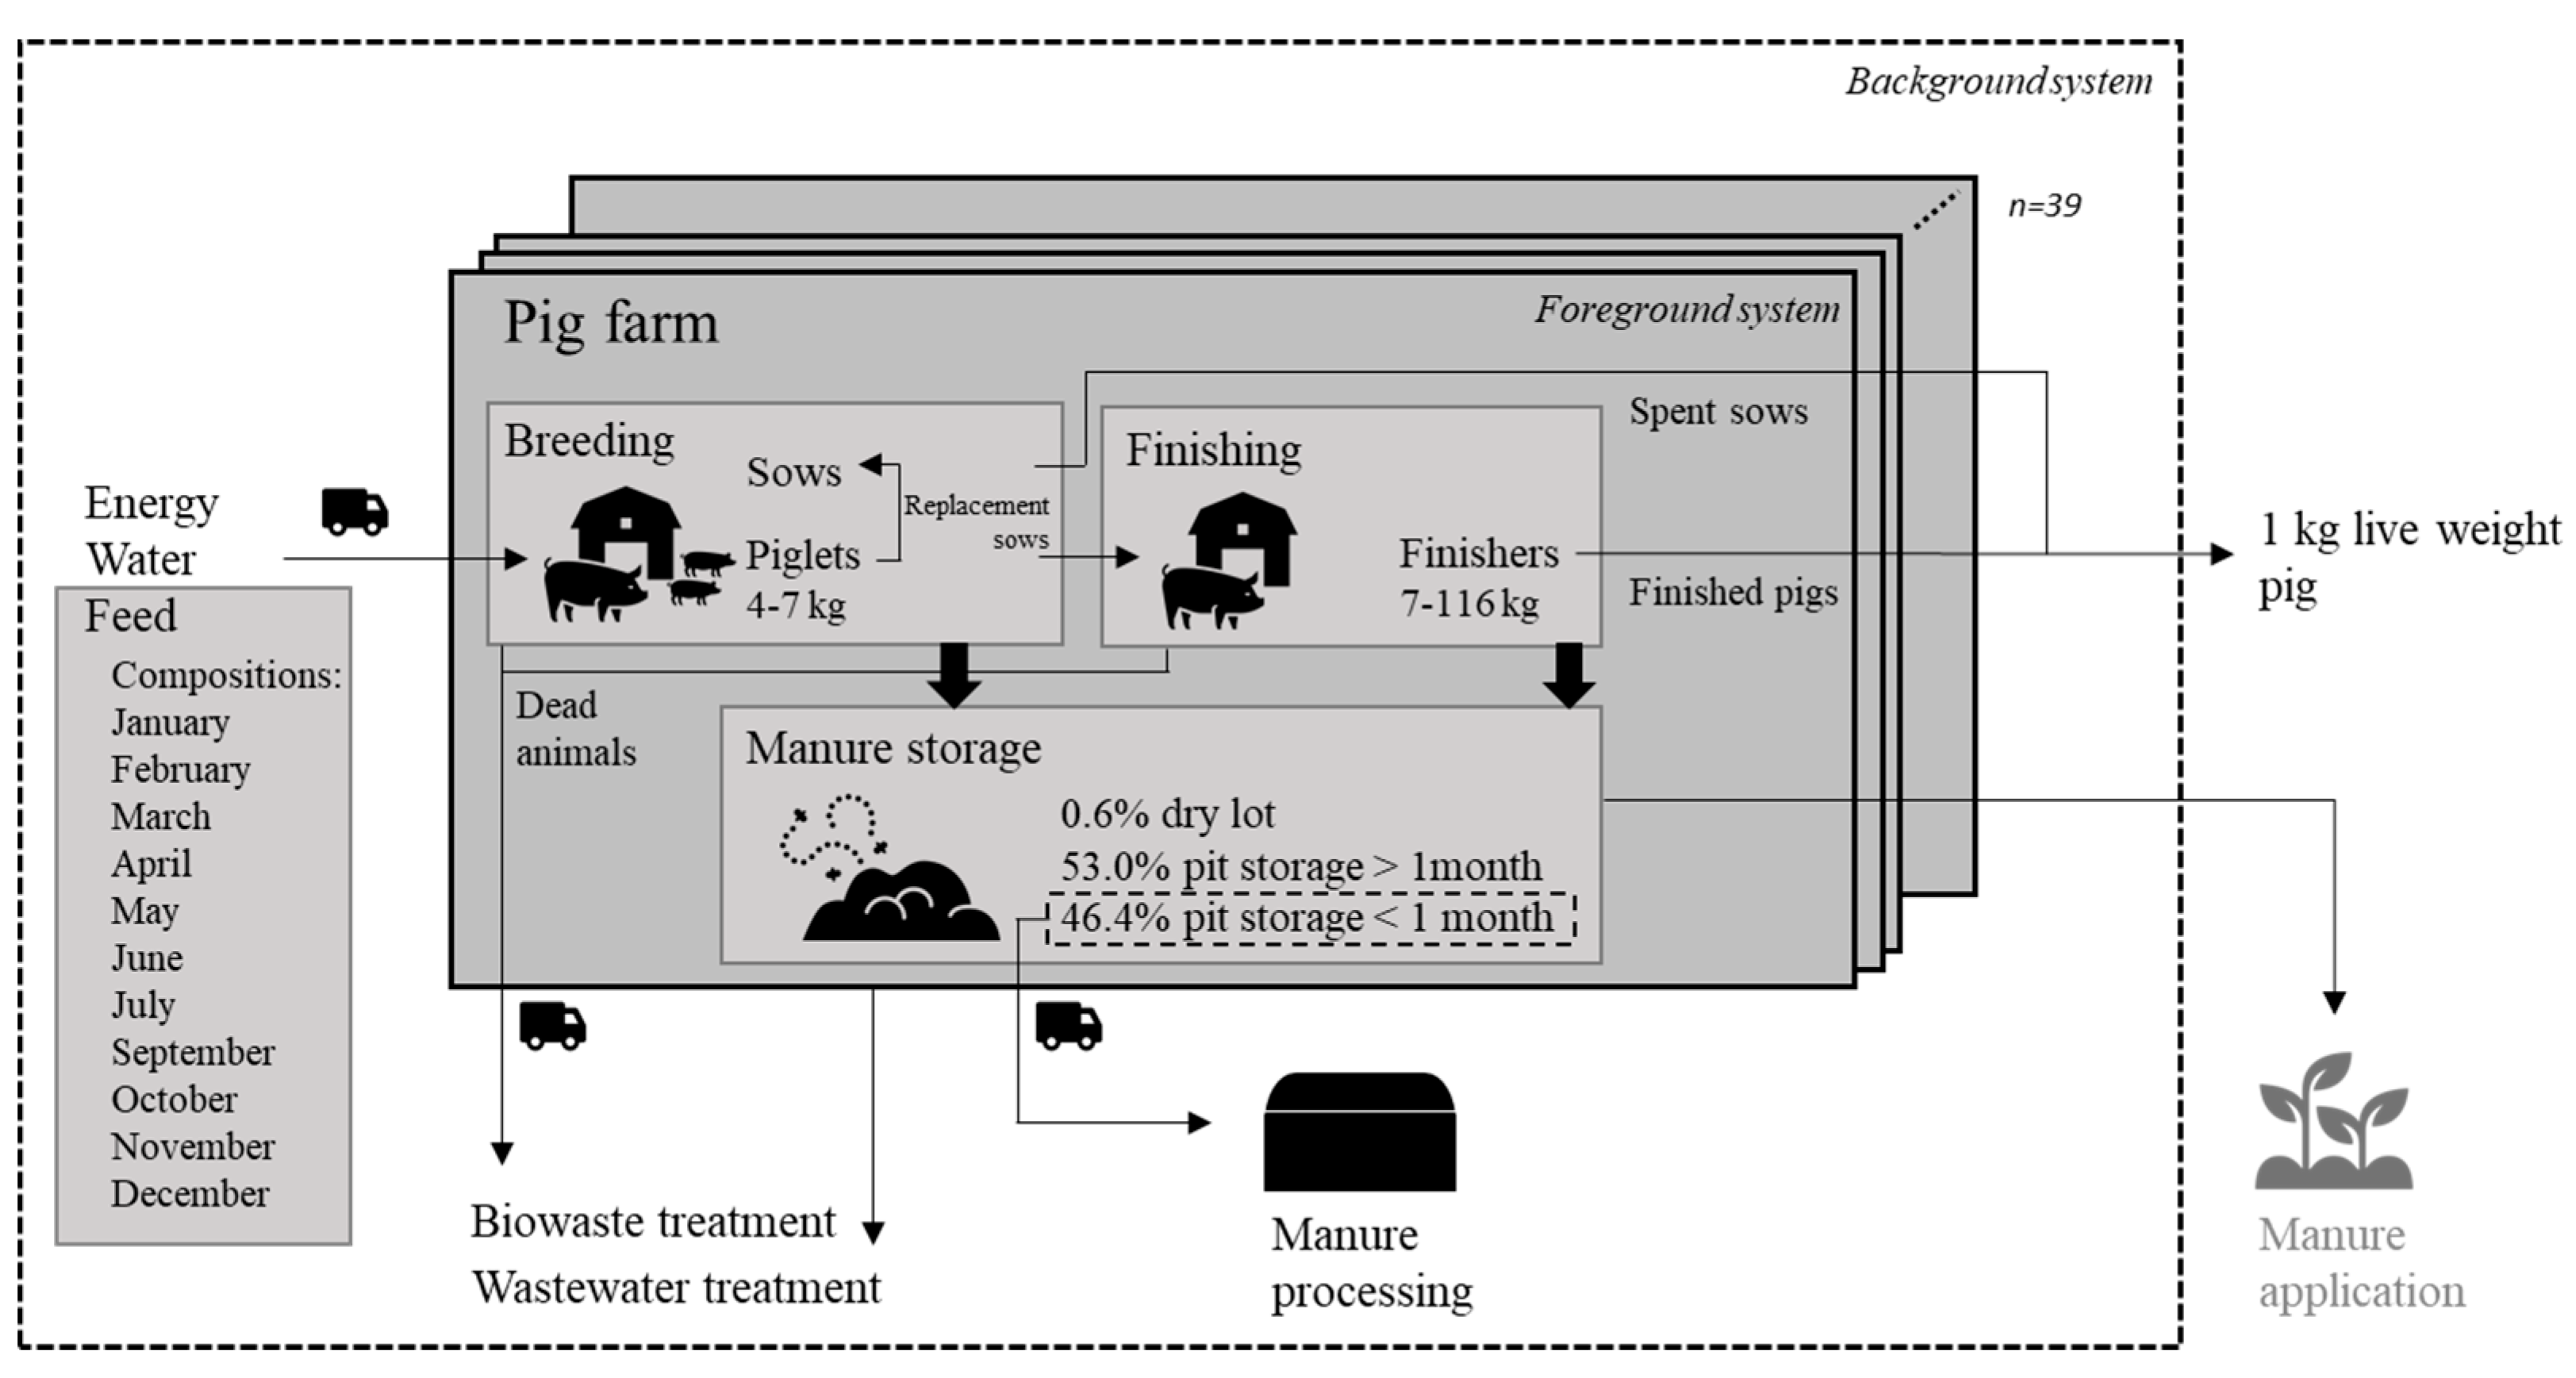
System boundaries include cradle-to-gate pork production steps up to the point the live animals leave the farm, as shown in Figure 1. The foreground system, which includes primary data, corresponds with 39 different closed, specialized farms spread over the region of Flanders. The majority of Flemish pig production farms are located in West Flanders and in the North of Antwerp [5]. Considering multiple farms allows us to grasp the variability in farm characteristics (further described in Section 2.2). The background system includes processes from available databases [25,26,27], for example processes representing the production of feed ingredients and processes for waste water treatment. Feed ingredients were modeled in the background, considering all resources needed to produce the crops, and for ingredients that are sourced from abroad, transport to Belgium was included. Different feed compositions for every month in 2018 were considered to grasp the monthly variations in feed compositions. Further descriptions of the modeled feed are given in Section 2.3.
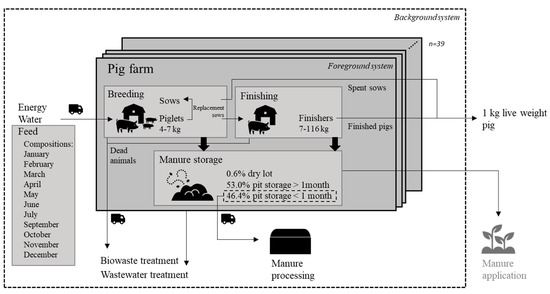
Figure 1.
System boundaries of the studied system for the 39 different closed, specialized pig production farms in Flanders with feed compositions varying per month.
The foreground system consists mainly of pig rearing and manure storage. Manure processing is considered in the background system, while manure application is not included in the system boundaries, as the impact is assigned to the plant production system to which the manure is applied [21]. Manure management is further elaborated on in Section 2.2.1.
Inventory data were collected for a one-year period. As capital goods such as buildings are assumed to have a lifespan longer than 12 months, they were excluded from the inventory, following the guidelines in [21].
This study builds further on the study of ERM and UGent (2011) [10], in which the carbon footprint of Flemish pork was assessed for the year 2009, based on an average farm. The present study included other environmental impact categories alongside climate change, and the lifecycle inventory (LCI) data were updated to the year 2018. Multiple farms were considered separately, to investigate the influence of system parameters on the environmental impacts.
2.1.2. Functional Unit
As shown in Figure 1, the functional unit considered in this study is 1 kg of live weight pork at the moment the pigs leave the farm. The functional unit includes both finished pigs and spent sows.
2.1.3. Allocation
Multi-functionality occurs in several steps of the pig production chain. Firstly, co-products are generated during feed production. Following international guidelines [28,29], economic allocation is applied to feed co-products. The total outputs of meat production from the produced finishing pigs on the farm and the spent sows were considered together [21]. Consequently, the total inputs needed to produce the total outputs were considered, and no allocation had to be applied in that respect. The culled sows that are inedible and the pigs/sows that die at the farm were modeled as waste.
The guidelines on the environmental assessment of pig supply chains of the FAO [21] state that manure should be considered as a residual material if it is subsequently used as a fertilizer, and as a waste stream if the manure is processed in a treatment facility. For residual materials, emissions up to the point of field application should be assigned to the animal system, and the emissions of the field application should be assigned to the crop production system. Waste management of the waste streams should be considered and assigned to the pig production system. Therefore, manure that is removed from the farm and sent to manure processing was considered as waste, and its processing by biological treatment was considered by including the results of Corbala-Robles et al. (2018) [30] and assigned to the pig production. Further descriptions of manure management are provided in Section 2.2.1.
2.2. Data Collection on Farm Characteristics
The studied system represents specialized pig production farms, as this is the most common system for pig production in Flanders [31]. Therefore, farms with a specialization of 90% or more were selected, indicating the labor expenditure assigned to pork production. Furthermore, this study only covered farms in which piglets are transferred to the fattening phase at a live weight of 7 kg. Finally, closed pig production farms were selected, representing farrow-to-finish systems as defined by the FAO (2018) [21]: all piglets are fattened on the farm, no piglets are bought onto the farm, and the spent sows are replaced by a proportion of the produced piglets. The selection of closed farms allows us to analyze the complete pork production system and to build upon the study of ERM and UGent (2011) [10].
According to the above selection criteria, the Flemish farmers’ association, Boerenbond, delivered data on 39 specialized, closed pig production farms in Flanders. In addition, Belgian feed suppliers provided the following information: DSM delivered monthly feed compositions in the year 2018, and Arvesta provided information on the sale shares of the different feed products. Information on water use and manure management was retrieved from available technical reports [32,33,34]. Table 1 shows important characteristics of the included farms, selected based on the most recent guidelines of the FAO [21]. The collected farm data concern two stages: (1) breeding, which includes piglet production and piglet rearing up to 7 kg, and (2) fattening, which includes rearing of piglets up to 22 kg and fattening pigs up to the exit weight. Following the approach of McAuliffe et al. (2017) [8], this study evaluated the productivity of the included farms by multiplying the feed conversion efficiency by the number of pigs produced per sow per year (the opposite of the “breeding overhead” as defined by Macleod et al. (2013) [1]). The feed conversion efficiency, the inverse of feed conversion ratio, was calculated by dividing the total produced live weight per year (finishing pigs and spent sows) by the total amount of feed consumed per year. These factors are relevant as they influence the impact caused by feed production directly, and the impacts from manure management, including the VS.

Table 1.
Characteristics of the included pig farms.
Table 2 shows the inventory for the modeled farms. The following sections elaborate on the farm characteristics in more detail.
Table 2.
Inventory for the included pig farms.
2.2.1. Manure Management
Manure storage and processing causes direct and indirect impacts by runoff and leaching of nitrogen and phosphorus to water bodies and acidification risks from ammonium [35]. The considered manure management systems are based on secondary data [34].
According to Belgium’s greenhouse gas inventory [34], pig manure in Flanders is mainly stored in pits underneath the stables (99% for piglets and fattening pigs and 98% for sows), and a small proportion is stored in dry lots (1% for piglets and fattening pigs and 2% for sows). Based on the total manure production and total manure removal to processors (in kg nitrogen) in Belgium in 2018 [33], it was assumed that 46% of the produced manure is removed for manure processing within one month. Furthermore, it was assumed that the removed manure is processed by means of centrifugation followed by biological nitrogen removal from the liquid fraction and composting of the solid fraction, as this is the most common method for manure processing in Belgium [33]. Therefore, considering the total system, it is assumed that on the modeled farms 0.6% of the manure is stored in dry lots, 53.0% is stored in pits below the stables for more than 1 month, and 46.4% is stored in pits and removed within 1 month for manure processing, as shown in Figure 1.
Methane and nitrous oxide emissions from manure storage were calculated based on the IPCC guidelines [36]. Emissions of ammonia, nitrogen oxides, non-methane volatile organic compounds (NMVOC) and particulate matter were calculated based on the EMEP/EEA air pollutant emission inventory guidebook, chapter 3.B [37]. Values specific to Flanders used for the emission calculations were retrieved from Belgium’s most recent greenhouse gas (GHG) inventory [34].
Direct methane emissions from enteric fermentation were calculated based on the IPCC guidelines (Tier 1 approach) [36].
To include the impact of manure processing, the amount of produced manure was calculated based on the feed consumption and composition, and the impact of the processing of 46.4% of this produced manure was calculated based on the results of Corbala-Robles et al. (2018) [30], who analyzed the impact of biological treatment of pig slurry in Belgium.
2.2.2. Energy and Water Use
Table 2 shows the energy and water use on the modeled farms. Water use was based on average secondary data [32].
2.2.3. Transport
Transport of feed, of animal waste to waste treatment and of manure to manure processing was taken into account. For feed, an average transport distance of 80 km was assumed, to account for both the transport from the feed production location (for feed products produced in Belgium), or from the location of import (for feed products produced outside Belgium), to the feed supplier and the transport from the feed supplier to the pig farms. For feed products produced outside Belgium, the transport from the countries of origin to Belgium was included in the feed processes (Table S2). For transport of manure and animal waste, an average distance of 30 km was assumed.
2.3. Data Collection on Feed Consumption and Compositions
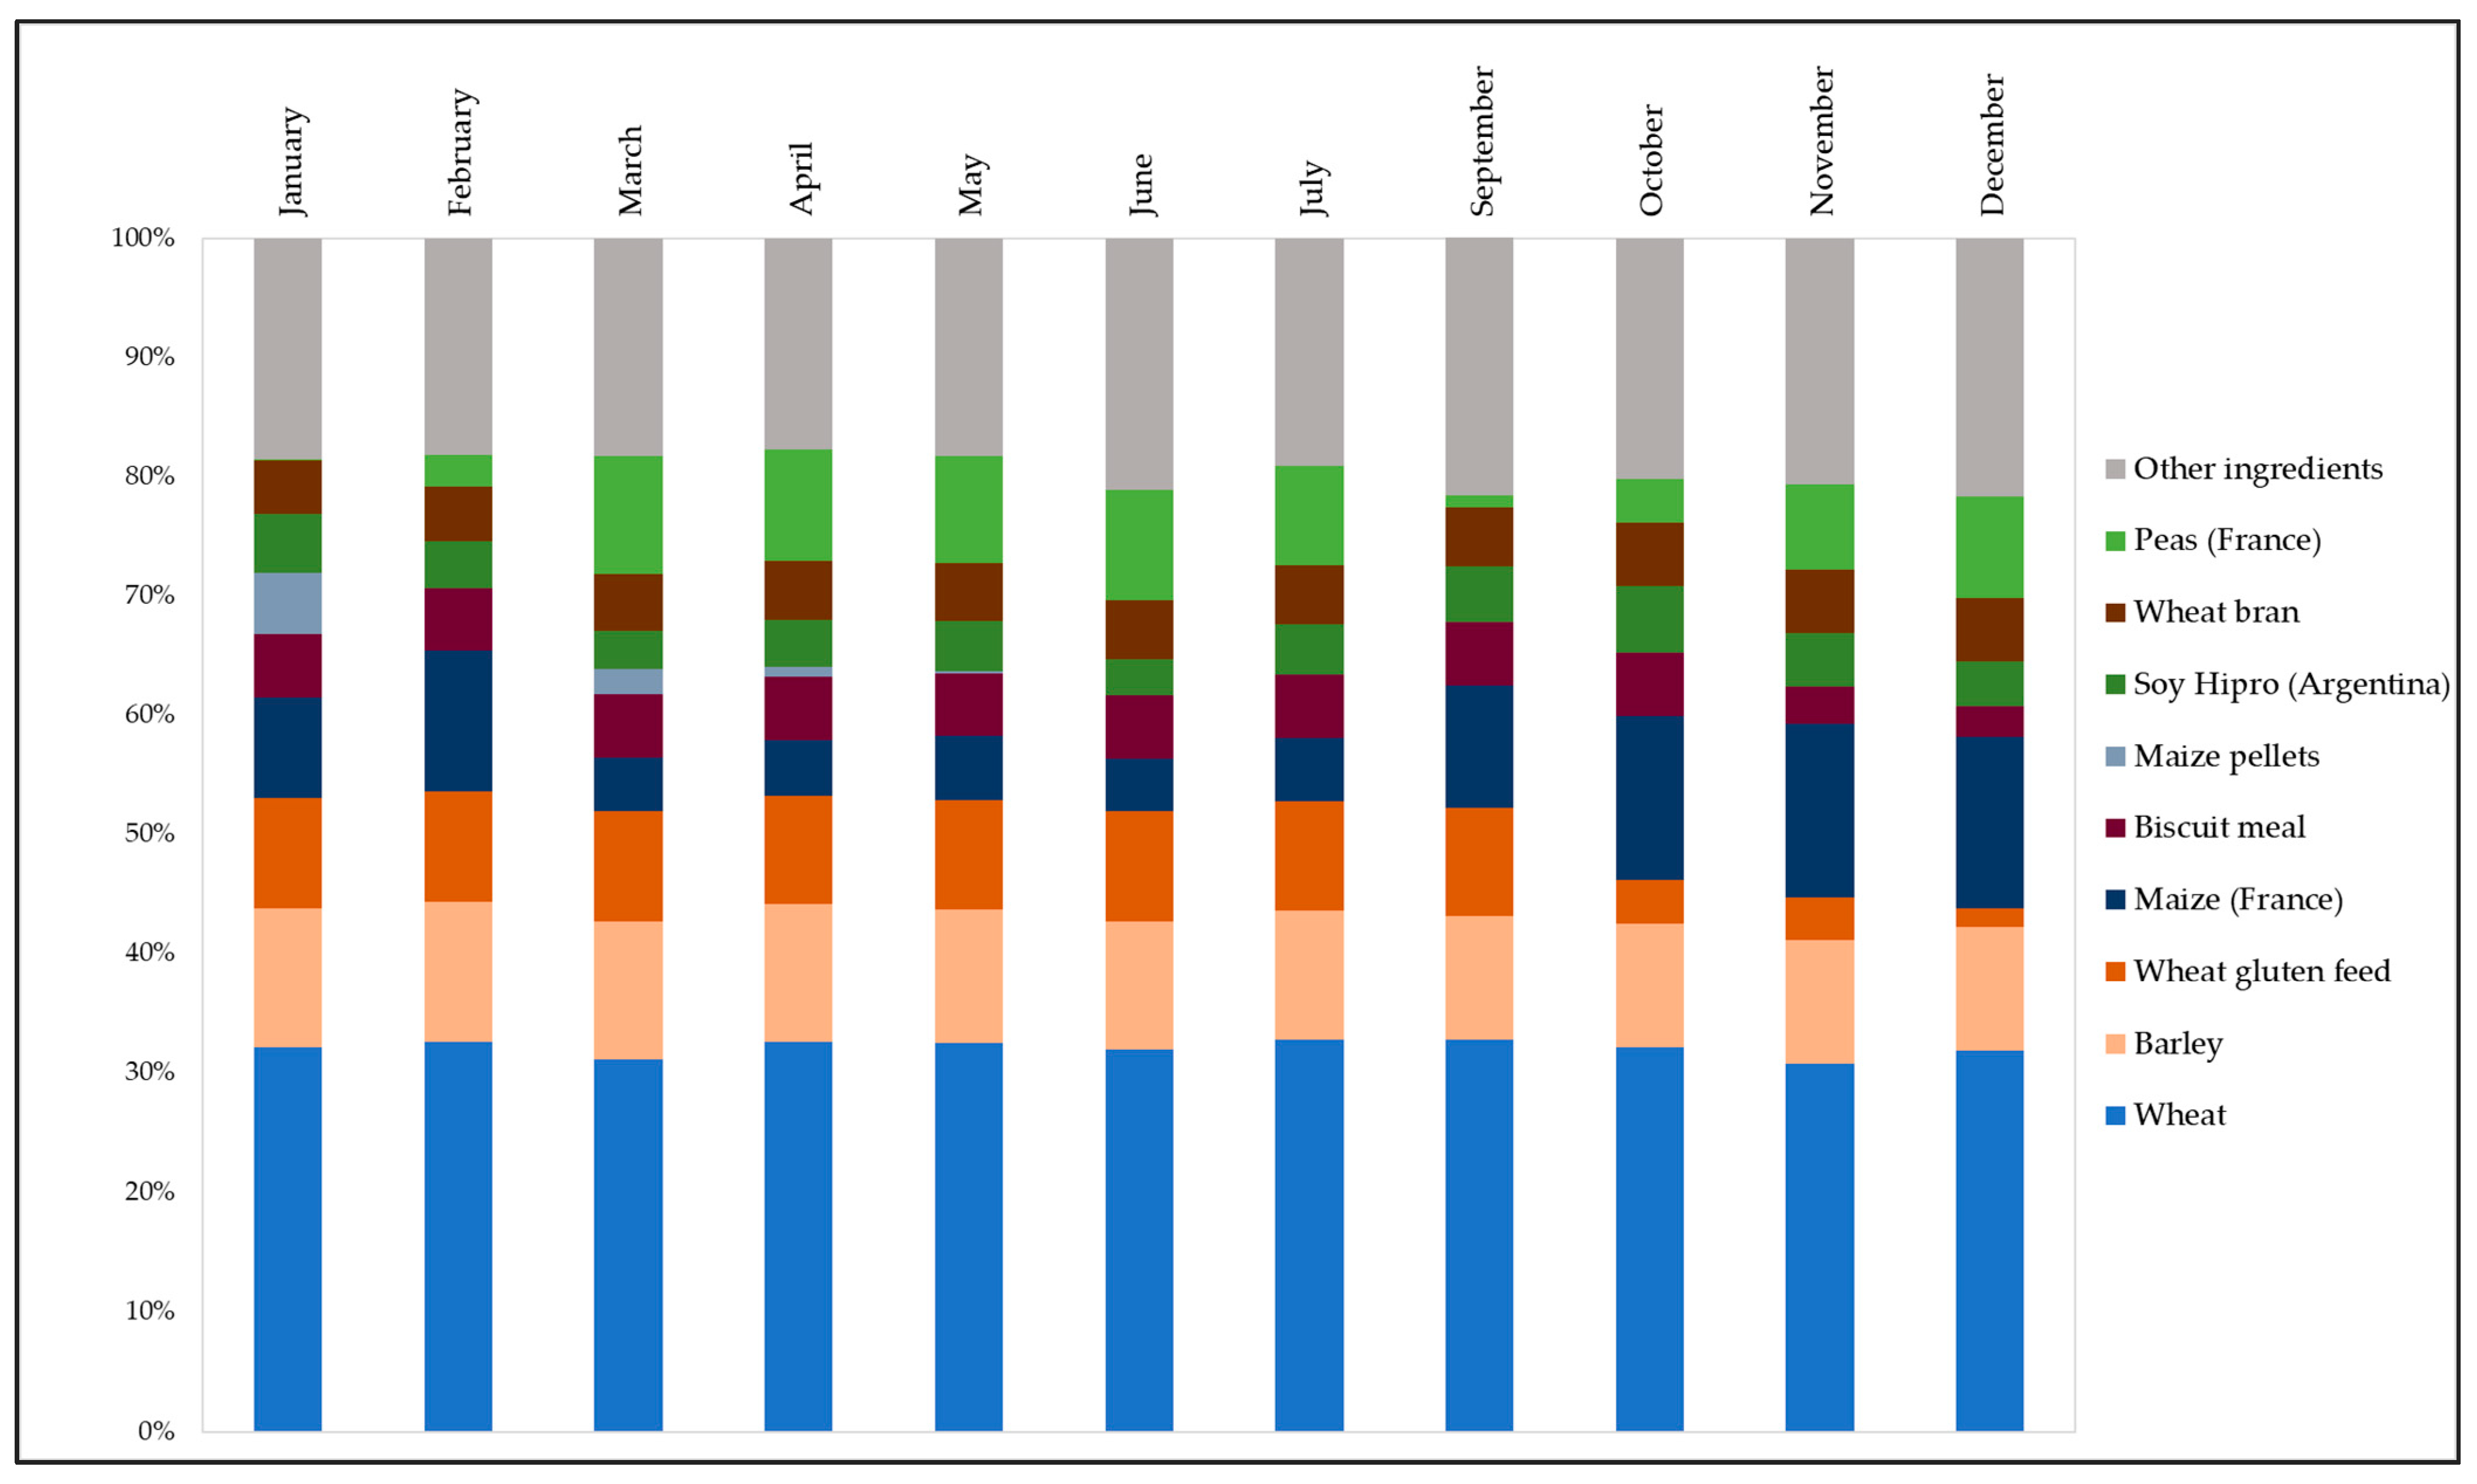
During the different growing and metabolic phases, the sows, piglets and fattening pigs consume different kinds and amounts of feed, as shown in Table 2. The yearly feed consumption amounts in each growing phase were calculated based on the yearly feed consumption per animal in each growing phase and the number of animals in each growing phase, as provided by Boerenbond (Table 1). Herein, the contribution of the nine different feed types was determined based on sale shares provided by Arvesta to obtain the yearly consumption amounts of the nine feed products, as displayed in Table 2. All the animal feed is purchased as specialized pork farms in Flanders generally do not use cultivated land for their own feed supply. Monthly feed compositions of the different purchased feed products (9 in total) in the year 2018 were considered based on information received from a feed supplier (DSM). These feed compositions are representative of commercially available feed products in 2018 in Flanders and are not shown in detail as they are proprietary data. The monthly feed compositions are determined by linear programming based on availability and price on the market, respecting animal-specific minima and maxima concerning parameters such as energy needs, proteins, minerals and vitamins. Still, Figure 2 does show the composition of the feed products in January and June, displaying the ingredients with the largest weight share (>10%).
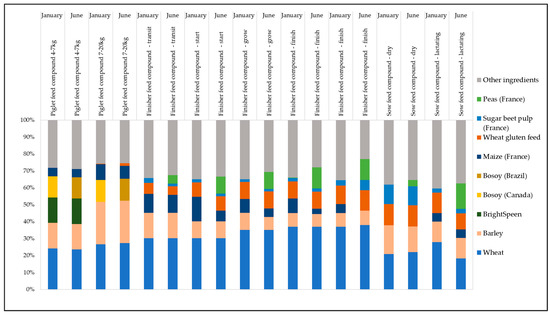
Figure 2.
Compositions of feed products in January and June. Ingredients that represent <10% in all the feed products are displayed together as “other ingredients”.
Table S1 in the Supplementary Materials provides an overview of the considered ingredients and the associated selected production and transport processes from background databases. If the country of origin of the feed ingredients was known, it is indicated in Table S1, and the corresponding process was selected. When the country of origin is outside Europe, the overseas transport to Belgium was added (based on [38]). If the country of origin is not known, it was assumed that the ingredient is produced in Belgium and the most suitable process was selected. Wherever possible, market or consumption mixes were selected, to consider the production and import in as much detail as possible. In many cases, processes from the Netherlands or France were selected due to a lack of Belgian data. It was thus assumed that feed ingredients produced in the Netherlands or France, or available on the Dutch or French market, are comparable to feed products used in Belgium. The purchased feed products contain multiple composed ingredients, for example, the ingredient BrightSpeen is a mixture of whey powder, potato protein, soybean products, synthetic amino acids, organic acids, minerals, feed additives and vitamins. Representative processes were selected from background datasets for minerals and amino acids based on the mineral or amino acid that is present in the highest percentage. For some ingredients, multiple processes are combined to reflect the ingredient in as much detail as possible. For example, the feed ingredient Bosoy corresponds to toasted and extruded soybeans [39], which was modeled by combining the processes of soybeans with a toasting and extrusion process.
2.4. Life Cycle Impact Assessment (LCIA)
This study includes multiple environmental impact categories, following the International Reference Life Cycle Data System (ILCD) [40]: climate change, ozone depletion, human toxicity, particulate matter, ionizing radiation, photochemical ozone formation, acidification, eutrophication (terrestrial, freshwater and marine), freshwater ecotoxicity, land use, water resource depletion and mineral, fossil and renewable resource depletion. Hereto, the inputs, such as the electricity use shown in Table 2, and outputs, such as the occurring emissions described in Section 2.2.1, are linked to their impact on the environment in terms of the different environmental impact indicators [41]. For example, climate change impacts are calculated by considering the emissions of different greenhouse gasses (GHG) and their global warming potential. Emissions of methane and nitrous oxide occur on the farms from enteric fermentation and manure storage. The global warming potentials (GWP) of these greenhouse gasses are, respectively, 28 and 265 CO2-eq./kg GHG, so their emission amounts are multiplied by their GWP to obtain the total climate change impact in CO2 equivalents [41].
Climate change, acidification and eutrophication are important impact categories for pig production [35], and are therefore given particular attention in the Results and Discussion. Further, the impact categories included in the FAO’s guidelines for the assessment of the environmental performance of the pig supply chain [21] are specifically discussed, alongside the abovementioned impact categories, i.e., categories related to fossil energy demand and water consumption. Finally, the impact categories for which a high variability can be observed are discussed as well.
3. Results
3.1. Environmental Impacts of Belgian Pig Production
Table 3 shows the environmental impacts in terms of the environmental impact categories of the ILCD method, considering the different included farms and feed compositions. The minimum impacts reflect both low impacts related to farm characteristics and low impacts related to feed compositions. For example, the farm with the lowest climate change impact in combination with the month in which the feed compositions showed the lowest climate change impacts resulted in a climate change impact of 2.57 kg CO2 eq. per kg live weight (LW). In contrast, the farm with the highest climate change impact in combination with the feed composition that induces the highest climate change impact resulted in a climate change impact of 3.89 kg CO2 eq./kg LW. When considering mean farm characteristics and mean feed compositions, the climate change impact amounts to 3.22 kg CO2 eq./kg LW.
Table 3.
Mean, minimum, maximum and coefficient of variance (CV) of the environmental impact in terms of all environmental impact categories of the ILCD method per kg live weight, considering all included farms and feed compositions.
Water resource depletion, particulate matter and ionizing radiation (human health) show the highest variabilities, reflected in the high coefficients of variance (CV). Specifically due to their high variability, particulate matter and ionizing radiation (human health) are discussed further in the following section, alongside the other included impact categories mentioned in Section 2.4.
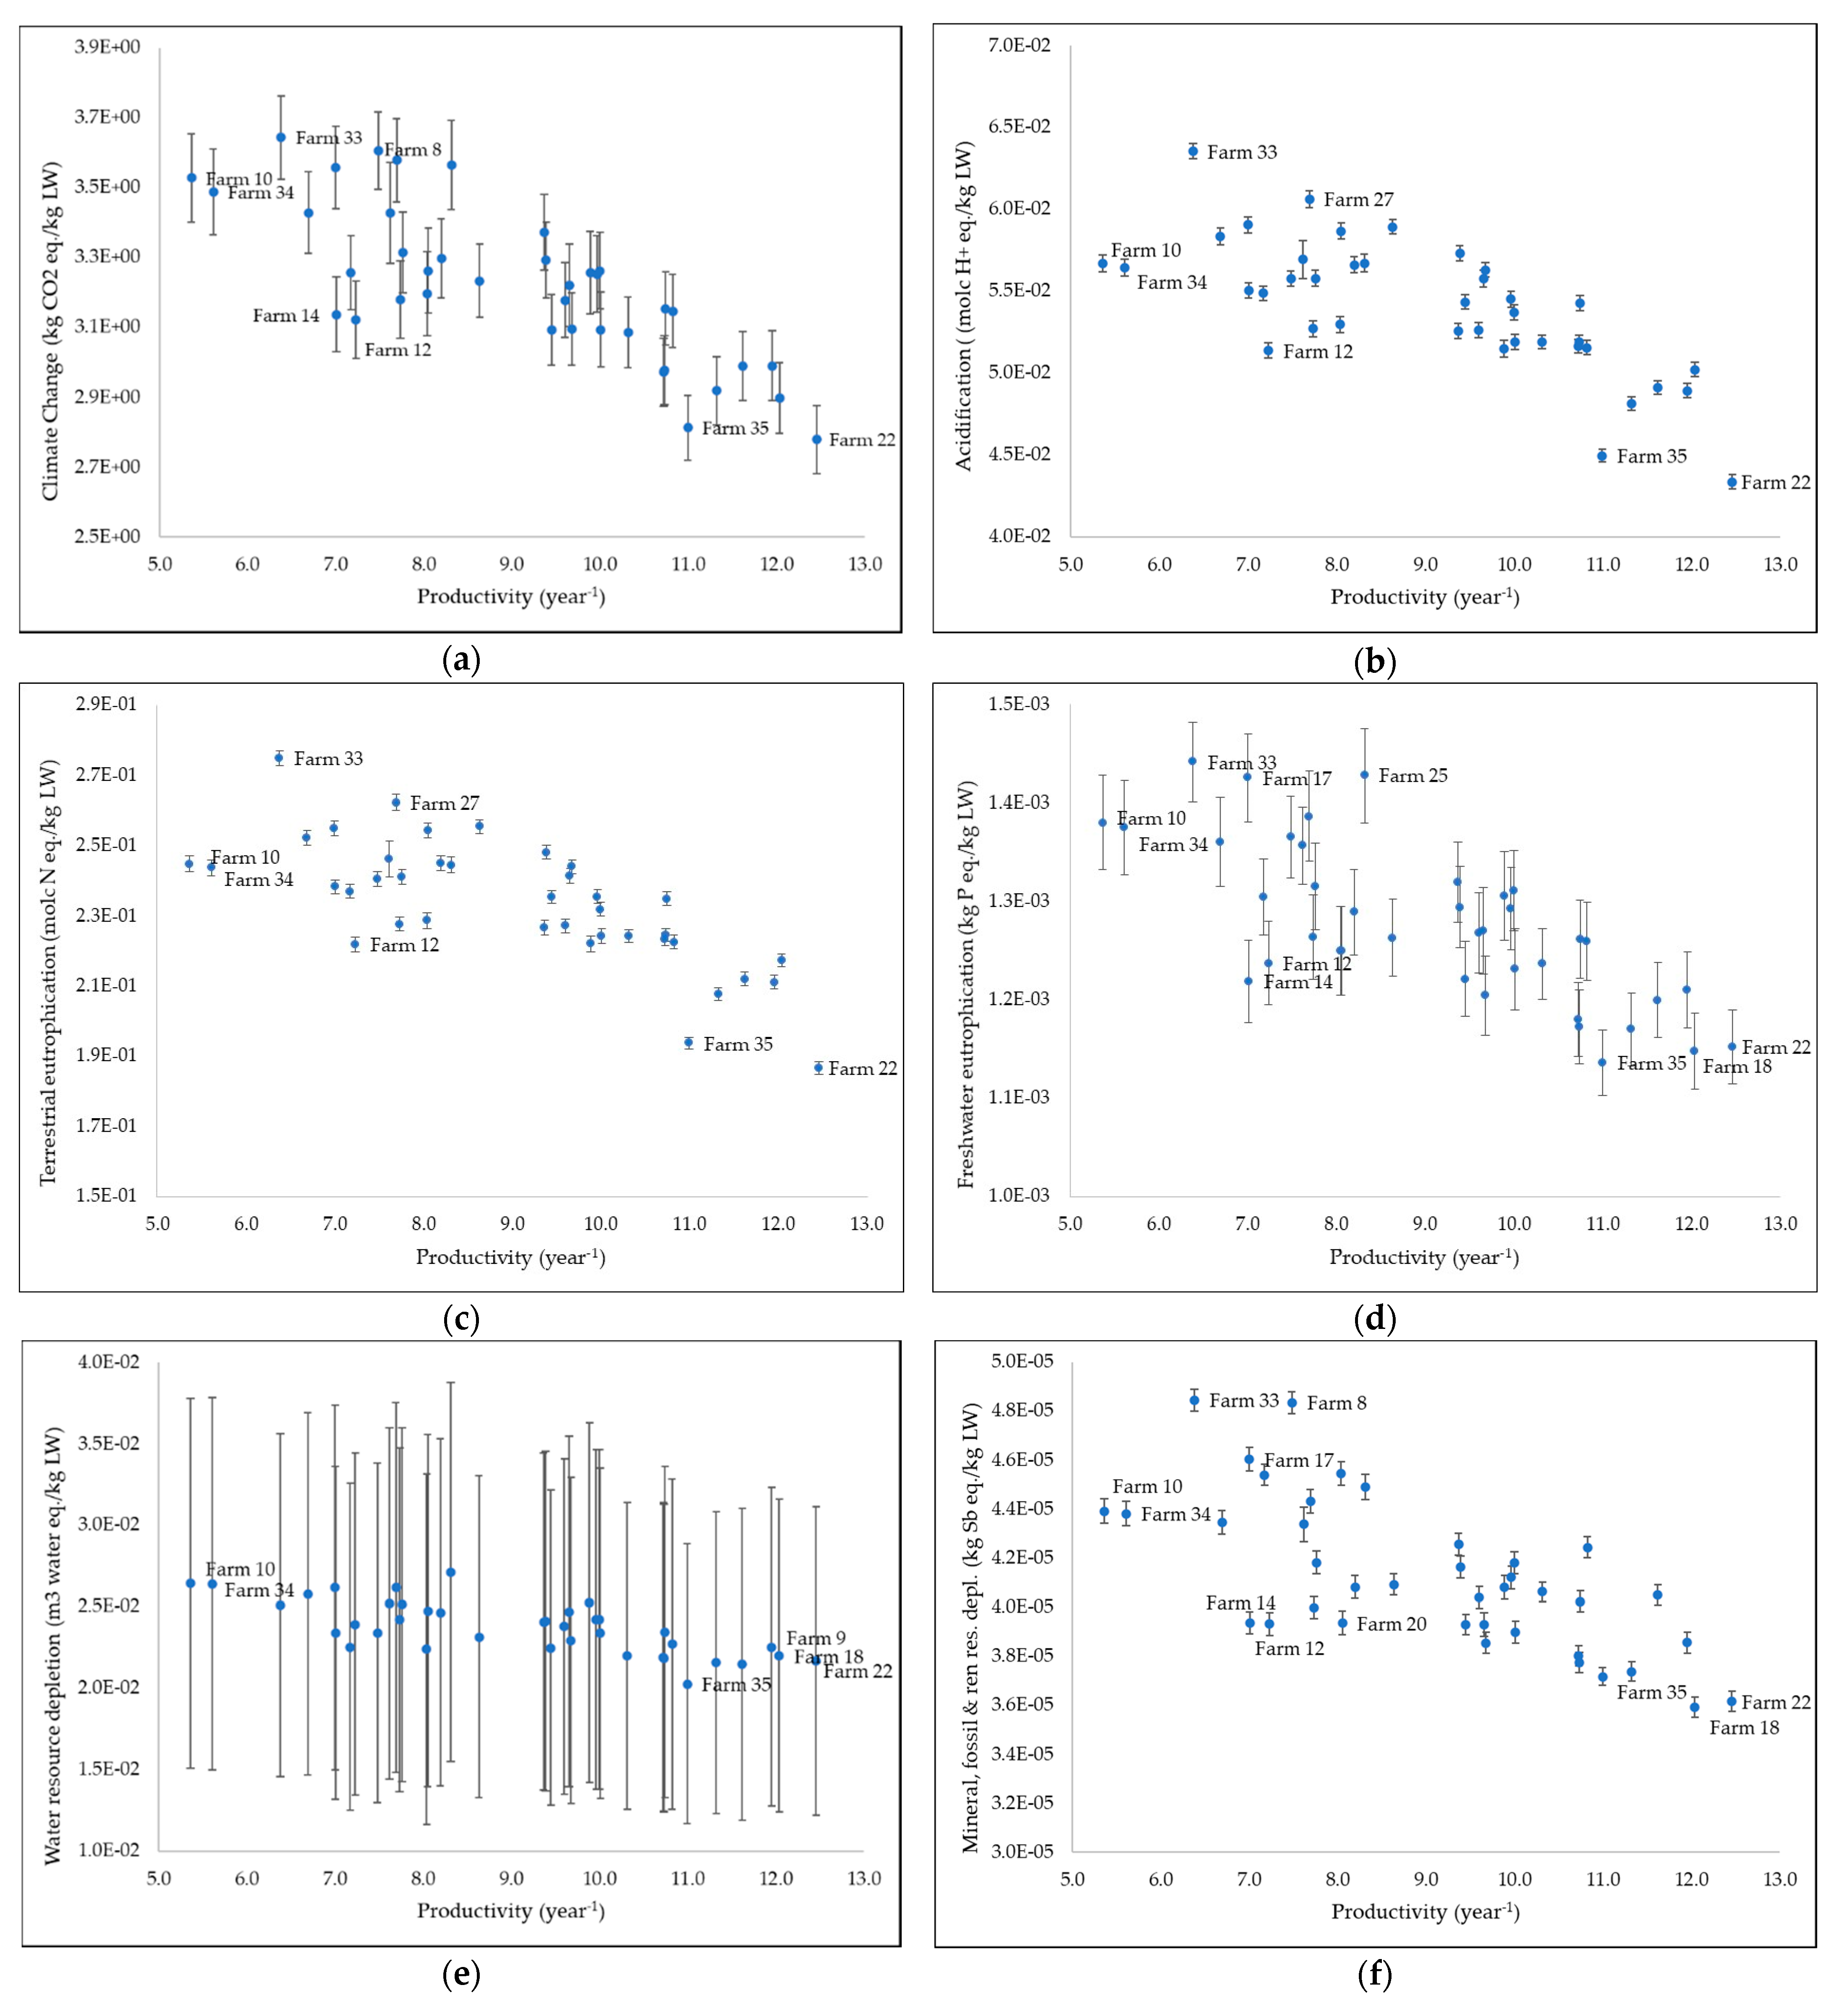
3.2. Environmental Impacts of Studied Farms in Relation to Their Productivity
Figure 3 shows the mean environmental impacts and their standard deviations due to monthly fluctuation in feed composition of the studied farms in terms of climate change, acidification, terrestrial and freshwater eutrophication, water resource depletion, mineral, fossil and renewable resource depletion, particulate matter and ionizing radiation (human health). The results are presented in relation to the productivity (year−1) of the farms, based on the feed conversion efficiency and number of produced pigs per sow.
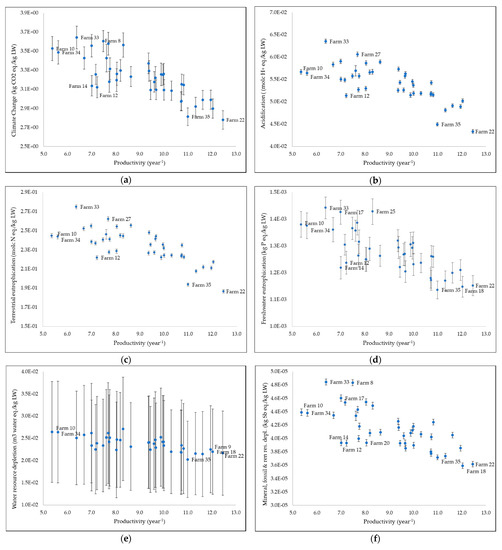
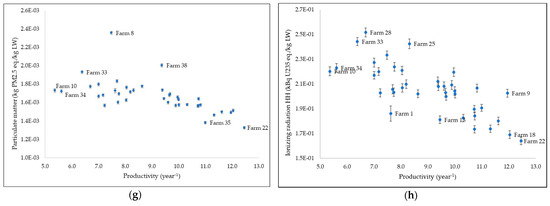
Figure 3.
Environmental impact in relation to the productivity of studied pig production farms, in terms of (a) climate change, (b) acidification, (c) terrestrial eutrophication, (d) freshwater eutrophication, (e) water resource depletion, (f) mineral, fossil and renewable resource depletion, (g) particulate matter and (h) ionizing radiation (human health). The standard deviations shown are due to monthly fluctuations in feed compositions.
Generally speaking, lower environmental impacts are associated with higher productivity, although not in a linear way (fitting linear trend lines, not shown for reasons of clarity, result in low R2 values between 0.39 (PM) and 0.64 (CC)). Farms 10 and 34 show the lowest productivity among farms; however, they do not show the largest impacts. Farm 33 shows a higher productivity than farms 10 and 34 but larger impacts, caused by higher direct farm emissions from enteric fermentation and manure storage, and a relatively high energy use.
Farms that show low impacts in terms of all environmental impact categories, i.e., farms 22 and 35, have a relatively high number of produced pigs per sow per year and high feed conversion efficiencies, as shown in Table S2 in the Supplementary Materials. The results show that feed conversion efficiencies have a larger effect than the number of pigs produced per sow on climate change, acidification, terrestrial eutrophication, water resource depletion and particulate matter, shown by the low values of farm 35 in terms of these categories, which has the highest feed conversion efficiency but a relatively low number of pigs produced per sow. However, the number of pigs produced per sow has larger effects on the impact categories of freshwater eutrophication, resource depletion and ionizing radiation, as indicated by the high number of pigs produced per sow on farm 18 and its low environmental impacts in terms of these impact categories.
Unrelated to farm productivity, the kind and amount of energy used strongly influences environmental impacts. Farm 22 has a low electricity use compared with other farms, which results in a low impact in terms of each environmental impact category. On the other hand, farm 28 shows the highest impact in terms of ionizing radiation, mostly caused by its high electricity use. Furthermore, farm 8 shows relatively high productivity but high impacts in terms of climate change, resource depletion and particularly in terms of particulate matter. This is mainly due to a high energy use compared with other farms, and specifically the use of wood pellets, which has high impacts per energy unit in terms of climate change, resource depletion and especially in terms of particulate matter.
The error bars in Figure 3 show the standard deviation of the environmental impact values, representing the impact variabilities caused by monthly fluctuations in feed compositions. In general, the results show a higher variability between farms than between months. Particulate matter and ionizing radiation show the highest variability between farms, while freshwater eutrophication shows the lowest variability. Water resource depletion shows the highest variability between monthly feed compositions, while acidification and terrestrial eutrophication show the lowest variability.
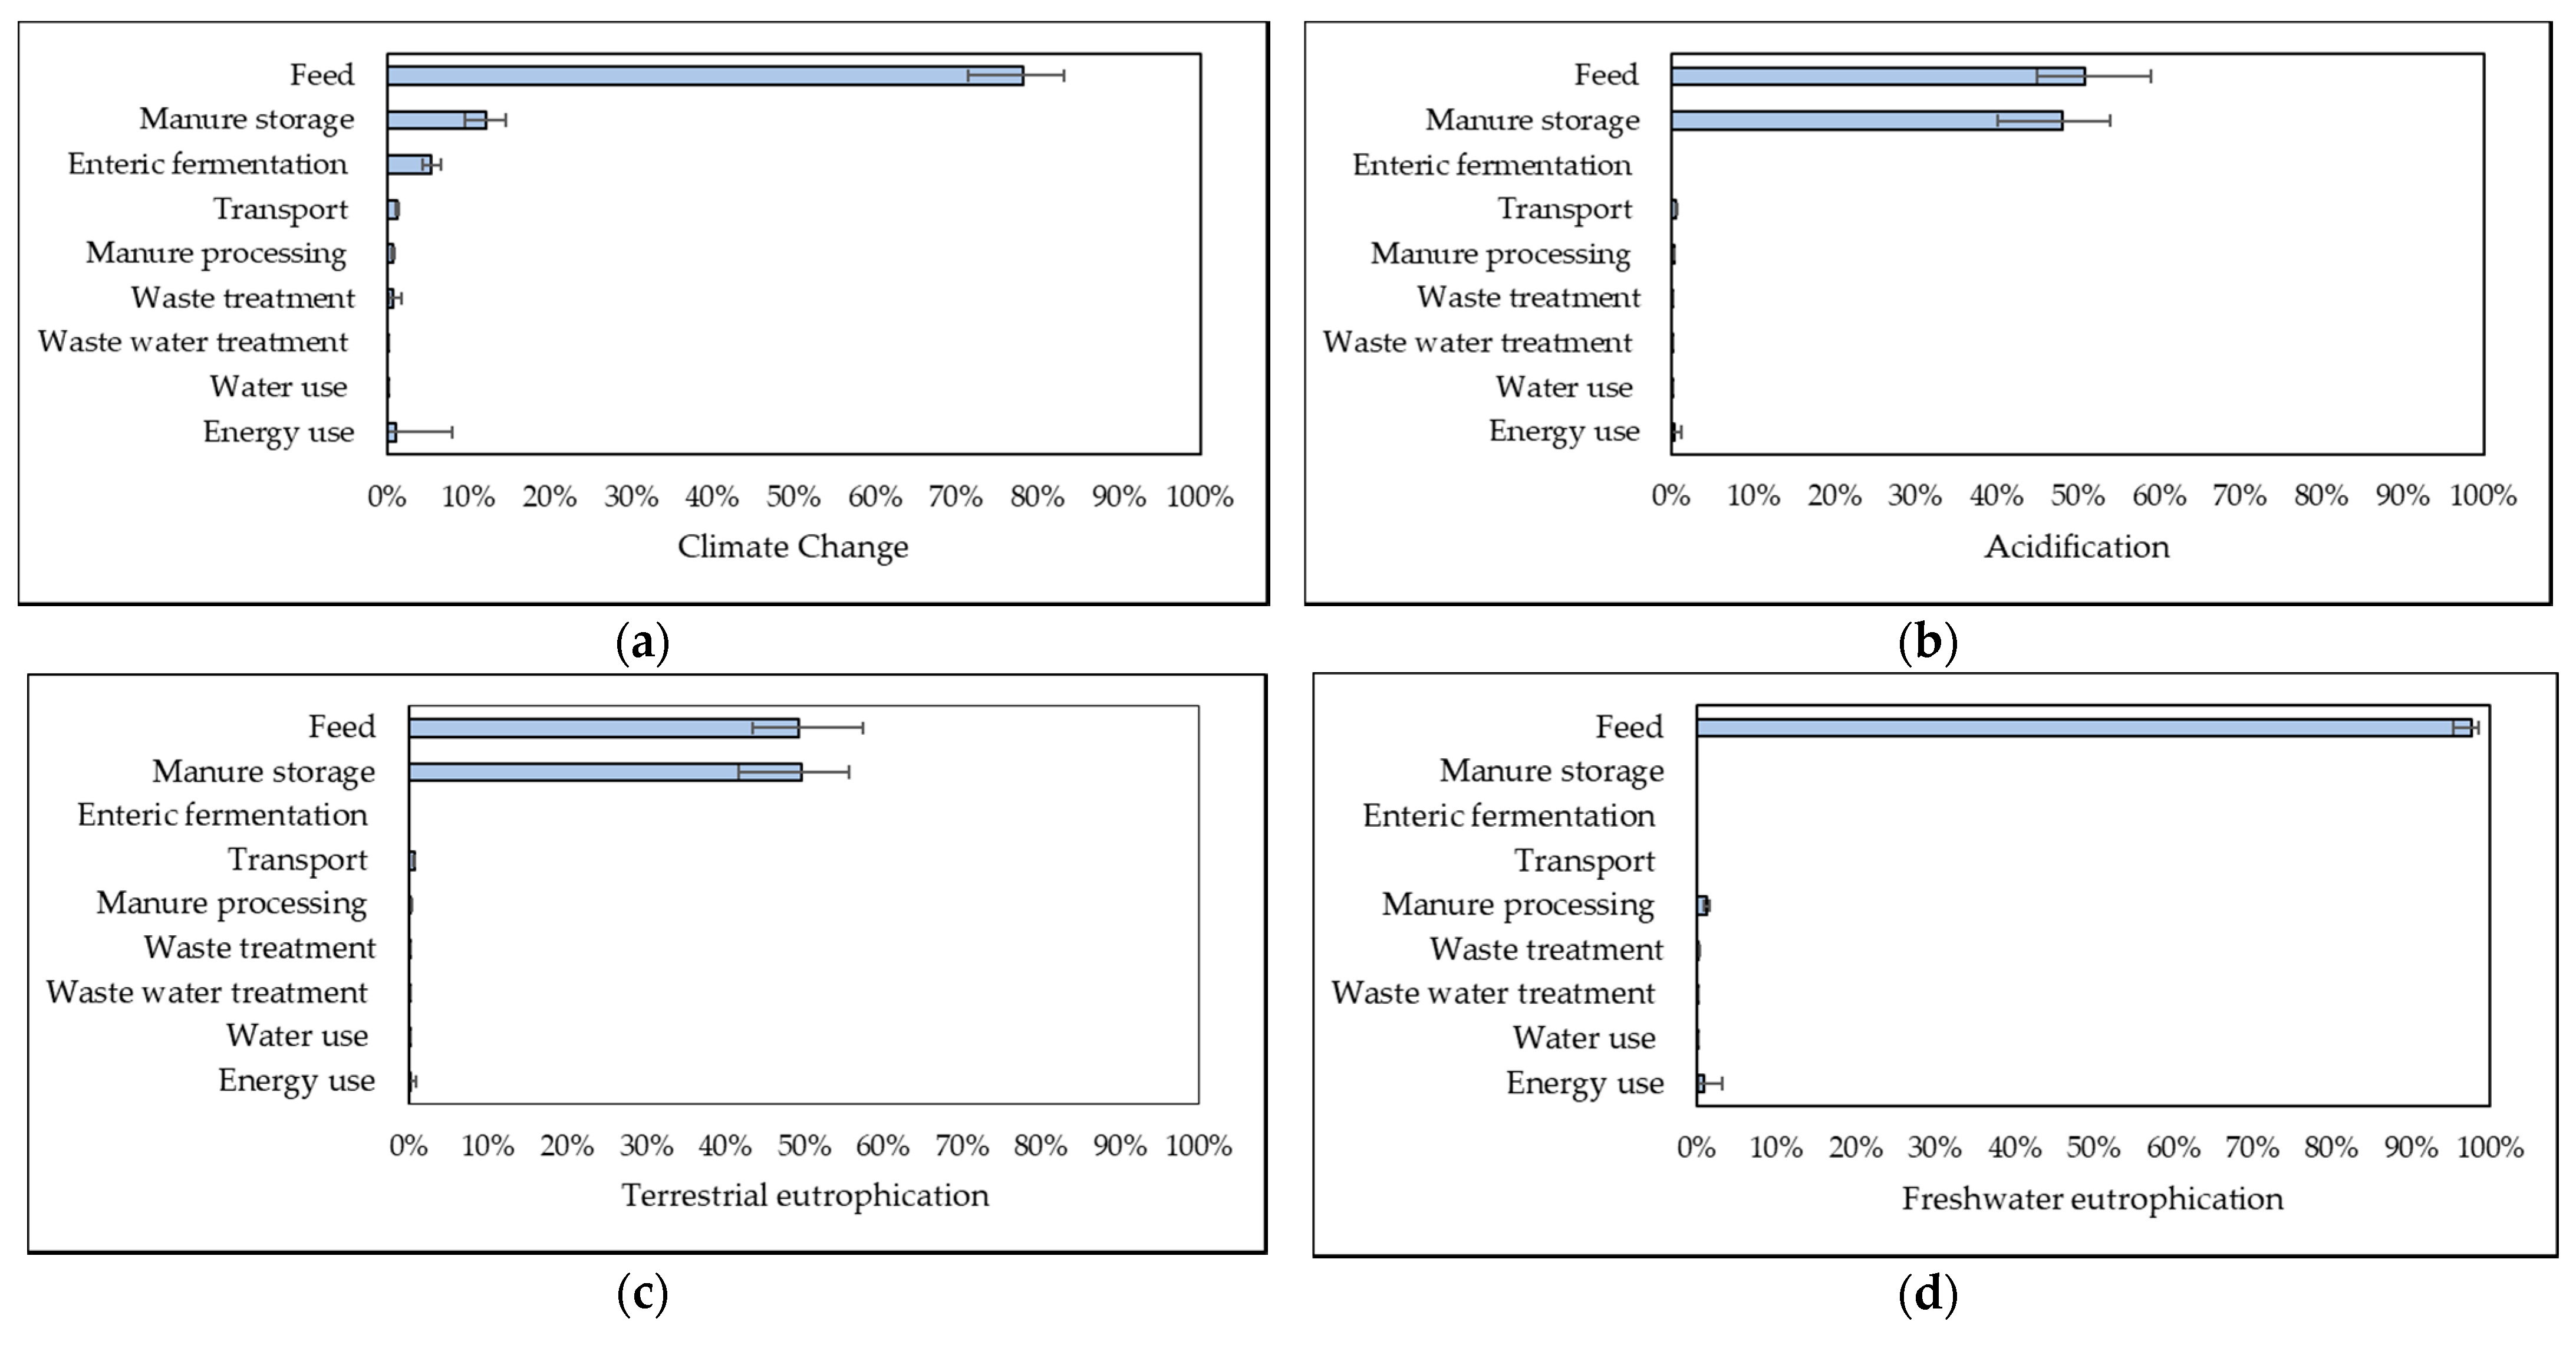
3.3. Contribution Analysis of the Environmental Impacts of the Studied Farms
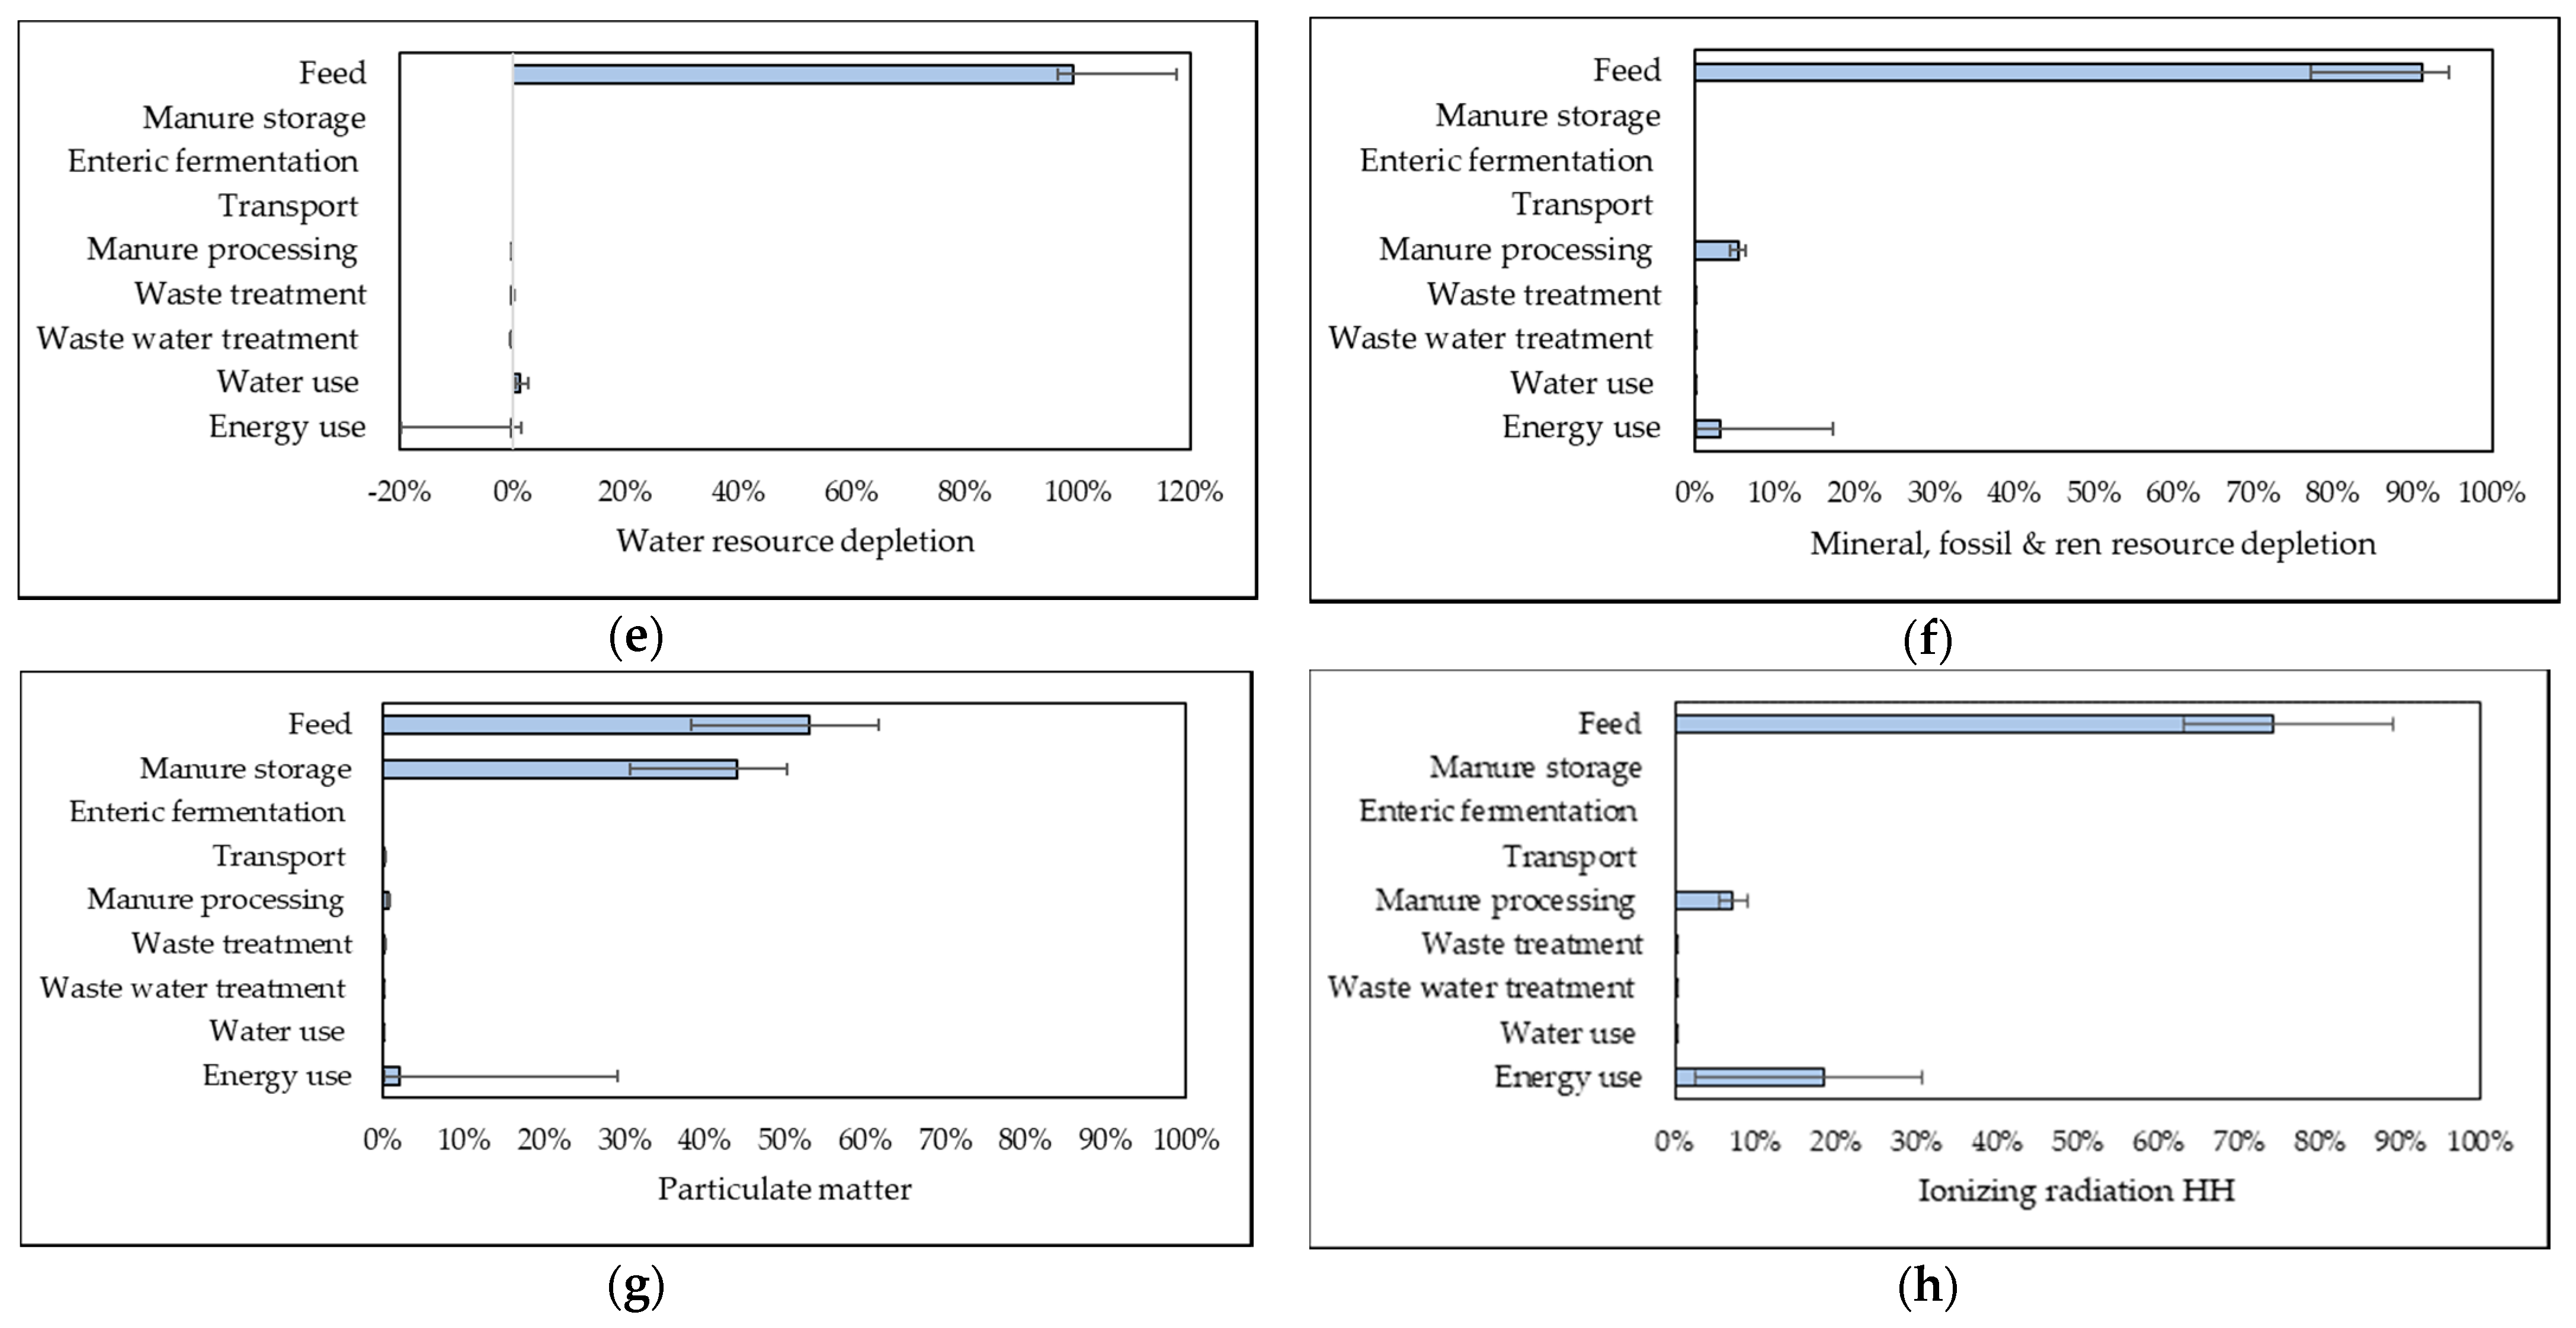
Figure 4 shows the mean, minimum and maximum contribution (%) of different inputs and processes to the environmental impact of the studied pig production systems, considering variabilities in farm characteristics and monthly feed compositions. Feed is the main contributor to climate change, followed by emissions from manure storage and enteric fermentation. For acidification and terrestrial eutrophication, which are both characterized based on the amount of emitted ammonia [42], the main contributing process is the direct emissions from manure storage. Freshwater eutrophication is only effected by P compounds [42], so not by the prevailing emissions of the farms. Figure 4 shows that freshwater eutrophication is mainly affected by feed production and to a much lesser extent by manure processing. Feed contributes by more than 99% to water resource depletion, which explains its high sensitivity to feed composition fluctuations. The water resource depletion of feed ingredients differs strongly (as further elaborated on in Section 3.4), increasing the variability. For mineral, fossil and renewable resource depletion, Figure 4 shows that the contribution of energy use is variable between farms, more than the contribution of feed varies. This is due to the fact that the amount and kind of energy used on the farms strongly influences resource use impacts. In terms of particulate matter, manure storage has a large contribution, caused by direct emissions of particulate matter (PM2.5 and PM10) and ammonia. The contribution of energy use to particulate matter is highly variable, influenced by the amount and kind of energy used on the different farms. Alongside feed, energy use and manure processing have large contributions to the environmental impact in terms of ionizing radiation (human health). This environmental impact category is also directly affected by the amount and type of energy used.
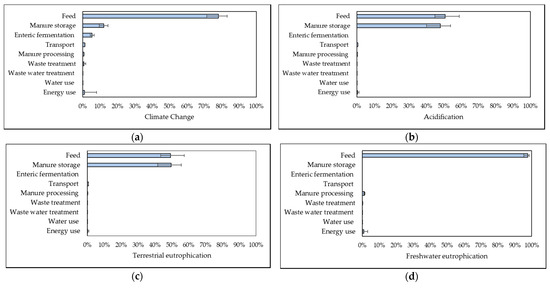
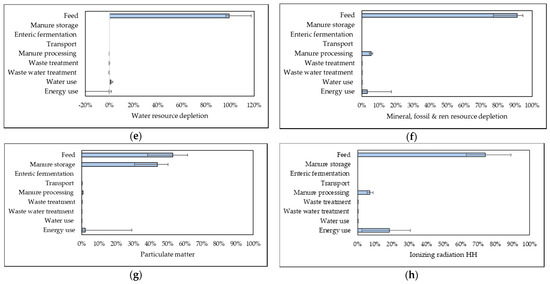
Figure 4.
Contribution analysis of environmental impacts of the studied pig production farms, in terms of (a) climate change, (b) acidification, (c) terrestrial eutrophication, (d) freshwater eutrophication, (e) water resource depletion, (f) mineral, fossil and renewable resource depletion, (g) particulate matter and (h) ionizing radiation (human health). Feed impacts include the production of feed and the transportation to Belgium, where applicable. Transport includes the transport of feed within Belgium and the transport of waste and manure to processing. The error bars display the minimum and maximum contribution of the inputs/processes, influenced by the differences between farms and fluctuations in monthly feed compositions.
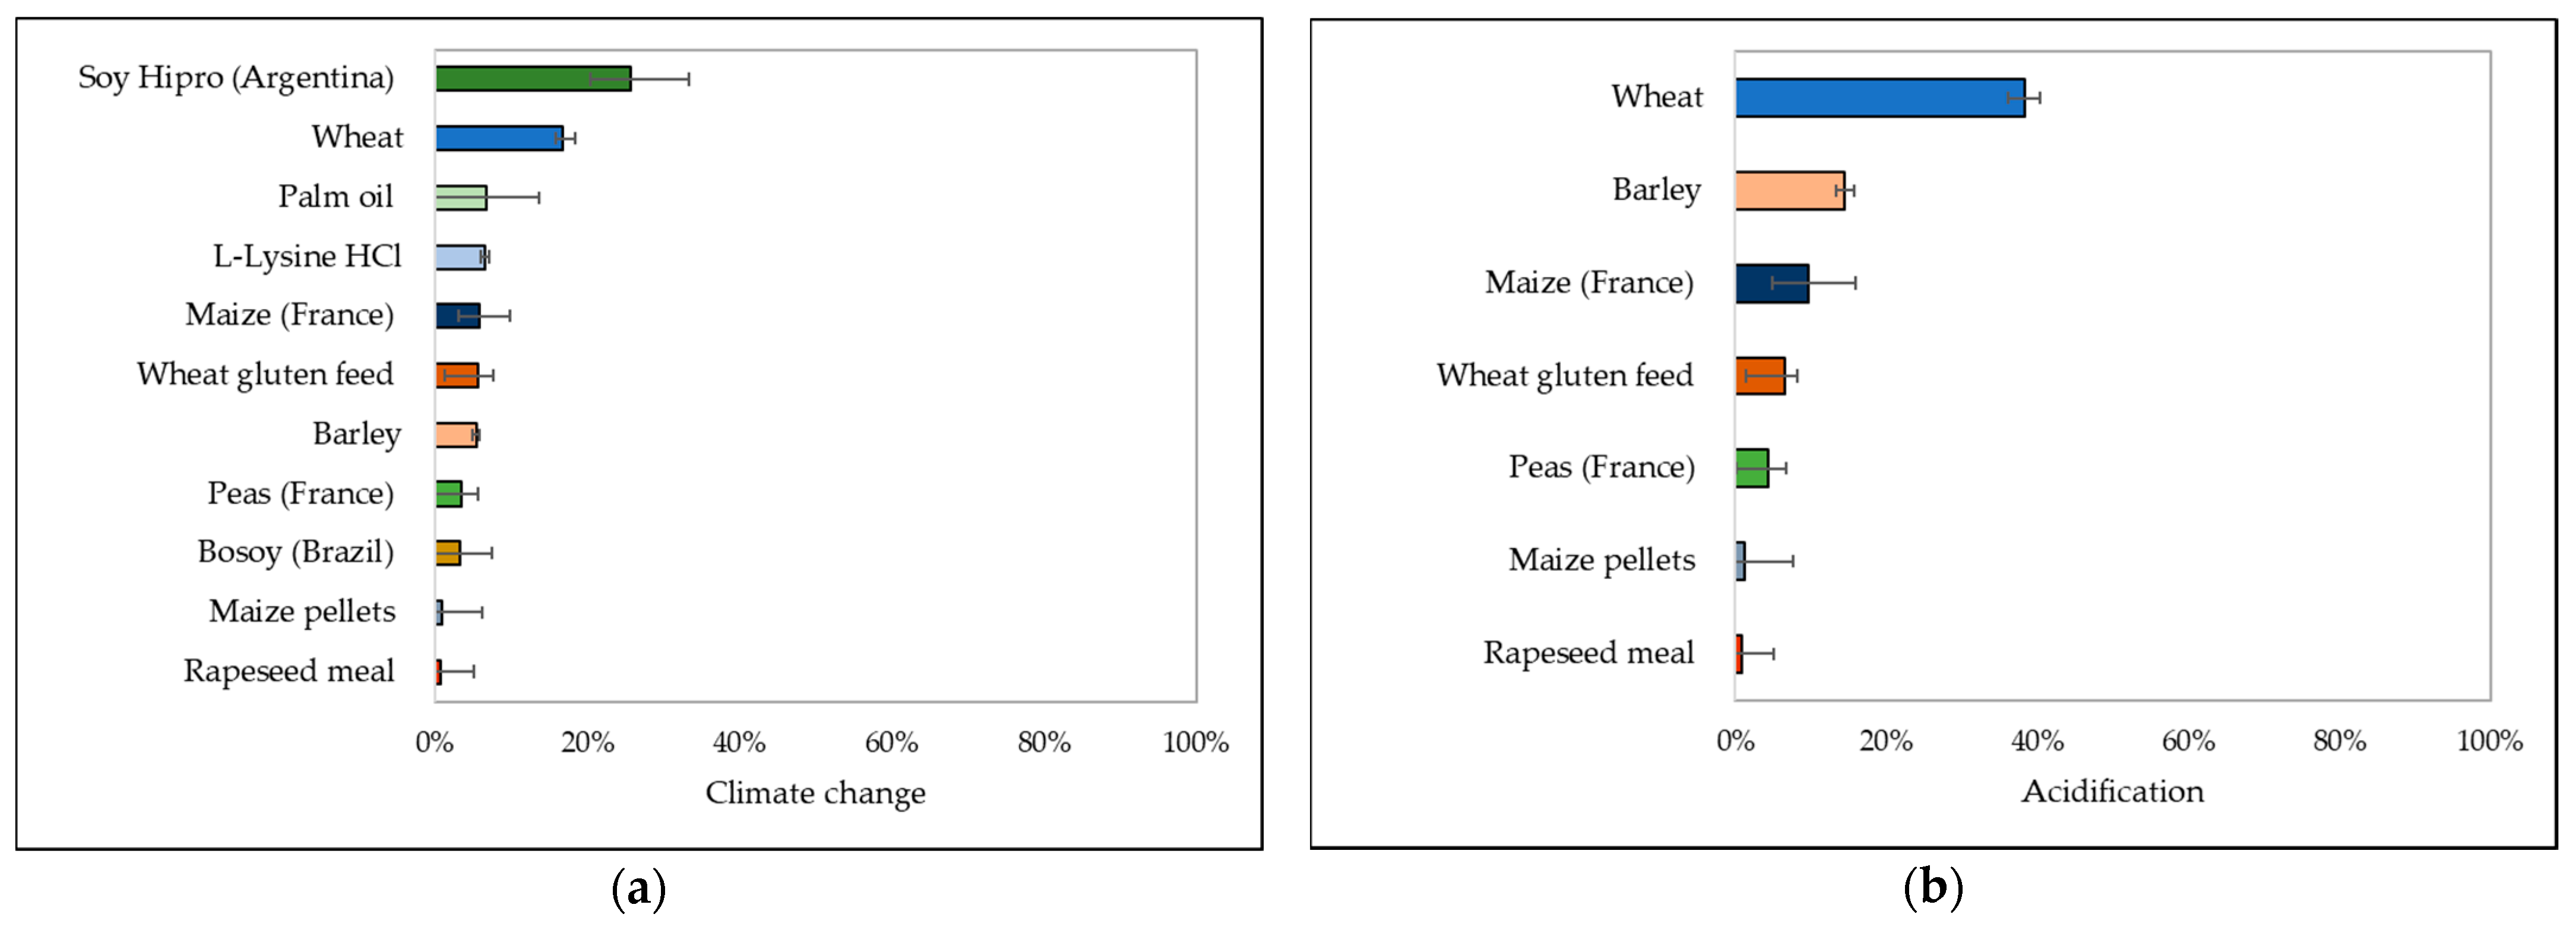
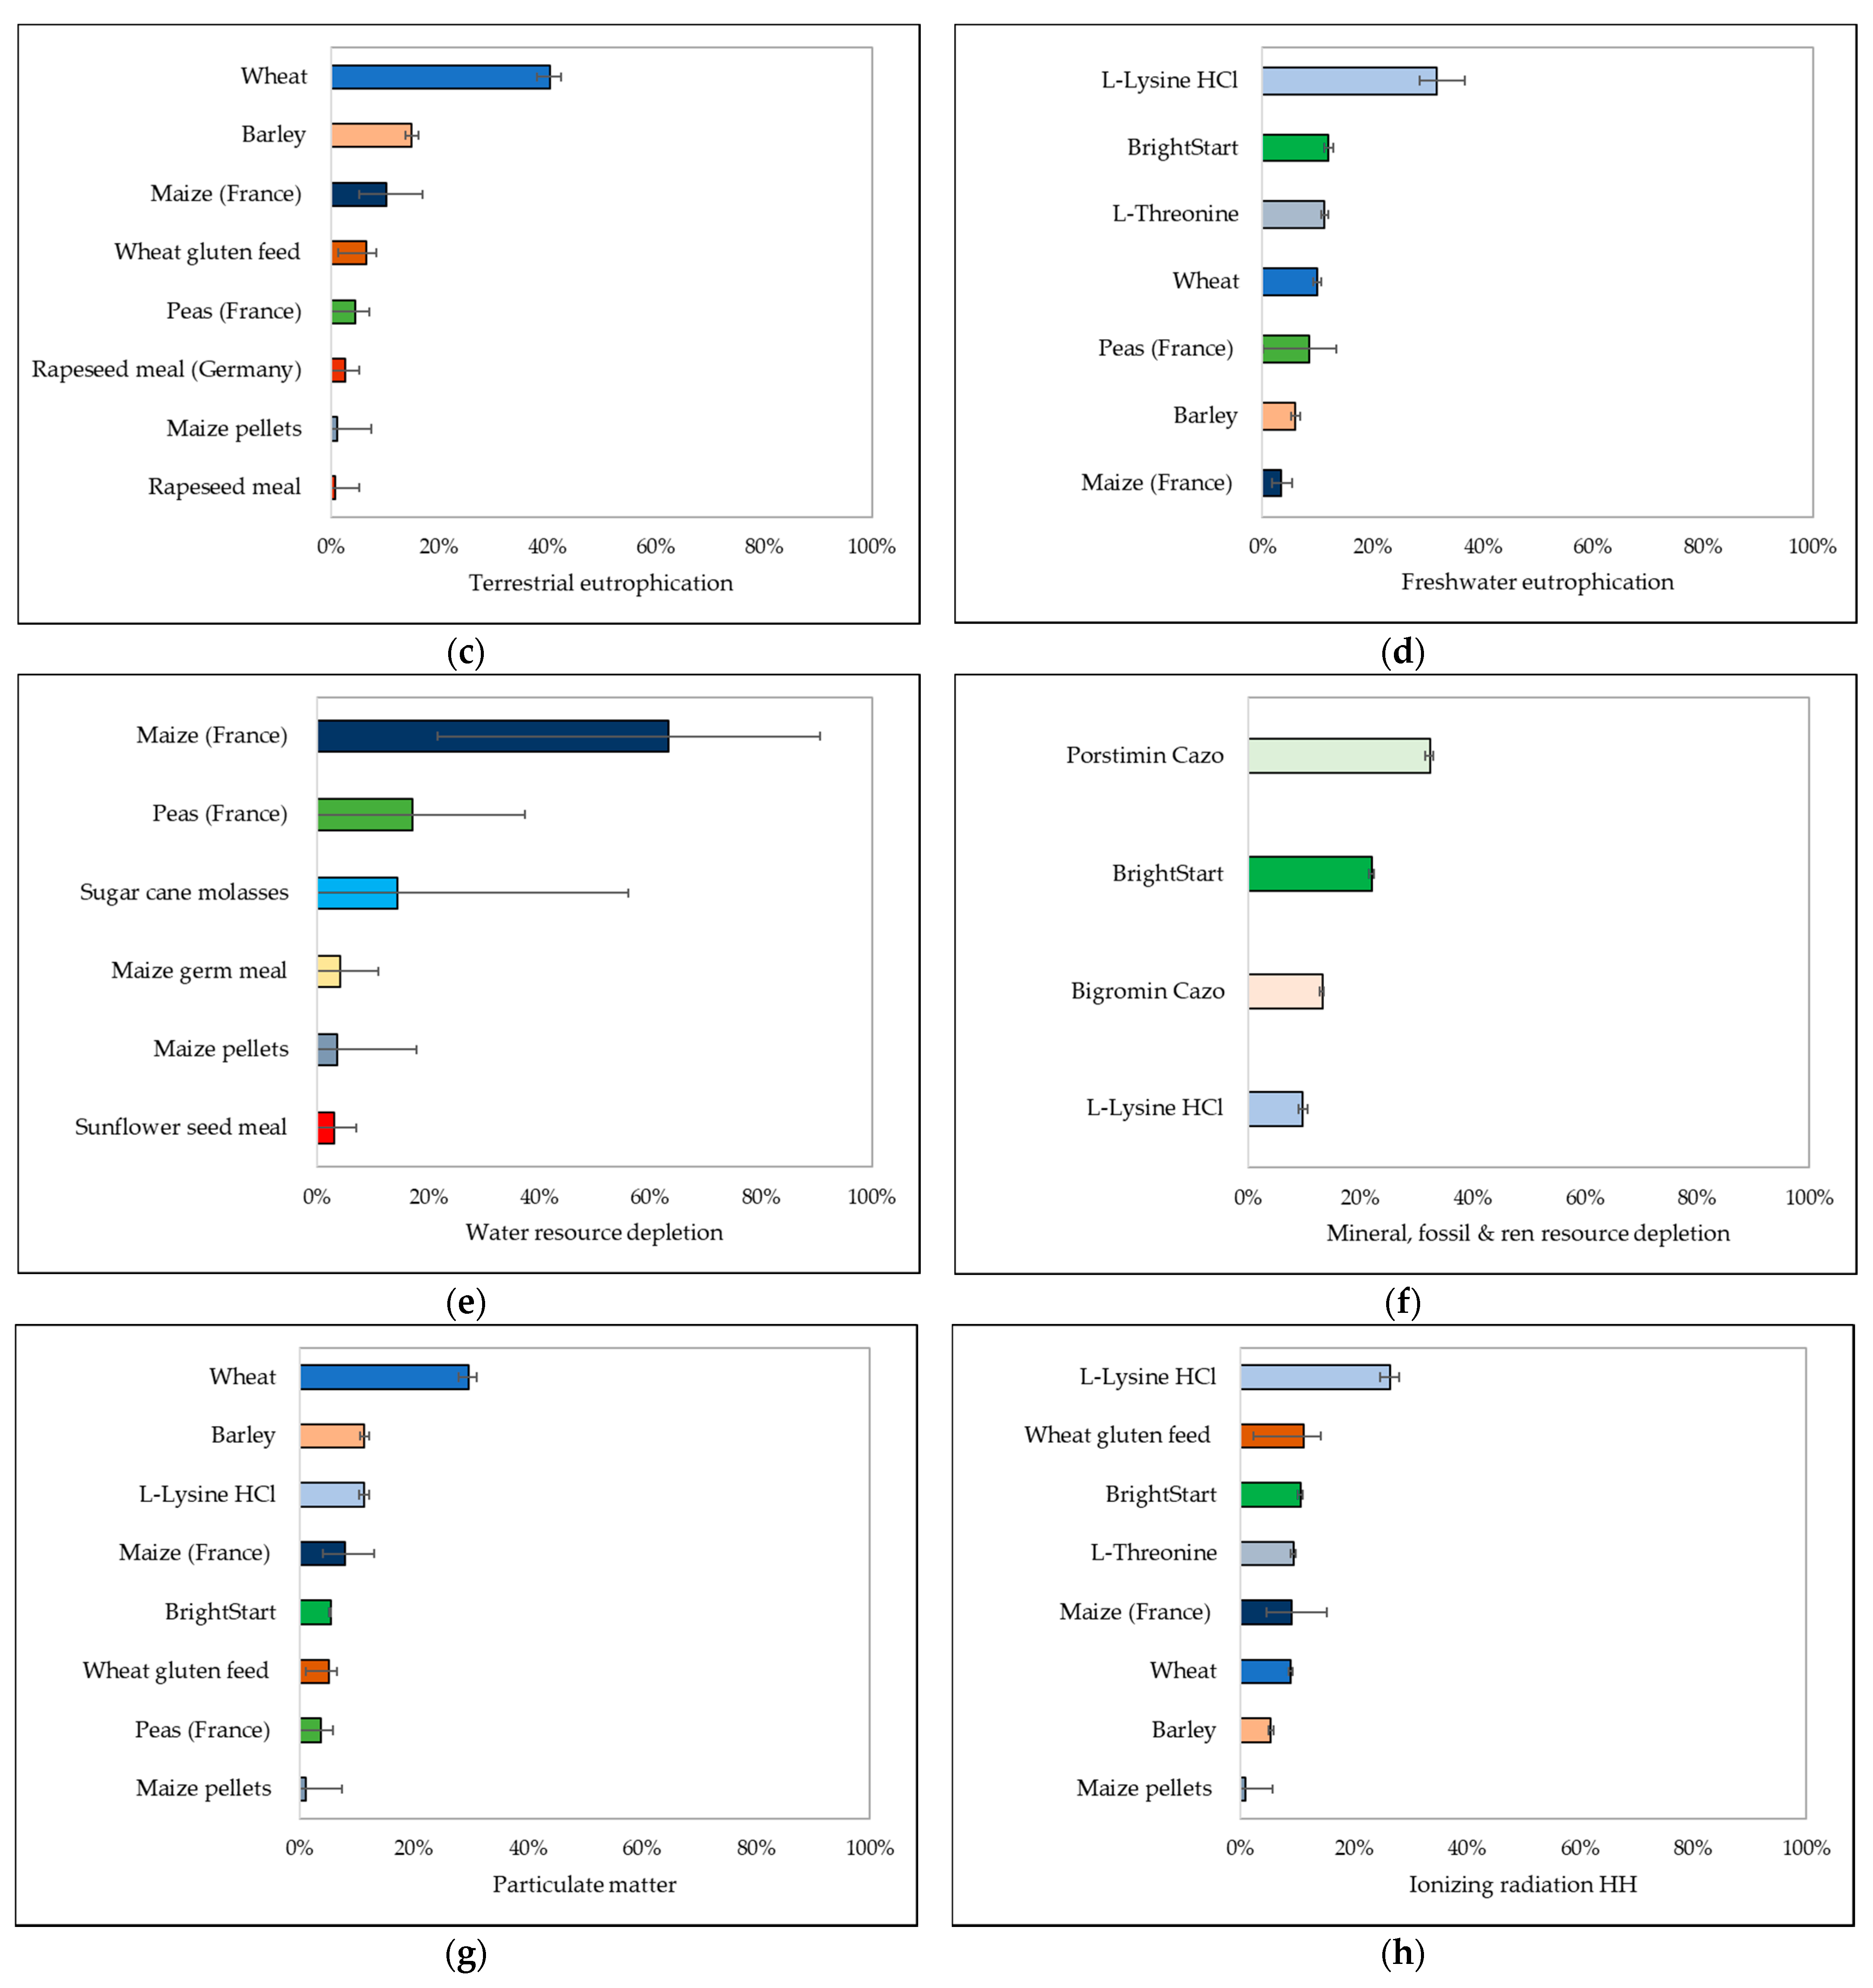
3.4. Environmental Impacts of Feed Products
While this section concerns the impact of the included feed products, Section 3.5 explores the environmental impact related to the total consumption of these products.
Figure 5 shows the environmental impact of 1 kg of the different feed products (left side) and the largest contributing feed ingredients to these impacts (right side). Error bars indicate the minimum and maximum impact/contribution influenced by the monthly fluctuations in feed compositions. The right-hand side of the graph shows the contributions of feed ingredients (with a mean impact contribution of at least 5%) only for the feed product that shows the highest variability in terms of the environmental impact category. For example, for climate change, this is feed for piglets from 4 to 7 kg, while for acidification, terrestrial eutrophication, freshwater eutrophication, resource depletion, particulate matter and ionizing radiation, this is feed for lactating sows.
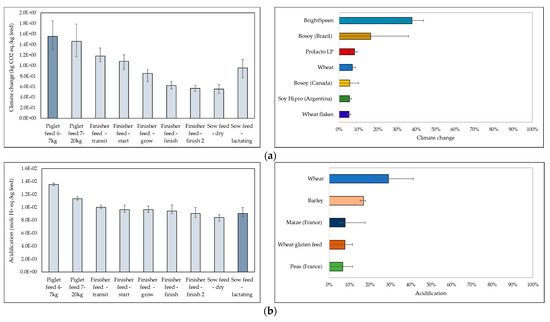
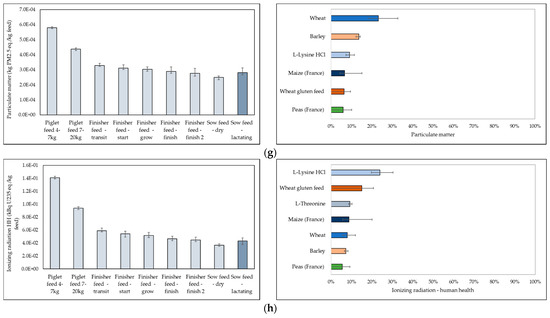
Figure 5.
Environmental impact of feed products (left) and contribution of feed ingredients (of which the mean contribution >5%) to feed products that show the highest impact variabilities (displayed in dark grey in left graphs) (right), in terms of (a) climate change, (b) acidification, (c) terrestrial eutrophication, (d) freshwater eutrophication, (e) water resource depletion, (f) mineral, fossil and renewable resource depletion, (g) particulate matter and (h) ionizing radiation (human health). For the contribution to climate change, feed for piglets from 4 to 7 kg is displayed; for acidification, terrestrial eutrophication, freshwater eutrophication, resource depletion, particulate matter and ionizing radiation, feed for lactating sows is displayed; and for water resource depletion, feed for finishers from 100 to 120 kg is displayed. The error bars in all graphs display the minimum and maximum impact of the feed products, reflecting the monthly fluctuations in feed compositions.
Piglet feed shows the highest impact for each environmental impact category and feed for dry sows the lowest, except for water resource depletion. In terms of climate change, the highest impact of piglet feed (4–7 kg) is mainly due to the ingredient BrightSpeen, a mixture of whey powder, potato protein, soybean products, synthetic amino acids, organic acids, minerals and vitamins. Soy ingredients also contribute a large part of the climate change impact of piglet feed. Bosoy (toasted and extruded soybeans) from Brazil and Canada show both high contributions and high contribution variabilities. These high variabilities are mainly caused by the fact that about half of the time, soybeans for the ingredient Bosoy are sourced from Brazil, and the other half they are sourced from Canada, as shown in Figure 2. Canadian soy induces significantly lower climate change impacts than Brazilian soy, leading to lower contributions in the months that it is present in the feed products. Another soy ingredient with a large contribution is Soy Hipro (high-protein soymeal) from Argentina. Argentinian soy shows comparable climate change impacts to Brazilian soy, leading to a large contribution even though it is present in relatively low concentrations in piglet feed.
Feed for lactating sows also shows relatively high environmental impacts and high variabilities. In terms of acidification and terrestrial eutrophication, this is mainly due to wheat, barley, maize, wheat gluten feed and peas. These ingredients are present in large percentages in sow feed, but not in every month (as shown in Figure 2), hence the large contribution and the high impact variability. In terms of freshwater eutrophication, amino acids (lysine and threonine) contribute considerably to the environmental impact of this feed product, together with peas, wheat and barley. Amino acids show very high freshwater eutrophication impacts per kg, leading to high contributions even though they are added in small amounts in the feed products (<0.5%). In terms of resource depletion, the main contributors to the environmental impact of feed for lactating sows are BrightSow Lacto (mixture of minerals, trace elements, vitamins and other feed additives), monocalcium phosphate and lysine. Feed minerals show a large impact in terms of resource depletion, leading to the high contributions to the feed products. In terms of particulate matter, the main ingredients contributing to the environmental impact of lactating sow feed are wheat, barley, lysine, maize, and wheat gluten feed. The same ingredients are the main contributors to ionizing radiation impacts of this feed product, together with L-threonine.
While lysine shows a large contribution for multiple environmental impact categories, it has a negative contribution to water resource depletion of feed for finishers in the last growing phase. The main contributors to this environmental impact category are sugar cane molasses, peas and maize ingredients. The high contribution and contribution variability of sugar cane molasses is caused by the very high water resource depletion impact per kg of this ingredient and by the fact that it is only added to the feed products in January, February and March. The same holds for peas, which are not added to the feed products in January and September.
3.5. Environmental Impacts of Feed Consumption
While Section 3.4 concerns the environmental impact of the different feed products, this section describes the environmental impact of the total feed consumption on the studied farms, taking into account the mean yearly consumption amounts of the different feed products (as displayed in Table 2) and the monthly feed compositions (as displayed in Figure 2). Figure 6 shows the monthly compositions of “weighted feeds”, which represent the total consumption of feed ingredients relative to the total consumption of piglet, finisher and sow feed products in one year, considering the monthly feed compositions of the different feed products. Wheat, barley, wheat gluten feed and maize represent the majority of feed consumption in the year 2018.
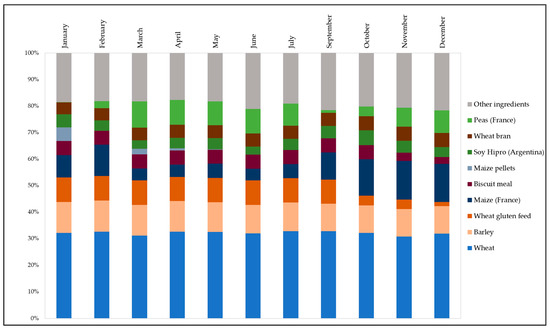
Figure 6.
Compositions of weighted feed in the considered months. Ingredients that represent <5% in all the feed products are displayed together as “other ingredients”.
Figure 7 shows the contribution of the feed ingredients to the environmental impact of the weighted feed. The error bars represent the minimum and maximum impact contribution, reflecting the monthly fluctuation in feed compositions, as shown in Figure 6. The ingredients for which the maximum contribution—depending on the monthly feed compositions—is more than 5% are displayed in the graph.
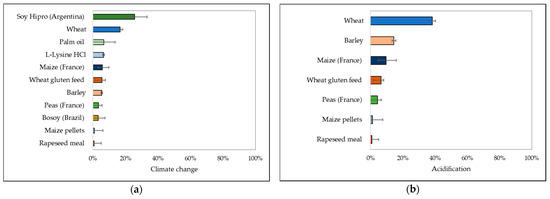
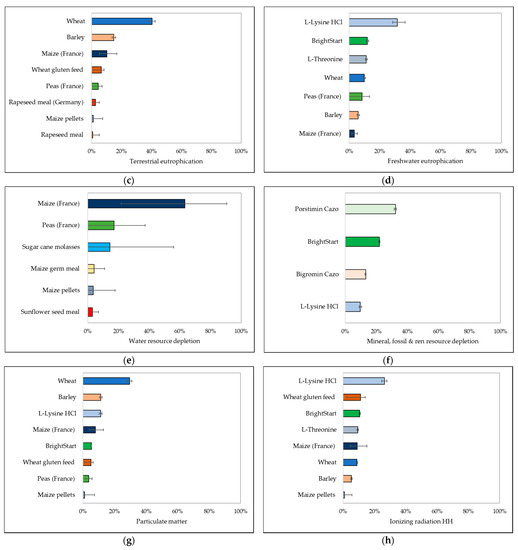
Figure 7.
Contribution of feed ingredients to the environmental impact of 1 kg of “weighted feed” in terms of (a) climate change, (b) acidification, (c) terrestrial eutrophication, (d) freshwater eutrophication, (e) water resource depletion, (f) mineral, fossil and renewable resource depletion, (g) particulate matter and (h) ionizing radiation (human health). Ingredients with a maximum contribution of at least 5% are displayed. The error bars display the minimum and maximum contribution of the feed ingredients, influenced by monthly fluctuations in feed compositions.
The main contributor to the climate change impact of the weighted feed is Soy Hipro (high-protein soymeal) from Argentina. Although this ingredient represents less than 10% of the weight of all feed products, it is present in almost every feed product and month, and it induces a relatively high climate change impact per kg compared with other ingredients. Other large contributors to climate change impacts are wheat, palm oil, lysine, maize, wheat gluten feed, barley, peas, Bosoy, maize pellets and rapeseed meal. The contribution of Bosoy to the weighted feed is smaller than its contribution to piglet feed, as shown in Figure 5. Bosoy is only present in piglet feed, which is consumed in relatively small amounts compared with finisher feed. The variabilities in the contributions of the ingredients are mainly due to the varying contents of these ingredients in the feed products. Palm oil is present only in finisher feed and sow feed and is only added during some months. Due to its high climate change impact per kg, it induces a high contribution and high contribution variability to climate change impacts. Amino acids have a large impact on climate change per kg, causing large contributions even at low concentrations (<0.5% in feed products).
The main contributors to acidification and terrestrial eutrophication impacts of the weighted feed are wheat, barley, maize, wheat gluten feed, peas, maize pellets and rapeseed meal. The high contribution of these ingredients is mainly caused by their high contents in the feed products, as shown in Figure 2.
For freshwater eutrophication, the largest contributors are amino acids (L-lysine and L-threonine). As discussed before, amino acids show very high freshwater eutrophication impacts per kg, leading to high contributions even though they are added in small amounts in the feed products (<0.5%). Moreover, the composed ingredient BrightStart, a mixture of whey powder, wheat products, potato protein, organic acids, minerals, synthetic amino acids and vitamins, shows large contributions to freshwater eutrophication, mainly caused by amino acids. BrightStart appears in this graph because of the higher consumption amount of piglet feed for 7–20 kg compared with the consumption amount of piglet feed for 4–7 kg, which contains BrightSpeen. The latter ingredient therefore appears as a main contributor in Figure 5 but not in Figure 7. BrightStart is added to feed for piglets from 7 to 20 kg at the same concentration in each month, hence the low variability in the contribution of this ingredient. In terms of resource depletion, particulate matter and ionizing radiation, amino acids and BrightStart show high contributions as well. The composed ingredients Porstimin Cazo and Bigromin Cazo, consisting mainly of feed minerals, also contribute considerably to resource depletion. Compared with vitamins and amino acids, feed minerals show large impacts in terms of resource depletion, leading to the high contributions of these feed products.
In terms of water resource depletion, maize products show the largest contribution, followed by peas, sugar cane molasses and sunflower seed meal. The high contribution and contribution variability of sugar cane molasses is caused by the very large water resource depletion impact per kg of this ingredient and by the fact that it is only added to the feed products in January, February and March. The high water resource depletion value per kg of maize outbalances its relatively low content in the feed products. The varying amount of maize in monthly feed compositions is the explaining factor of the variability in its contribution to water resource depletion. In some months, maize is replaced by peas, together with other ingredients, with peas inducing smaller water resource depletion values per kg than maize. The contribution variability of peas to water resource depletion is very high, because they are not added to any feed product in the months of January and September.
4. Discussion
This study assessed the environmental impact of Flemish pig production for the reference year 2018, in terms of multiple environmental impact categories and taking into account variabilities in farm characteristics and feed compositions.
4.1. Environmental Impacts of Belgian Pig Production
The results show that the environmental impact in terms of climate change ranged from 2.6 to 3.9 kg CO2 equivalents per kg live weight (LW), with an average of 3.2 kg CO2 eq./kg LW. These values are comparable to the results of Six et al. (2017), who evaluated the environmental impact of two Flemish pig production farms in 2013 and found a climate change impact of 3.1 kg CO2 eq./kg LW and 3.4 kg CO2 eq./kg LW, respectively, for the two farms [9].
The study of ERM and UGent (2011), who evaluated the climate change impact of Flemish pig production for the reference year 2009, showed a climate change value of 3.7 kg CO2 eq./kg LW [10]. The lower average climate change impact per kg LW of the present study compared with the result of ERM and UGent (2011) is mainly due to a lower impact of manure storage in 2018 compared with 2009. In the study of ERM and UGent (2011), it was assumed that all manure is stored on the farm for longer than one month. However, in reality, some of the manure is regularly removed from the farm to manure processors [33,43], as implemented in this study. Another methodological difference is that this study does not take into account emissions from manure application, following the most recent guidelines for environmental impact assessment of pig supply chains [21], which recommend considering manure as a residual and assigning the emissions of manure application to the subsequent plant production system (as described in Section 2.1.3). However, if the same methodological choices had been applied to the situation in 2009, the climate change impact of manure storage in 2009 would still have been higher than in 2018, as generally less manure was removed from Flemish pig farms in 2009 than in 2018 [33,43]. Further, the impact of manure processing, which would be higher in 2018 than in 2009 because of the larger proportion of manure that is removed from the farms, does not balance out the lower impact from manure storage. So, despite the different methodological choices in both studies, the direct emissions from manure storage have decreased between 2009 and 2018.
Monteiro et al. (2019) assessed the environmental impact of French, Italian and Slovenian pig production, and found considerably higher values for climate change than values found in this study: from 5.07 kg CO2 eq./kg LW to 9.35 kg CO2 eq./kg LW [16]. This is partly due to the lower scale of the systems assessed in the study of Monteiro et al. (2019), with a much lower number of animals per farms, and the lower efficiency, reflected in the lower feed conversion efficiency and the lower number of finishers per sow. Additionally, a longer fattening period on the studied farms led to higher on-farm methane emissions. Finally, the system boundaries included emissions from manure application, while this study does not include these emissions, as mentioned before. Dourmad et al. (2014) assessed the environmental impact of different pig production systems in five European countries. For conventional systems, which are comparable to the system considered in this study, the authors found a climate change impact of 2.3 kg CO2 eq./kg LW [17], considerably lower than the average and minimum values found in this study. Although the efficiency of the conventional systems of the study is comparable to the efficiencies of the farms in this study, the study of Dourmad et al. (2014) takes into account the avoided impact of mineral fertilizers, which is the main cause of the lower total impacts.
4.2. Variability in Impact Results Due to Varying Farm Characteristics and Feed Compositions
The results presented in this paper show how the variability of different farm characteristics and feed compositions affects the environmental impact of pig production in Flanders. In general, the results are more sensitive to variabilities in farm characteristics than variabilities in feed composition, and the variabilities in results differ between environmental impact categories. The differences between farms are mainly affected by the amount of feed used per animal (sows, piglets, finishers) and the number of finishers that are produced per sow, together reflected in the productivity of the farms. A higher productivity is generally related to lower environmental impacts. McAuliffe et al. (2017) came to similar conclusions when assessing the environmental impact of Irish pig production systems in relation to herd performance [8]. In Belgium, as in other European countries, the productivity of agriculture has increased in recent decades. At the same time, in livestock production, the number of farms has decreased and the number of animals per farm has increased [5,6].
While feed conversion efficiency and the number of finishers per sow have a direct effect on the environmental impact of feed consumption, the amount of feed consumed also influences the impact of manure storage, as it affects the amount of volatile solids excreted by the animals, which induces emissions of methane and non-methane volatile organic compounds. Another factor affecting the variability in environmental impacts of the farms is the amount and kind of energy used. Farms that use wood pellets for heating (e.g., farm 8) show higher impacts in terms of climate change, particulate matter and mineral, fossil and renewable resource depletion, with a high contribution of energy compared with other farms. Heat from wood pellets induces higher greenhouse gas emissions and higher resource depletion per kWh compared with, for example, heat from natural gas (0.39 kg CO2 eq. and 2.99 kg Sb eq./kWh for wood pellets compared with 0.26 kg CO2 eq. and 1.83 kg Sb eq./kWh for natural gas) [25].
The largest differences in results caused by variabilities in farm characteristics occur for the environmental impact categories particulate matter and ionizing radiation (human health). Particulate matter concentrations are affected by direct and indirect emissions of particulates, measured by the amount of particulates smaller than 10 microns (PM10) and particulates smaller than 2.5 microns (PM2.5) [40]. In terms of farm characteristics, the amount and type of energy used directly affects this environmental impact category. Two of the studied farms use wood pellets for heating, which induces very high emissions of PM10 and PM2.5 [25], and therewith causing a high variability in this impact category. Particulate matter is also affected directly by ammonia, PM10 and PM2.5 emissions from housing and manure storage [37,40]. These emissions are directly affected by the number of animals and feed intake on the different farms, explaining part of the variability in this impact category. Ionizing radiation is measured by the radioactive releases and the absorption by the human body to assess the effect on human health. The variability in the use of electricity, which in Belgium is mainly produced by nuclear power [44], on the farms and for manure processing has a direct influence on the variability in the results for this impact category.
Based on these observations, an option for environmental impact mitigation is to increase feed conversion efficiency even more. This can be achieved by genetic selection as well as by feed composition optimization [14], of which the latter will be discussed in the following paragraphs. An increase in the number of pigs produced per sow could also reduce environmental impacts, which could be achieved by improving sow productivity and lowering mortality. Another evident environmental impact mitigation option is to replace wood pellets with natural gas for heating purposes. Further, to decrease emissions from manure storage, it is beneficial to remove manure as much as possible to manure processing. Pexas et al. (2020) similarly found that manure processing by means of anaerobic digestion can reduce environmental impacts [45]. However, for a complete comparison of manure management options and their environmental impacts, the application of manure for fertilizations should also be taken into account, as in the studies of Makara et al. (2019) [18] and Corbala-Robles et al. (2018) [30].
4.3. The Environmental Impact of Feed and Its Contribution to the Environmental Impact of Pig Production
Like previously executed studies [1,8,9,10], this study has shown that feed is the main contributor to the environmental impacts of pig production, contributing on average 78.2% in climate change, 50.9% in acidification, 49.3% in terrestrial eutrophication, 97.6% in freshwater eutrophication, 99.2% in water resource depletion, 91.2% in resource depletion, 53.0% in particulate matter and 74.3% in ionizing radiation.
The environmental impact of Belgian pig feed in 2018 deviated considerably depending on feed compositions, which fluctuated between months. The deviations in feed impacts are influenced by the presence or absence of certain ingredients and by their origin. For example, the water resource depletion of the consumed feed is highly influenced by the presence of sugar cane molasses. This ingredient was used in feed products only in January, February and March in 2018. In the other months, sugar beet molasses were added instead, which show a much lower value for water resource depletion. The change from sugar cane to sugar beet molasses leads to high variabilities. Some feed companies are recently shifting from sugar cane molasses to sugar beet molasses because of its lower price (L. Levrouw, DSM, personal communication, 2021), which could favor the environmental impact of feed in terms of water resource depletion.
The climate change impact of piglet feed is highly influenced by the origin of soy products: the climate change impact of Canadian soy is significantly lower than that of Brazilian soy, i.e., 1.0 kg CO2 eq./kg soy beans compared with 5.2 kg CO2 eq./kg soy beans [26]. The high climate change impact of Brazilian soy is mainly caused by land use change, which is much higher for soy production in Brazil than soy production in Canada [46]. The largest contributor to climate change impact of the total feed consumption of the studied farms is Soy Hipro (high-protein soymeal). Soy beans used for this ingredient originate from Argentina and also induce a large climate change impact, i.e., 6.6 kg CO2 eq./kg soybeans, caused mainly by land use change [26]. Soy Hipro is present in almost all feed products and months, and therefore has a large contribution to the climate change impact of feed consumption. The variability in this impact is lower than that for Bosoy and Danex, as this ingredient is present in almost all feed products during all months. Based on these observations, a possible environmental impact mitigation option is to source soy ingredients exclusively from countries that are not associated with land use change, if available on the market, or to replace soy with other feed ingredients. Long-term system dynamics should however be taken into account when analyzing these changes, as shown by van Zanten et al. (2018) [47].
Amino acids, both directly added to feed products and through composed ingredients, are large contributors to the environmental impact of feed consumption in terms of climate change, freshwater eutrophication, resource depletion, particulate matter and ionizing radiation (human health), as shown in Figure 7. Lysine is the largest contributor among amino acids in terms of most of the environmental impact categories. Based on this observation, avoiding the addition of synthetic amino acids could lower the environmental impacts of feed products. However, Garcia-Launay et al. (2014) and Ogino et al. (2013) showed that the replacement of high-protein ingredients with synthetic amino acids in pig diets decreases environmental impacts of pig production [48,49]. This observation indicates that although synthetic amino acids have large contributions to the environmental impact of feed consumption, they are efficient suppliers to meet the nutritional requirements of the pigs. It should also be noted that the environmental impact of amino acids depends on the applied production process and location [50,51], revealing possible impact reduction strategies in terms of feed ingredient sourcing.
As described above, feed compositions are determined by linear programming based on availability and price on the market, respecting animal-specific minima and maxima concerning energy needs, proteins, minerals and vitamins. For sure, there are possibilities to extend the linear programming concept to include the minimization of environmental impact indictors [15,19], which would lead to interesting potential new feed formulations. The possibilities in practice will need to be assessed, for example, by an appropriate label that can communicate which efforts have been made. Carbon costing would also be a possibility, under the condition that it does not only lead to price increases, affecting poorer people to a larger extent.
Within the linear programming efforts, one could then also imagine paying special attention to the inclusion of residuals from the food industry in the feed products, as this leads to lower environmental impacts [52]. As shown in Figure 6, biscuit meal, a residual product from the bakery industry, represents a large proportion of the total feed consumption, while showing a very small contribution to its environmental impacts. Boonen et al. (2012) already point to the idea of efficiency in combination with the ethical effect of reducing the competition between ingredients suitable for human beings and those suitable for animal production [53]. Attention should be paid to the fact that co-products are not available unlimitedly, and the consequences for the prevailing food systems should be taken into account, as shown by van Zanten et al. (2018) [47].
4.4. Limitations of This Study and Future Research
This study used detailed inventory data from 39 different farms in terms of farm population, energy use and feed consumption, as well as detailed data of feed compositions from feed suppliers. Some information that was not available for every farm, such as manure management characteristics and water use, were sourced from available technical reports [32,33]. These general data do not reveal variabilities between farm characteristics and their impact on the results. In future research, detailed data on manure management and water use could be collected and integrated for each farm.
While this study focuses on environmental impacts, the pig production sector is influenced by many factors, such as market prices of finished pigs and of feed ingredients [54,55]. Fluctuations in these factors and their effects on the environmental impact of pig production are partly taken into account by considering monthly fluctuations in feed compositions, which are influenced by market prices among other factors, and by comparing the climate change impact found in this study with the climate change impact observed in 2009 (as described in Section 4.1). However, the volatility of the pig production sector could be further integrated in environmental impact studies by using panel data.
The considered feed compositions represent monthly feed products that were available on the market in 2018, although they do not represent the actual feed products consumed on each of the included farms. To indicate the combined variability between farms and between feed compositions, not only the consumption amounts on the farms, but also the used feed products and their compositions should be monitored.
This study consulted the most recent versions of background databases as much as possible; however, Agribalyse v1.3 was consulted to be in line with previously executed studies, while a new version of this database was recently released (Agribalyse 3.0 [56]). The use of this new version could affect the results considerably, in particular the environmental impact of feed products.
A growing number of Flemish pig production farms apply low-emission stables [33], which reduce ammonia emissions. The effect of these stables is not taken into account in this study. De Vries and Melse (2017) assessed the environmental impact of different kinds of air scrubbers used in low-emission stables [57]. The results of this study could be integrated into future LCA studies of pig production systems.
One of the findings of this study is that higher farm productivity is related to lower environmental impacts. What is not taken into account in this study is animal welfare. Scherer et al. (2018) [58] developed a framework to integrate animal welfare into LCA, which could be used in future environmental impact evaluations of pig production.
5. Conclusions
This study has shown that the environmental impact of pig production in Flanders is dependent on farm characteristics and monthly feed compositions. The main influencing farm characteristics are productivity, in terms of feed conversion and sow productivity, and the type and amount of energy used. In particular, the use of wood pellets leads to high environmental impacts. In terms of feed consumption, the amount and origin of soy ingredients, and the presence of synthetic amino acids are determinant factors for environmental impacts. By focusing on these farm and feed parameters, targeted developments for environmental impact reductions can be formulated. Hereto, low-impact farms can serve as an example for higher-impact farms.
Supplementary Materials
The following are available online at https://www.mdpi.com/article/10.3390/su132111623/s1, Table S1: Feed ingredients, selected processes and corresponding background databases, Table S2: Feed conversion efficiencies, number of pigs produced per sow and resulting productivity of the studied pig production farms.
Author Contributions
Conceptualization, K.V.M., E.B., L.B. and A.G.; methodology, K.V.M., L.B. and E.B.; software, K.V.M., E.B. and A.G.; validation, K.V.M.; formal analysis, L.B. and K.V.M.; investigation, L.B. and K.V.M.; resources, A.G.; data curation, K.V.M. and E.B.; writing—original draft preparation, K.V.M.; writing—review and editing, E.B., J.D.T. and A.G.; visualization, K.V.M. and A.G.; supervision, A.G. and J.D.T.; project administration, A.G.; funding acquisition, A.G. and J.D.T. All authors have read and agreed to the published version of the manuscript.
Funding
This work was funded by the Science, Engineering and Technology Group at KU Leuven for the Expertise Centre Ethics@Arenberg and by the KU Leuven Department of Biosystems.
Institutional Review Board Statement
Not applicable.
Informed Consent Statement
Not applicable.
Data Availability Statement
Not applicable.
Acknowledgments
This work was supported by the Science, Engineering and Technology Group at KU Leuven for the Expertise Centre Ethics@Arenberg and by the KU Leuven Department of Biosystems. The authors would like to thank Boerenbond for delivering data on Flemish pig production farms, DSM for the detailed feed composition data and Arvesta for sales percentages of feed products.
Conflicts of Interest
The authors declare no conflict of interest. The funders had no role in the design of the study; in the collection, analyses, or interpretation of data; in the writing of the manuscript, or in the decision to publish the results.
References
- MacLeod, M.; Gerber, P.; Mottet, A.; Tempio, G.; Falcucci, A.; Opio, C.; Vellinga, T.; Henderson, B.; Steinfeld, H. Greenhouse Gas Emissions from Pig and Chicken Supply Chains; Food and Agriculture Organization of the United Nations: Rome, Italy, 2013; p. 196. [Google Scholar]
- FAOSTAT. FAO Statistical Database. 2021. Available online: https://www.fao.org/faostat/en/#data (accessed on 1 August 2021).
- OECD. Meat Consumption. 2021. Available online: https://data.oecd.org/agroutput/meat-consumption.htm (accessed on 1 August 2021).
- OECD/FAO. OECD-FAO Agricultural Outlook 2020–2029; FAO, Rome/OECD Publishing: Paris, France, 2020. [Google Scholar] [CrossRef]
- Departement Landbouw en Visserij. Uitdagingen voor de Vlaamse land- en tuinbouw-Landbouwrapport 2018. 2018. Available online: https://rundveeloket.be/sites/default/files/inline-files/2018%20Landbouwrapport.pdf (accessed on 1 August 2021).
- Departement Landbouw en Visserij. Landbouwrapport 2020. 2020. Available online: https://landbouwcijfers.vlaanderen.be/landbouwrapport-2020-lara (accessed on 1 August 2021).
- European Commission. The Nitrates Directive. 2020. Available online: https://ec.europa.eu/environment/water/water-nitrates/index_en.html (accessed on 1 August 2021).
- McAuliffe, G.; Takahashi, T.; Mogensen, L.; Hermansen, J.; Sage, C.; Chapman, D.; Lee, M. Environmental trade-offs of pig production systems under varied operational efficiencies. J. Clean. Prod. 2017, 165, 1163–1173. [Google Scholar] [CrossRef]
- Six, L.; De Wilde, B.; Vermeiren, F.; Van Hemelryck, S.; Vercaeren, M.; Zamagni, A.; Masoni, P.; Dewulf, J.; De Meester, S. Using the product environmental footprint for supply chain management: Lessons learned from a case study on pork. Int. J. Life Cycle Assess. 2017, 22, 1354–1372. [Google Scholar] [CrossRef] [Green Version]
- ERM en Universiteit Gent. Toepassen van de Carbon Footprint methodologie op Vlaamse Veehouderijproducten. Rapport in opdracht van Beleidsdomein Landbouw en Visserij, Afdeling Monitoring en Studie, Brussel. 2011. Available online: https://www.vlaanderen.be/publicaties/toepassen-van-de-carbon-footprint-methodologie-op-vlaamse-veehouderijproducten (accessed on 1 August 2021).
- Devers, L.; Kleynhans, T.; Mathijs, E. Comparative life cycle assessment of Flemish and Western Cape pork production. Agrekon 2012, 51, 105–128. [Google Scholar] [CrossRef]
- BFA. Samenstelling Diervoeding: Het Gebruik van Nevenstromen in de Diervoeding. 2015. Available online: https://bfa.be/BFA_Fact_Sheet (accessed on 1 August 2021).
- Departement Landbouw en Visserij. Kennis van Varkensvoeding Als Sleutel tot Rendabel Voederen. 2014. Available online: https://lv.vlaanderen.be/nl/voorlichting-info/publicaties/dier/varkens/kennis-van-varkensvoeding-als-sleutel-tot-rendabel (accessed on 1 August 2021).
- Soleimani, T.; Hermesch, S.; Gilbert, H. Economic and environmental assessments of combined genetics and nutrition optimization strategies to improve the efficiency of sustainable pork production. J. Anim. Sci. 2021, 99, 1–14. [Google Scholar] [CrossRef]
- de Quelen, F.; Brossard, L.; Wilfart, A.; Dourmad, J.-Y.; Garcia-Launay, F. Eco-Friendly Feed Formulation and On-Farm Feed Production as Ways to Reduce the Environmental Impacts of Pig Production Without Consequences on Animal Performance. Front. Vet. Sci. 2021, 8, 689012. [Google Scholar] [CrossRef]
- Monteiro, A.N.T.R.; Wilfart, A.; Utzeri, V.J.; Lukač, N.B.; Tomažin, U.; Costa, L.N.; Čandek-Potokar, M.; Fontanesi, L.; Garcia-Launay, F. Environmental impacts of pig production systems using European local breeds: The contribution of carbon sequestration and emissions from grazing. J. Clean. Prod. 2019, 237, 117843. [Google Scholar] [CrossRef]
- Dourmad, J.; Ryschawy, J.; Trousson, T.; Bonneau, M.; Gonzalez, J.; Houwers, H.; Hviid, M.; Zimmer, C.; Nguyen, T.L.T.; Morgensen, L. Evaluating environmental impacts of contrasting pig farming systems with life cycle assessment. Animal 2014, 8, 2027–2037. [Google Scholar] [CrossRef] [PubMed] [Green Version]
- Makara, A.; Kowalski, Z.; Łukasz, L.; Kulczycka, J. Comparative analyses of pig farming management systems using the Life Cycle Assessment method. J. Clean. Prod. 2019, 241, 118305. [Google Scholar] [CrossRef]
- Soleimani, T.; Gilbert, H. An approach to achieve overall farm feed efficiency in pig production: Environmental evaluation through individual life cycle assessment. Int. J. Life Cycle Assess. 2021, 26, 455–469. [Google Scholar] [CrossRef]
- Bandekar, P.A.; Leh, M.; Bautista, R.; Matlock, M.D.; Thoma, G.; Ulrich, R. Life cycle assessment of alternative swine management practices. J. Anim. Sci. 2018, 97, 472–484. [Google Scholar] [CrossRef]
- FAO. Environmental Performance of Pig Supply Chains: Guidelines for Assessment (Version 1). Livestock Environmental Assessment and Performance Partnership; FAO: Rome, Italy, 2018; Available online: https://www.fao.org/3/i8686en/I8686EN.pdf (accessed on 1 August 2021).
- Hauschild, M.Z.; Rosenbaum, R.K.; Olsen, S.I. . Life Cycle Assessment—Theory and Practice; Springer: Berlin/Heidelberg, Germany, 2018. [Google Scholar]
- ISO. ISO 14040 Environmental Management—Life Cycle Assessment—Principles and Framework. 2006. Available online: https://www.iso.org/standard/37456.html (accessed on 1 August 2021).
- ISO. ISO 14044, Environmental Management—Life Cycle Assessment—Requirements and Guidelines; ISO: Geneva, Switzerland, 2006. [Google Scholar]
- Wernet, G.; Bauer, C.; Steubing, B.; Reinhard, J.; Moreno-Ruiz, E.; Weidema, B. The ecoinvent database version 3 (part I): Overview and methodology. Int. J. Life Cycle Assess. 2016, 21, 1218–1230. [Google Scholar] [CrossRef]
- Durlinger, B.; Koukouna, E.; Broekema, R.; van Paassen, M.; Scholten, J. Agri-Footprint 4.0, Part 1: Methodology and Basic Principles. 2017. Available online: https://www.agri-footprint.com/wp-content/uploads/2018/03/Agri-Footprint-4.0-Part-1-Methodology-and-basic-principles-2018.pdf (accessed on 1 August 2021).
- Koch, P.; Salou, T. Agribalyse: Methodology—Version 1.3. Ademe. 2016. Available online: https://www.ademe.fr/sites/default/files/assets/documents/agribalyse_v1_3_methodology.pdf (accessed on 1 August 2021).
- European Commission. PEFCR Guidance Document—Guidance for the Development of Product Environmental Footprint Category Rules (PEFCRs), Version 6.3, December 2017. 2017. Available online: https://ec.europa.eu/environment/eussd/smgp/pdf/PEFCR_guidance_v6.3.pdf (accessed on 1 August 2021).
- FAO. Environmental Performance of Animal Feeds Supply Chains: Guidelines for Assessments. Livestock Environmental Assessment and Performance Partnership; FAO: Rome, Italy, 2016; Available online: https://www.fao.org/3/i6433e/i6433e.pdf (accessed on 1 August 2021).
- Corbala-Robles, L.; Sastafiana, W.; Van Linden, V.; Volcke, E.; Schaubroeck, T. Life cycle assessment of biological pig manure treatment versus direct land application—A trade-off story. Resour. Conserv. Recycl. 2018, 131, 86–98. [Google Scholar] [CrossRef]
- Flemish government—Department of Agriculture and Fisheries. Landbouwcijfers-Sectoroverzichten-Varkens. 2020. Available online: https://lv.vlaanderen.be/nl/voorlichting-info/publicaties-cijfers/landbouwcijfers#overzichtsrapporten (accessed on 1 August 2021).
- Danckaert, S.; Lenders, S. Waterverbruik en -Beschikbaarheid in Landbouw en Agrovoeding, Departement Landbouw en Visserij, Brussel. 2018. Available online: https://landbouwcijfers.vlaanderen.be/waterverbruik-en-beschikbaarheid-landbouw-en-agrovoeding (accessed on 1 August 2021).
- VLM Mestbank. Mestrapport 2019. 2019. Available online: https://publicaties.vlaanderen.be/view-file/38730 (accessed on 1 August 2021).
- VMM; VITO; AWAC; IBGE-BIM; IRCEL-CELINE; ECONOTEC. Belgium’s Greenhouse Gas Inventory (1990–2018) (NIR). 2020. Available online: https://climat.be/doc/nir-15-april-2020-final.pdf (accessed on 1 August 2021).
- McAuliffe, G.; Chapman, D.V.; Sage, C. A thematic review of life cycle assessment (LCA) applied to pig production. Environ. Impact Assess. Rev. 2016, 56, 12–22. [Google Scholar] [CrossRef]
- IPCC. Chapter 10: Emissions from Livestock and Manure Management. IPCC Guidelines for National Greenhouse Gas Inventories. 2006. Available online: https://www.ipcc-nggip.iges.or.jp/public/2006gl/ (accessed on 1 August 2021).
- EMEP/EEA. EMEP/EEA Air Pollutant Emission Inventory Guidebook 2019, 3.B Manure Management. 2019. Available online: https://www.eea.europa.eu/publications/emep-eea-guidebook-2019 (accessed on 1 August 2021).
- S&P Global. Portworld. 2021. Available online: https://www.portworld.com/map (accessed on 1 August 2021).
- Borlix. Soybeans. 2021. Available online: www.borlix.be/soybeans (accessed on 1 August 2021).
- European Commission—Joint Research Centre. ILCD Handbook: Framework and Requirements for LCIA Models and Indicators; Publications Office of the European Union: Luxembourg, 2010. [Google Scholar] [CrossRef]
- Kikuchi, Y. Life Cycle Assessment. In Plant Factory; Elsevier BV: Amsterdam, The Netherlands, 2016; pp. 321–329. [Google Scholar]
- European Commission; Joint Research Centre; Institute for Environment and Sustainability. Characterisation Factors of the ILCD Recommended Life Cycle Impact Assessment Methods, Database and Supporting Information, First; Publications Office of the European Union: Luxembourg, 2012. [Google Scholar] [CrossRef]
- VLM Mestbank. Mestbank 2010: Voortgangrapport over Het Mestbeleid in Vlaanderen. 2010. Available online: https://www.vlaanderen.be/publicaties/mestrapport (accessed on 1 August 2021).
- Itten, R.; Frischknecht, R.; Stucki, M.; Scherrer, P.; Psi, I. Life Cycle Inventories of Electricity Mixes and Grid; Paul Scherrer Inst.: Villigen, Switzerland, 2014; pp. 1–229. [Google Scholar]
- Pexas, G.; Mackenzie, S.G.; Wallace, M.; Kyriazakis, I. Environmental impacts of housing conditions and manure management in European pig production systems through a life cycle perspective: A case study in Denmark. J. Clean. Prod. 2020, 253, 120005. [Google Scholar] [CrossRef]
- Blonk Consultants. Direct Land Use Change Assessment Tool. 2016. Available online: https://www.agri-footprint.com/wp-content/uploads/2016/06/White-paper-Direct-Land-Use-Change-Tool-version-2016.1.pdf (accessed on 1 August 2021).
- van Zanten, H.H.E.; Bikker, P.; Meerburg, B.; De Boer, I. Attributional versus consequential life cycle assessment and feed optimization: Alternative protein sources in pig diets. Int. J. Life Cycle Assess. 2018, 23, 1–11. [Google Scholar] [CrossRef] [Green Version]
- Garcia-Launay, F.; van der Werf, H.; Nguyen, T.; Le Tutour, L.; Dourmad, J. Evaluation of the environmental implications of the incorporation of feed-use amino acids in pig production using Life Cycle Assessment. Livest. Sci. 2014, 161, 158–175. [Google Scholar] [CrossRef]
- Ogino, A.; Osada, T.; Takada, R.; Takagi, T.; Tsujimoto, S.; Tonoue, T.; Matsui, D.; Katsumata, M.; Yamashita, T.; Tanaka, Y. Life cycle assessment of Japanese pig farming using low-protein diet supplemented with amino acids. Soil Sci. Plant Nutr. 2013, 59, 107–118. [Google Scholar] [CrossRef]
- European Commission. Environmental Factsheet: Amino Acids. 2014. Available online: https://ec.europa.eu/jrc/sites/default/files/QMS_H08_BISO_D.8_BISO-EnvSust-Bioproducts-Amino-Acids_150513.pdf (accessed on 1 August 2021).
- Marinussen, M.; Kool, A. Environmental Impacts of Synthetic Amino Acid Production; Blonk Milieu Advies: Gouda, The Netherlands, 2010. [Google Scholar]
- Salemdeeb, R.; zu Ermgassen, E.K.; Kim, M.H.; Balmford, A.; Al-Tabbaa, A. Environmental and health impacts of using food waste as animal feed: A comparative analysis of food waste management options. J. Clean. Prod. 2017, 140, 871–880. [Google Scholar] [CrossRef] [Green Version]
- Boonen, R.; Aerts, S.; Meganck, M.; De Tavernier, J.; Lips, D.; Decuypere, E. Feed efficiencies in animal production: A non-numerical analysis. In Climate Change and Sustainable Development; Wageningen Academic Publishers: Wageningen, The Netherlands, 2012; pp. 196–201. [Google Scholar]
- Vrolijk, H.C.J.; de Bont, C.J.A.M.; van der Veen, H.B.; Wisman, J.H.; Poppe, K.J.; Volatility of Farm Incomes, Prices and Yields in the European Union. The Hague. 2009. Available online: https://edepot.wur.nl/11973 (accessed on 1 August 2021).
- Maes, D.; Vancauteren, M.; Van Passel, S. Correction to: Investigating market power in the Belgian pork production chain. Rev. Agric. Food Environ. Stud. 2019, 100, 119. [Google Scholar] [CrossRef] [Green Version]
- Asselin-Balençon, A.; Broekema, R.; Teulon, H.; Gastaldi, G.; Houssier, J.; Moutia, A. Agribalyse 3.0: The French Agricultural and Food LCI Database. Methodology for the Food Products. 2020. Available online: https://doc.agribalyse.fr/documentation-en/agribalyse-data/documentation/ (accessed on 1 August 2021).
- De Vries, J.W.; Melse, R. Comparing environmental impact of air scrubbers for ammonia abatement at pig houses: A life cycle assessment. Biosyst. Eng. 2017, 161, 53–61. [Google Scholar] [CrossRef]
- Scherer, L.; Tomasik, B.; Rueda, O.; Pfister, S. Framework for integrating animal welfare into life cycle sustainability assessment. Int. J. Life Cycle Assess. 2018, 23, 1476–1490. [Google Scholar] [CrossRef] [PubMed] [Green Version]


Publisher’s Note: MDPI stays neutral with regard to jurisdictional claims in published maps and institutional affiliations. |
© 2021 by the authors. Licensee MDPI, Basel, Switzerland. This article is an open access article distributed under the terms and conditions of the Creative Commons Attribution (CC BY) license (https://creativecommons.org/licenses/by/4.0/).