
Efficient Energy Optimization Day-Ahead Energy Forecasting in Smart Grid Considering Demand Response and Microgrids


 ,
,  ,
,
Abstract
:1. Introduction
- An efficient energy management scheme is proposed, which considers the RTP curve with variations that systematically schedule appliance operation and charging/discharging of EVs to maintain a balance between energy supply and demand.
- Ant colony optimization (ACO) algorithm is adapted, which takes into account constraints, occupant energy consumption pattern, users priorities, and uncertainties in the presence of RTP to schedule load and EVs charging/discharging for efficient energy management.
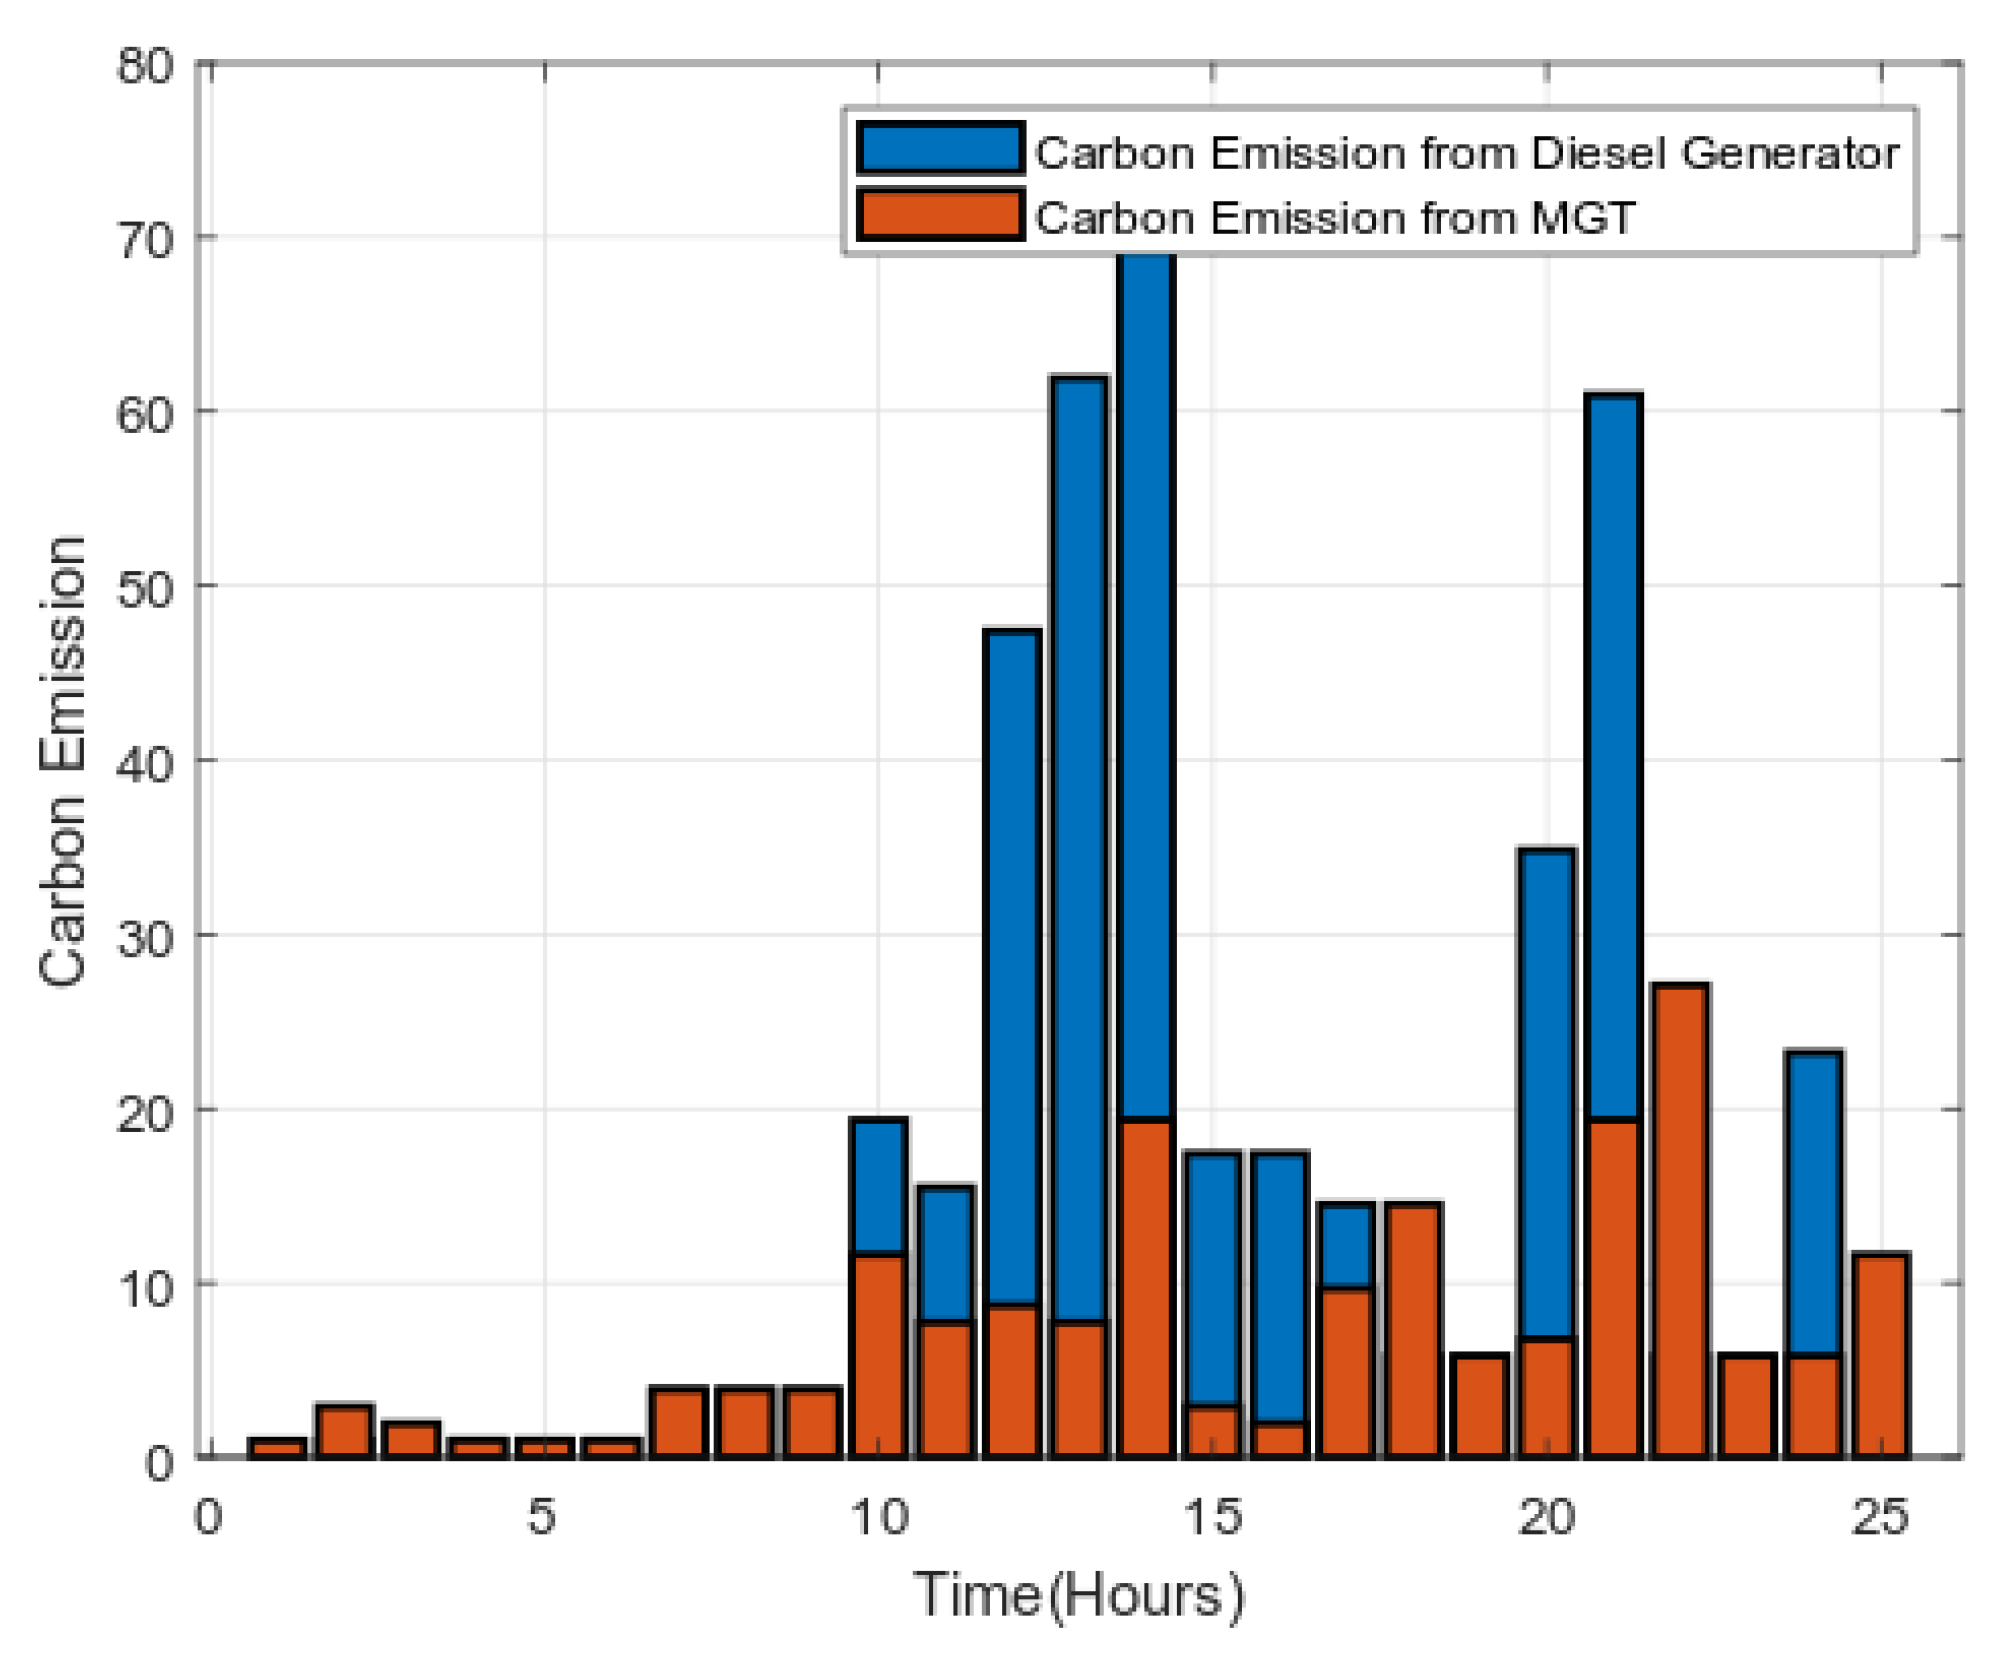
- Adapted ACO algorithm successfully solves the presented problem, allowing a high monetary reduction in the energy cost paid by consumers, alleviating the peak formation in electricity demand, minimizing carbon emission, and improving the comfort of the users.
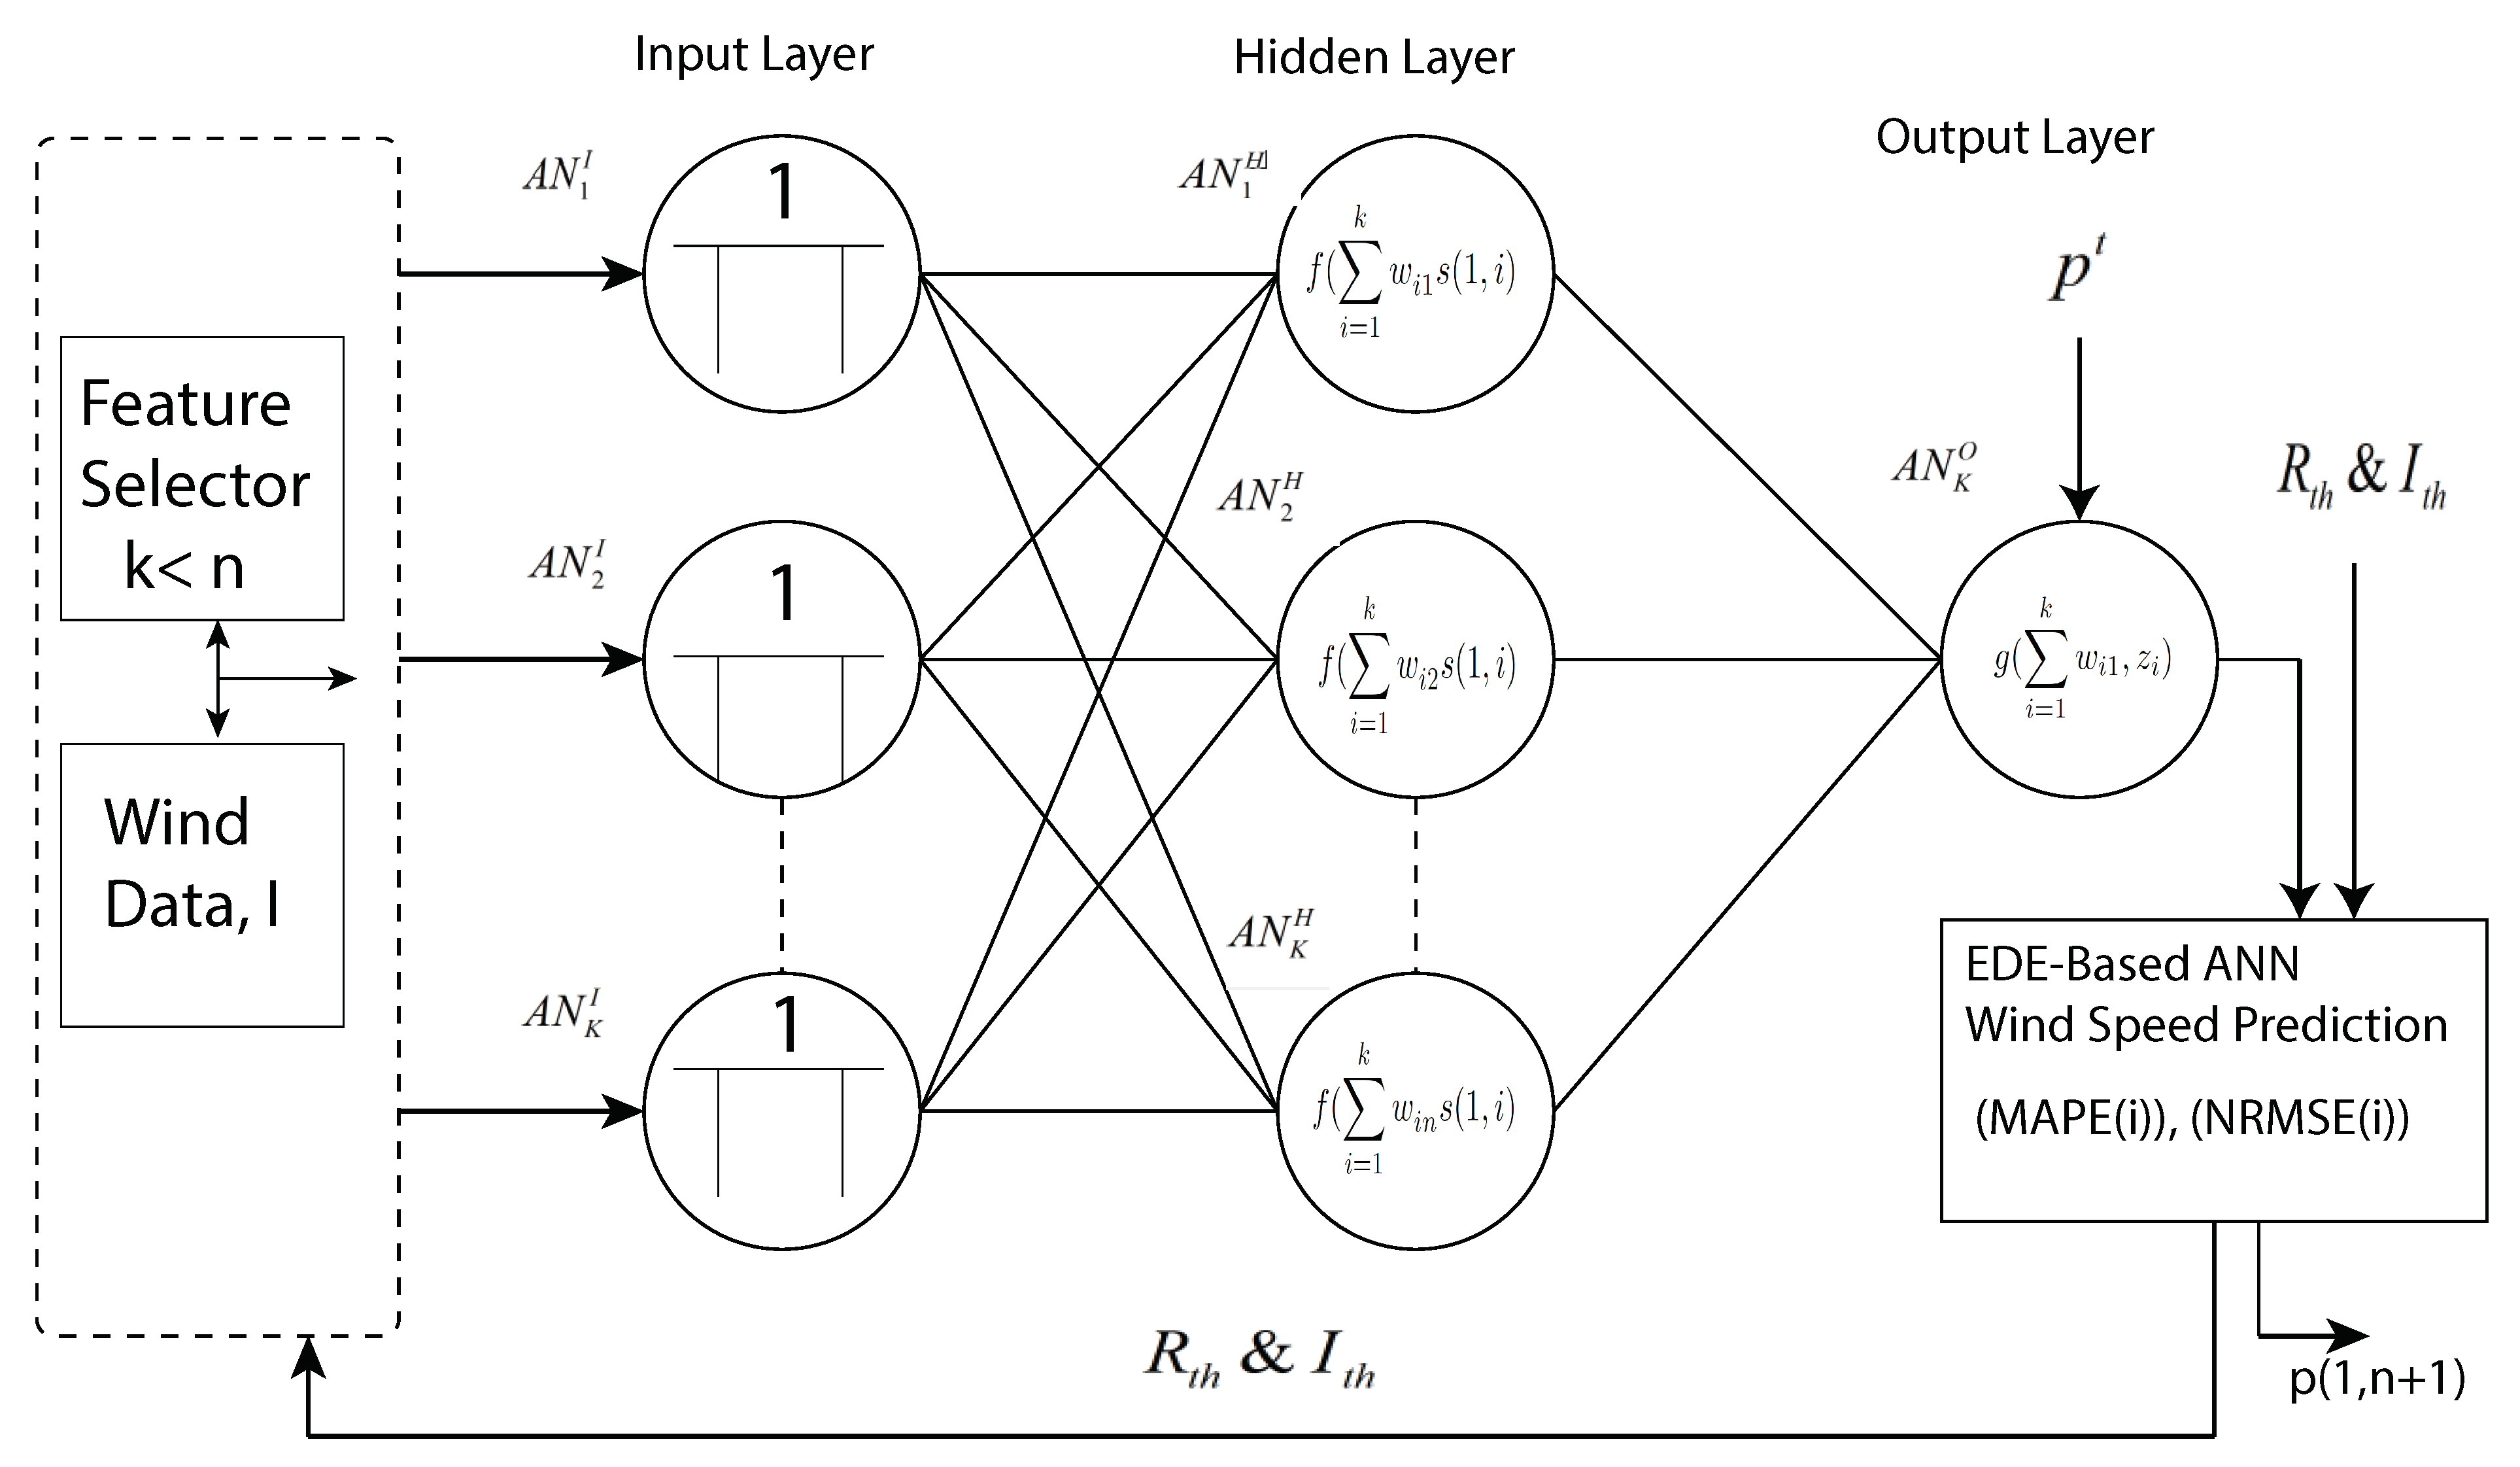
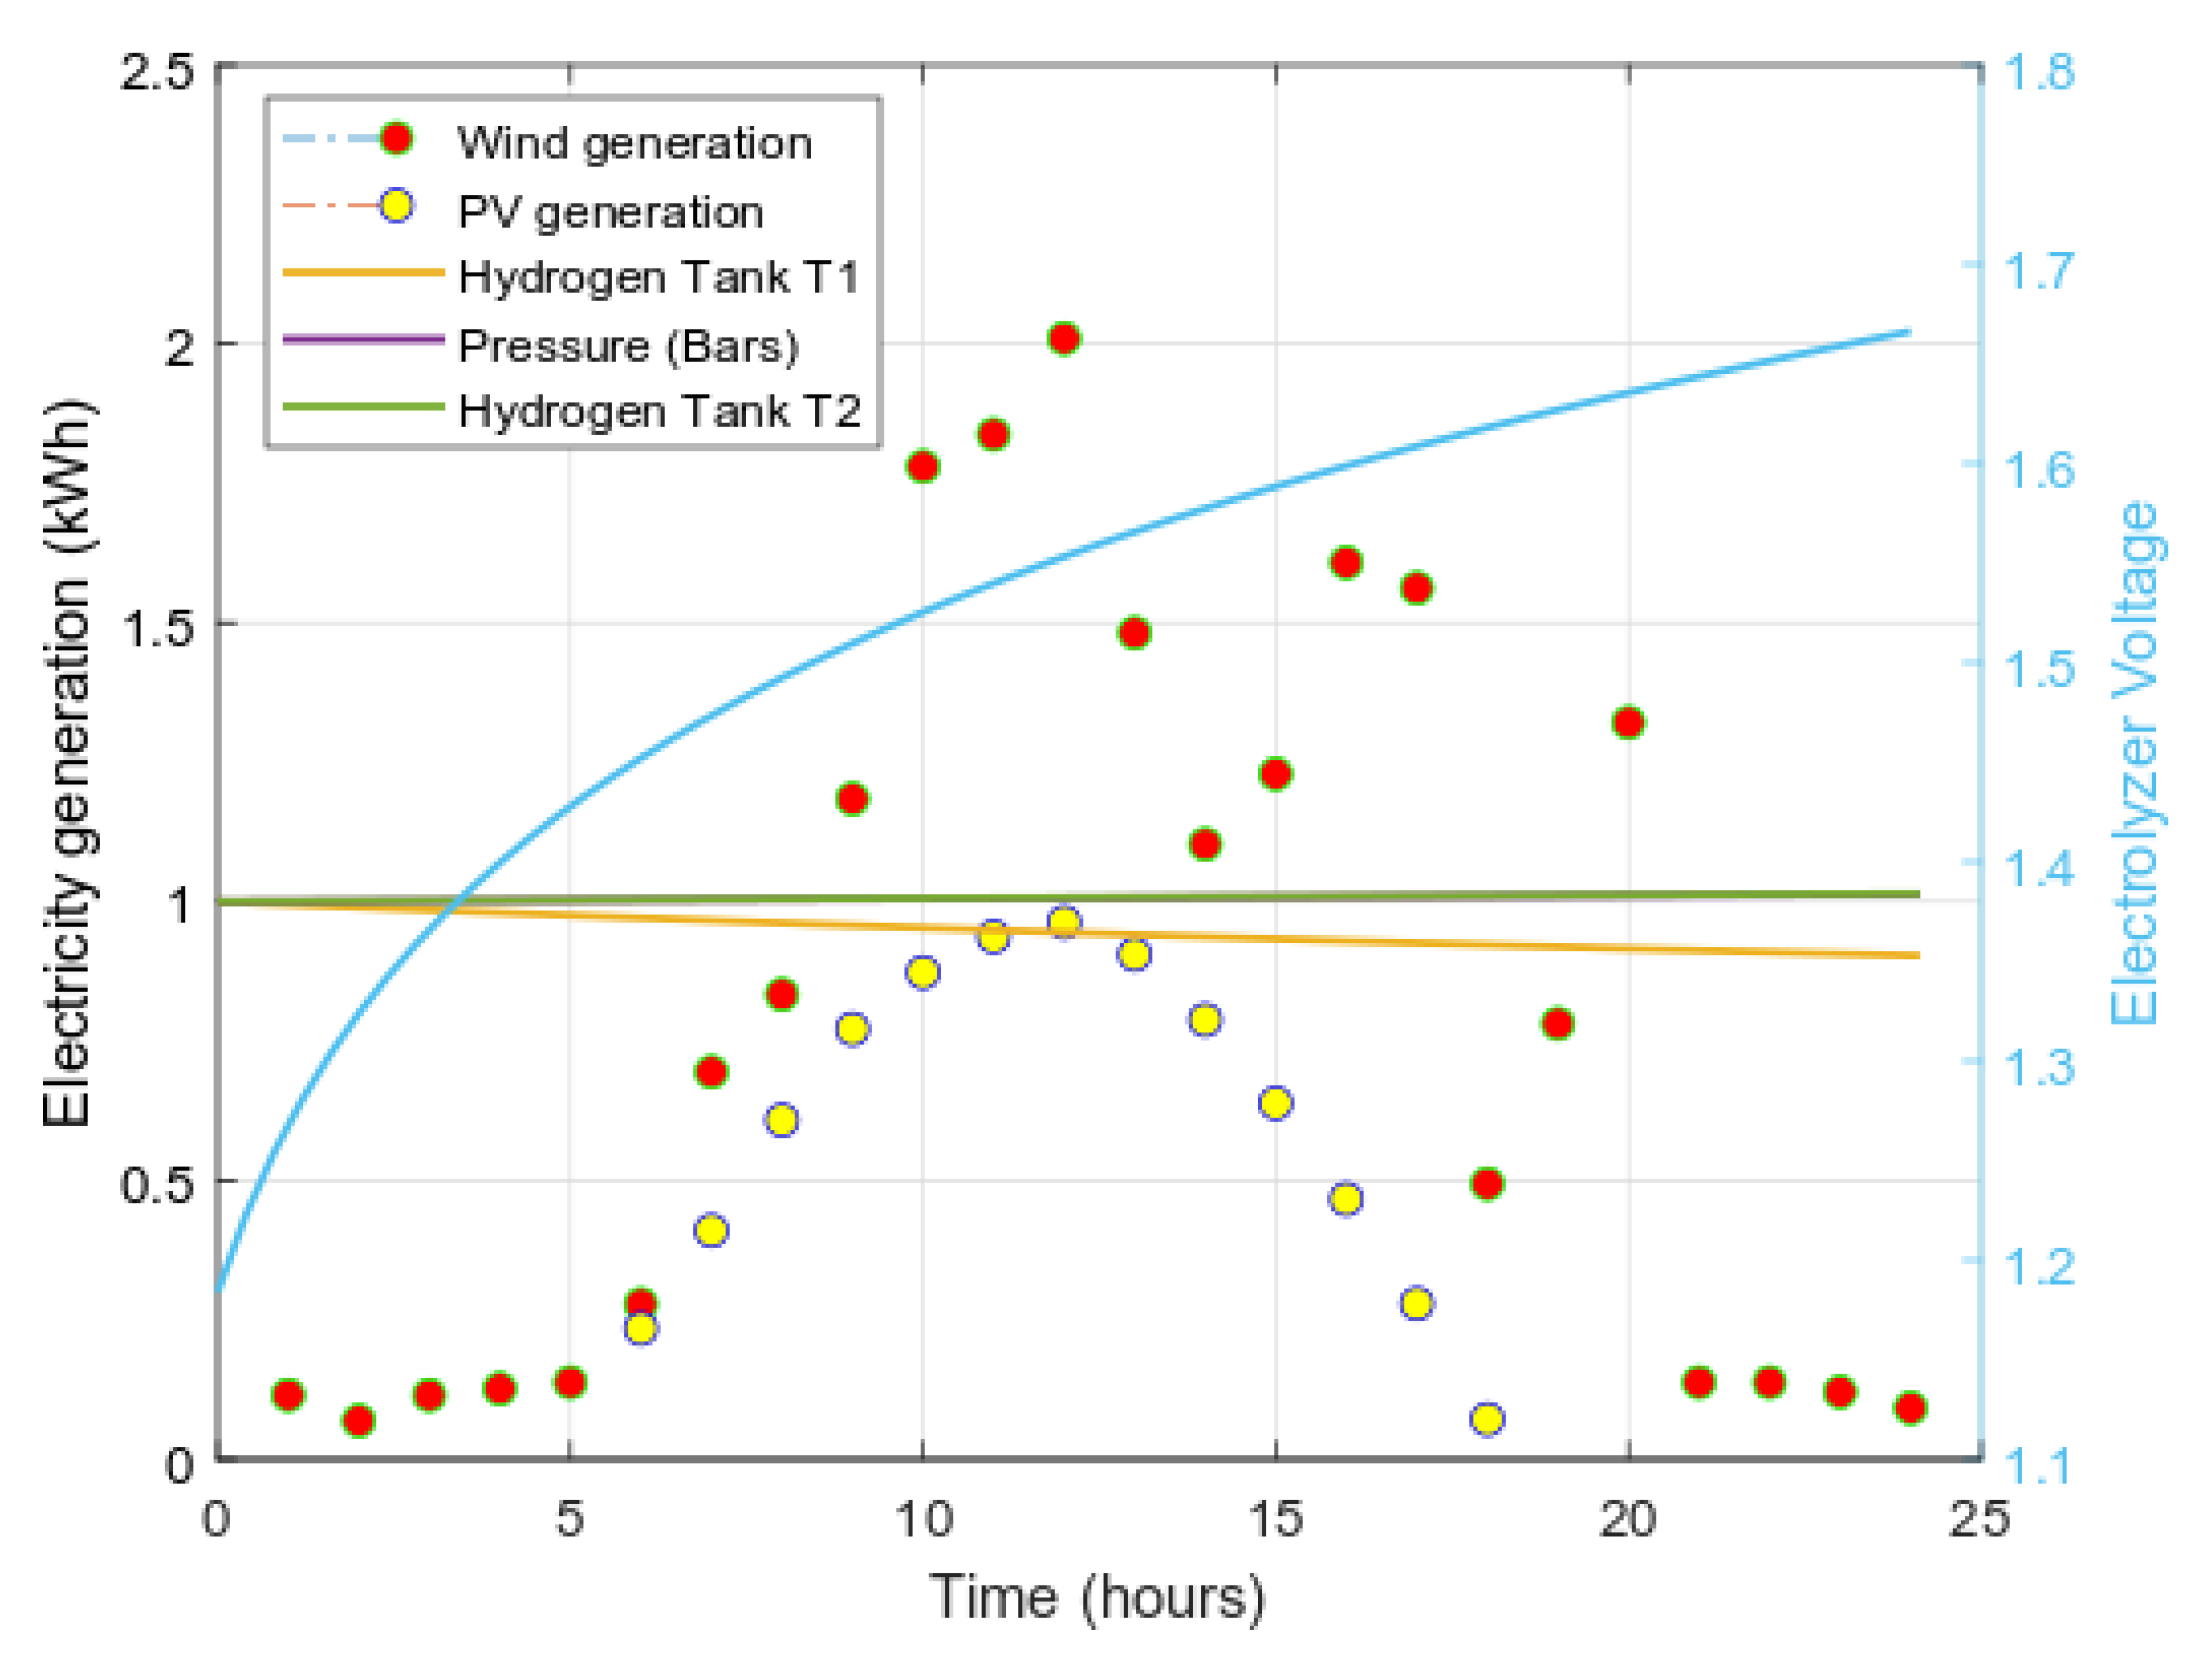
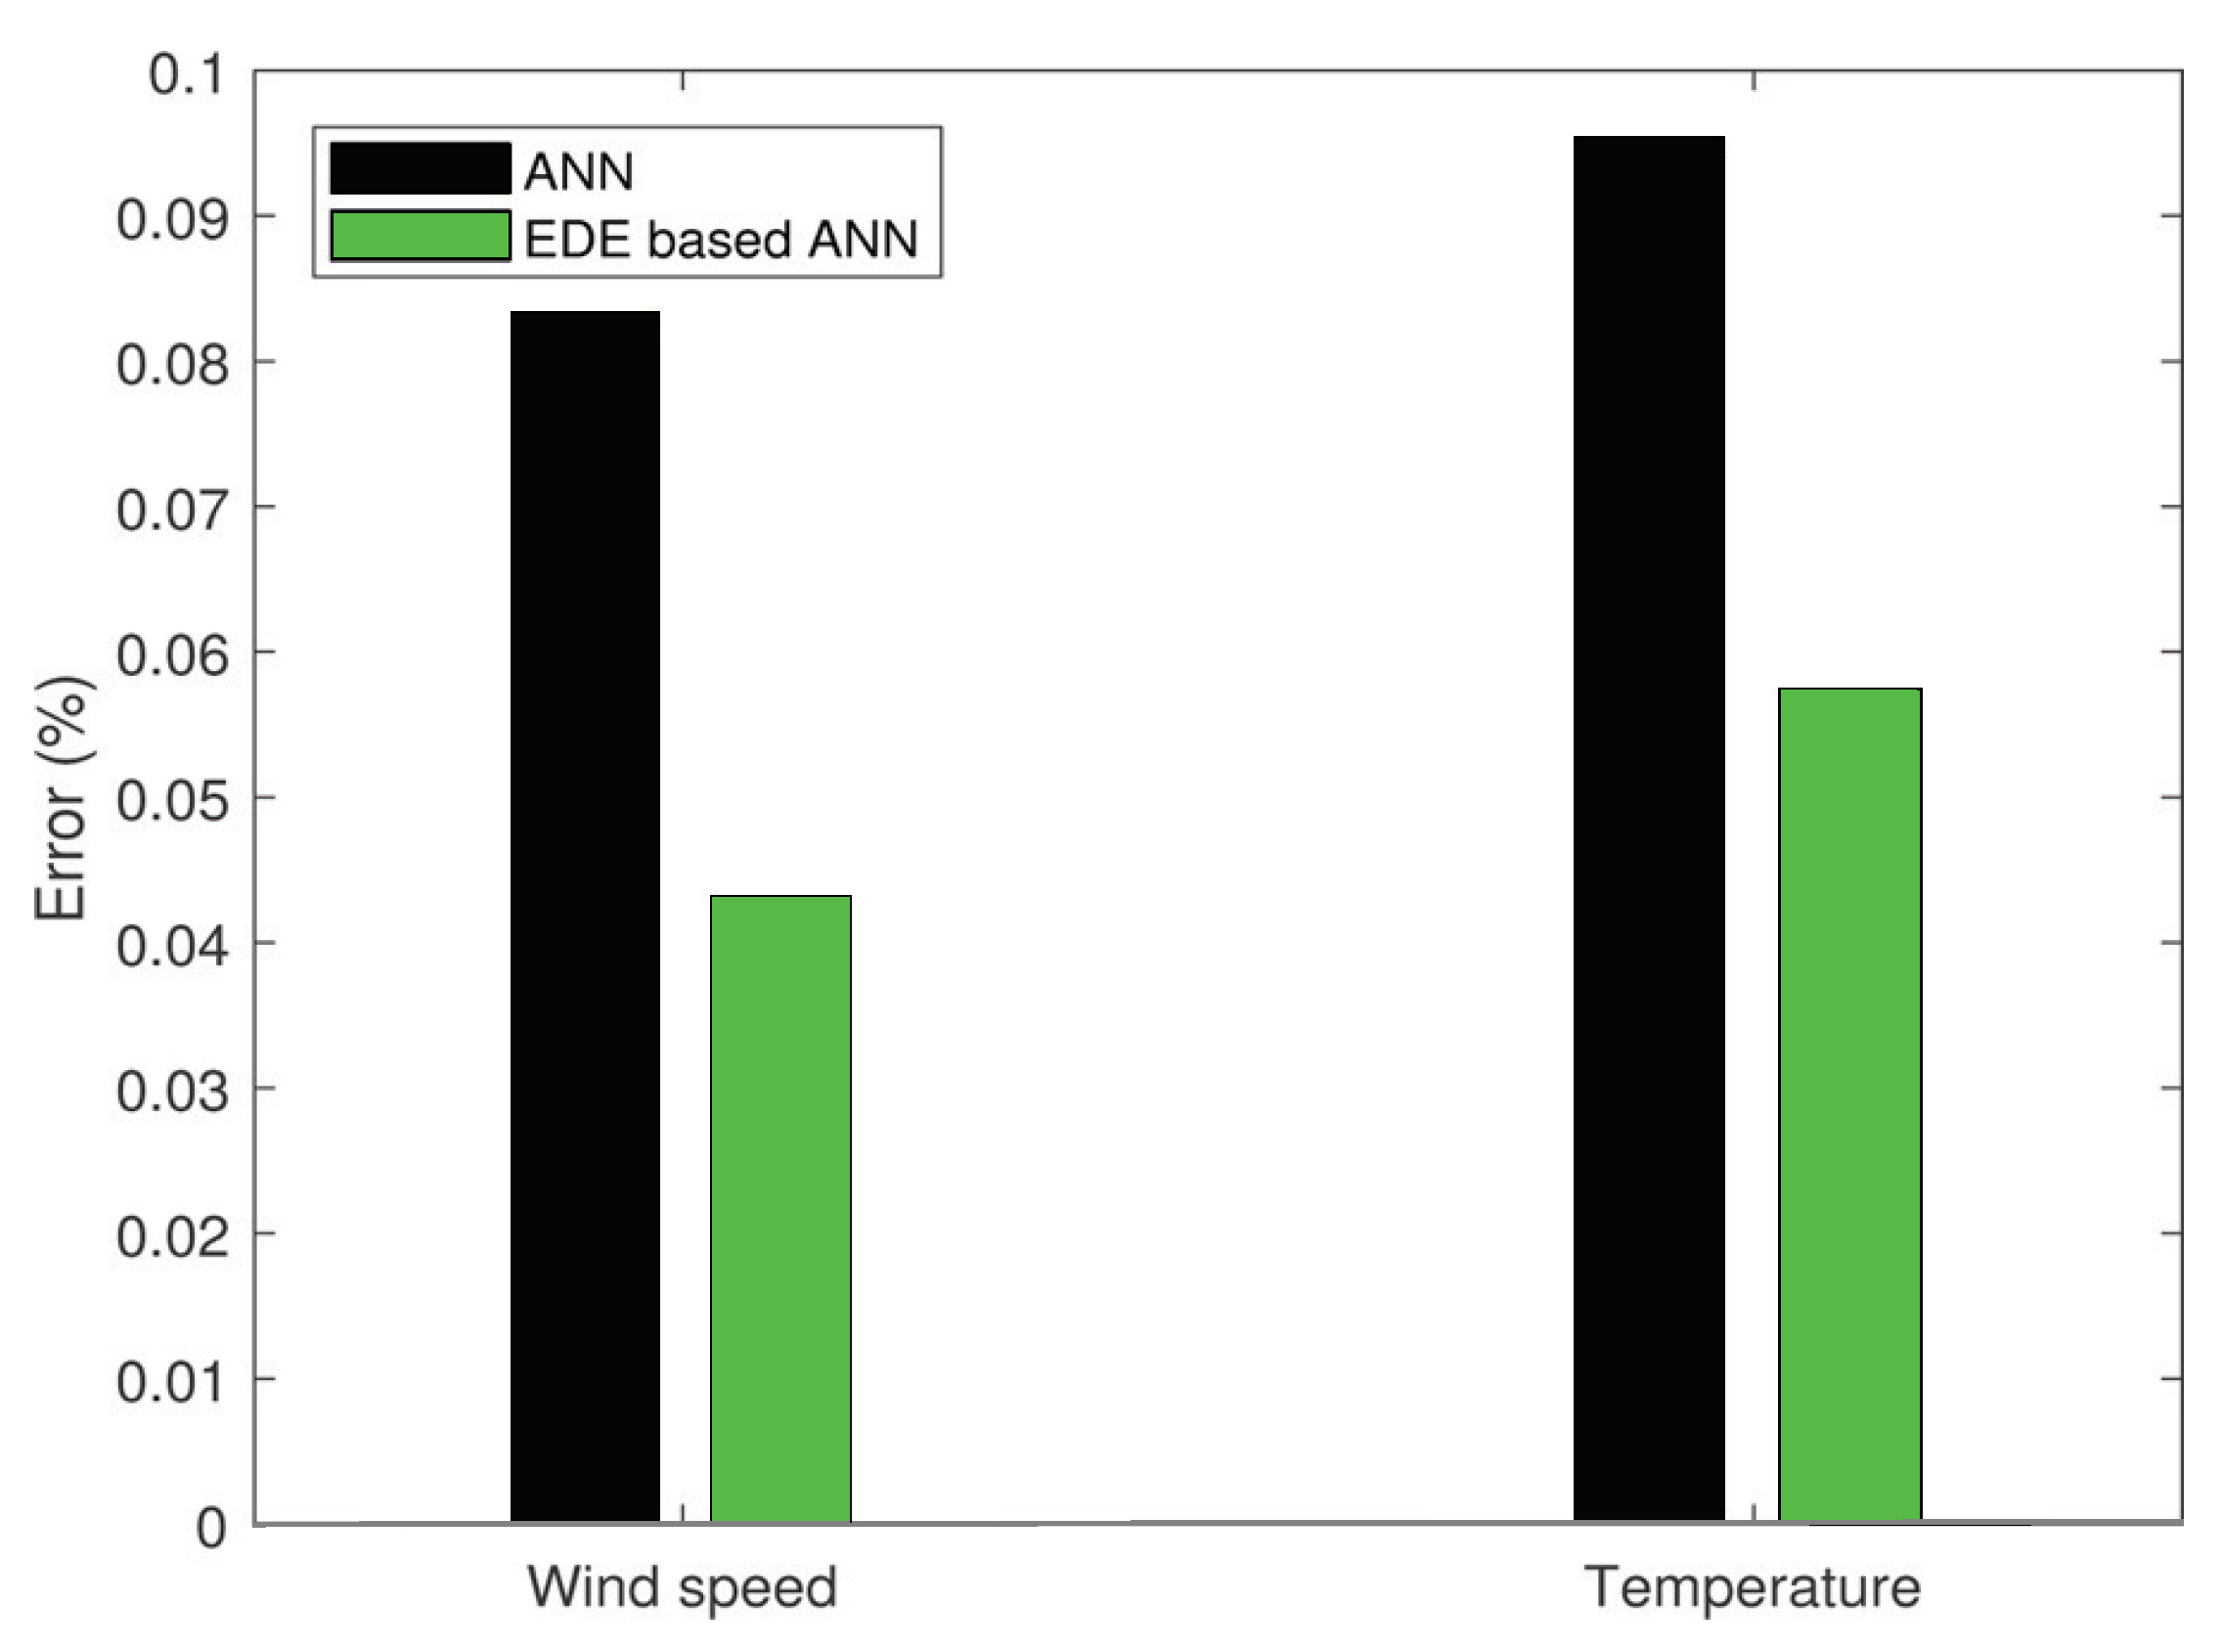
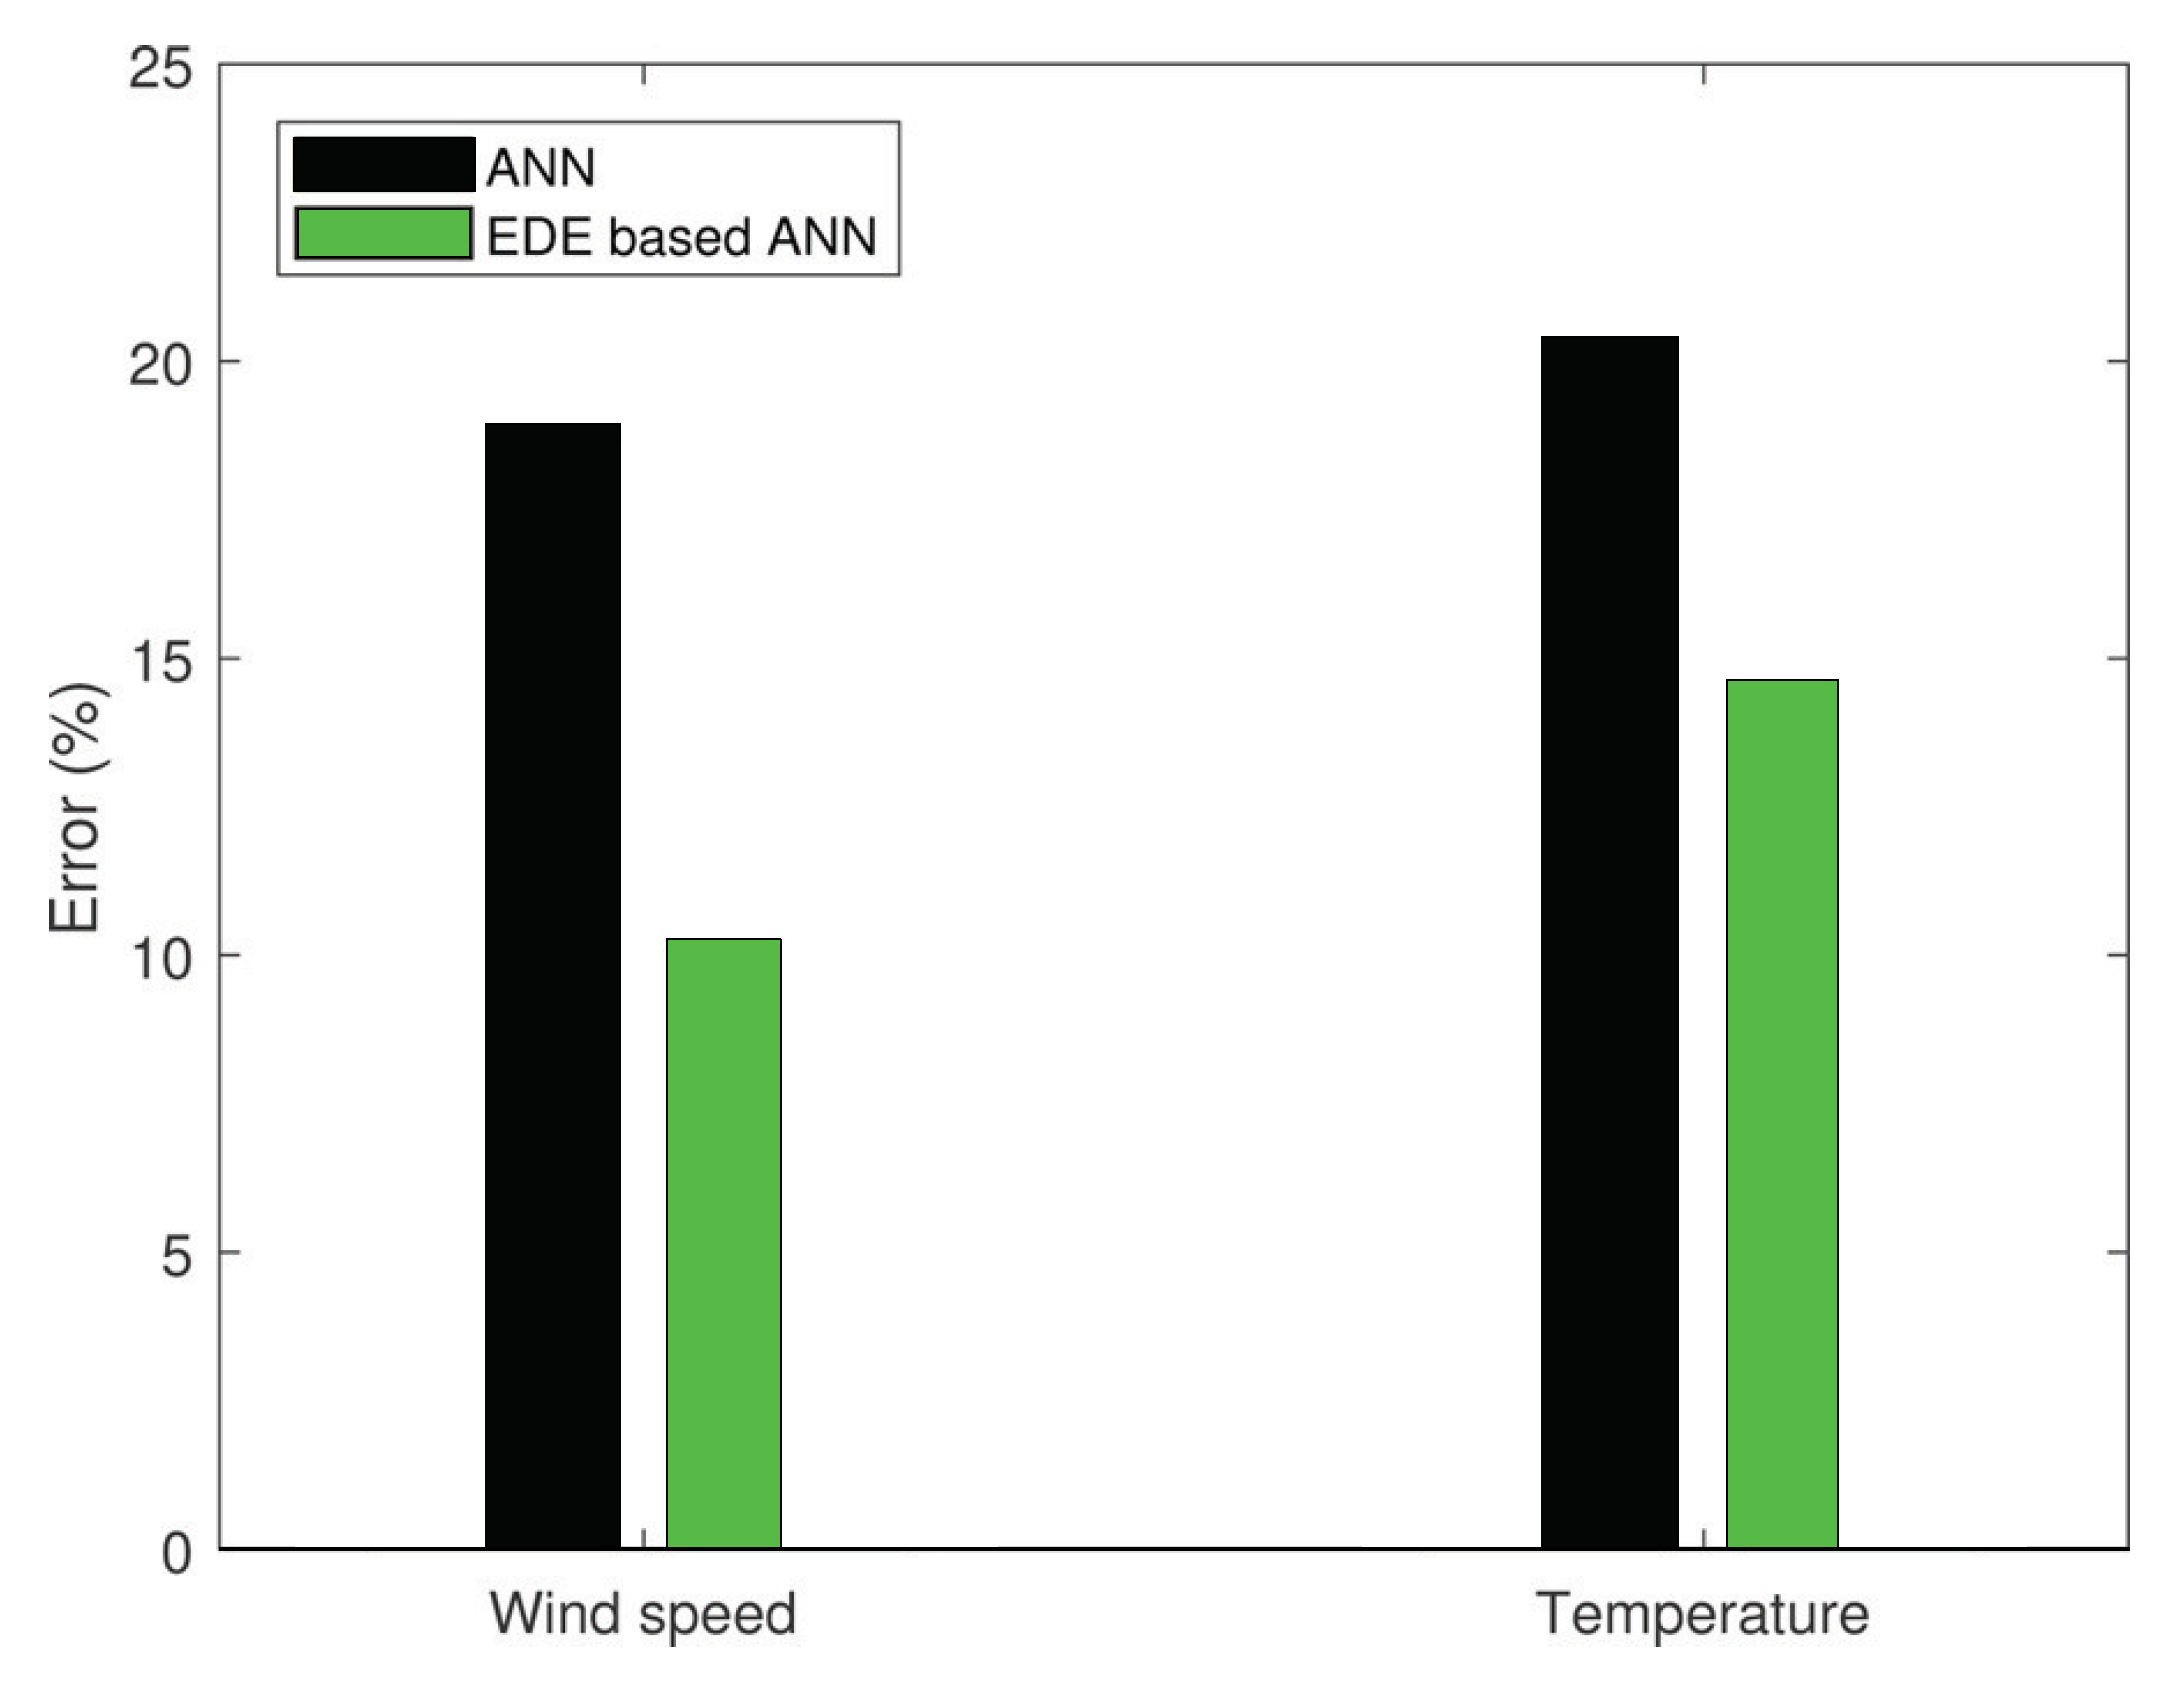
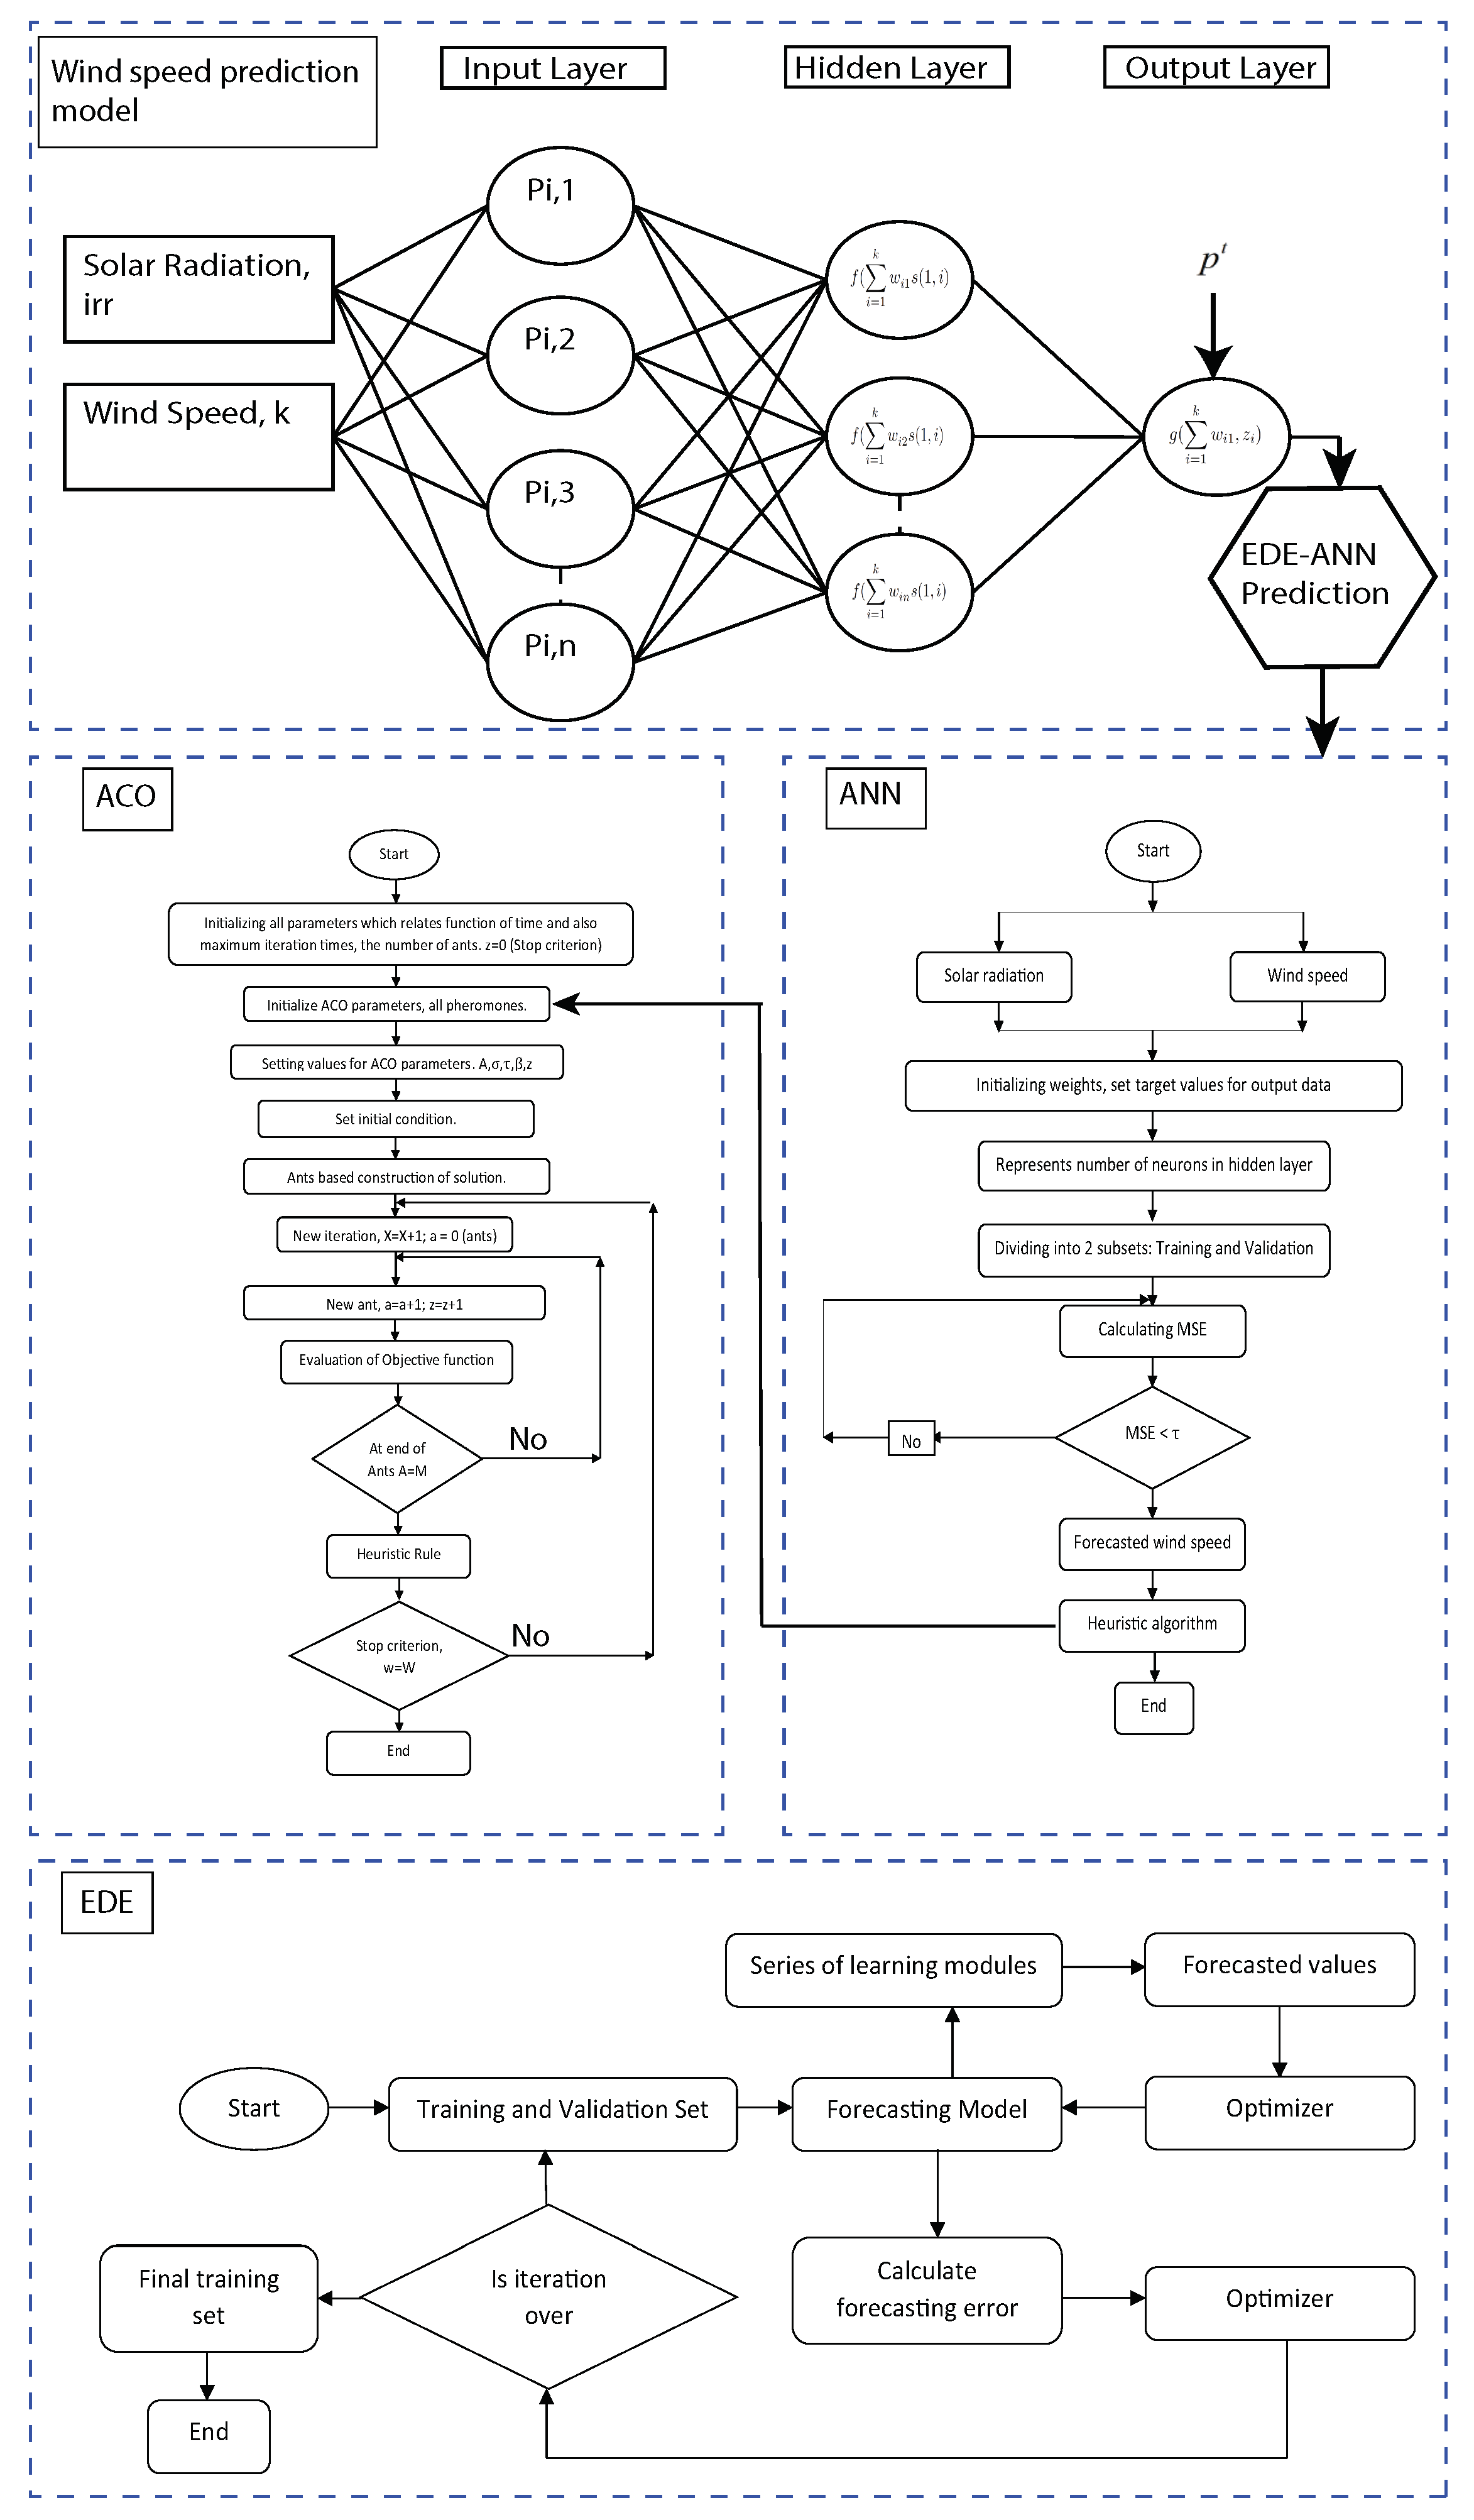
- For efficient energy management, an accurate forecast model ANN based on mEDE (ANN-mEDE) is developed to forecast a generation profile of microgrid using weather information and mathematical models of the WT and PV.
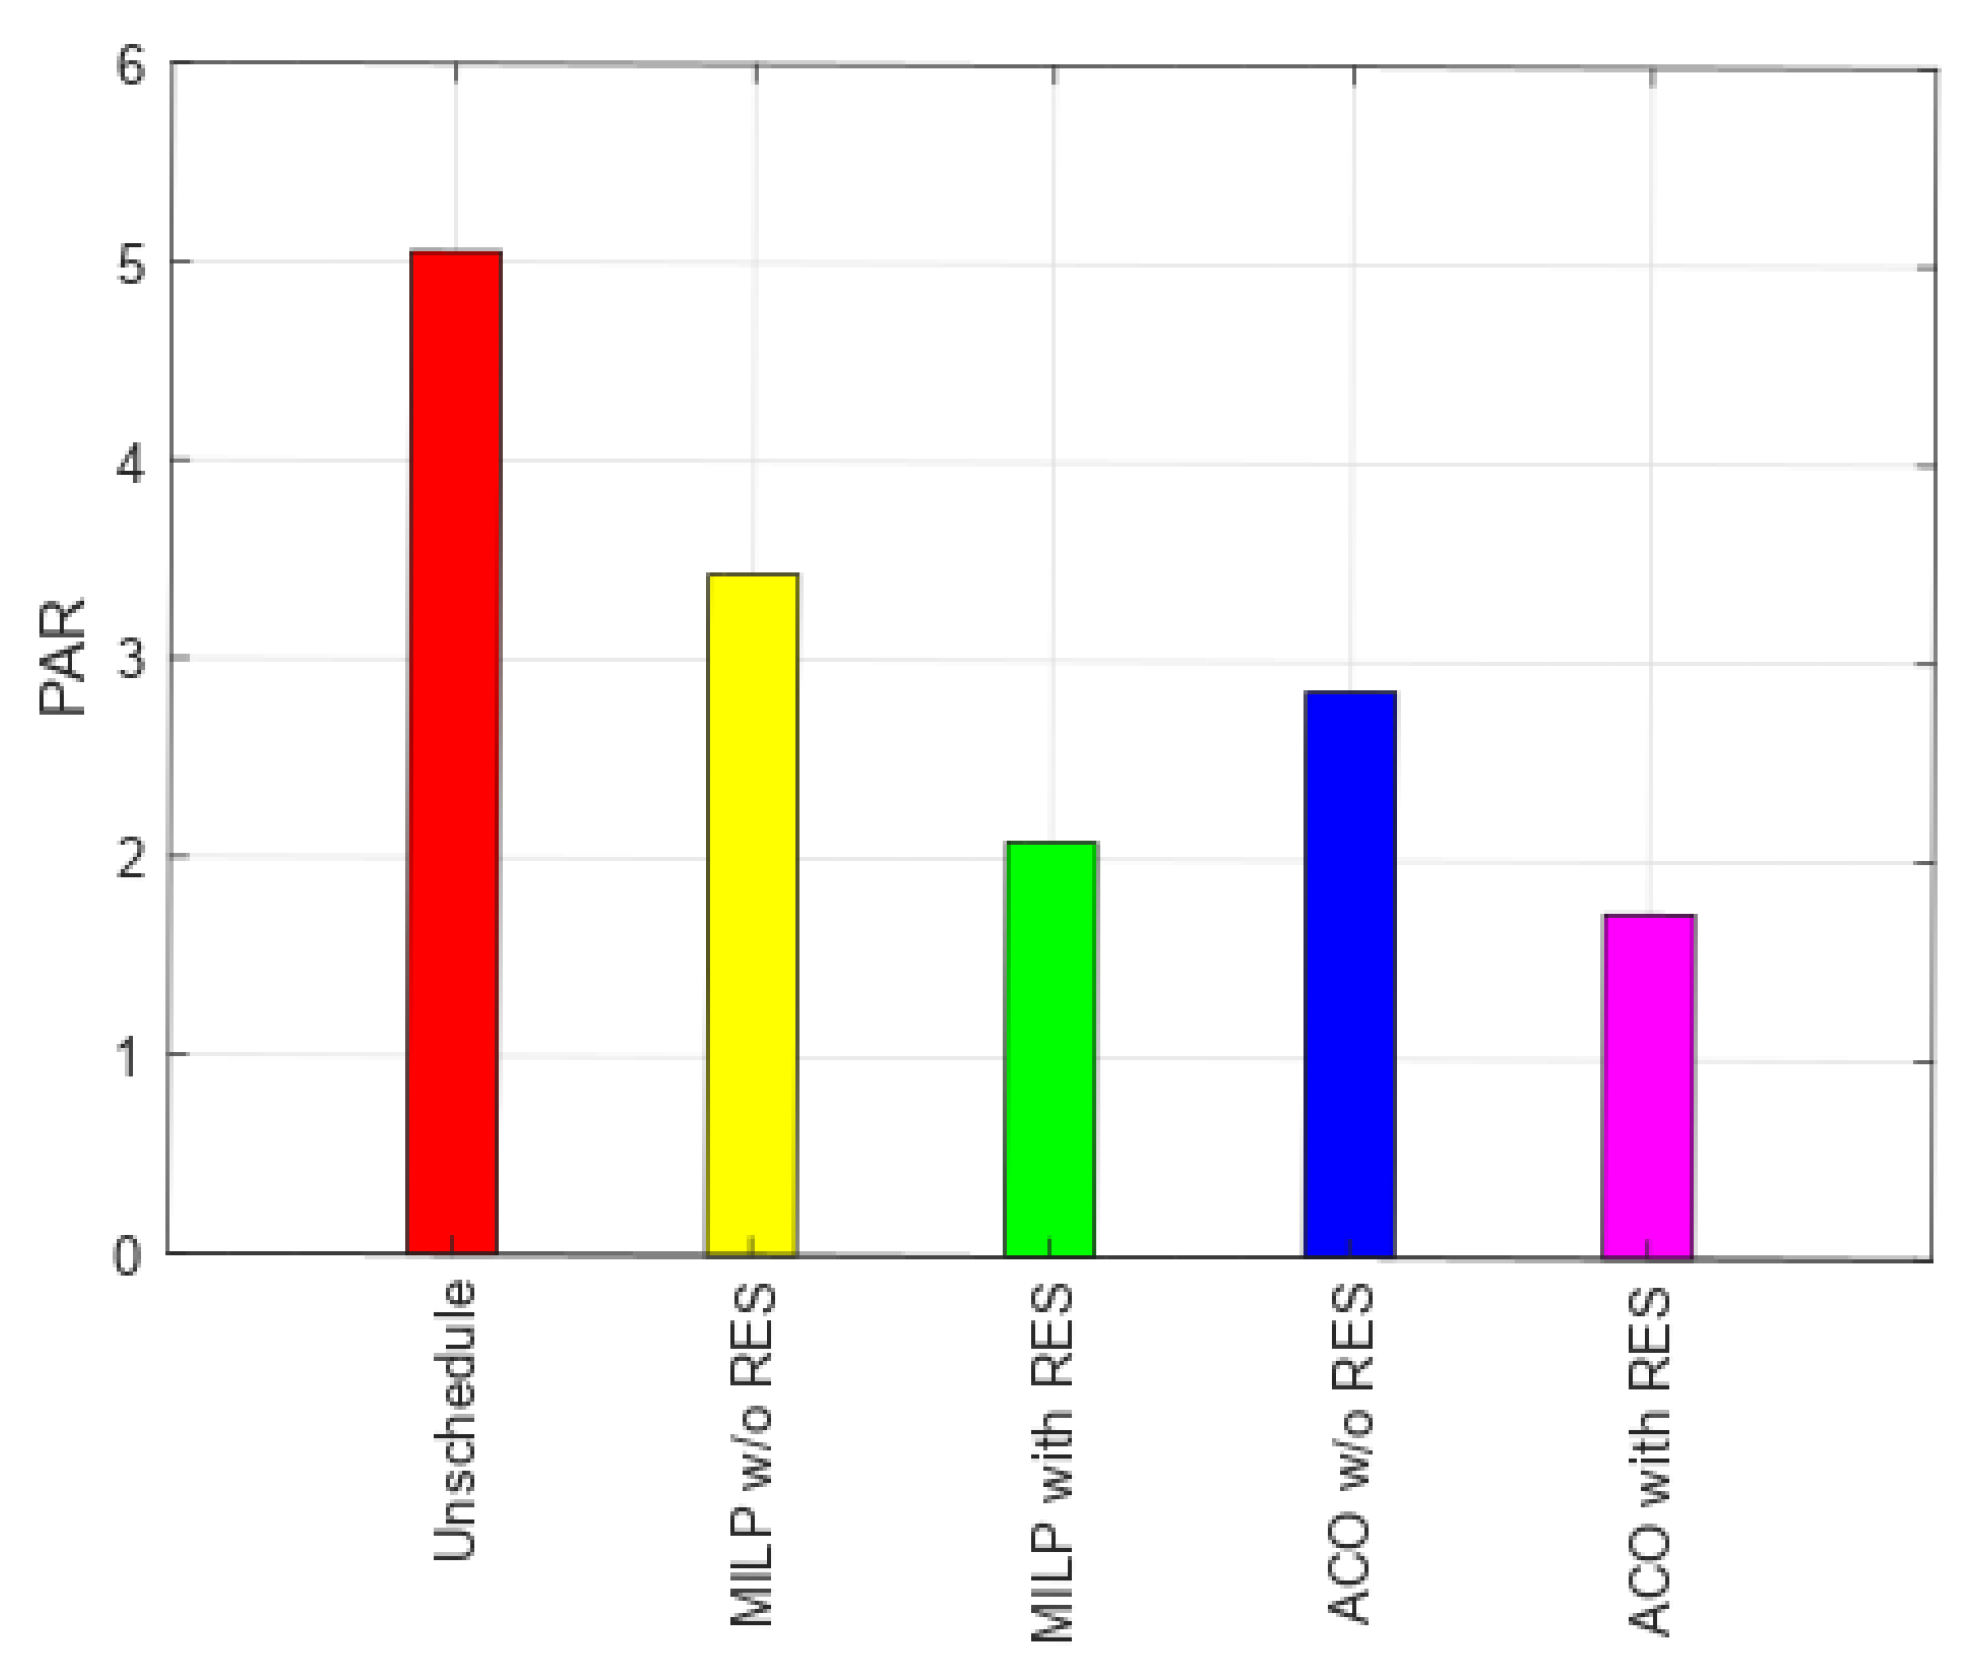
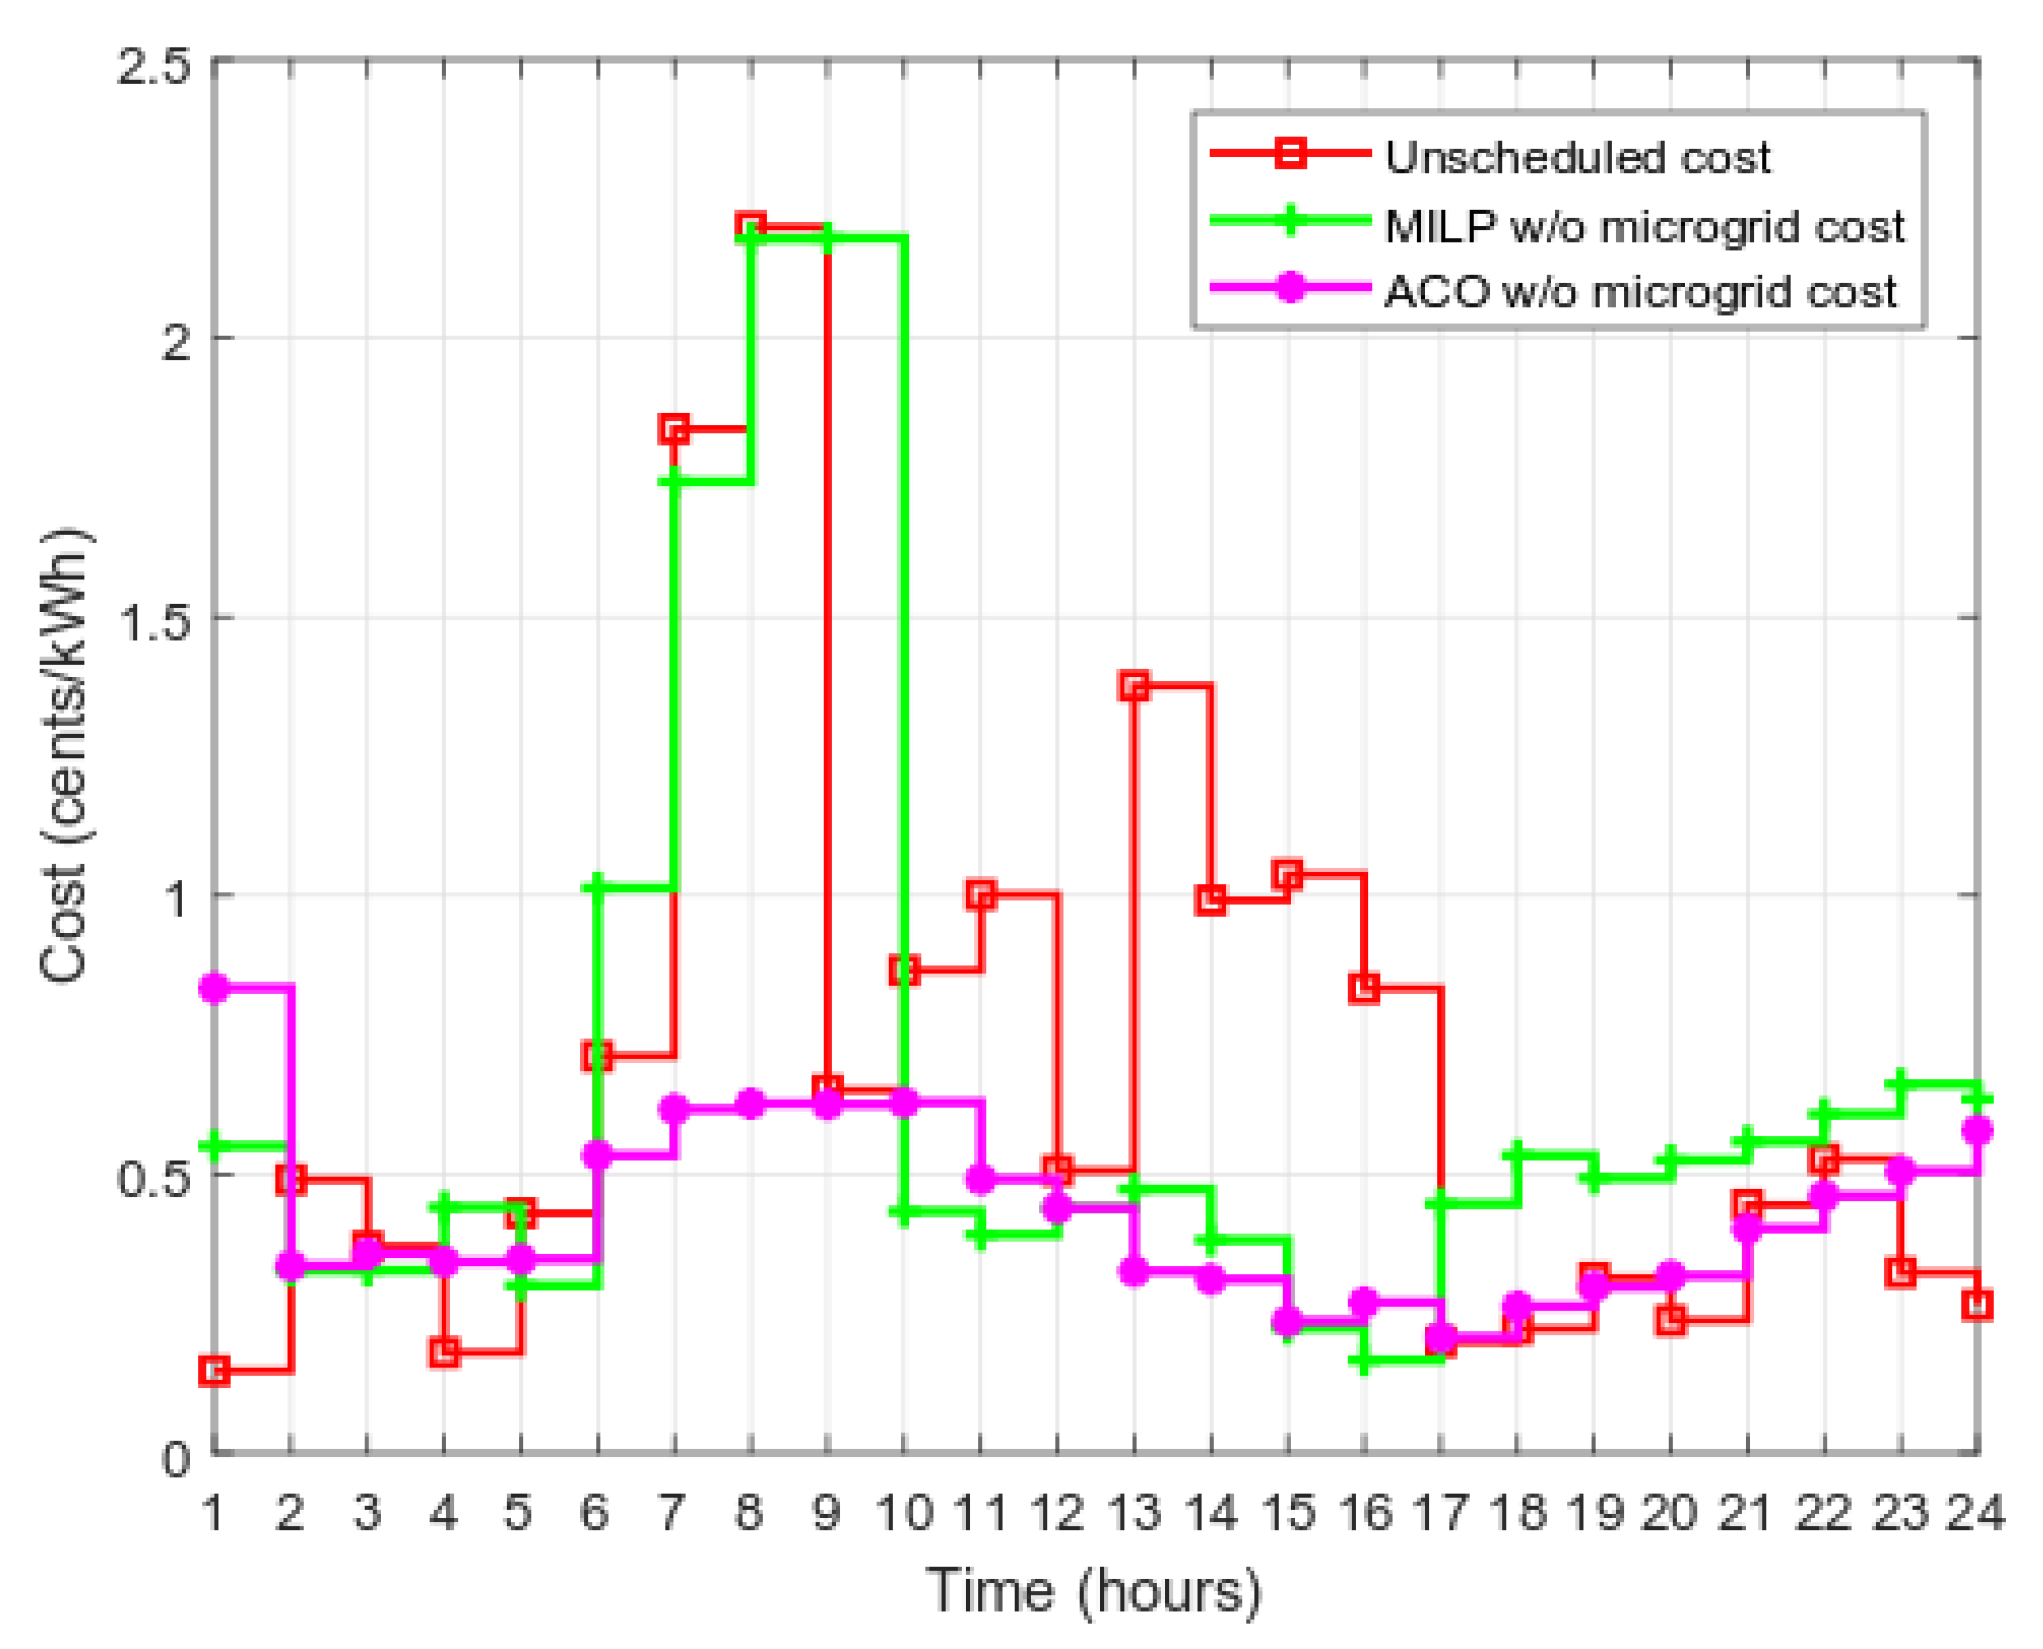
- Simulation results demonstrate that the newly devised scheme based on the ACO technique is effective, which considerably reduces the consumer’s cost, PAR, and peak electricity demand reduction in the commercial grid.
2. Related Work
2.1. Mathematical Techniques
2.2. Controller-Based Methods
2.3. Stochastic Techniques
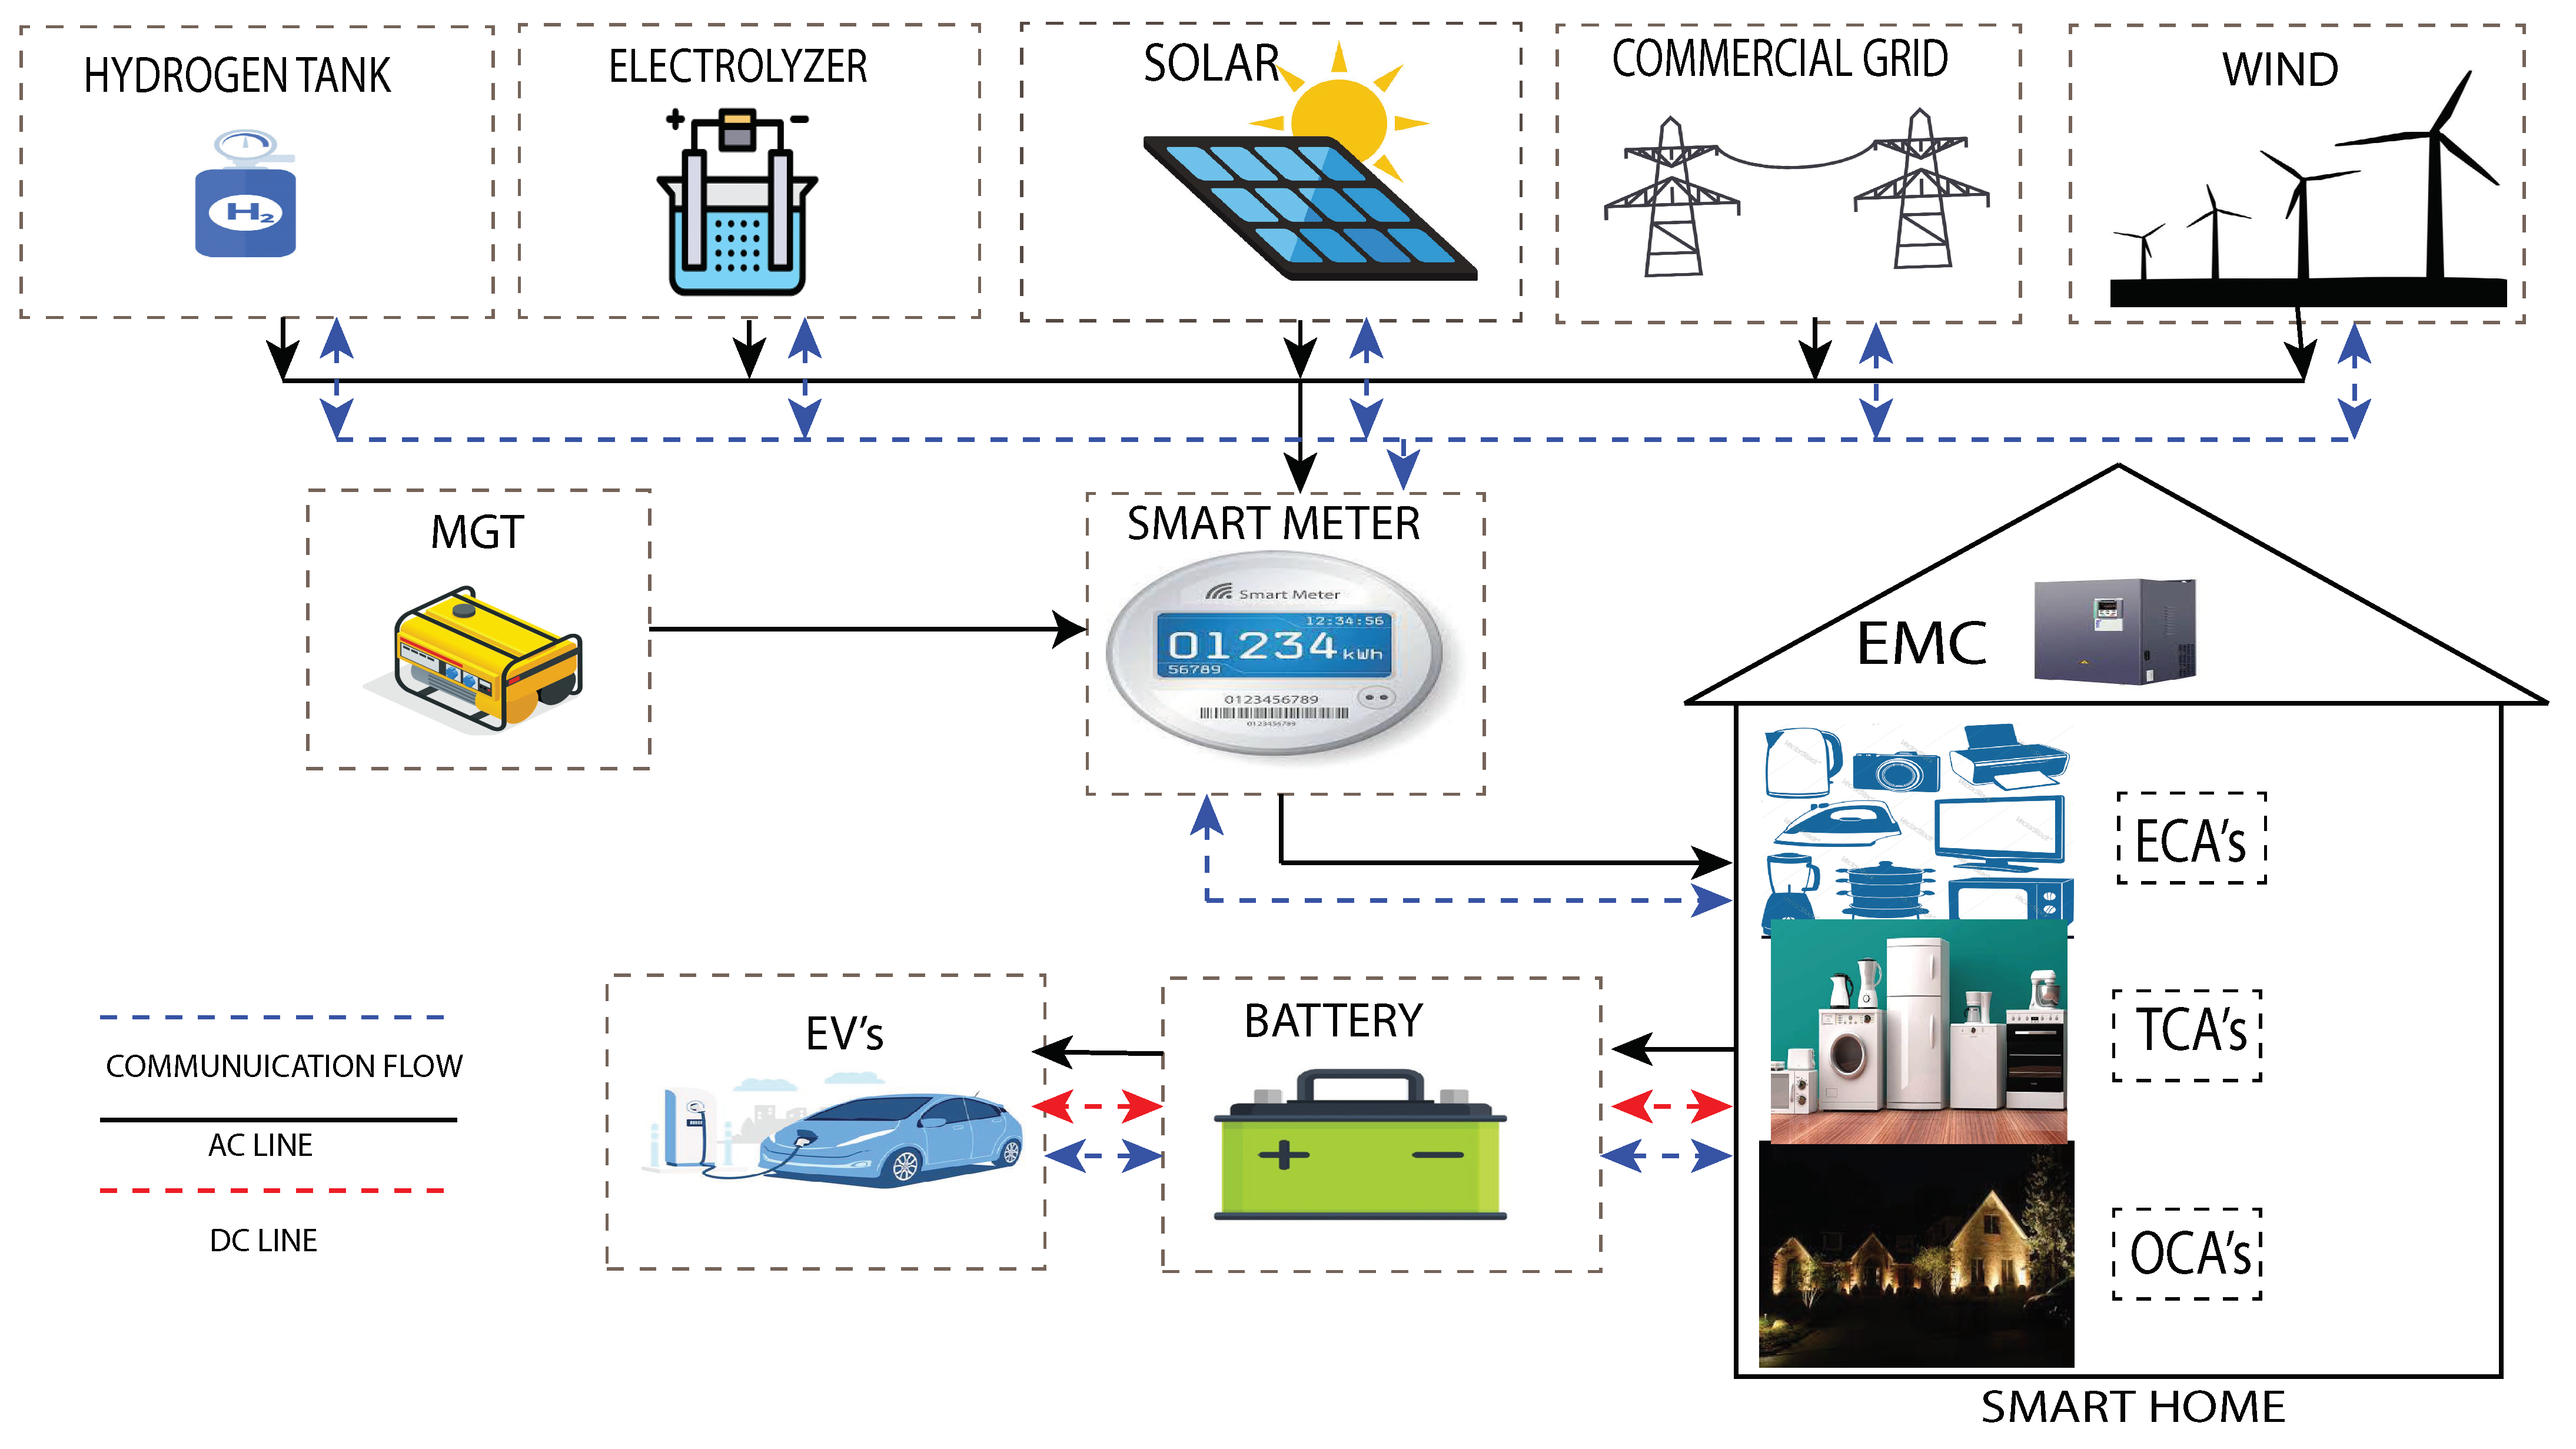
3. Framework of Efficient Energy Management System
3.1. System Model
3.2. Energy Generation Prediction Model
4. Mathematical Modeling
4.1. Modeling of Appliances Operating within Smart Home
4.1.1. Scheduling of ECA
4.1.2. Scheduling of TCA
4.1.3. Scheduling of OCA
4.2. Microgrid
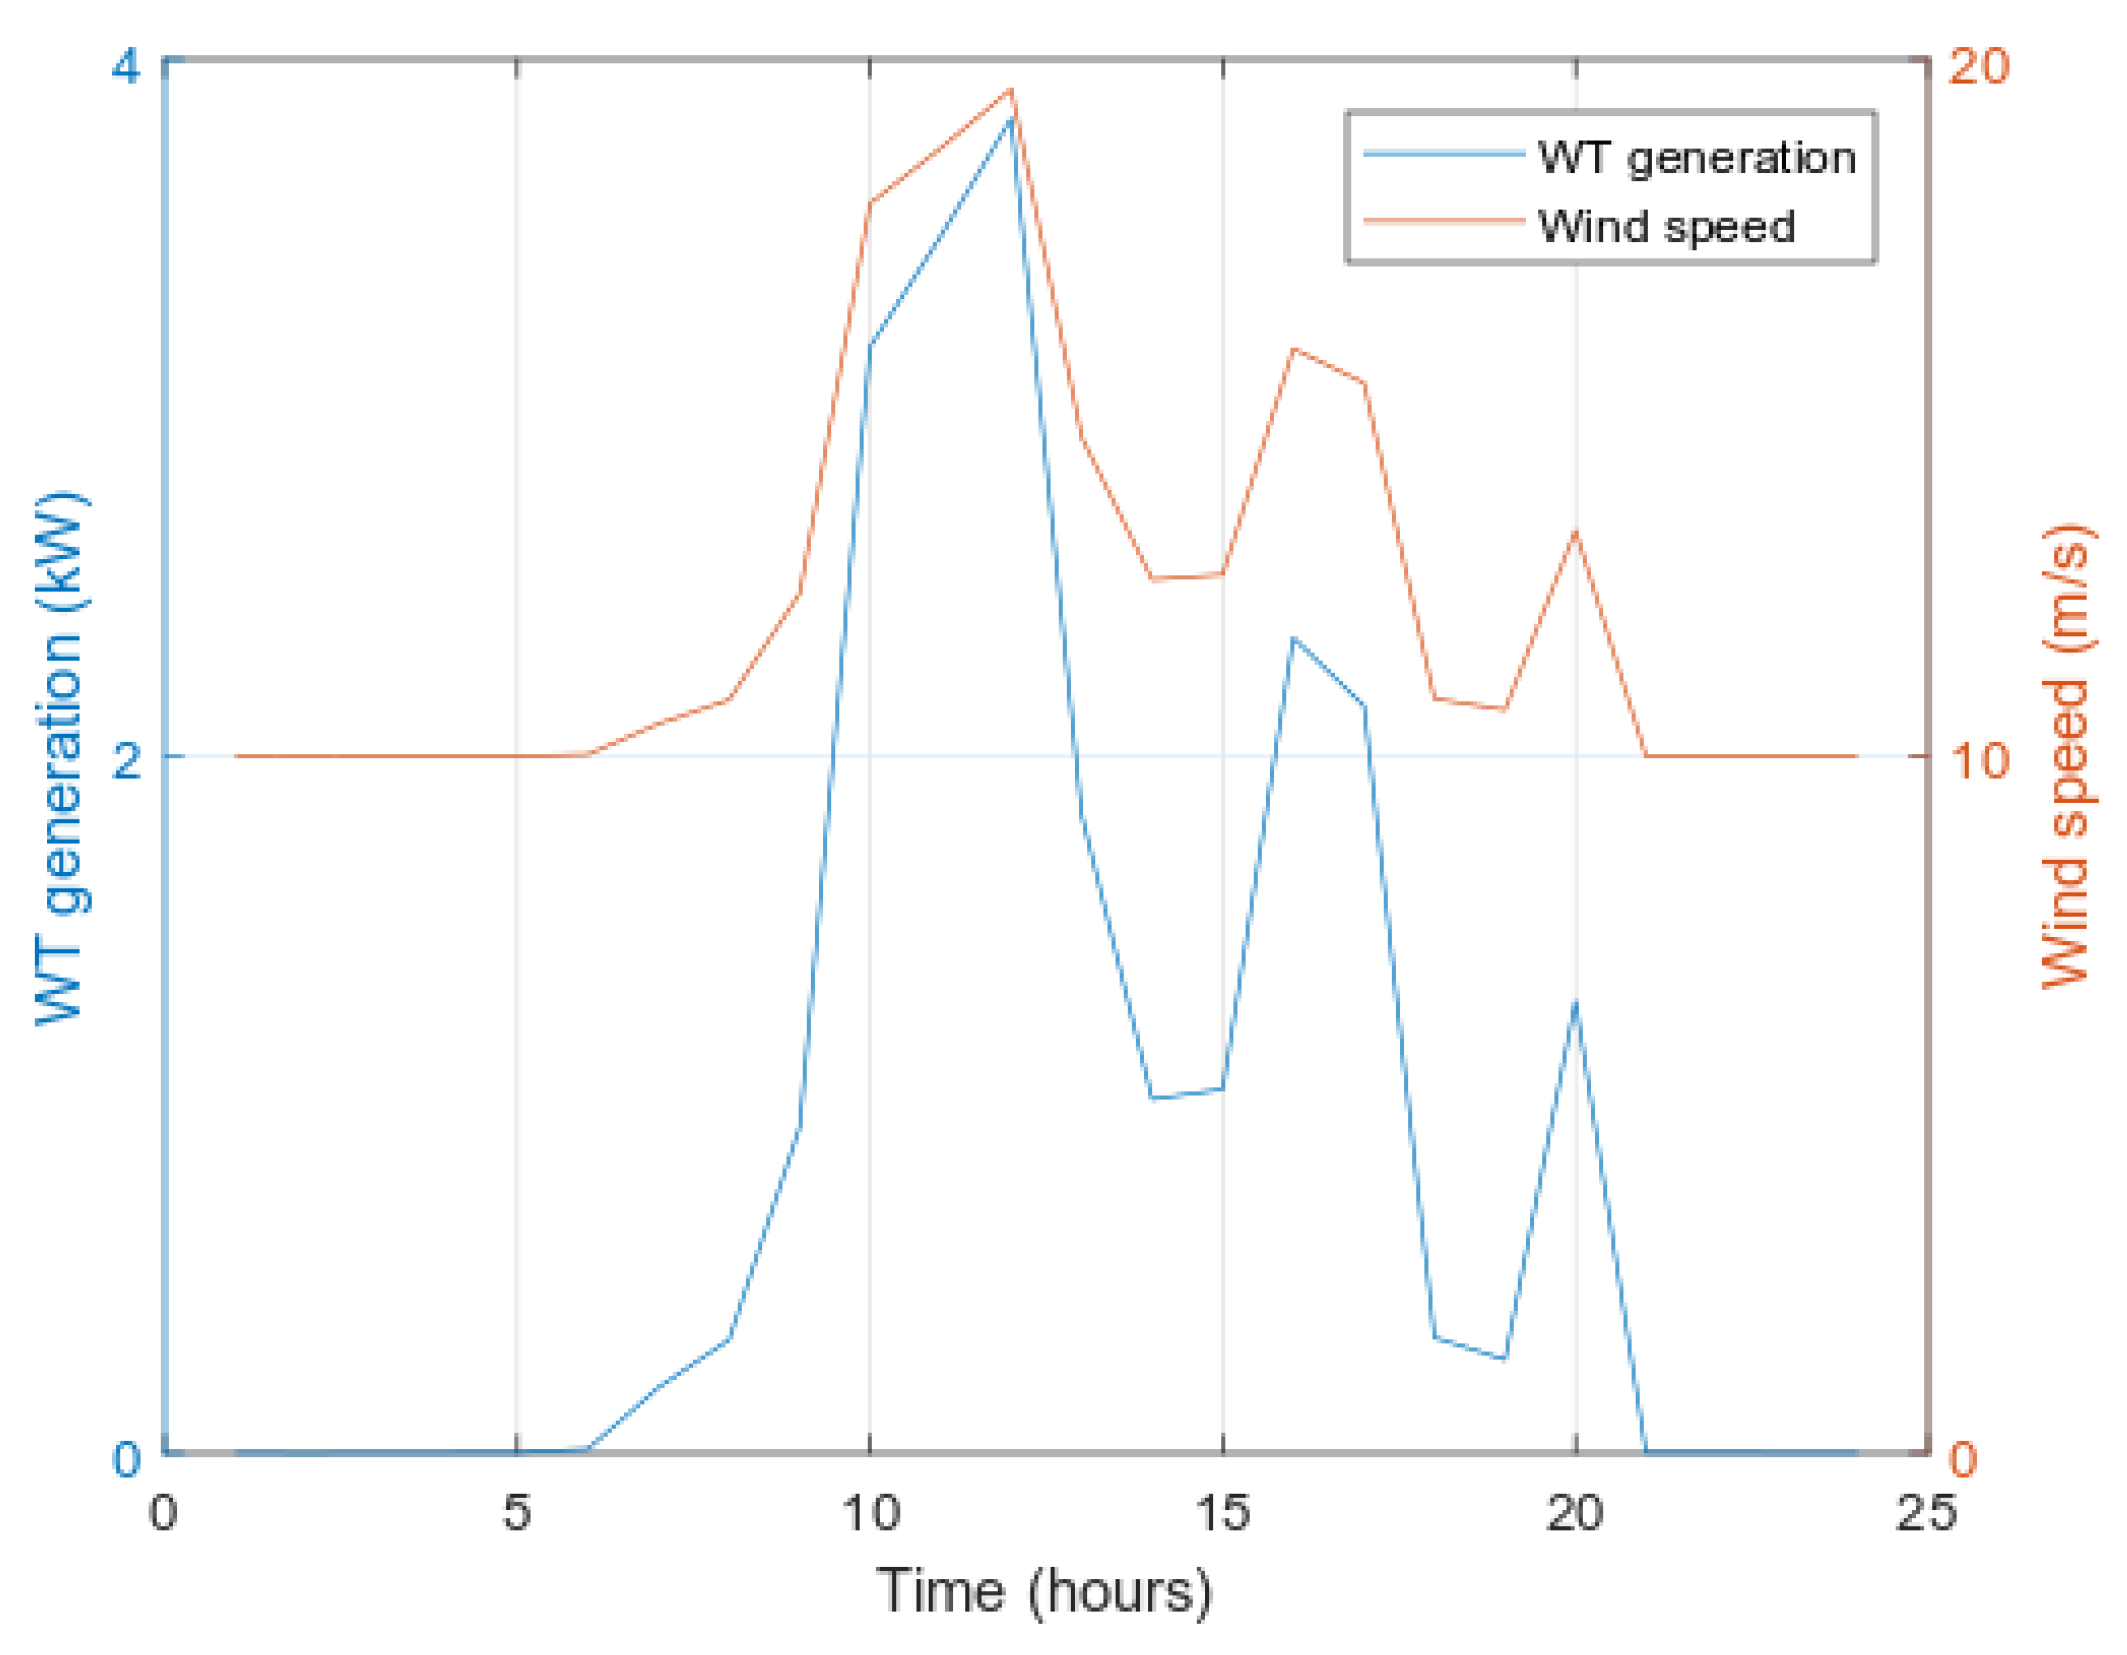
4.2.1. Wind Turbine
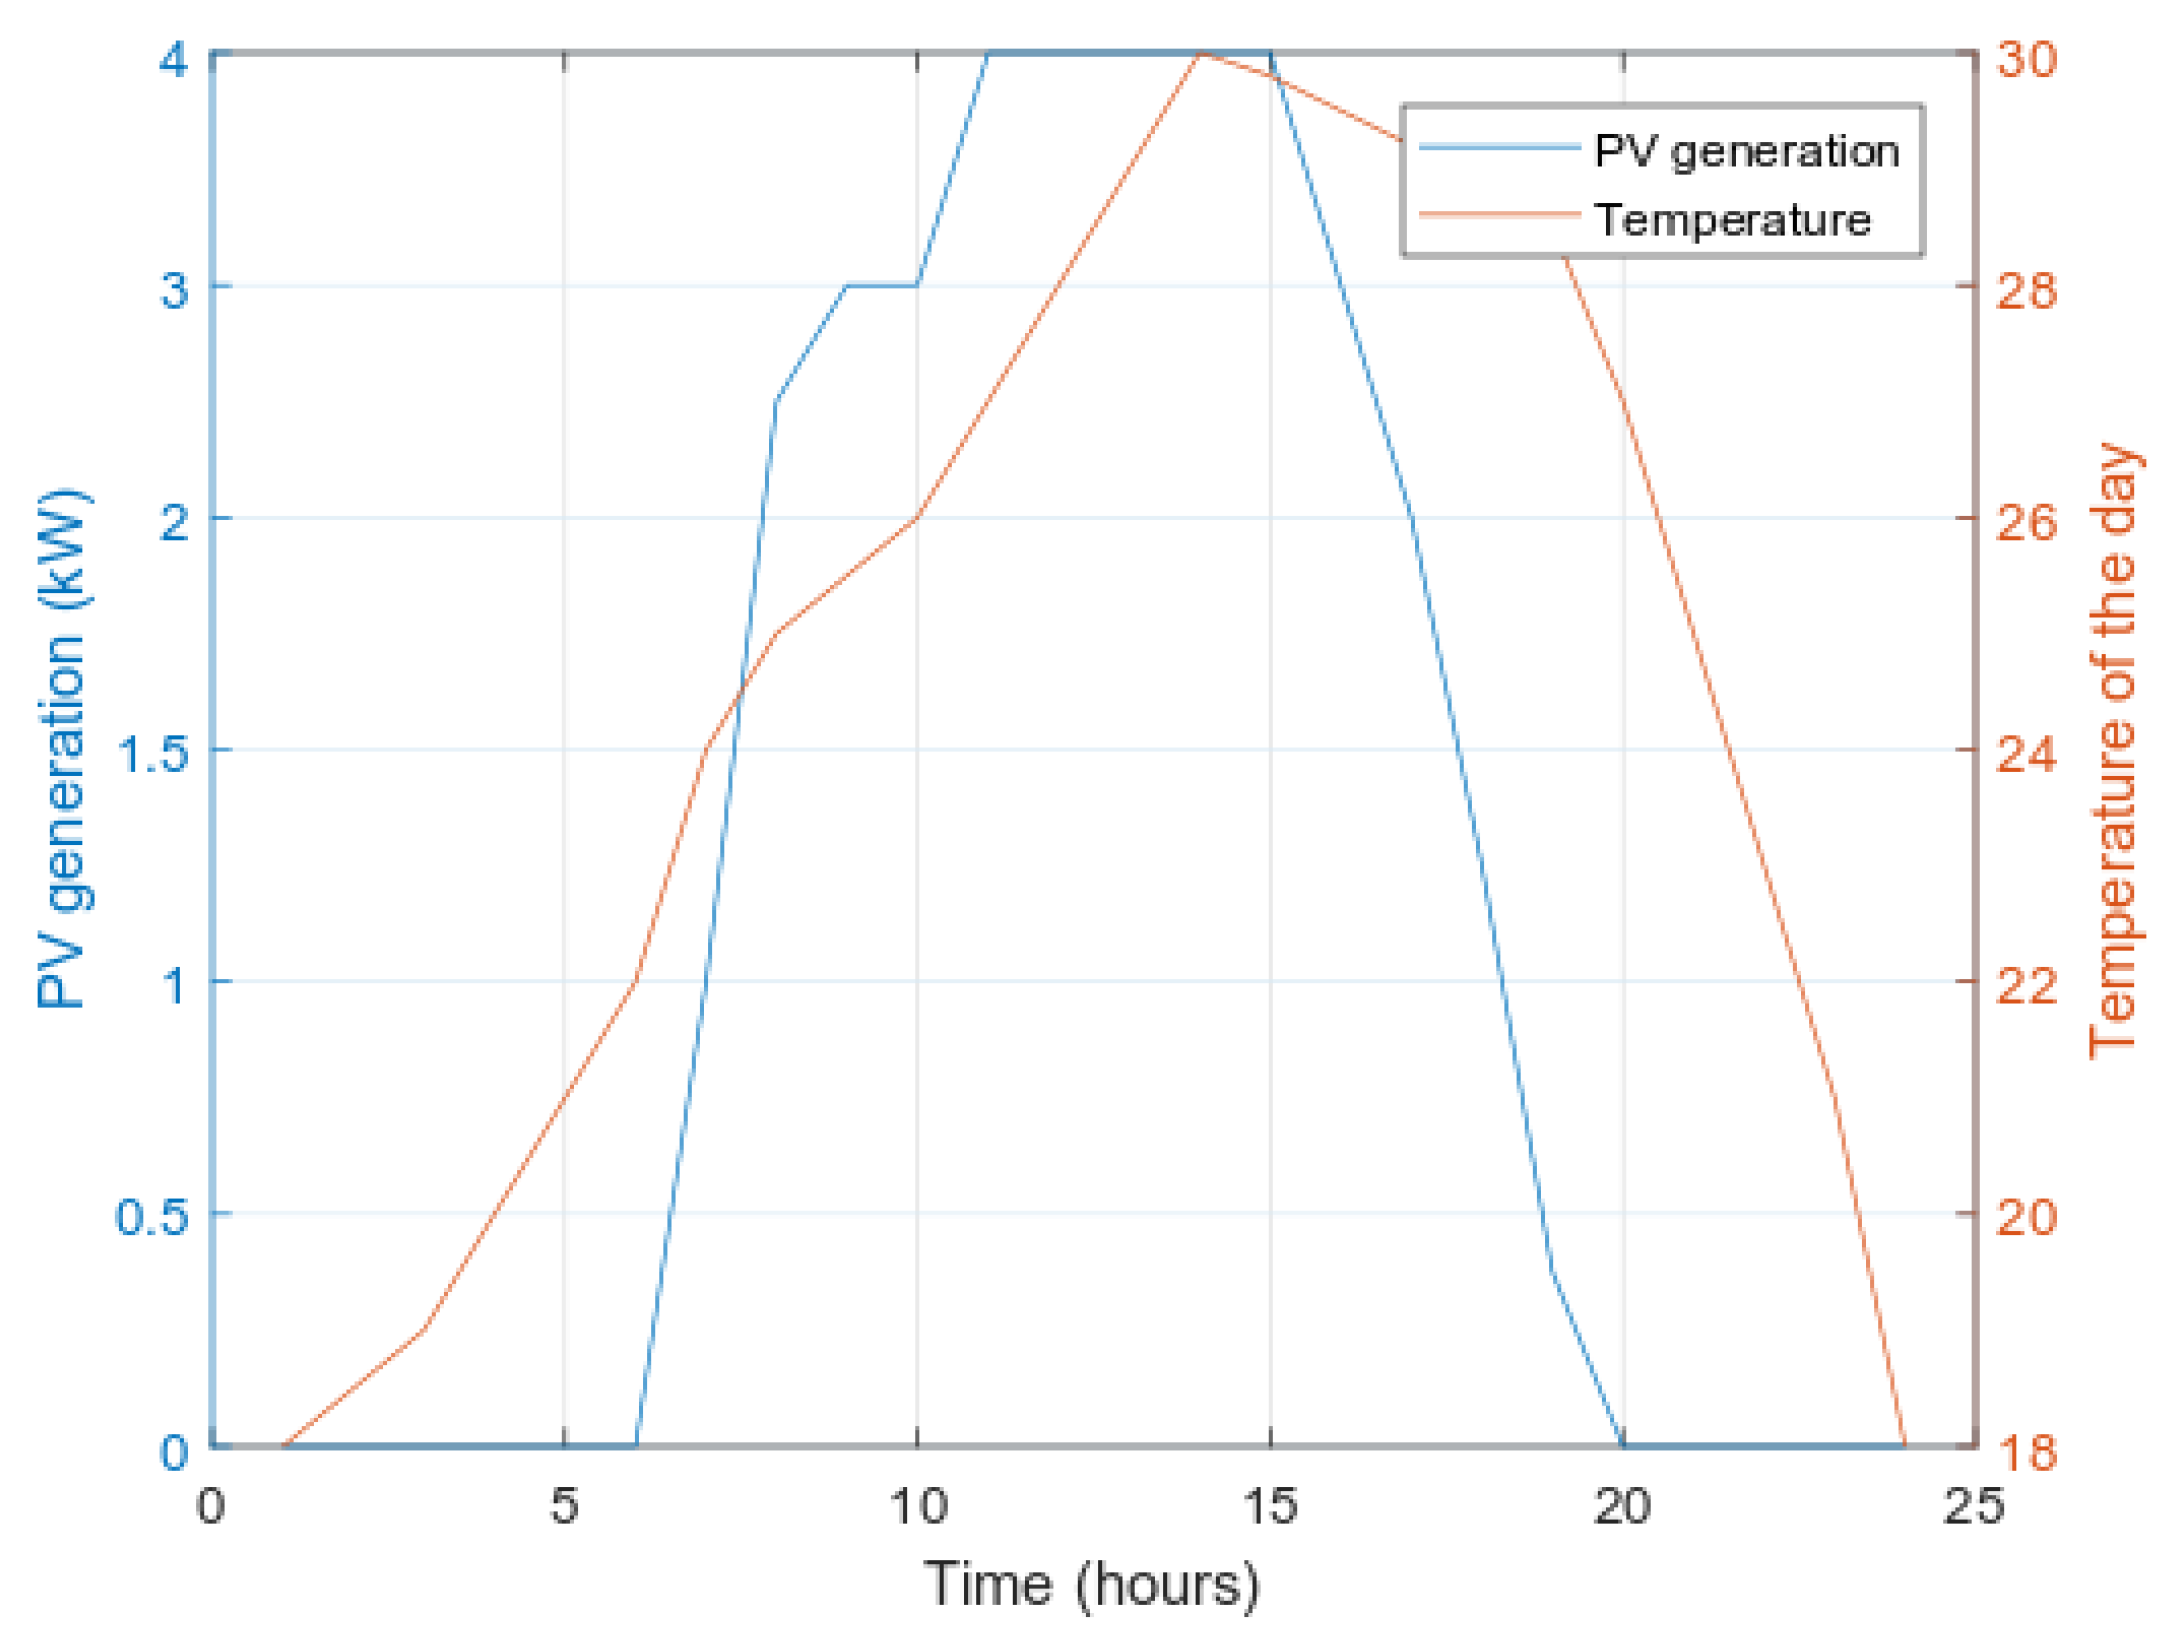
4.2.2. PV Panels
4.2.3. Electrolyzer
4.2.4. Hydrogen Tank
- a = −9.2211 × 10 (L/mol) atm;
- = 9.7319 × 10 (L/mol) atm;
- b = 1.7976 × 10 (L/mol);
- = 1.8041 × 10 (L/mol);
- c = −2.4613 × 10 (L/mol) K atm;
- = 3.8914 × 10 (L/mol) K atm;
- = −3.4215 × 10 [(L/mol)];
- = 1.89 × 10 [(L/mol)]
4.3. Micro-Gas Turbine
4.4. Energy Storage System
4.4.1. Static Energy Storage System: BES
4.4.2. Mobile Energy Storage System: EVs
5. Problem Formulation
5.1. Energy Cost
5.2. PAR
5.3. User Comfort
5.4. Carbon Emission
5.5. Objective Function
6. Analysis of Simulation Results
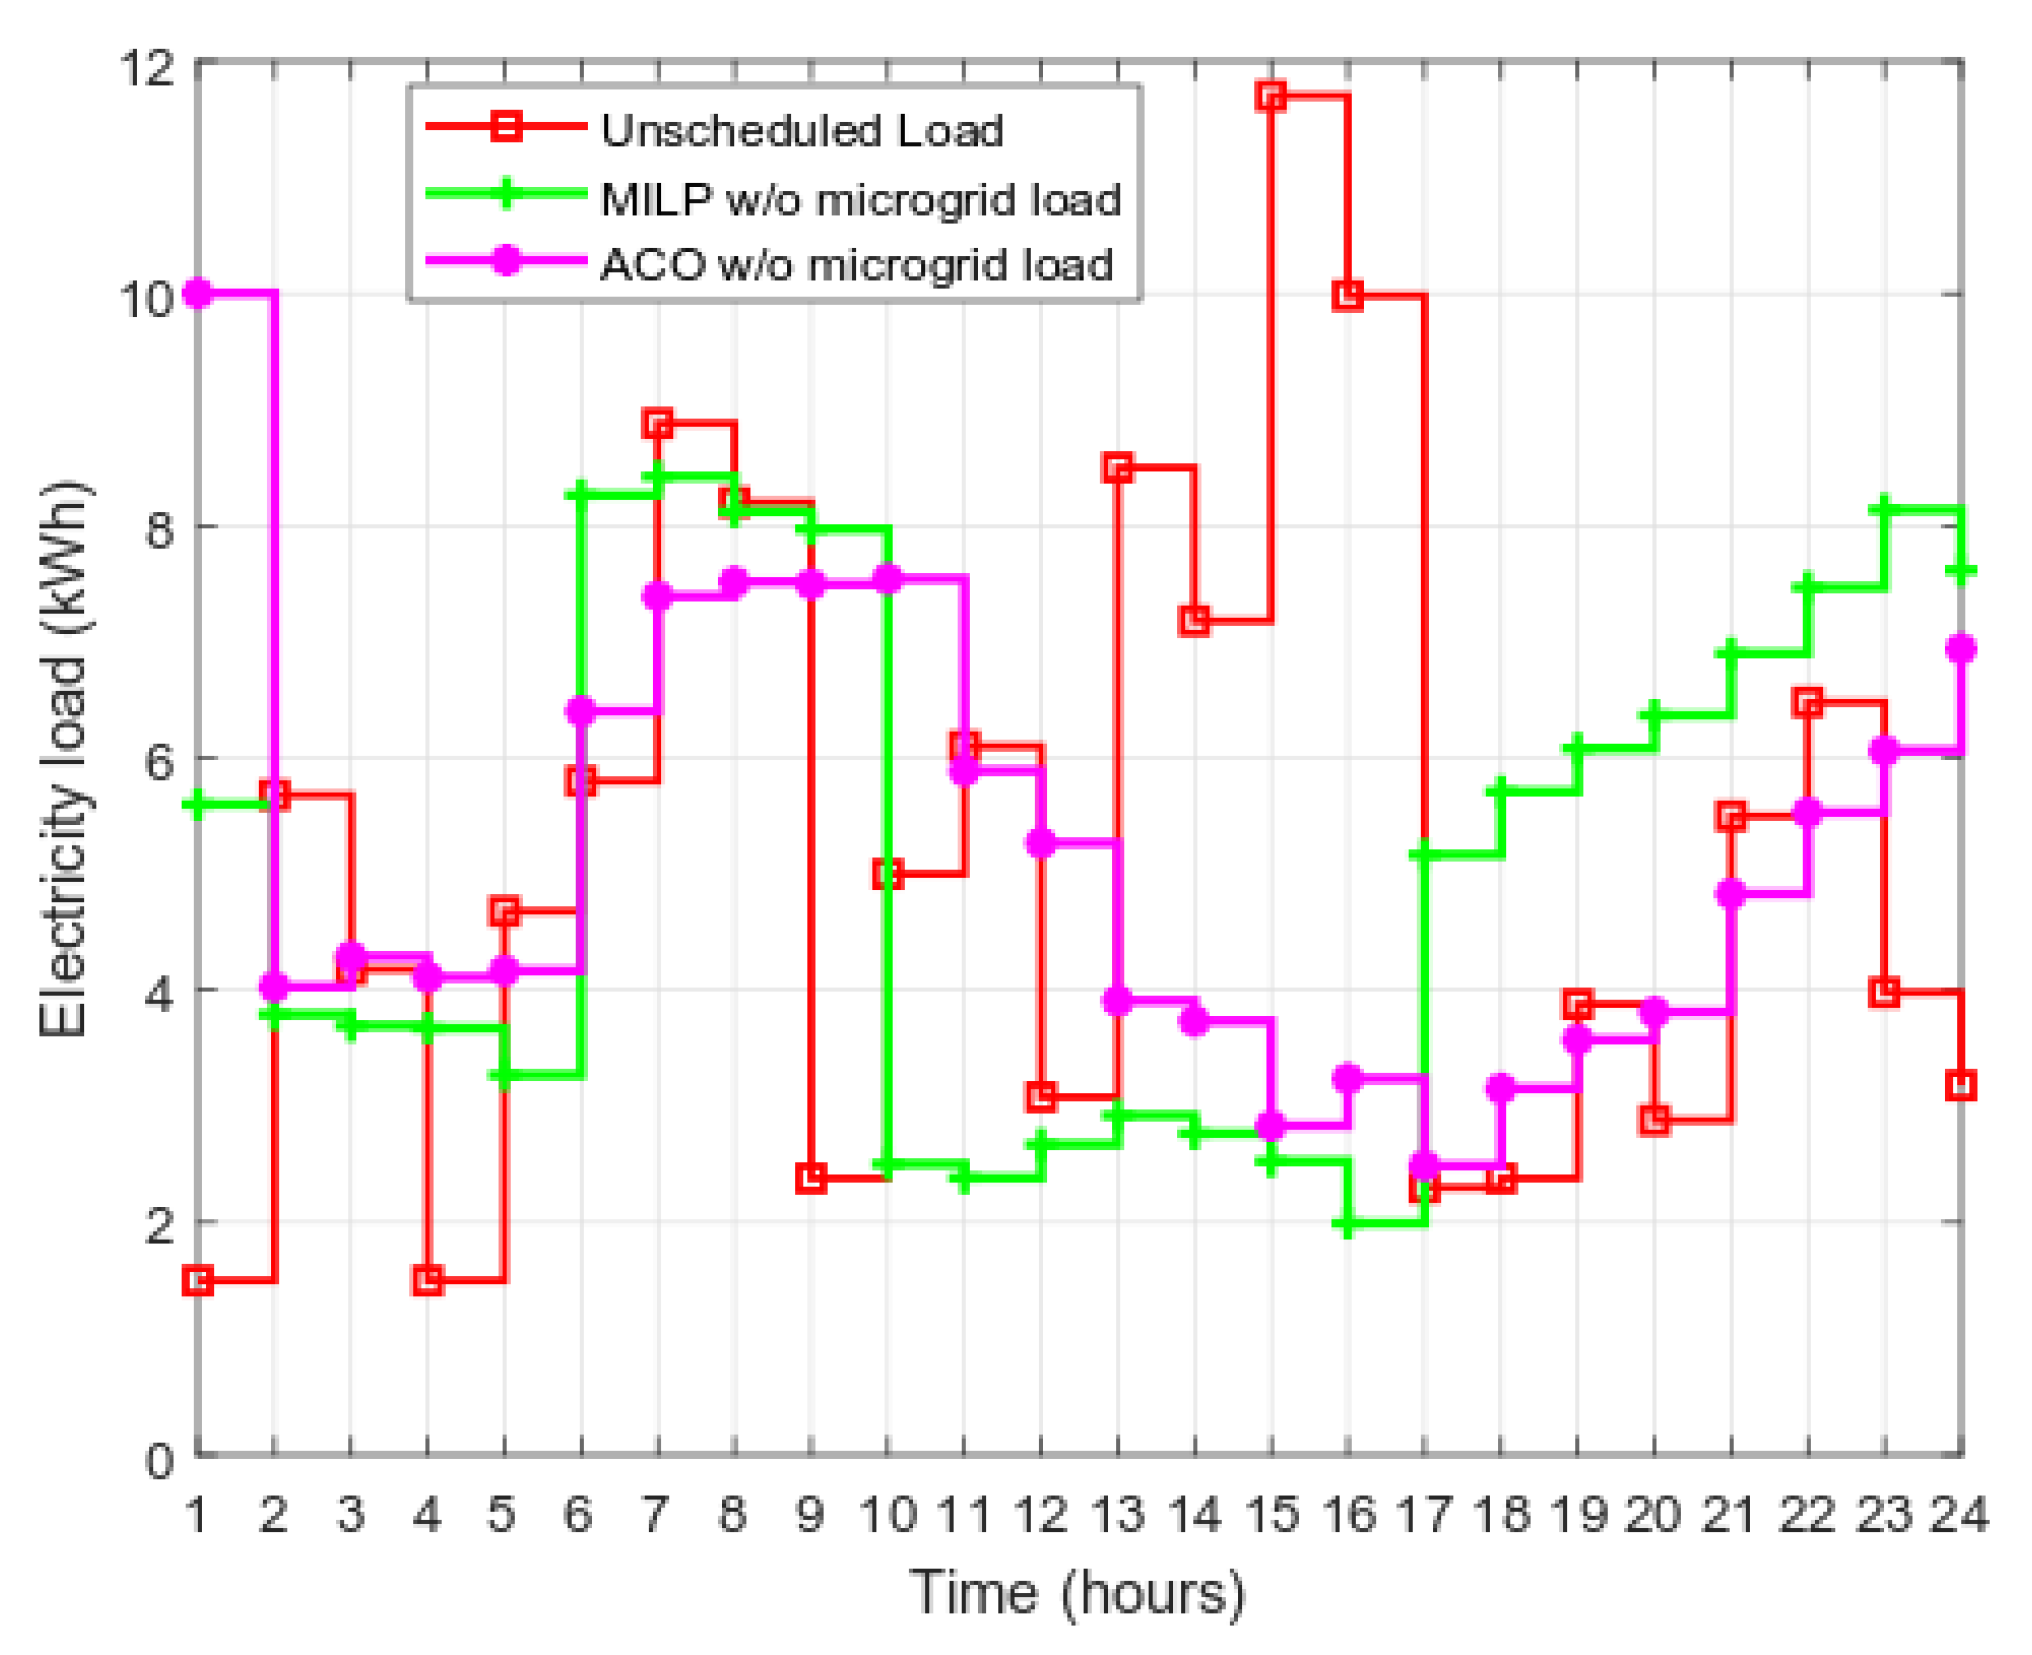
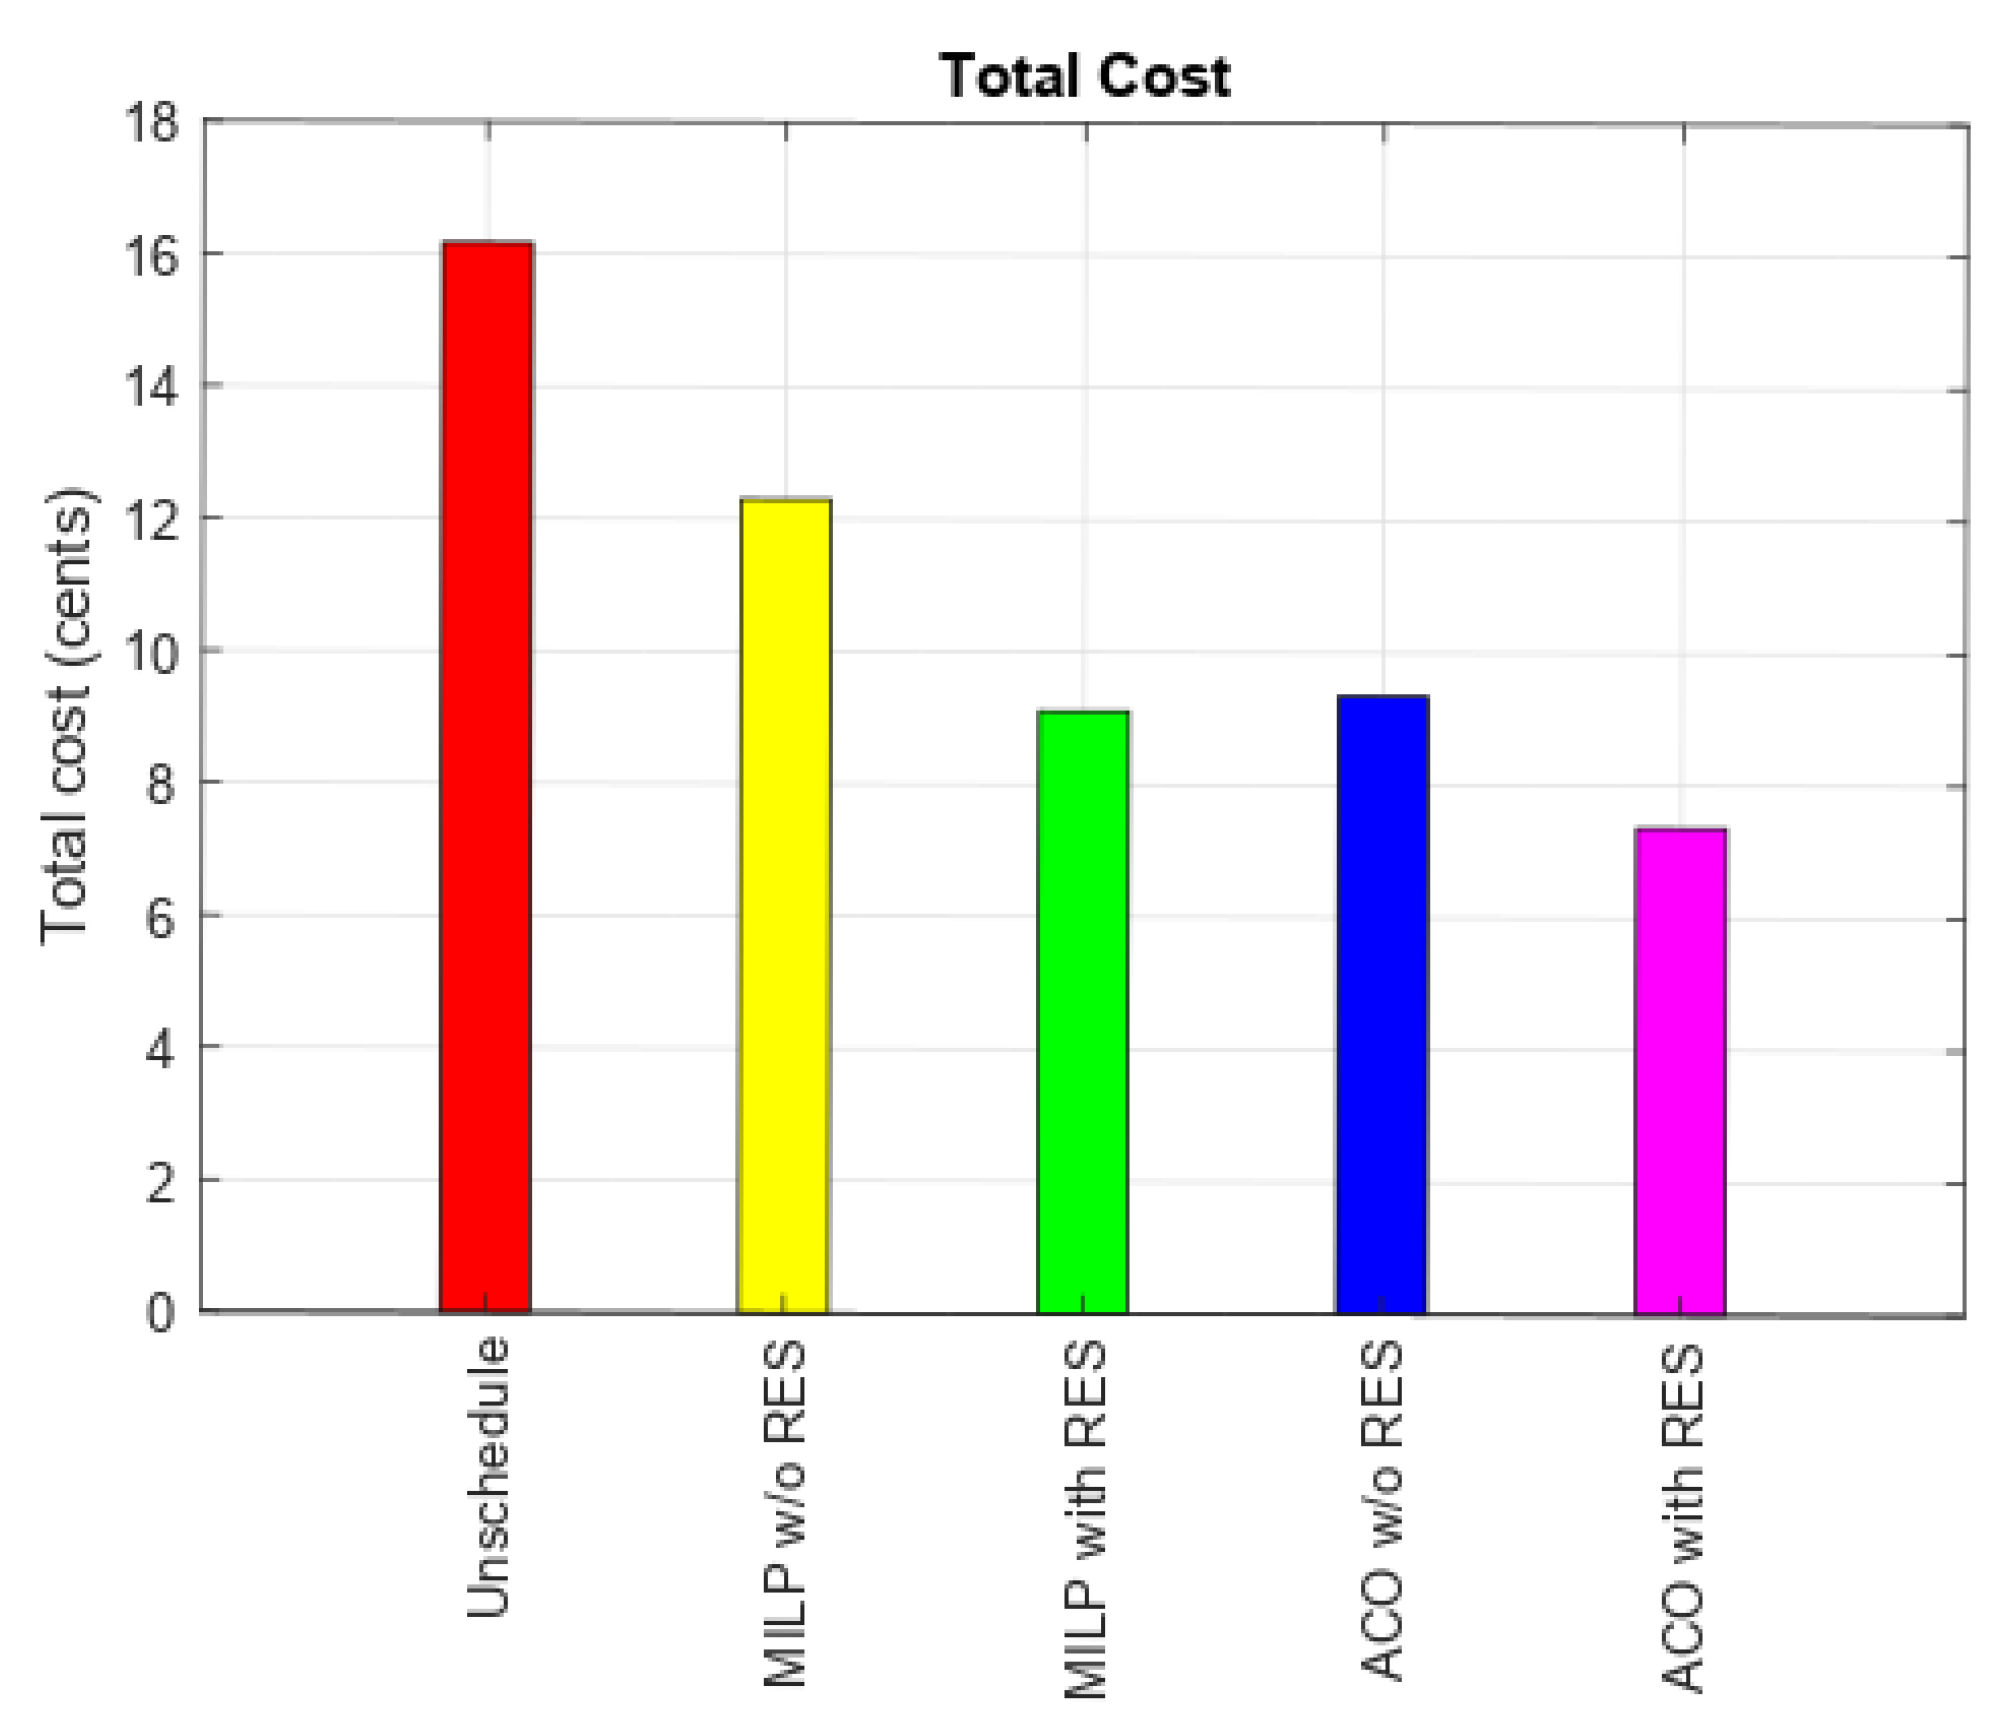
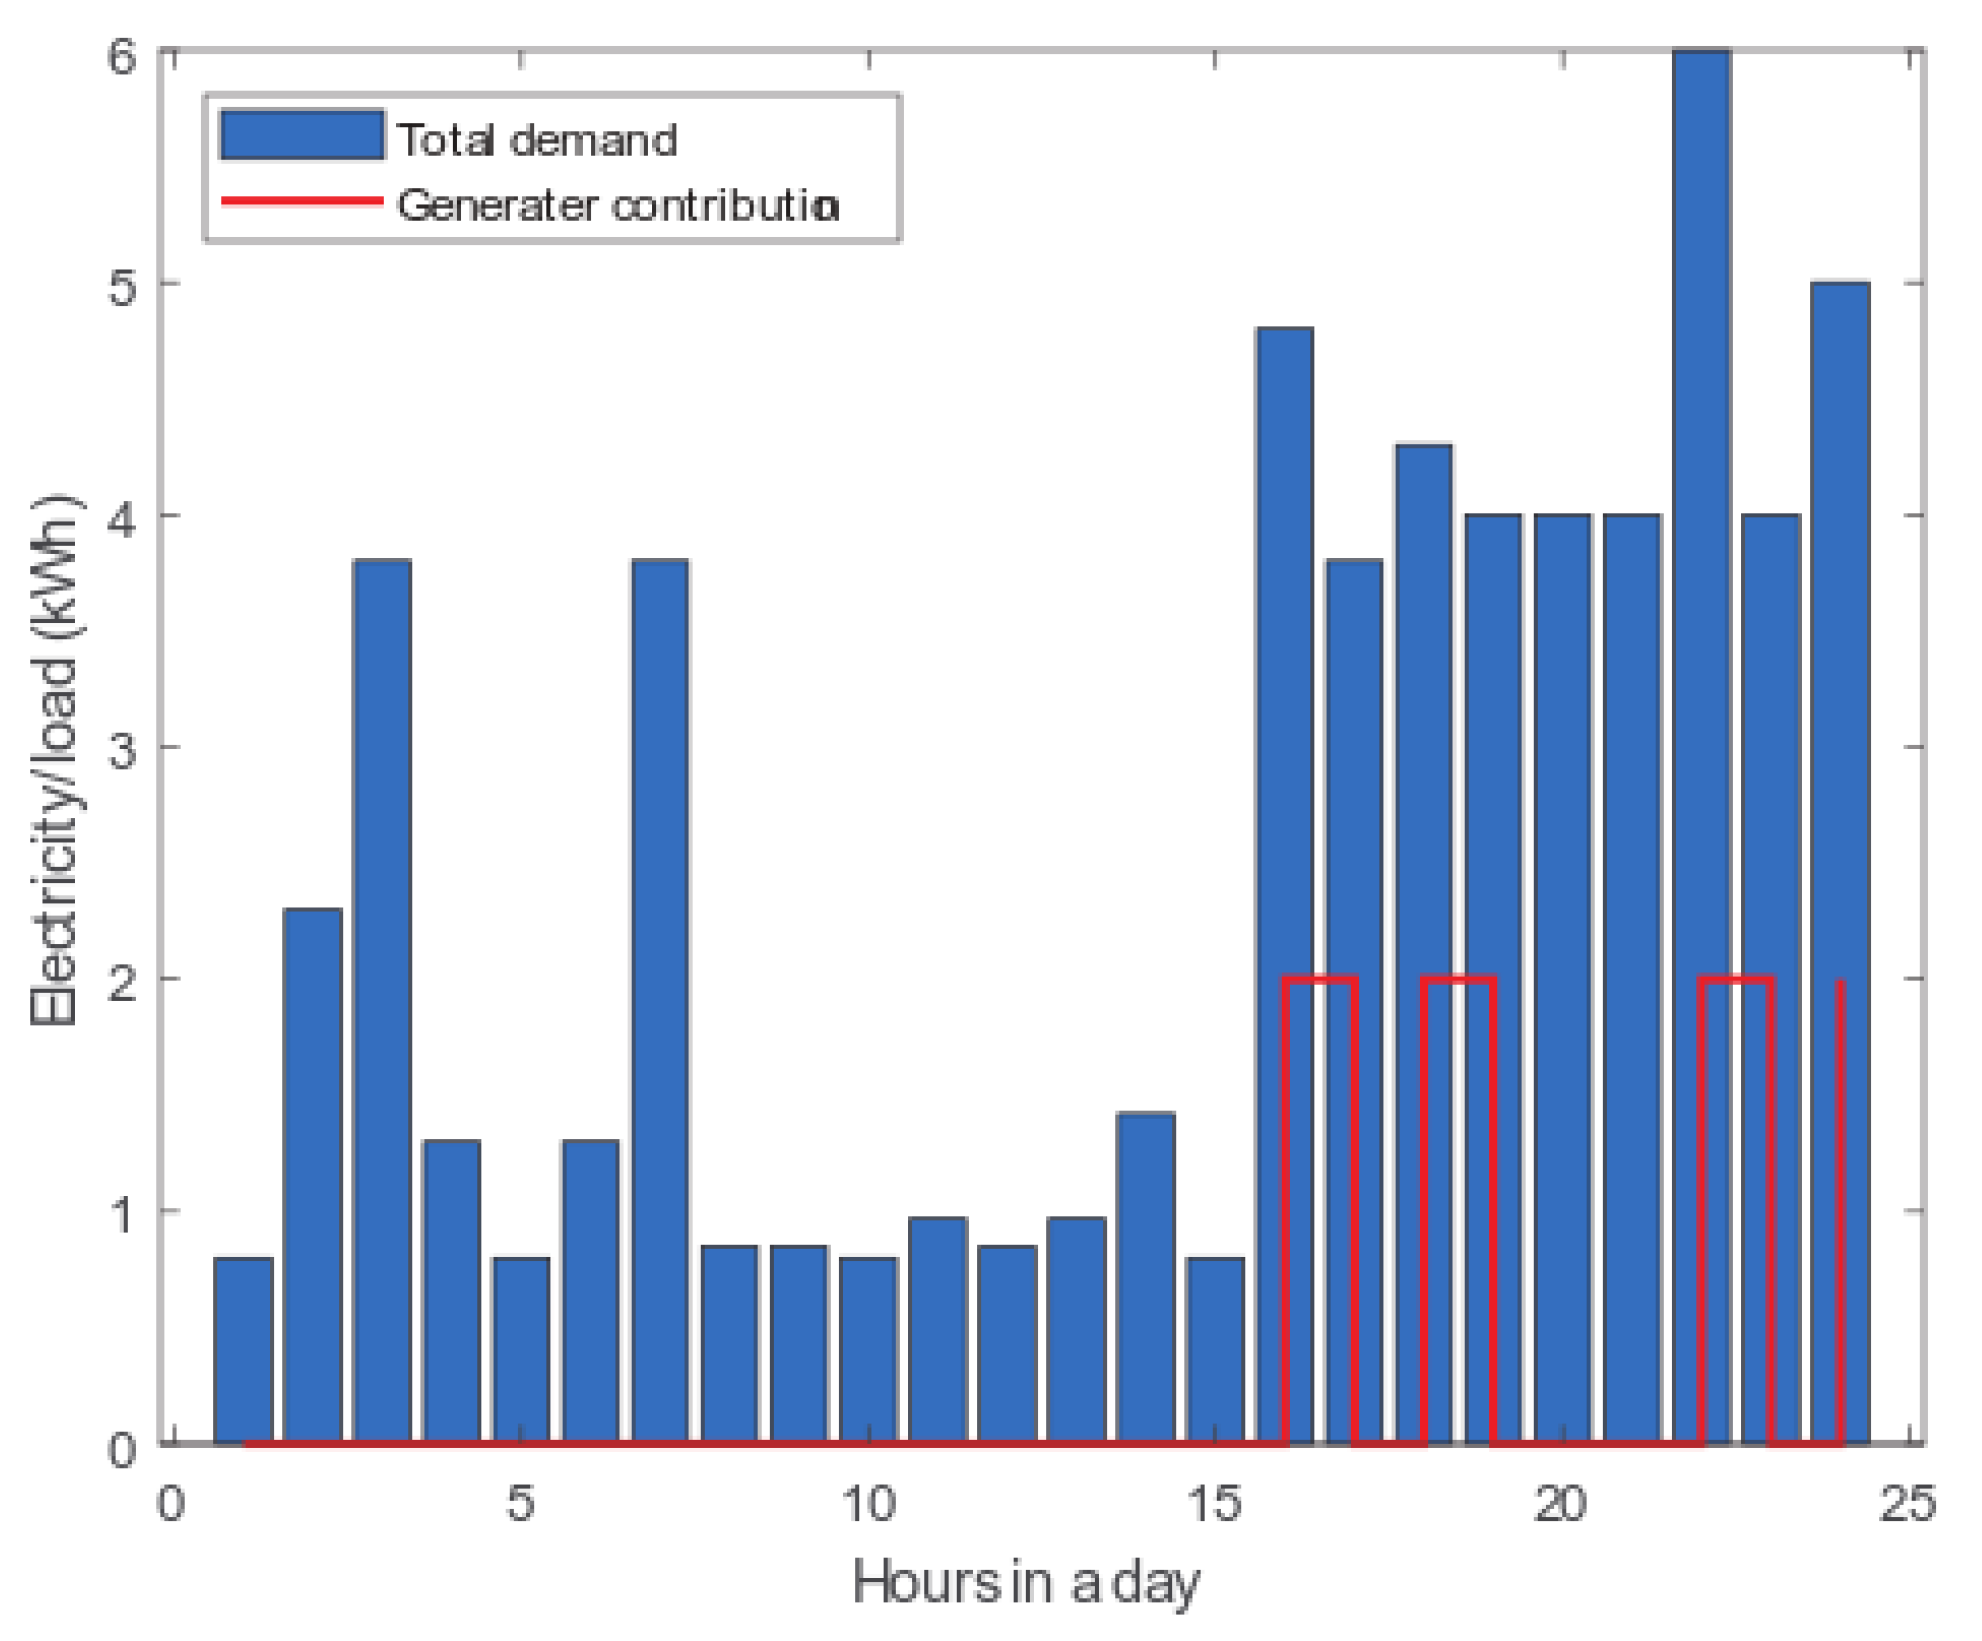
6.1. Energy Management without Microgrid
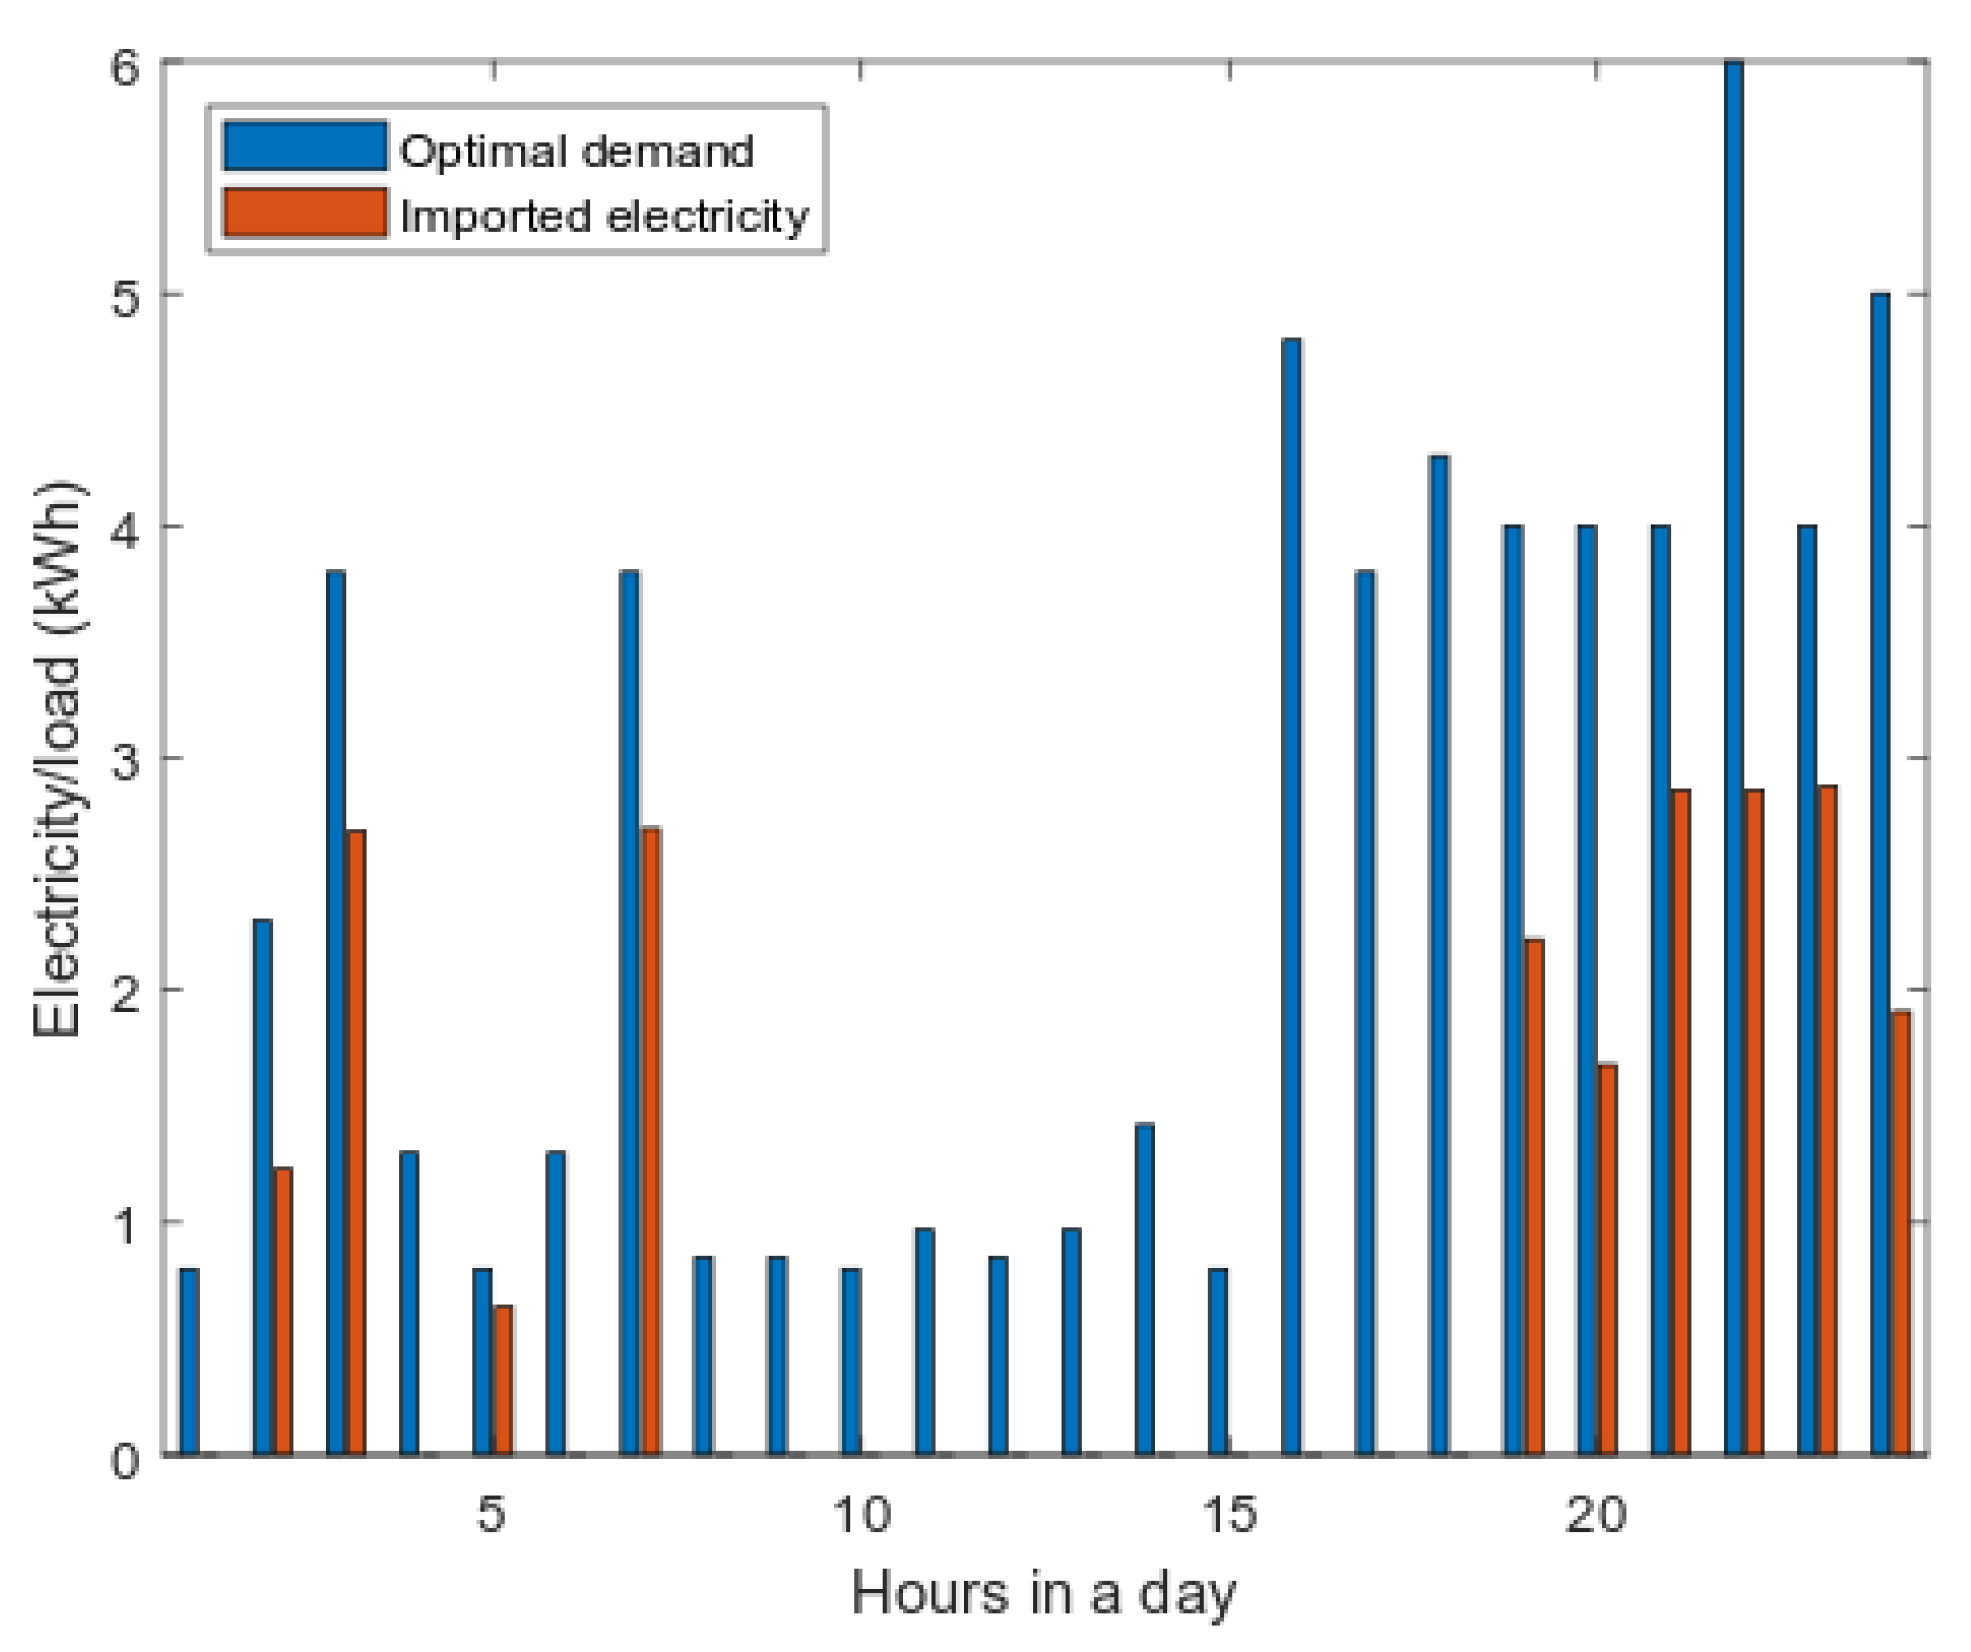
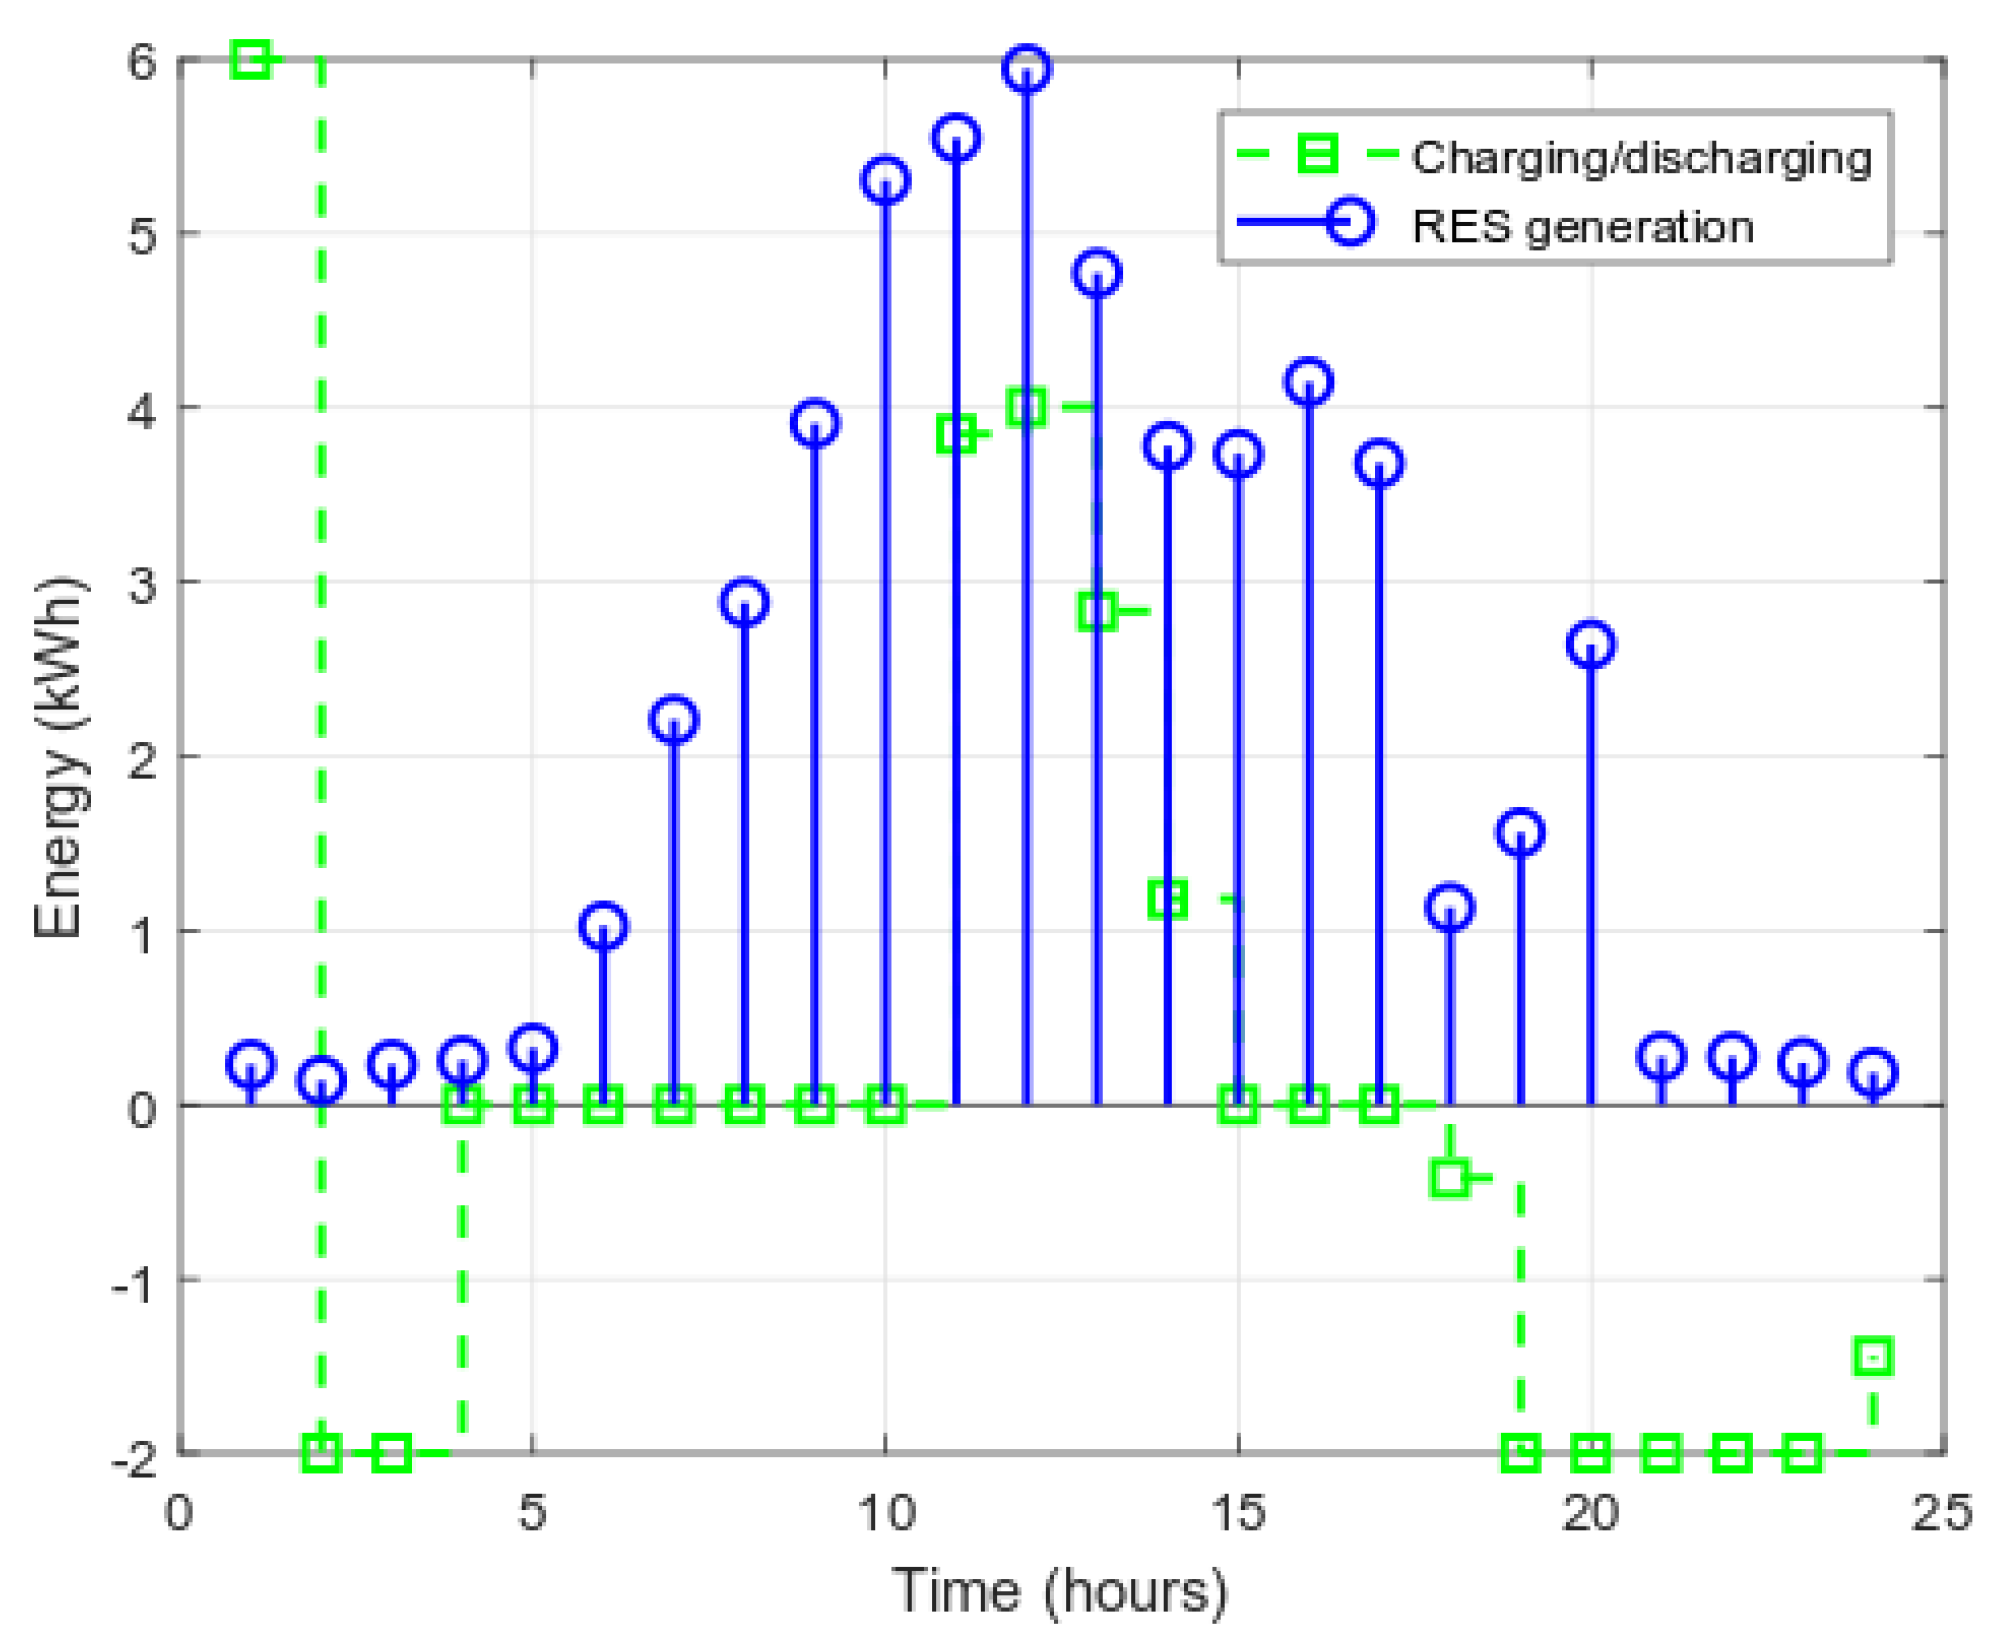
Energy Management with a Microgrid
7. Conclusions
Author Contributions
Funding
Acknowledgments
Conflicts of Interest
Nomenclature
| Abbreviations | Explanation |
| ACO | Ant Colony Optimization |
| AN | Artificial Neuron |
| ANN | Artificial Neural Network |
| CE | Carbon Emission |
| DR | Demand Response |
| DSM | Demand Side Management |
| DES | Distributed Electric System |
| EMC | Energy Management controller |
| EST | Earliest Starting Time |
| EDE | Enhanced Differential Evolution |
| EV | Electric Vehicle |
| ESS | Energy Storage Systems |
| ECA | Electrically Controllable Appliances |
| FA | Firefly Algorithm |
| IoT | Internet of Things |
| GHG | Green House Gases |
| GA | Genetic Algorithm |
| LOT | Length of Time |
| LFT | Latest Finishing Time |
| MGT | Micro Gas Turbine |
| MILP | Mixed Integer Linear Programming |
| MINLP | Mixed Integer Non-Linear Programming |
| MAPE | Mean Absolute Percentage Error |
| MSE | Mean squared Error |
| MG | Micro Grid |
| MPC | Model Predictive Control |
| MPPT | Maximum Power Point Tracking |
| NRMSE | Normalized Root Mean Square Error |
| OCA | Optically Controllable Appliances |
| PAR | Peak to Average Ratio |
| PSO | Particle swarm Optimization |
| PHEV | Plug in Hybrid Electrcic Vehicle |
| RES | Renewable Energy Sources |
| RTP | Real Time Pricing |
| SG | Smart Grids |
| TCA | Thermostatically Controllable Appliances |
| WT | Wind Turbine |
| m | Generation from RES |
| t | Time interval |
| Constants | Explanation |
| AC lower bound | |
| Fridge lower bound | |
| Heater lower bound | |
| Freezer lower bound | |
| AC upper bound | |
| Fridge upper bound | |
| Heater upper bound | |
| Freezer upper bound | |
| Wind cut-out speed | |
| Wind cut-in speed | |
| Electricity consumed per hour from PV | |
| Energy storage level at EV arrival time | |
| Energy storage level at EV departure time | |
| Maximum EV discharging limit | |
| Minimum EV discharging limit | |
| PV contribution in electricity generation | |
| WT contribution in electricity generation | |
| Hydrogen tank contribution in electricity generation | |
| Electrolyzer contribution in electricity generation | |
| ECA scheduling | |
| OCA scheduling | |
| TCA scheduling | |
| Hourly imported electricity | |
| EV arrival time | |
| Efficiency of Solar panel | |
| Efficiency of ESS | |
| Variables | Explanation |
| Generation from WT | |
| Wind Speed | |
| Air Density | |
| Hourly produced energy by PV | |
| Area of Solar panel | |
| Solar Radiation | |
| Outside Temperature | |
| SE | Stored Energy (Ah) |
| Charging Status of ESS at time t | |
| Discharging Status of ESS at time t |
References
- Ackermann, T.; Andersson, G.; Söder, L. Distributed generation: A definition. Electr. Power Syst. Res. 2001, 57, 195–204. [Google Scholar] [CrossRef]
- Gungor, V.C.; Sahin, D.; Kocak, T.; Ergut, S.; Buccella, C.; Cecati, C.; Hancke, G.P. Smart grid and smart homes: Key players and pilot projects. IEEE Ind. Electron. Mag. 2012, 6, 18–34. [Google Scholar] [CrossRef]
- Zakariazadeh, A.; Jadid, S.; Siano, P. Smart microgrid energy and reserve scheduling with demand response using stochastic optimization. Int. J. Electr. Power Energy Syst. 2014, 63, 523–533. [Google Scholar] [CrossRef]
- Ahmad, T.; Zhang, H.; Yan, B. A review on renewable energy and electricity requirement forecasting models for smart grid and buildings. Sustain. Cities Soc. 2020, 55, 102052. [Google Scholar] [CrossRef]
- Flores, J.T.; Celeste, W.C.; Coura, D.J.C.; Rissino, S.D.D.; Rocha, H.R.O.; Moraes, R.E.N. Demand planning in smart homes. IEEE Lat. Am. Trans. 2016, 14, 3247–3255. [Google Scholar] [CrossRef]
- Zhao, X.; Gao, W.; Qian, F.; Ge, J. Electricity cost comparison of dynamic pricing model based on load forecasting in home energy management system. Energy 2021, 229, 120538. [Google Scholar] [CrossRef]
- Rocha, H.R.O.; Honorato, I.H.; Fiorotti, R.; Celeste, W.C.; Silvestre, L.J.; Silva, J.A.L. An Artificial Intelligence based scheduling algorithm for demand-side energy management in Smart Homes. Appl. Energy 2021, 282, 116145. [Google Scholar] [CrossRef]
- Kim, B.-G.; Zhang, Y.; Van Der Schaar, M.; Lee, J.-W. Dynamic pricing and energy consumption scheduling with reinforcement learning. IEEE Trans. Smart Grid 2015, 7, 2187–2198. [Google Scholar] [CrossRef]
- Shirazi, E.; Jadid, S. Cost reduction and peak shaving through domestic load shifting and DERs. Energy 2017, 124, 146–159. [Google Scholar] [CrossRef]
- Silvente, J.; Papageorgiou, L.G. An MILP formulation for the optimal management of microgrids with task interruptions. Appl. Energy 2017, 206, 1131–1146. [Google Scholar] [CrossRef] [Green Version]
- Tushar, M.H.K.; Assi, C.; Maier, M.; Uddin, M.F. Smart microgrids: Optimal joint scheduling for electric vehicles and home appliances. IEEE Trans. Smart Grid 2014, 5, 239–250. [Google Scholar] [CrossRef]
- Umetani, S.; Fukushima, Y.; Morita, H. A linear programming based heuristic algorithm for charge and discharge scheduling of electric vehicles in a building energy management system. Omega 2017, 67, 115–122. [Google Scholar] [CrossRef]
- Wang, X.; Palazoglu, A.; El-Farra, N.H. Operational optimization and demand response of hybrid renewable energy systems. Appl. Energy 2015, 143, 324–335. [Google Scholar] [CrossRef]
- Aslam, S.; Khalid, A.; Javaid, N. Towards efficient energy management in smart grids considering microgrids with day-ahead energy forecasting. Electr. Power Syst. Res. 2020, 182, 106232. [Google Scholar] [CrossRef]
- Pal, S.; Thakur, S.; Kumar, R.; Panigrahi, B. A strategical game theoretic based demand response model for residential consumers in a fair environment. Int. J. Electr. Power Energy Syst. 2018, 97, 201–210. [Google Scholar] [CrossRef]
- Thomas, D.; Deblecker, O.; Ioakimidis, C.S. Optimal operation of an energy management system for a grid-connected smart building considering photovoltaics’ uncertainty and stochastic electric vehicles’ driving schedules. Appl. Energy 2018, 210, 1188–1206. [Google Scholar] [CrossRef]
- Melhem, F.Y. Optimization Methods and Energy Management in “Smart Grids”. Ph.D. Thesis, Université Bourgogne Franche-Comté, Bourgogne Franche-Comté, France, 2018. [Google Scholar]
- Giaouris, D.; Papadopoulos, A.I.; Seferlis, P.; Papadopoulou, S.; Voutetakis, S.; Stergiopoulos, F.; Elmasides, C. Optimum energy management in smart grids based on power pinch analysis. Chem. Eng. 2014, 39, 55–60. [Google Scholar]
- Zafar, R.; Mahmood, A.; Razzaq, S.; Ali, W.; Naeem, U.; Shehzad, K. Prosumer based energy management and sharing in smart grid. Renew. Sustain. Energy Rev. 2018, 82, 1675–1684. [Google Scholar] [CrossRef]
- De Angelis, F.; Boaro, M.; Fuselli, D.; Squartini, S.; Piazza, F.; Wei, Q. Optimal home energy management under dynamic electrical and thermal constraints. IEEE Trans. Ind. Inform. 2012, 9, 1518–1527. [Google Scholar] [CrossRef]
- He, M.-F.; Zhang, F.-X.; Huang, Y.; Chen, J.; Wang, J.; Wang, R. A distributed demand side energy management algorithm for smart grid. Energies 2019, 12, 426. [Google Scholar] [CrossRef] [Green Version]
- Subha, S.; Nagalakshmi, S. Design of ANFIS controller for intelligent energy management in smart grid applications. J. Ambient Intell. Humaniz. Comput. 2021, 12, 6117–6127. [Google Scholar] [CrossRef]
- Xing, X.; Xie, L.; Meng, H. Cooperative energy management optimization based on distributed MPC in grid-connected microgrids community. Int. J. Electr. Power Energy Syst. 2019, 107, 186–199. [Google Scholar] [CrossRef]
- Yuan, D.; Lu, Z.; Zhang, J.; Li, X. A hybrid prediction-based microgrid energy management strategy considering demand-side response and data interruption. Int. J. Electr. Power Energy Syst. 2019, 113, 139–153. [Google Scholar] [CrossRef]
- Ouammi, A.; Achour, Y.; Zejli, D.; Dagdougui, H. Supervisory model predictive control for optimal energy management of networked smart greenhouses integrated microgrid. IEEE Trans. Autom. Sci. Eng. 2019, 17, 117–128. [Google Scholar] [CrossRef]
- Mbungu, N.T.; Bansal, R.C.; Naidoo, R.M.; Bettayeb, M.; Siti, M.W.; Bipath, M. A dynamic energy management system using smart metering. Appl. Energy 2020, 280, 115990. [Google Scholar] [CrossRef]
- Bingham, R.D.; Agelin-Chaab, M.; Rosen, M.A. Whole building optimization of a residential home with pv and battery storage in the Bahamas. Renew. Energy 2019, 132, 1088–1103. [Google Scholar] [CrossRef]
- Shakeri, M.; Shayestegan, M.; Reza, S.S.; Yahya, I.; Bais, B.; Akhtaruzzaman, M.; Sopian, K.; Amin, N. Implementation of a novel home energy management system (hems) architecture with solar photovoltaic system as supplementary source. Renew. Energy 2018, 125, 108–120. [Google Scholar] [CrossRef]
- Nemati, M.; Braun, M.; Tenbohlen, S. Optimization of unit commitment and economic dispatch in microgrids based on genetic algorithm and mixed integer linear programming. Appl. Energy 2018, 210, 944–963. [Google Scholar] [CrossRef]
- Silva, B.N.; Han, K. Mutation operator integrated ant colony optimization based domestic appliance scheduling for lucrative demand side management. Future Gener. Comput. Syst. 2019, 100, 557–568. [Google Scholar] [CrossRef]
- Hafeez, G.; Alimgeer, K.S.; Wadud, Z.; Khan, I.; Usman, M.; Qazi, A.B.; Khan, F.A. An innovative optimization strategy for efficient energy management with day-ahead demand response signal and energy consumption forecasting in smart grid using artificial neural network. IEEE Access 2020, 8, 84415–84433. [Google Scholar] [CrossRef]
- Shuja, S.M.; Javaid, N.; Khan, S.; Akmal, H.; Hanif, M.; Fazalullah, Q.; Khan, Z.A. Efficient scheduling of smart home appliances for energy management by cost and PAR optimization algorithm in smart grid. In Proceedings of the Workshops of the International Conference on Advanced Information Networking and Applications, Matsue, Japan, 27–29 March 2019; Springer: Cham, Switzerland, 2019; pp. 398–411. [Google Scholar]
- Ayub, S.; Ayob, S.M.; Tan, C.W.; Ayub, L.; Bukar, A.L. Optimal residence energy management with time and device-based preferences using an enhanced binary grey wolf optimization algorithm. Sustain. Energy Technol. Assess. 2020, 41, 100798. [Google Scholar] [CrossRef]
- Shuja, S.M.; Javaid, N.; Rafique, M.Z.; Qasim, U.; Khan, R.F.M.; Butt, A.A.; Hanif, M. Towards efficient scheduling of smart appliances for energy management by candidate solution updation algorithm in smart grid. In Proceedings of the International Conference on Advanced Information Networking and Applications, Matsue, Japan, 27–29 March 2019; Springer: Cham, Switzerland, 2019; pp. 67–81. [Google Scholar]
- Liu, Y.; Yang, C.; Jiang, L.; Xie, S.; Zhang, Y. Intelligent edge computing for IoT-based energy management in smart cities. IEEE Netw. 2019, 33, 111–117. [Google Scholar] [CrossRef]
- Choi, J.S. A hierarchical distributed energy management agent framework for smart homes, grids, and cities. IEEE Commun. Mag. 2019, 57, 113–119. [Google Scholar] [CrossRef]
- Ding, Y.; Xie, D.; Hui, H.; Xu, Y.; Siano, P. Game-Theoretic Demand Side Management of Thermostatically Controlled Loads for Smoothing Tie-line Power of Microgrids. IEEE Trans. Power Syst. 2021, 36, 4089–4101. [Google Scholar] [CrossRef]
- Longe, O.M.; Ouahada, K.; Rimer, S.; Harutyunyan, A.N.; Ferreira, H.C. Distributed Demand Side Management with Battery Storage for Smart Home Energy Scheduling. Sustainability 2017, 9, 120. [Google Scholar] [CrossRef] [Green Version]
- Ali, S.; Khan, I.; Jan, S.; Hafeez, G. An Optimization Based Power Usage Scheduling Strategy Using Photovoltaic-Battery System for Demand-Side Management in Smart Grid. Energies 2021, 14, 2201. [Google Scholar] [CrossRef]
- Nadeem, F.; Aftab, M.A.; Hussain, S.M.; Ali, I.; Tiwari, P.K.; Goswami, A.K.; Ustun, T.S. Virtual power plant management in smart grids with XMPP based IEC 61850 communication. Energies 2019, 12, 2398. [Google Scholar] [CrossRef] [Green Version]
- Zhao, C.; Chen, J.; He, J.; Cheng, P. Privacy-preserving consensus-based energy management in smart grids. IEEE Trans. Signal Process. 2018, 66, 6162–6176. [Google Scholar] [CrossRef]
- Je, S.-M.; Huh, J.-H. Estimation of future power consumption level in smart grid: Application of fuzzy logic and genetic algorithm on big data platform. Int. J. Commun. Syst. 2021, 34, e4056. [Google Scholar] [CrossRef]
- Taheri, S.S.; Seyedshenava, S.; Mohadesi, V.; Esmaeilzadeh, R. Improving Operation Indices of a Micro-grid by Battery Energy Storage Using Multi Objective Cuckoo Search Algorithm. Int. J. Electr. Eng. Inform. 2021, 13, 132–151. [Google Scholar]
- Chen, J.; Zhu, Q. A Stackelberg game approach for two-level distributed energy management in smart grids. IEEE Trans. Smart Grid 2017, 9, 6554–6565. [Google Scholar] [CrossRef]
- Förderer, K.; Ahrens, M.; Bao, K.; Mauser, I.; Schmeck, H. Towards the modeling of flexibility using artificial neural networks in energy management and smart grids: Note. In Proceedings of the Ninth International Conference on Future Energy Systems, Karlsruhe, Germany, 12–15 June 2018; pp. 85–90. [Google Scholar]
- Misra, S.; Mondal, A.; Banik, S.; Khatua, M.; Bera, S.; Obaidat, M.S. Residential energy management in smart grid: A Markov decision process-based approach. In Proceedings of the 2013 IEEE International Conference on Green Computing and Communications and IEEE Internet of things and IEEE Cyber, Physical and Social Computing, Beijing, China, 20–23 August 2013; pp. 1152–1157. [Google Scholar]
- Andrade, I.; Pena, R.; Blasco-Gimenez, R.; Riedemann, J.; Jara, W.; Pesce, C. An Active/Reactive Power Control Strategy for Renewable Generation Systems. Electronics 2021, 10, 1061. [Google Scholar] [CrossRef]
- El-Zonkoly, A.M. Optimal energy management in smart grids including different types of aggregated flexible loads. J. Energy Eng. 2019, 145, 04019015. [Google Scholar] [CrossRef]
- Hafeez, G.; Islam, N.; Ali, A.; Ahmad, S.; Usman, M.; Alimgeer, K.S. A modular framework for optimal load scheduling under price-based demand response scheme in smart grid. Processes 2019, 7, 499. [Google Scholar] [CrossRef] [Green Version]
- Campagna, N.; Caruso, M.; Castiglia, V.; Miceli, R.; Viola, F. Energy Management Concepts for the Evolution of Smart Grids. In Proceedings of the 2020 8th International Conference on Smart Grid (icSmartGrid), Paris, France, 17–19 June 2020; pp. 208–213. [Google Scholar]
- Sharifi, A.H.; Maghouli, P. Energy management of smart homes equipped with energy storage systems considering the PAR index based on real-time pricing. Sustain. Cities Soc. 2019, 45, 579–587. [Google Scholar] [CrossRef]
- Rahim, S.; Javaid, N.; Ahmad, A.; Khan, S.A.; Khan, Z.A.; Alrajeh, N.; Qasim, U. Exploiting heuristic algorithms to efficiently utilize energymanagement controllers with renewable energy sources. Energy Build. 2016, 129, 452–470. [Google Scholar] [CrossRef]
- Neural Network Models. Available online: https://otexts.com/fpp2/nnetar.html (accessed on 7 September 2020).
- Ahmad, A.; Javaid, N.; Guizani, M.; Alrajeh, N.; Khan, Z.A. An accurate and fast converging short-term load forecasting model for industrial applications in a smart grid. IEEE Trans. Ind. Inform. 2017, 13, 2587–2596. [Google Scholar] [CrossRef]
- Niedźwiecki, M.; Ciołek, M. Identification of nonstationary multivariate autoregressive processes-comparison of competitive and collaborative strategies for joint selection of estimation bandwidth and model order. Digit. Signal Process. 2018, 78, 72–81. [Google Scholar] [CrossRef]
- Solar Resource Data. Available online: https://pvwatts.nrel.gov/pvwatts.php (accessed on 12 October 2020).
- Gensler, A.; Henze, J.; Sick, B.; Raabe, N. Deep Learning for solar power forecasting—An approach using AutoEncoder and LSTM Neural Networks. In Proceedings of the 2016 IEEE International Conference on Systems, Man, and Cybernetics (SMC), Budapest, Hungary, 9–12 October 2016; pp. 002858–002865. [Google Scholar]
- Pulipaka, S.; Kumar, R. Comparison of som and conventional neural network data division for pv reliability power prediction. In Proceedings of the 2017 IEEE International Conference on Environment and Electrical Engineering and 2017 IEEE Industrial and Commercial Power Systems Europe (EEEIC/I&CPS Europe), Milan, Italy, 6–9 June 2017; pp. 1–5. [Google Scholar]
- Alzahrani, A.; Shamsi, P.; Dagli, C.; Ferdowsi, M. Solar irradiance forecasting using deep neural networks. Procedia Comput. Sci. 2017, 114, 304–313. [Google Scholar] [CrossRef]
- Engelbrecht, A.P. Computational Intelligence: An Introduction; John Wiley & Sons: Hoboken, NJ, USA, 2007. [Google Scholar]
- Amjady, N.; Keynia, F.; Zareipour, H. Short-term load forecast of microgrids by a new bilevel prediction strategy. IEEE Trans. Smart Grid 2010, 1, 286–294. [Google Scholar] [CrossRef]
- Hu, Y.-L.; Chen, L. A nonlinear hybrid wind speed forecasting model using LSTM network, hysteretic ELM and Differential Evolution algorithm. Energy Convers. Manag. 2018, 173, 123–142. [Google Scholar] [CrossRef]
- Lin, K.-P.; Pai, P.-F.; Ting, Y.-J. Deep belief networks with genetic algorithms in forecasting wind speed. IEEE Access 2019, 7, 99244–99253. [Google Scholar] [CrossRef]
- Wang, Y.; Shen, Y.; Mao, S.; Cao, G.; Nelms, R.M. Adaptive learning hybrid model for solar intensity forecasting. IEEE Trans. Ind. Inform. 2018, 14, 1635–1645. [Google Scholar] [CrossRef]
- Ullah, K.; Hafeez, G.; Khan, I.; Jan, S.; Javaid, N. A multi-objective energy optimization in smart grid with high penetration of renewable energy sources. Appl. Energy. 2021, 299, 117104. [Google Scholar] [CrossRef]
- Chang, G.; Lu, H.; Chang, Y.; Lee, Y. An improved neural network-based approach for short-term wind speed and power forecast. Renew. Energy 2017, 105, 301–311. [Google Scholar] [CrossRef]
- Griesshaber, W.; Sick, F. Simulation of Hydrogen–Oxygen–Systems with PV for the Self-Sufficient Solar House; FhG-ISE: Freiburg im Breisgau, Germany, 1991. (In Germany) [Google Scholar]
- Havre, K.; Borg, P.; Tommerberg, K. Modeling and control of pressurized electrolyzer for operation in stand alone power systems. In Proceedings of the Second Nordic Symposium on Hydrogen and Fuel Cells for Energy Storage, Helsinki, Finland, 19–20 January 1995; pp. 63–78. [Google Scholar]
- Vanhanen, J. On the Performance Improvements of Small-Scale Photovoltaic-Hydrogen Energy Systems. Ph.D. Thesis, Helsinki University of Technology, Espoo, Finland, 1996. [Google Scholar]
- Hug, W.; Divisek, J.; Mergel, J.; Seeger, W.; Steeb, H. Highly efficient advanced alkaline electrolyzer for solar operation. Int. J. Hydrog. Energy 1992, 17, 699–705. [Google Scholar] [CrossRef]
- Zhou, L.; Zhou, Y. Determination of compressibility factor and fugacity coefficient of hydrogen in studies of adsorptive storage. Int. J. Hydrog. Energy 2001, 26, 597–601. [Google Scholar] [CrossRef]
- Nascimento, M.A.R.; Rodrigues, L.O.; Santos, E.C.; Gomes, E.E.B.; Dias, F.L.G.; Velásques, E.I.G.; Carrillo, R.A.M. Micro gas turbine engine: A review. Prog. Gas Turbine Perform. 2013, 5, 107–141. [Google Scholar]
- Aslam, S.; Javaid, N.; Asif, M.; Iqbal, U.; Iqbal, Z.; Sarwar, M.A. A mixed integer linear programming based optimal home energy management scheme considering gridconnected microgrids. In Proceedings of the 14th International Wireless Communications & Mobile Computing Conference (IWCMC), Limassol, Cyprus, 25–29 June 2018; pp. 993–998. [Google Scholar]
- Shirazi, E.; Jadid, S. Optimal residential appliance scheduling under dynamic pricing scheme via hemdas. Energy Build. 2015, 93, 40–49. [Google Scholar] [CrossRef]
- Aslam, S.; Herodotou, H.; Mohsin, S.M.; Javaid, N.; Ashraf, N.; Aslam, S. A survey on deep learning methods for power load and renewable energy forecasting in smart microgrids. Appl. Energy 2021, 144, 110992. [Google Scholar]


| References | Sources | Storage | Objective(s) | Proposed Algorithm |
|---|---|---|---|---|
| [14] | RES + CG | ESS + MGT | Reducing PAR, minimizing cost, maximizing user comfort | MILP |
| [15] | RES + CG | ESS | Minimizing cost and PAR | Game-theory framework |
| [16] | RES + CG | ESS | Reducing electricity cost | MILP |
| [17] | RES + CG | ESS | Reducing electricity cost | MILP |
| [18] | RES + CG | ESS | Short term energy demands | PGCC and MILP |
| [19] | RES + CG | ESS | Issues faced by prosumer | PEMS and MILP |
| [20] | RES + CG | ESS | Saving consumer cost | MILP |
| [21] | RES + CG | ESS | Electricity price varying | MPC |
| [22] | RES + CG | ESS | Minimizing electricity cost | PI and ANFIS |
| [23] | RES + CG | ESS | Minimizing electricity cost | DMPC |
| [24] | RES + CG | ESS | Reducing electricity cost | MPC |
| [25] | RES + CG | ESS | Reducing green house gases emissions | MPC |
| [26] | RES + CG | ESS | Energy-saving and gain | MPC |
| [27] | RES + CG | ESS | Carbon emission, energy consumption and reducing electricity cost | GA |
| [28] | RES + CG | ESS | Cost minimization, maximize comfort level | Control algorithm |
| [29] | RES + CG | ESS | Minimizing cost and PAR and economic dispatch | GA and MILP |
| [30] | RES + CG | ESS | Minimizing PAR and cost | ACO algorithm |
| [31] | Reducing PAR cost, and consumer delay time | GmEDE | ||
| [32] | RES + CG | ESS | Minimizing electricity cost | FA |
| [33] | RES + CG | ESS | Minimize cost and high level of user satisfaction | GWASA |
| [34] | RES + CG | ESS | Reducing PAR and increase user comfort level | CSUA |
| [49] | RES + CG | ESS | Minimizing cost and PAR | GA, GWO, mEDE and GmGWO |
| [50] | RES + CG | ESS | Issues of EVs integration smart grid | DES |
| [35] | RES + CG | ESS | Cost minimization | IoT-based system |
| [51] | RES + CG | ESS | Minimizing cost and reducing PAR | Aquifer Thermal Energy Storage (ATES) |
| [36] | RES + CG | ESS | Reducing electricity cost | Hierarchical architecture |
| [37] | RES + CG | ESS | TCLs electricity consumption scheduling and minimizing RES fluctuation | Game-Theoretic Demand Side Management |
| [52] | RES + CG | ESS + BES | Minimizing cost and PAR | GA and PSO and ACO |
| [38] | RES + CG | ESS | Minimizing cost and User comfort level | Distributed storage strategy |
| [39] | RES + CG | ESS | Minimizing cost and PAR | HGACO |
| [40] | RES + CG | ESS | VPPM | XMPP based IEC 61850 communication |
| [41] | RES + CG | ESS | Accurate data for state changing | Privacy-preserving technique |
| [42] | RES + CG | ESS | Predicting future energy demands using GA | Game-theory based fuzzy logic |
| [43] | RES + CG | ESS | BES on the functioning of power systems | CSA |
| [44] | RES + CG | ESS | Maximizing their payoffs | Stackelberg game theoretic framework |
| [45] | RES + CG | ESS | Energy flexibility of distributed energy resources | ANN |
| [46] | RES + CG | ESS | Lowering Consumer’s electricity cost | MDP |
| [47] | RES + CG | ESS | Reactive islanded power flow | PCC |
| [48] | RES + CG | ESS | Energy Balance and flexible loads | Multilayer individual-based optimization algorithm |
| Technique | Parameters | Values |
|---|---|---|
| Number of Ants | 15 | |
| Maximum number of Iterations | 250 | |
| Ant Colony Optimization | Evaporation Rate | 7 |
| Pheromone Factor | 3 | |
| Stopping criteria | When Maximum iteration reached |
| Category | Appliance | EST (h) | LFT (h) | LOT (h) | Power (kw) |
|---|---|---|---|---|---|
| Dishwasher | 09:00 | 17:00 | 7 | 2.4 | |
| Dryer | 13:00 | 18:00 | 5 | 2.5 | |
| Electrically Controllable Appliances | Washing Machine | 09:00 | 17:00 | 8 | 2 |
| Pump | 12:00 | 19:00 | 9 | 1 | |
| EV | 18:00 | 8:00 | 15 | 3.5 | |
| Thermostatically Controllable Appliances | Heater | 09:00 | 19:00 | 6 | 2.4 |
| Fridge | 00:00 | 24:00 | 24 | 0.5 | |
| Freezer | 09:00 | 20:00 | 10 | 0.3 | |
| AC | 08:00 | 16:00 | 3 | 0.7 | |
| Optically Controllable Appliances | Lighting | 19:00 | 24:00 | 6 | 0.84 |
| Category | Appliances | 1 | 2 | 3 | 4 | 5 | 6 | 7 | 8 | 9 | 10 | 11 | 12 | 13 | 14 | 15 | 16 | 17 | 18 | 19 | 20 | 21 | 22 | 23 | 24 |
|---|---|---|---|---|---|---|---|---|---|---|---|---|---|---|---|---|---|---|---|---|---|---|---|---|---|
| ECAs | Dish Washer | 0 | 1 | 1 | 0 | 1 | 0 | 0 | 0 | 0 | 0 | 0 | 0 | 0 | 0 | 1 | 1 | 0 | 1 | 1 | 1 | 0 | 1 | 1 | 1 |
| Dryer | 0 | 1 | 1 | 0 | 0 | 0 | 0 | 0 | 0 | 0 | 0 | 0 | 0 | 0 | 0 | 1 | 1 | 0 | 1 | 1 | 0 | 1 | 1 | 1 | |
| Cloth Washer | 1 | 0 | 1 | 1 | 1 | 1 | 0 | 0 | 0 | 0 | 0 | 0 | 0 | 0 | 1 | 0 | 1 | 1 | 0 | 1 | 1 | 1 | 1 | 0 | |
| Pump | 1 | 0 | 1 | 1 | 1 | 1 | 0 | 0 | 0 | 0 | 0 | 0 | 0 | 0 | 1 | 0 | 1 | 1 | 0 | 1 | 1 | 1 | 1 | 0 | |
| EV | 1 | 0 | 1 | 1 | 1 | 1 | 0 | 0 | 0 | 0 | 0 | 0 | 0 | 0 | 1 | 0 | 1 | 1 | 0 | 1 | 1 | 1 | 1 | 0 | |
| TCAs | Heater | 0 | 0 | 0 | 0 | 0 | 0 | 0 | 0 | 0 | 0 | 0 | 0 | 0 | 0 | 0 | 0 | 0 | 0 | 1 | 0 | 1 | 0 | 1 | 0 |
| Fridge | 0 | 1 | 0 | 0 | 0 | 0 | 0 | 0 | 0 | 0 | 0 | 0 | 0 | 0 | 0 | 1 | 0 | 0 | 1 | 1 | 1 | 1 | 1 | 1 | |
| Freezer | 0 | 1 | 0 | 0 | 0 | 0 | 0 | 0 | 0 | 0 | 0 | 0 | 0 | 0 | 0 | 1 | 1 | 0 | 0 | 1 | 1 | 1 | 0 | 1 | |
| AC | 0 | 1 | 0 | 0 | 0 | 0 | 0 | 0 | 0 | 0 | 0 | 0 | 0 | 0 | 0 | 1 | 1 | 0 | 0 | 1 | 1 | 1 | 0 | 1 | |
| OCAs | Lighting | 0 | 1 | 0 | 0 | 0 | 0 | 0 | 0 | 0 | 0 | 0 | 0 | 0 | 0 | 0 | 1 | 1 | 0 | 0 | 1 | 1 | 1 | 0 | 1 |
Publisher’s Note: MDPI stays neutral with regard to jurisdictional claims in published maps and institutional affiliations. |
© 2021 by the authors. Licensee MDPI, Basel, Switzerland. This article is an open access article distributed under the terms and conditions of the Creative Commons Attribution (CC BY) license (https://creativecommons.org/licenses/by/4.0/).
Share and Cite
Albogamy, F.R.; Hafeez, G.; Khan, I.; Khan, S.; Alkhammash, H.I.; Ali, F.; Rukh, G. Efficient Energy Optimization Day-Ahead Energy Forecasting in Smart Grid Considering Demand Response and Microgrids. Sustainability 2021, 13, 11429. https://doi.org/10.3390/su132011429
Albogamy FR, Hafeez G, Khan I, Khan S, Alkhammash HI, Ali F, Rukh G. Efficient Energy Optimization Day-Ahead Energy Forecasting in Smart Grid Considering Demand Response and Microgrids. Sustainability. 2021; 13(20):11429. https://doi.org/10.3390/su132011429
Chicago/Turabian StyleAlbogamy, Fahad R., Ghulam Hafeez, Imran Khan, Sheraz Khan, Hend I. Alkhammash, Faheem Ali, and Gul Rukh. 2021. "Efficient Energy Optimization Day-Ahead Energy Forecasting in Smart Grid Considering Demand Response and Microgrids" Sustainability 13, no. 20: 11429. https://doi.org/10.3390/su132011429
APA StyleAlbogamy, F. R., Hafeez, G., Khan, I., Khan, S., Alkhammash, H. I., Ali, F., & Rukh, G. (2021). Efficient Energy Optimization Day-Ahead Energy Forecasting in Smart Grid Considering Demand Response and Microgrids. Sustainability, 13(20), 11429. https://doi.org/10.3390/su132011429