
Environmental and Economic Impact of Retrofitting Techniques to Prevent Out-of-Plane Failure Modes of Unreinforced Masonry Buildings


Abstract
:1. Introduction
2. Methodology
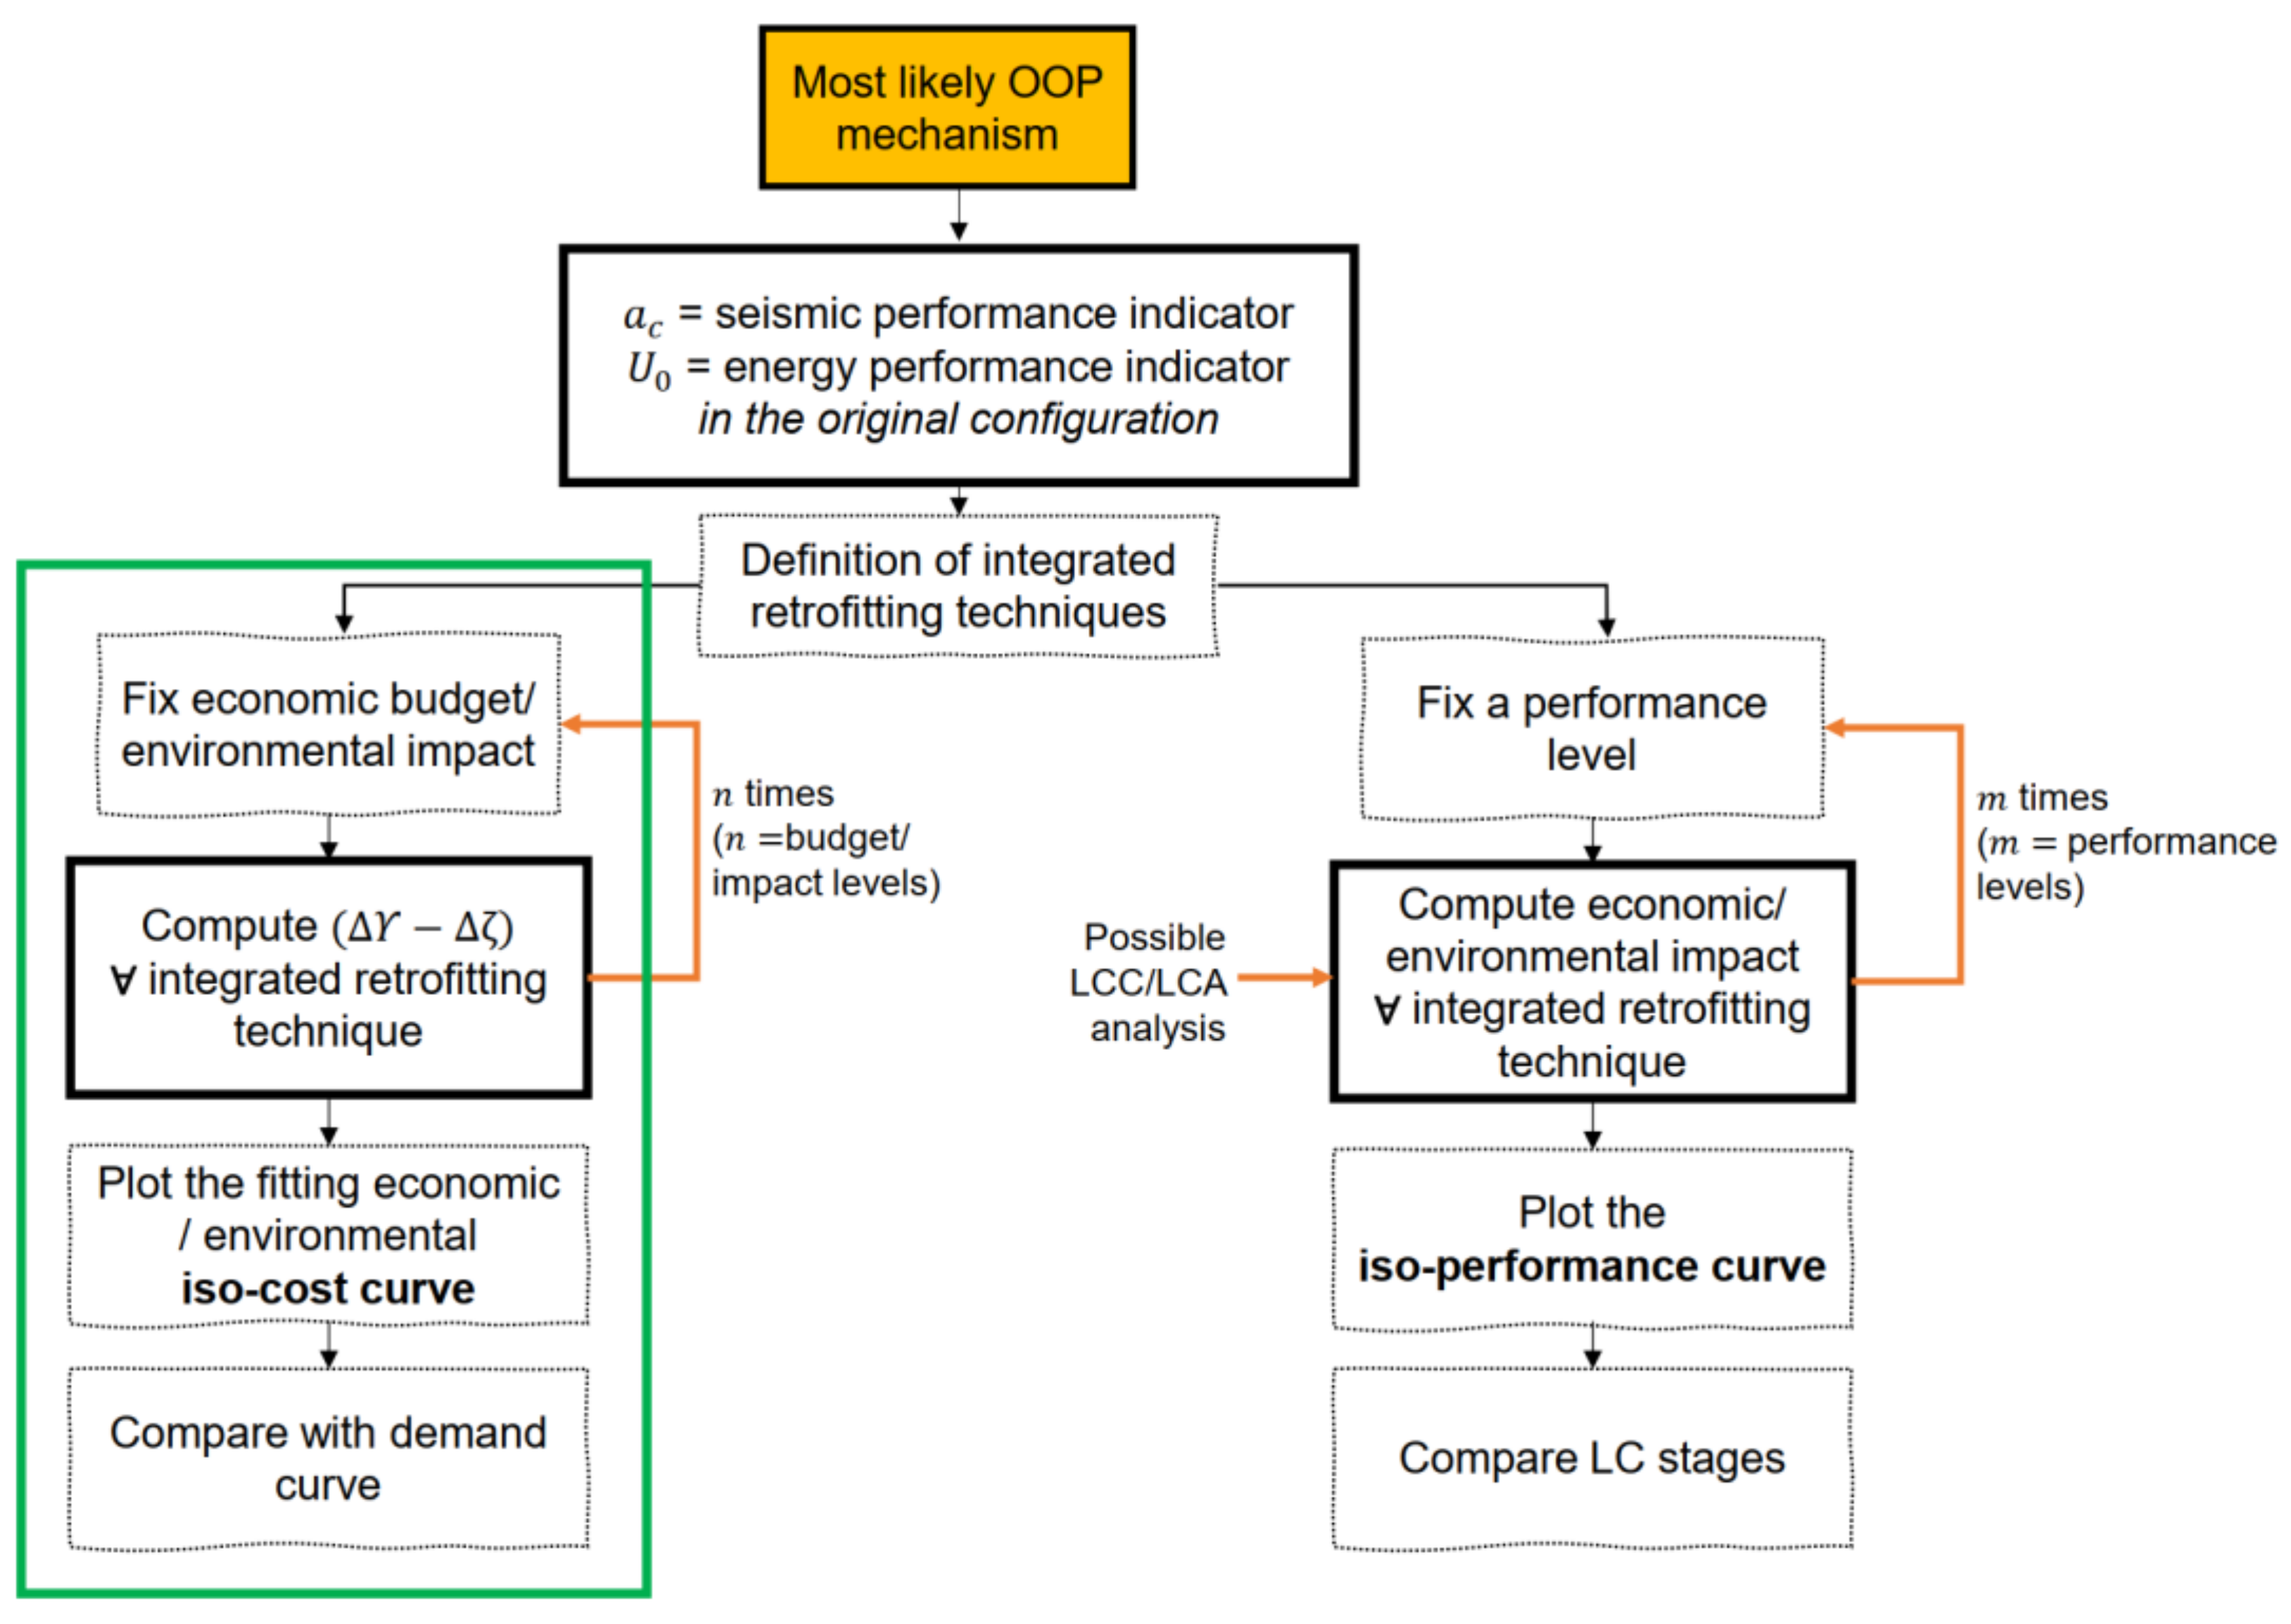
2.1. Analysis Steps
- Identification of the most likely OOP mechanism through the kinematic approach of limit analysis [29].
- Proposal of integrated solutions based on feasibility rules and on available materials nearby the construction site, duly considering the impact related to the transport phase.
- Linear/non-linear static and/or non-linear transient analysis in the actual and in the retrofitted configuration, for each integrated solution.
- Calculation of seismic and energy performance indicators to quantify the beneficial effects of each integrated solution.
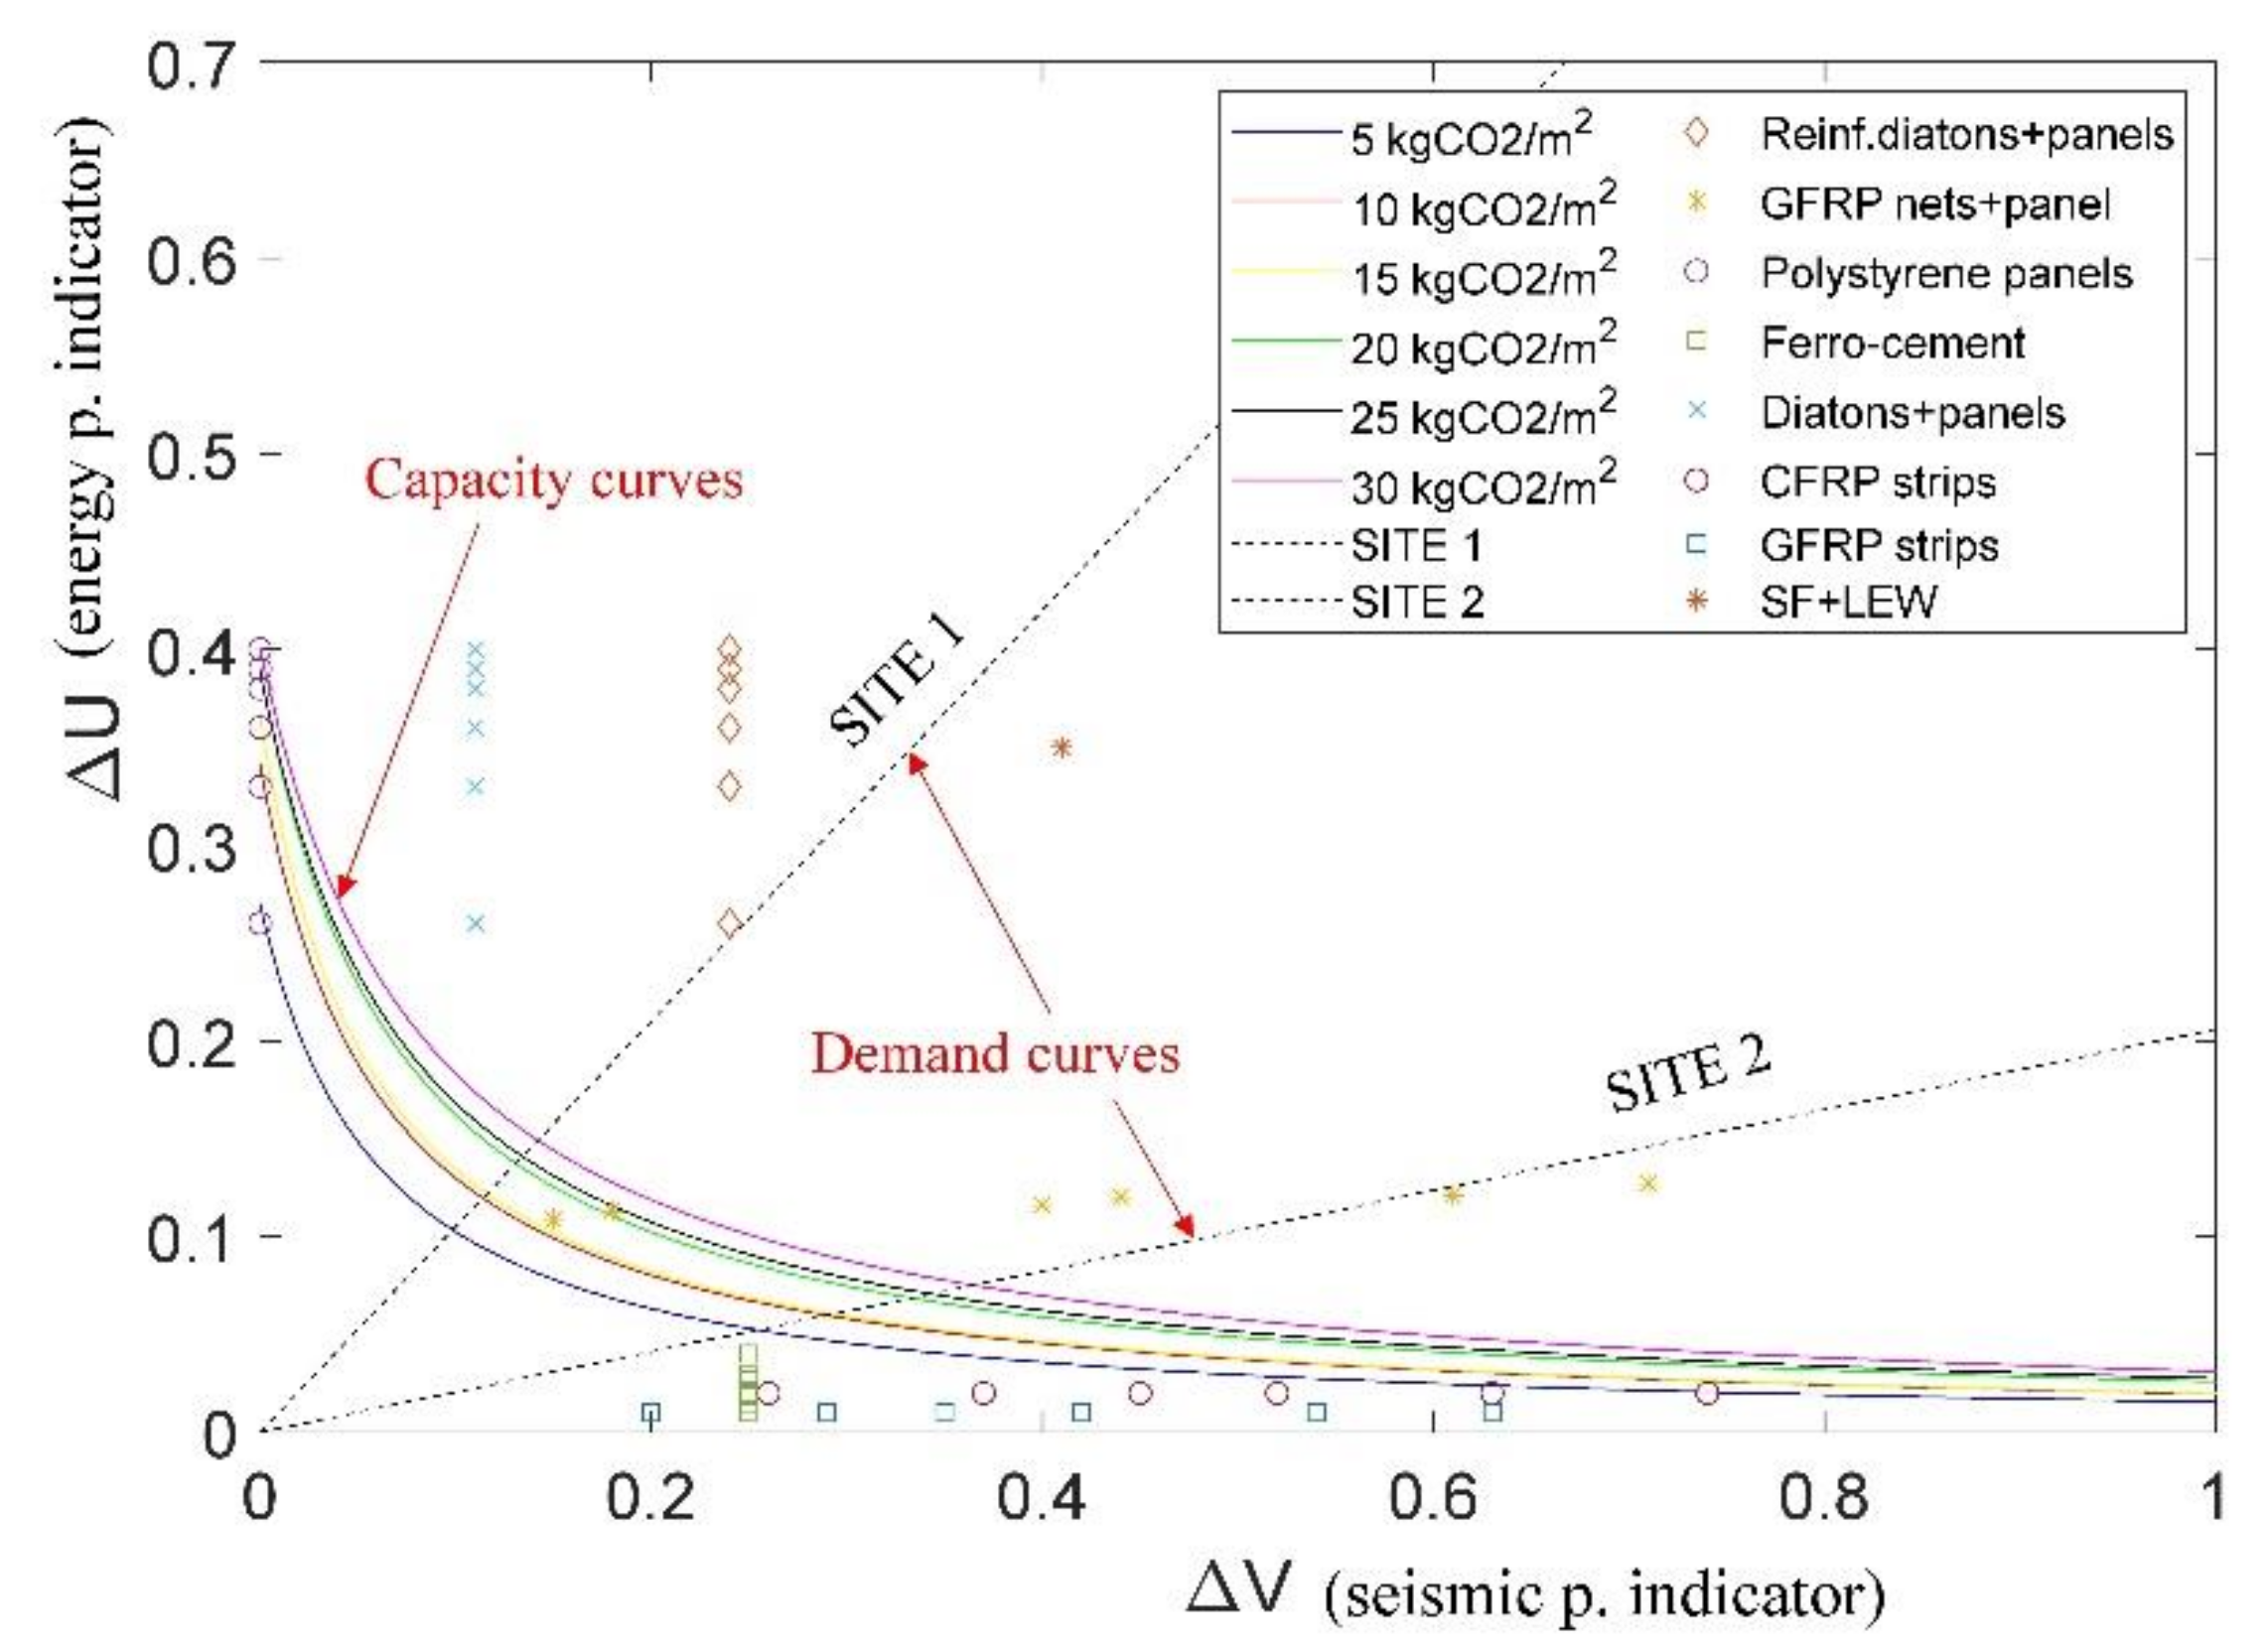
- Plot of iso-cost capacity and demand curves and/or of iso-performance curves to identify the optimal strategy for decision-makers.
- Iteration of steps 4–5 to include a simplified life cycle assessment and/or life cycle cost analysis of each integrated intervention.
2.2. Definition of Integrated Interventions
2.3. Seismic Performance Indicator
2.4. Energy Performance Indicator
- is the net area of the wall involved in the mechanism;
- is the unit thermal transmittance of the wall;
- is the total area of the windows;
- is the windows unit thermal transmittance;
- is the total length of the thermal bridge, and
- is the unit thermal transmittance of the thermal bridge, as provided by EN ISO 10211:2017 [50].
2.5. Economic and Environmental Iso-Cost Curves
2.6. Life Cycle Cost Analysis of the Integrated Interventions
3. Case Study: Description and Performance Indicators
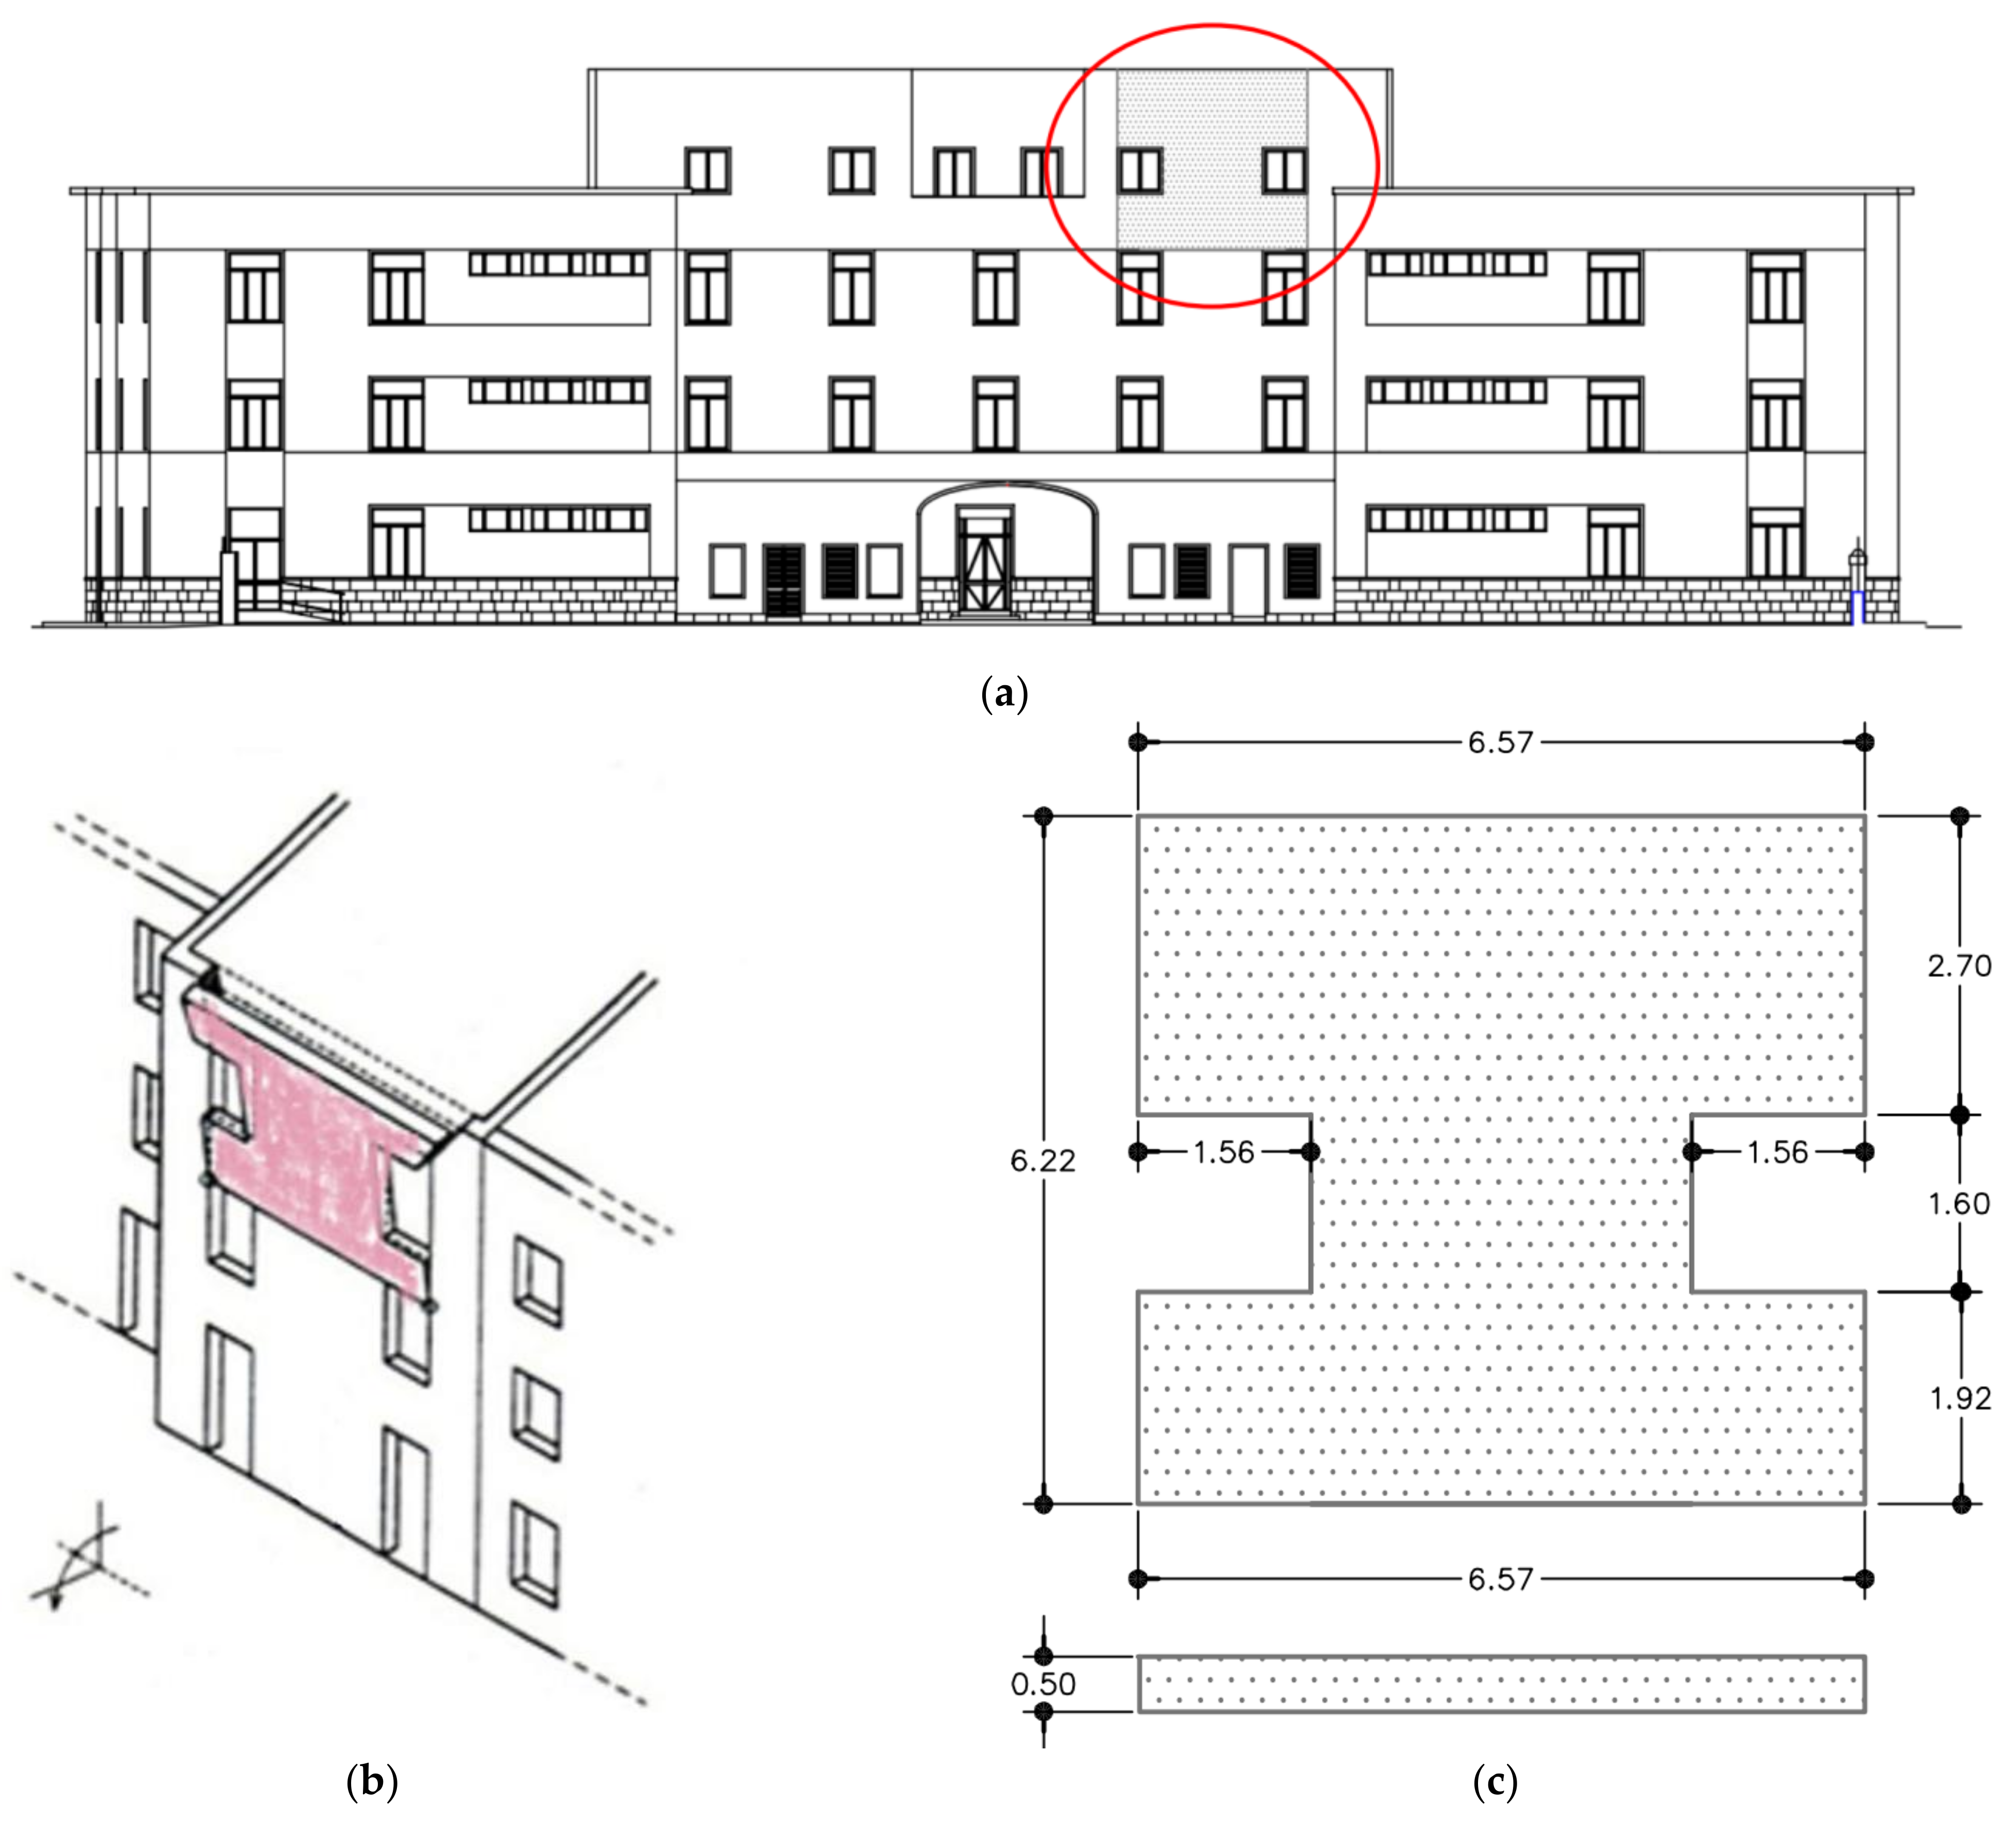
3.1. Description of the Case Study and Failure Mechanism
3.2. Integrated Interventions and Unit Costs
- (a)
- insulating panels alone (IP);
- (b)
- steel tie-rods with constant diameter plus insulating panels (tie-rods dconst + IP);
- (c)
- steel tie-rods with variable diameter plus insulating panels (tie-rods dvariable + IP);
- (d)
- carbon fiber reinforced polymer strips plus insulating panels (CFRP + IP).
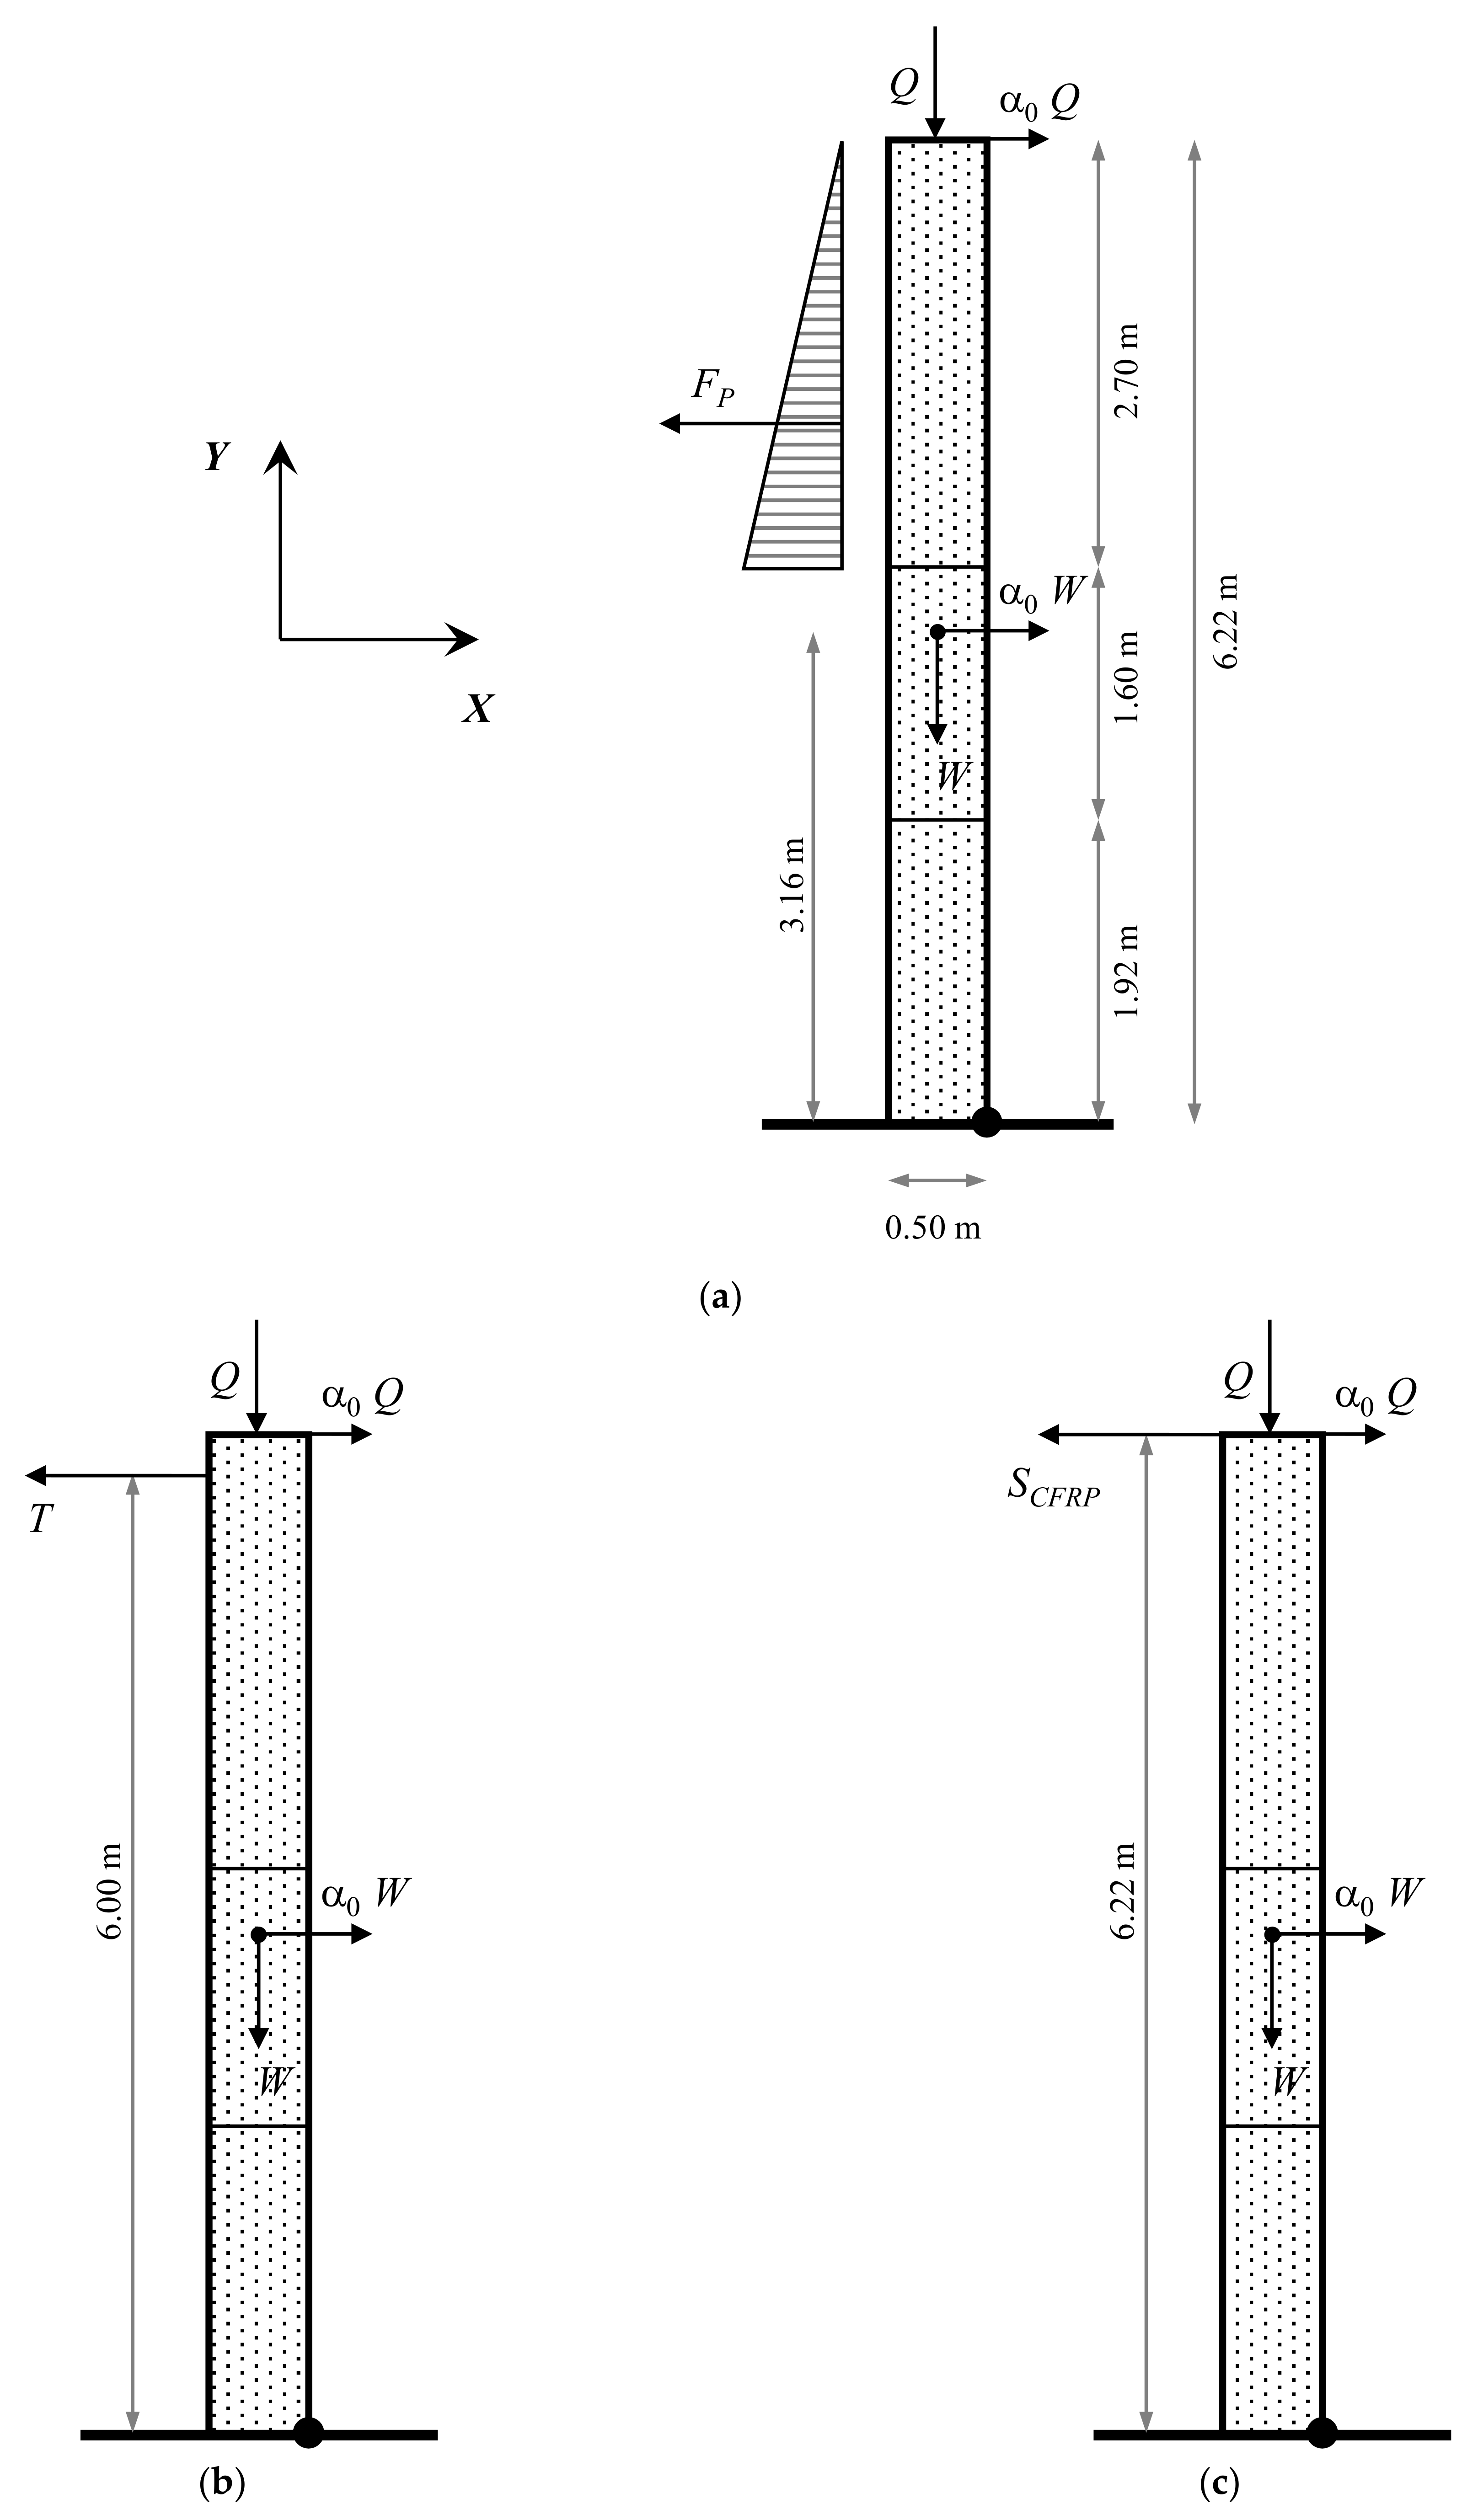
3.3. Seismic Analysis and Seismic Performance Indicators
- -
- , the self-weight of the wall portion under study;
- -
- , the overload applied to the wall top;
- -
- , the horizontal distance between the application point of the i-th force and the pivot point;
- -
- , the vertical distance between the application point of the i-th force and the pivot point;
- -
- , the frictional resistance along one upper edge of the wall;
- -
- , the pretension of the single tie-rod, 20% of the yielding force;
- -
- , the end debonding force provided by the single CFRP strip;
- -
- , the number of tie-rods;
- -
- , the number of CFRP strips.
3.4. Thermal Analysis and Energy Performance Indicators
4. Case Study: Economic and Environmental Analyses and Iso-Cost Curves
4.1. Analysis in Terms of Seismic Performance Indicators
4.1.1. Economic Analysis
4.1.2. Environmental Analysis
4.2. Analysis in Terms of Energy Performance Indicators
4.2.1. Economic Analysis
4.2.2. Environmental Analysis
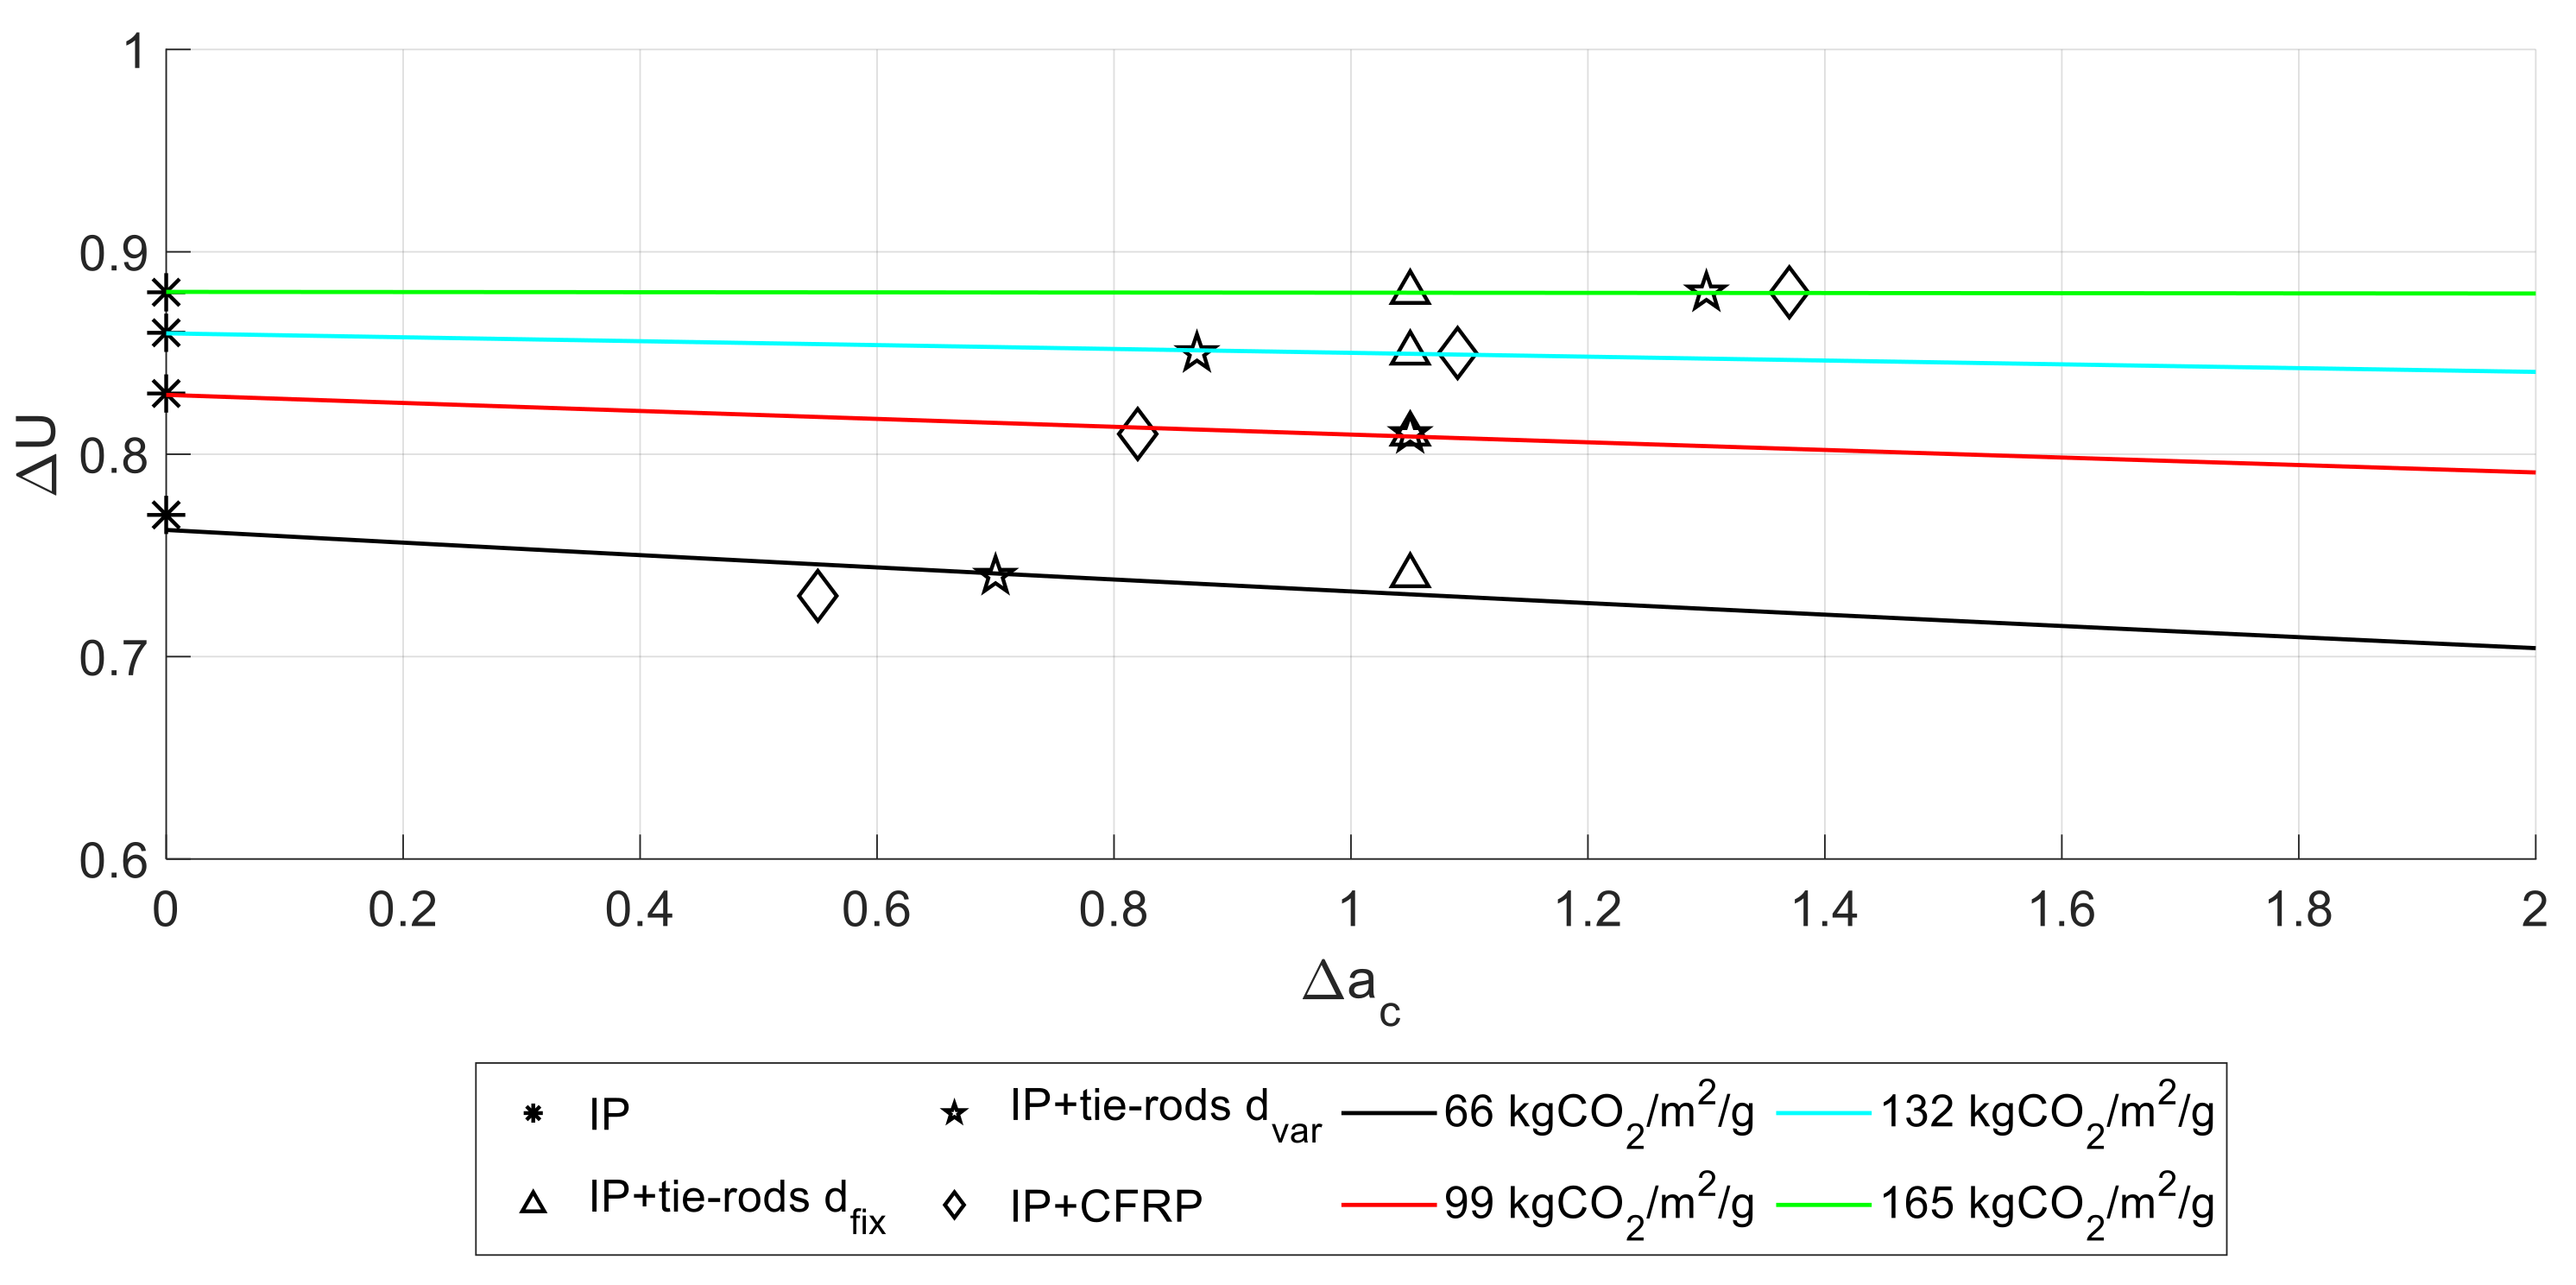
4.3. Economic and Environmental Iso-Cost Curves
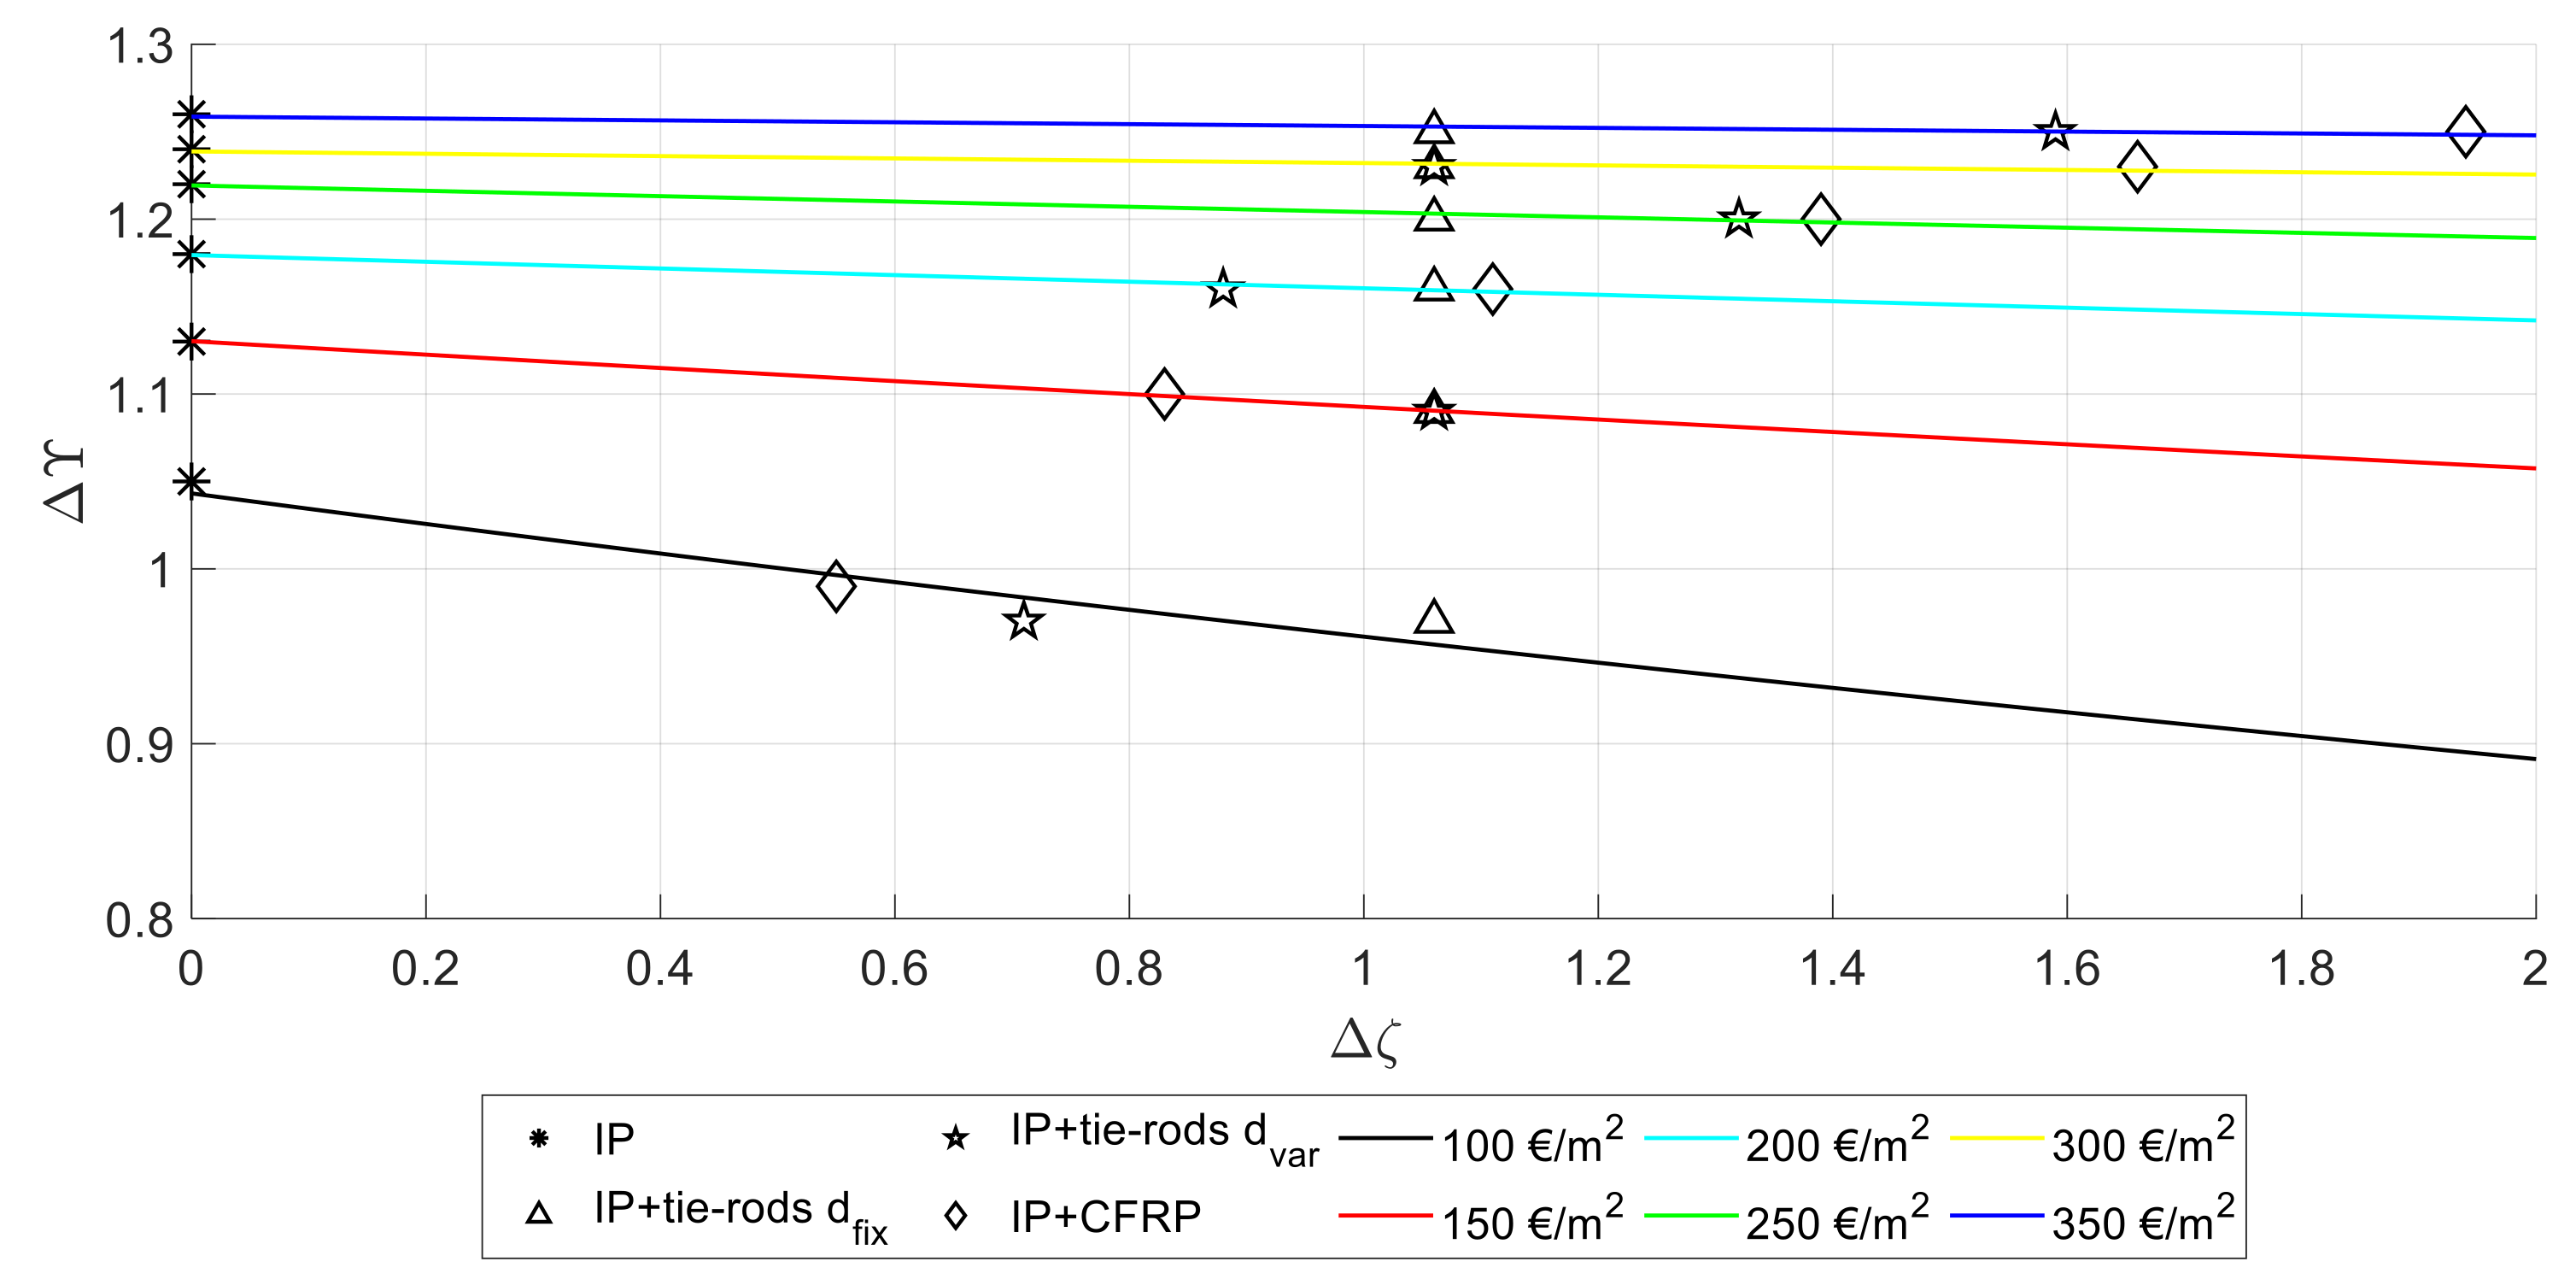
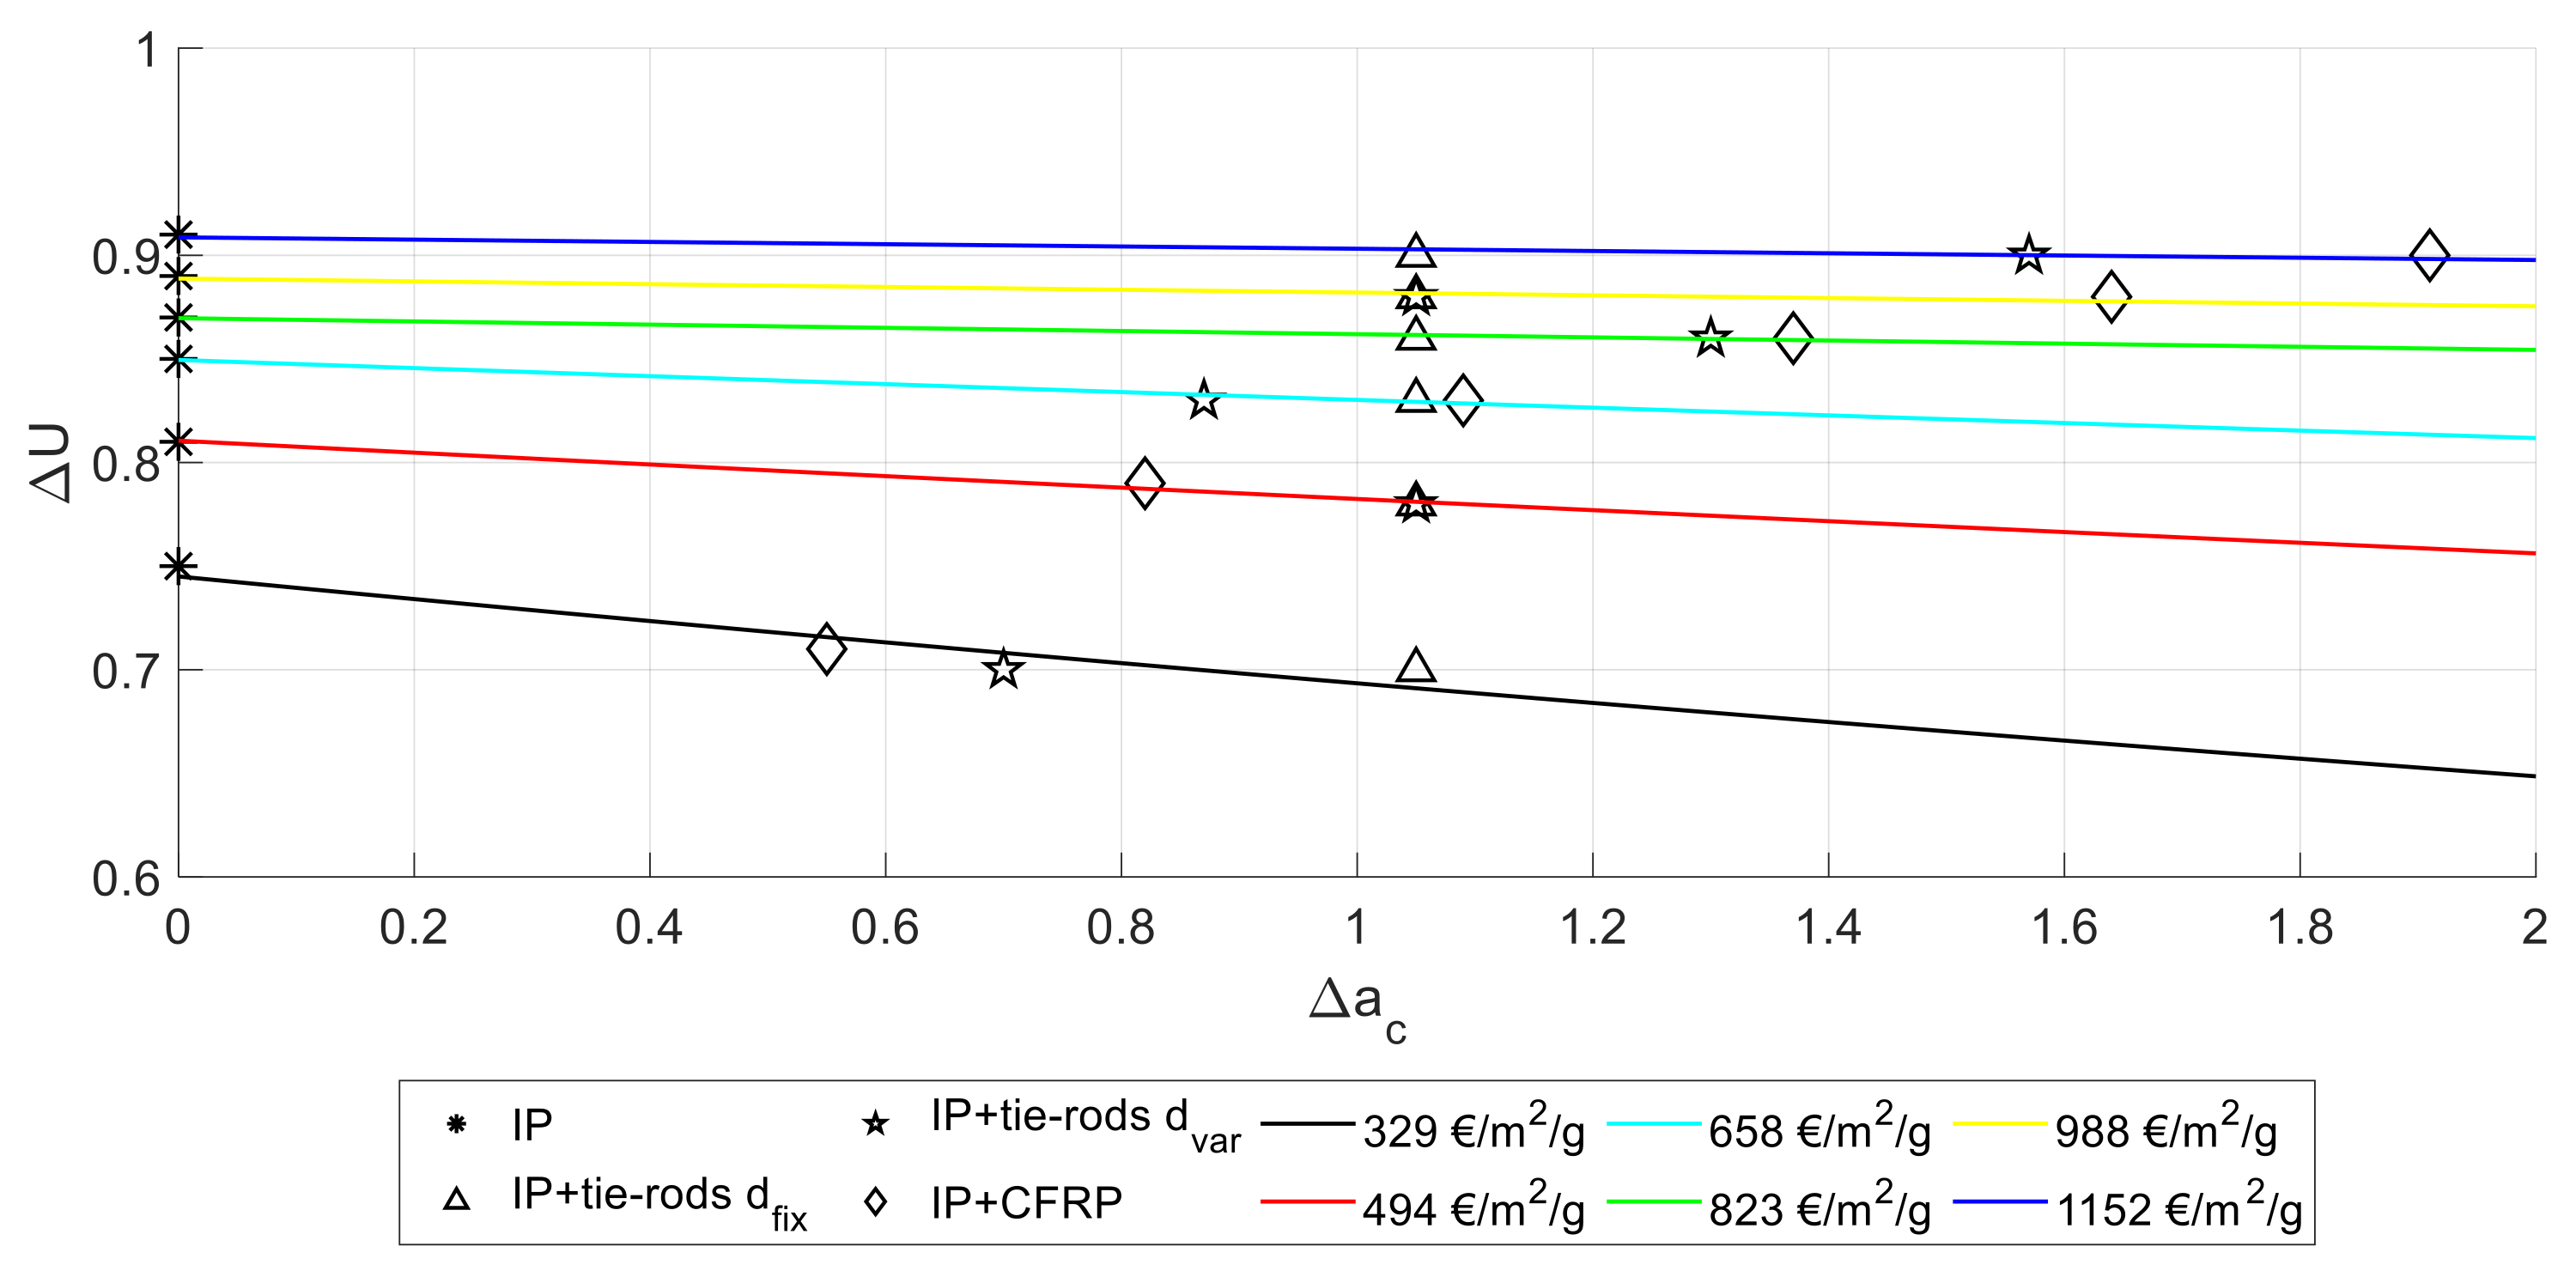
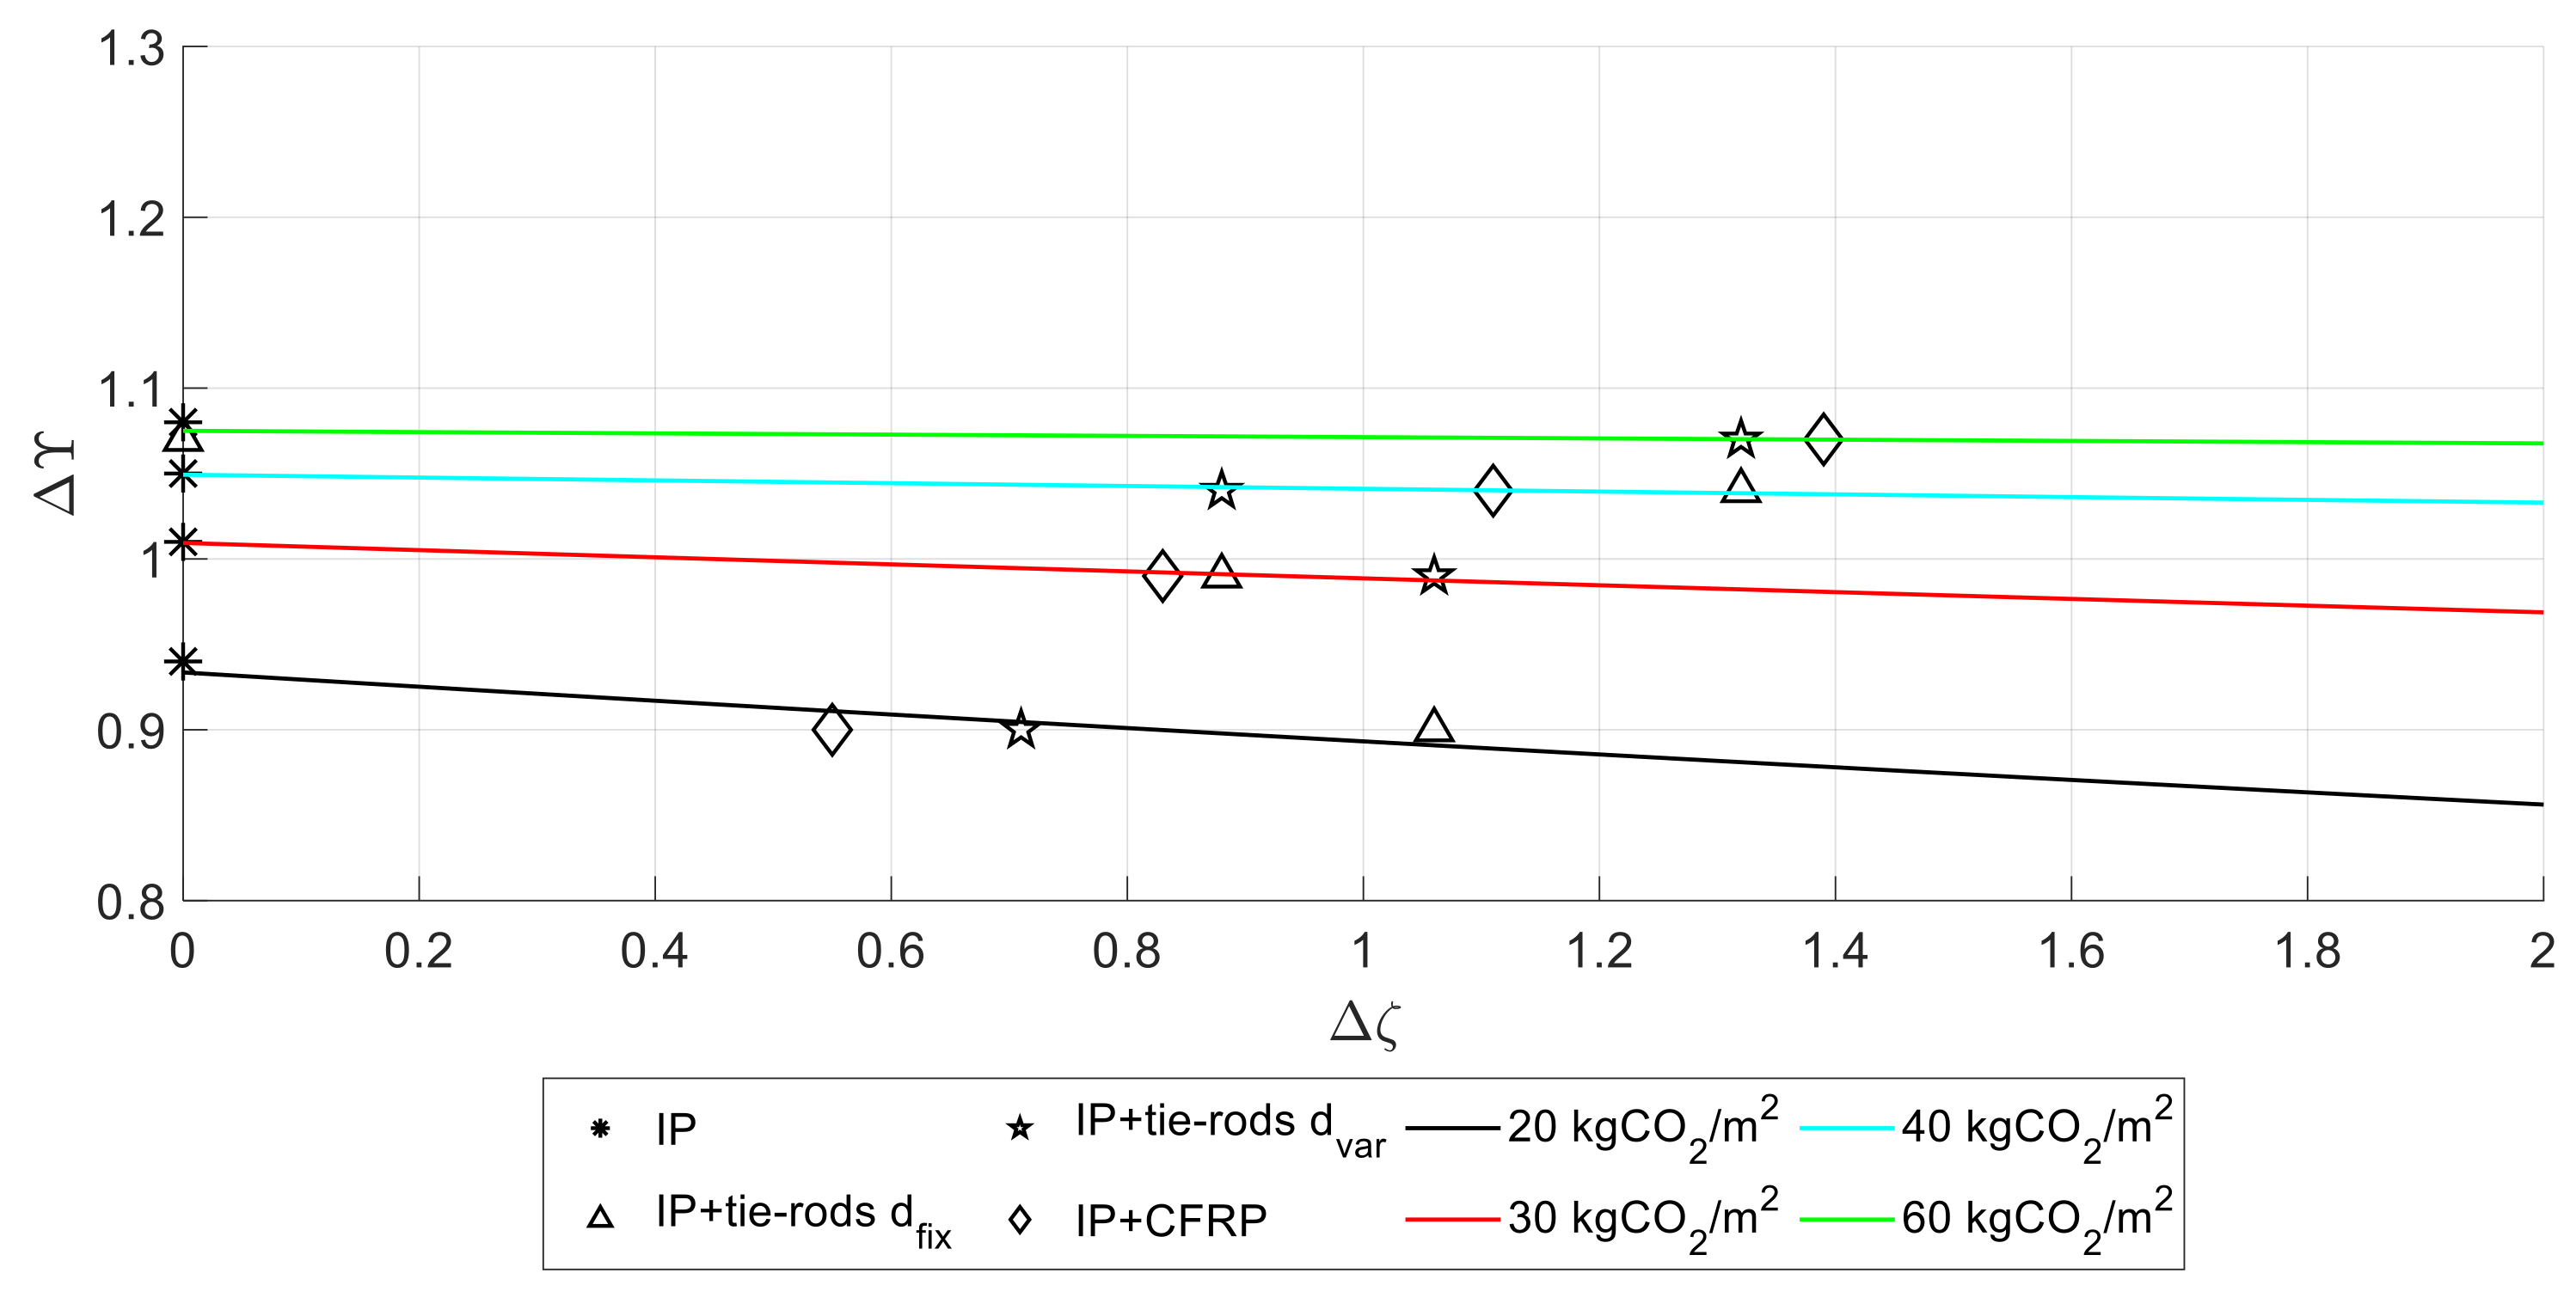
4.3.1. Relative Seismic and Energy Performance Indicators
- -
- when the economic budget is given, to identify the optimum integrated intervention, by determining the corresponding pair (for example by means of demand curves [14]);
- -
- when the pair is given, to determine the economic budget to be allocated, by determining the iso-cost curve passing by .
4.3.2. Absolute Seismic and Energy Performance Indicators
5. Discussion
- -
- for the seismic analysis;
- -
- for the thermal analysis.
6. Conclusions
Author Contributions
Funding
Data Availability Statement
Conflicts of Interest
References
- Shubbar, A.; Nasr, M.; Falah, M.; Al-Khafaji, Z. Towards net zero carbon economy: Improving the sustainability of existing industrial infrastructures in the UK. Energies 2021, 14, 5896. [Google Scholar] [CrossRef]
- Balasbaneh, A.T.; Yeoh, D.; Juki, M.I.; Gohari, A.; Abidin, A.R.Z.; Bin Marsono, A.K. Applying three pillar indicator assessments on alternative floor systems: Life cycle study. Int. J. Life Cycle Assess. 2021, 26, 1–17. [Google Scholar] [CrossRef]
- Trovato, M.R.; Nocera, F.; Giuffrida, S. Life-cycle assessment and monetary measurements for the carbon footprint reduction of public buildings. Sustainability 2020, 12, 3460. [Google Scholar] [CrossRef] [Green Version]
- Scrucca, F.; Ingrao, C.; Maalouf, C.; Moussa, T.; Polidori, G.; Messineo, A.; Arcidiacono, C.; Asdrubali, F. Energy and carbon footprint assessment of production of hemp hurds for application in buildings. Environ. Impact Assess. Rev. 2020, 84, 106417. [Google Scholar] [CrossRef]
- Bhutta, M.A.R.; Hussin, W.M.; Azreen, M.; Tahir, M.M. Sulphate resistance of geopolymer concrete prepared from blended waste fuel ash. J. Mater. Civ. Eng. 2014, 26, 4014080. [Google Scholar] [CrossRef]
- Göswein, V.; Silvestre, J.D.; Lamb, S.; Gonçalves, A.B.; Pittau, F.; Freire, F.; Oosthuizen, D.; Lord, A.; Habert, G. Invasive alien plants as an alternative resource for concrete production—Multi-scale optimization including carbon compensation, cleared land and saved water runoff in South Africa. Resour. Conserv. Recycl. 2021, 167, 105361. [Google Scholar] [CrossRef]
- Akbarnezhad, A.; Huan, M.; Mesgari, S.; Castel, A. Recycling of geopolymer concrete. Constr. Build. Mater. 2015, 101, 152–158. [Google Scholar] [CrossRef]
- Sassu, M.; Giresini, L.; Bonannini, E.; Puppio, M.L. On the use of vibro-compressed units with bio-natural aggregate. Buildings 2016, 6, 40. [Google Scholar] [CrossRef] [Green Version]
- Sassu, M.; Romanazzi, A.; Giresini, L.; Franco, W.; Ferraresi, C.; Quaglia, G.; Orefice, E. Production procedures and mechanical behaviour of interlocking stabilized compressed earth blocks (ISCEBs) manufactured using float ram 1.0 press. Eng. Solid Mech. 2018, 6, 89–104. [Google Scholar] [CrossRef]
- Croce, P. New frontiers of composites applications in heritage buildings: Repair of exposed masonry of St. Nicola Church in Pisa. J. Compos. Sci. 2021, 5, 218. [Google Scholar] [CrossRef]
- Vaccaro, P.A.; Galvín, A.P.; Ayuso, J.; Lozano-Lunar, A.; López-Uceda, A. Pollutant potential of reinforced concrete made with recycled plastic fibres from food packaging waste. Appl. Sci. 2021, 11, 8102. [Google Scholar] [CrossRef]
- Sassu, M.; Stochino, F.; Mistretta, F. Assessment method for combined structural and energy retrofitting in masonry buildings. Buildings 2017, 7, 71. [Google Scholar] [CrossRef] [Green Version]
- Giresini, L.; Paone, S.; Sassu, M. Integrated cost-analysis approach for seismic and thermal improvement of masonry building façades. Buildings 2020, 10, 143. [Google Scholar] [CrossRef]
- Giresini, L.; Stochino, F.; Sassu, M. Economic vs environmental isocost and isoperformance curves for the seismic and energy improvement of buildings considering Life Cycle Assessment. Eng. Struct. 2021, 233, 111923. [Google Scholar] [CrossRef]
- Menna, C.; Del Vecchio, C.; Di Ludovico, M.; Mauro, G.M.; Ascione, F.; Prota, A. Conceptual design of integrated seismic and energy retrofit interventions. J. Build. Eng. 2021, 38, 102190. [Google Scholar] [CrossRef]
- Croce, P.; Formichi, P.; Landi, F. Influence of reinforcing steel corrosion on life cycle reliability assessment of existing r.c. buildings. Buildings 2020, 10, 99. [Google Scholar] [CrossRef]
- Croce, P.; Formichi, P.; Landi, F.; Marsili, F. Climate change: Impact on snow loads on structures. Cold Reg. Sci. Technol. 2018, 150, 35–50. [Google Scholar] [CrossRef] [Green Version]
- Croce, P.; Formichi, P.; Landi, F. Climate change: Impacts on climatic actions and structural reliability. Appl. Sci. 2019, 9, 5416. [Google Scholar] [CrossRef] [Green Version]
- Croce, P.; Formichi, P.; Landi, F.; Mercogliano, P.; Bucchignani, E.; Dosio, A.; Dimova, S. The snow load in Europe and the climate change. Clim. Risk Manag. 2018, 20, 138–154. [Google Scholar] [CrossRef]
- Beconcini, M.L.; Croce, P.; Marsili, F.; Muzzi, M.; Rosso, E. Probabilistic reliability assessment of a heritage structure under horizontal loads. Probabilistic Eng. Mech. 2016, 45, 198–211. [Google Scholar] [CrossRef]
- Croce, P.; Beconcini, M.L.; Formichi, P.; Cioni, P.; Landi, F.; Mochi, C.; Giuri, R. Influence of mechanical parameters on non-linear static analysis of masonry buildings: A relevant case-study. Procedia Struct. Integr. 2018, 11, 331–338. [Google Scholar] [CrossRef]
- Beconcini, M.L.; Cioni, P.; Croce, P.; Formichi, P.; Landi, F.; Mochi, C. Non-linear static analysis of masonry buildings under seismic actions. International Institute of Informatics and Systemics. In Proceedings of the 22th World Multi-Conference on Systemics, Cybernetics and Informatics, Orlando, FL, USA, 8–11 July 2018; pp. 126–131, IMSCI 2018. ISBN 9781941763841. Available online: http://www.iiisci.org/Journal/CV$/sci/pdfs/EA239AY18.pdf (accessed on 15 September 2021).
- Lagomarsino, S.; Cattari, S. PERPETUATE guidelines for seismic performance-based assessment of cultural heritage masonry structures. Bull. Earthq. Eng. 2015, 13, 13–47. [Google Scholar] [CrossRef]
- Casapulla, C.; Argiento, L.U. The comparative role of friction in local out-of-plane mechanisms of masonry buildings. Pushover analysis and experimental investigation. Eng. Struct. 2016, 126, 158–173. [Google Scholar] [CrossRef]
- Casapulla, C. Local out-of-plane failure modes in traditional block-masonry buildings. In Masonry Construction in Active Seismic Regions; Rupakhety, R., Gautam, D., Eds.; Elsevier: Amsterdam, The Netherlands, 2021; pp. 289–322. ISBN 9780128210871. [Google Scholar] [CrossRef]
- Casapulla, C.; Giresini, L.; Argiento, L.U.; Maione, A. Nonlinear static and dynamic analysis of rocking masonry corners using rigid macro-block modeling. Int. J. Struct. Stab. Dyn. 2019, 19, 1950137. [Google Scholar] [CrossRef] [Green Version]
- Giresini, L. Design strategy for the rocking stability of horizontally restrained masonry walls. In Proceedings of the COMPDYN 2017 6th ECCOMAS Thematic Conference on Computational Methods in Structural Dynamics and Earthquake Engineering, Rhodes Island, Greece, 15–17 June 2017; Papadrakakis, M.F.M., Ed.; Volume 2, pp. 2963–2979. [Google Scholar] [CrossRef] [Green Version]
- Solarino, F.; Giresini, L. Fragility curves and seismic demand hazard analysis of rocking walls restrained with elasto-plastic ties. Earthq. Eng. Struct. Dyn. 2021, 50, 3602–3622. [Google Scholar] [CrossRef]
- Casapulla, C.; Argiento, L.U.; Maione, A.; Speranza, E. Upgraded formulations for the onset of local mechanisms in multi-storey masonry buildings using limit analysis. Structures 2021, 31, 380–394. [Google Scholar] [CrossRef]
- Solarino, F.; Oliveira, D.; Giresini, L. Wall-to-horizontal diaphragm connections in historical buildings: A state-of-the-art review. Eng. Struct. 2019, 199, 109559. [Google Scholar] [CrossRef]
- De Falco, A.; Giresini, L.; Sassu, M. Temporary preventive seismic reinforcements on historic churches: Numerical modeling of San Frediano in Pisa. Appl. Mech. Mater. 2013, 351–352, 1393–1396. [Google Scholar] [CrossRef]
- Giresini, L.; Puppio, M.L.; Taddei, F. Experimental pull-out tests and design indications for strength anchors installed in masonry walls. Mater. Struct. 2020, 53, 103. [Google Scholar] [CrossRef]
- Maione, A.; Casapulla, C.; Di Ludovico, M.; Prota, A.; Ceroni, F. Efficiency of injected anchors in connecting T–shaped masonry walls: A modelling approach. Constr. Build. Mater. 2021, 301, 124051. [Google Scholar] [CrossRef]
- Giresini, L.; Solarino, F.; Taddei, F.; Mueller, G. Experimental estimation of energy dissipation in rocking masonry walls restrained by an innovative seismic dissipator (LICORD). Bull. Earthq. Eng. 2021, 19, 2265–2289. [Google Scholar] [CrossRef]
- Giresini, L.; Taddei, F.; Solarino, F.; Mueller, G.; Croce, P. Influence of stiffness and damping parameters of passive seismic control devices in one-sided rocking of masonry walls. J. Struct. Eng. (ASCE) 2021, 19, 2265–2289. [Google Scholar] [CrossRef]
- Croce, P.; Landi, F.; Formichi, P. Probabilistic seismic assessment of existing masonry buildings. Buildings 2019, 9, 237. [Google Scholar] [CrossRef] [Green Version]
- Hu, M.A. Building life-cycle embodied performance index—The relationship between embodied energy, embodied carbon and environmental impact. Energies 2020, 13, 1905. [Google Scholar] [CrossRef] [Green Version]
- De Wolf, C.; Pomponi, F.; Moncaster, A. Measuring embodied carbon dioxide equivalent of buildings: A review and critique of current industry practice. Energy Build. 2017, 140, 68–80. [Google Scholar] [CrossRef]
- Cabeza, L.F.; Boquera, L.; Chàfer, M.; Vérez, D. Embodied energy and embodied carbon of structural building materials: Worldwide progress and barriers through literature map analysis. Energy Build. 2021, 231, 110612. [Google Scholar] [CrossRef]
- Brambilla, A.; Salvalai, G.; Imperadori, M.; Sesana, M.M. Nearly zero energy building renovation: From energy efficiency to environmental efficiency, a pilot case study. Energy Build. 2018, 166, 271–283. [Google Scholar] [CrossRef]
- Wei, H.H.; Shohet, I.M.; Skibniewski, M.J.; Shapira, S.; Yao, X. Assessing the lifecycle sustainability costs and benefits of seismic mitigation designs for buildings. J. Arch. Eng. 2016, 22, 04015011. [Google Scholar] [CrossRef]
- Caliò, I.; Marletta, M.; Pantò, B. A new discrete element model for the evaluation of the seismic behaviour of unreinforced masonry buildings. Eng. Struct. 2012, 40, 327–338. [Google Scholar] [CrossRef]
- Alecci, V.; De Stefano, M.; Focacci, F.; Luciano, R.; Rovero, L.; Stipo, G. Strengthening masonry arches with lime-based mortar composite. Buildings 2017, 7, 49. [Google Scholar] [CrossRef] [Green Version]
- Beconcini, M.; Croce, P.; Formichi, P.; Landi, F.; Puccini, B. Experimental evaluation of shear behavior of stone masonry wall. Materials 2021, 14, 2313. [Google Scholar] [CrossRef]
- Ministero delle Infrastrutture e dei Trasporti. Istruzioni per l’Applicazione dell’Aggiornamento delle ‘Norme Tecniche per le Costruzioni’ di cui al Decreto Ministeriale 17 Gennaio 2018; Circolare 21 gennaio 2019, n. 7 C.S.LL.PP.; Poligrafico dello Stato: Rome, Italy, 2019. (In Italian) [Google Scholar]
- Ministero delle Infrastrutture e dei Trasporti. Norme Tecniche per le Costruzioni”; Poligrafico dello Stato: Rome, Italy, 2018. (In Italian) [Google Scholar]
- Heyman, J. The stone skeleton. Int. J. Solids Struct. 1966, 2, 249–279. [Google Scholar] [CrossRef]
- EN ISO 6946:2017. Building Components and Building Elements—Thermal Resistance and Thermal Transmittance—Calculation Methods; CEN: Brussels, Belgium, 2017. [Google Scholar]
- EN ISO 10077 1:2017. Thermal Performance of Windows, Doors and Shutters—Calculation of Thermal Transmittance; CEN: Brussels, Belgium, 2017. [Google Scholar]
- EN ISO 10211:2017. Thermal Bridges in Building Construction—Heat Flows and Surface Temperatures—Detailed Calculations; CEN: Brussels, Belgium, 2017. [Google Scholar]
- EN 15804:2012+A2. Sustainability of Construction Works—Environmental Product Declarations—Core Rules for the Product Category of Construction Products; CEN: Brussels, Belgium, 2019. [Google Scholar]
- Caliò, I.; Occhipinti, G.; (University of Catania, Catania, Italy). Personal communication, 2021.
- National Research Council. CNR-DT 200 R1/2013: Guide for the Design and Construction of Externally Bonded FRP Systems for Strengthening Existing Structures; CNR—Advisory Committee on Technical Recommendations for Construction: Rome, Italy, 2013. [Google Scholar]
- Bulletin of unitary costs in Tuscany Region (Prezzario Lavori Pubblici Regione Toscana). Available online: http://prezzariollpp.regione.toscana.it/#2021 (accessed on 15 September 2021).
- One Click LCA—Computer Program; One Click LCA Ltd.: Helsinki, Finland, 2021.
- Stoiber, N.; Hammerl, M.; Kromoser, B. Cradle-to-gate life cycle assessment of CFRP reinforcement for concrete structures: Calculation basis and exemplary application. J. Clean. Prod. 2021, 280, 124300. [Google Scholar] [CrossRef]
- Specific Modulus. Available online: https://en.wikipedia.org/wiki/Specific_modulus (accessed on 6 October 2021).
- Sassoni, E.; Sarti, V.; Bellini, A.; Mazzotti, C.; Franzoni, E. The role of mortar joints in FRP debonding from masonry. Compos. Part B Eng. 2018, 135, 166–174. [Google Scholar] [CrossRef]
- Ceroni, F.; Ferracuti, B.; Pecce, M.; Savoia, M. Assessment of a bond strength model for FRP reinforcement externally bonded over masonry blocks. Compos. Part B Eng. 2014, 61, 147–161. [Google Scholar] [CrossRef]
- Gnip, I.; Vėjelis, S.; Vaitkus, S. Thermal conductivity of expanded polystyrene (EPS) at 10 °C and its conversion to temperatures within interval from 0 to 50 °C. Energy Build. 2012, 52, 107–111. [Google Scholar] [CrossRef]
- Ministero dello Sviluppo Economico. Requisiti Specifici per Gli Edifici Esistenti Soggetti a Riqualificazione Energetica—Appendice B; Poligrafico dello Stato: Rome, Italy, 2015. (In Italian) [Google Scholar]
- Eur/Dollar Change. Available online: https://www.ecb.europa.eu/stats/policy_and_exchange_rates/euro_reference_exchange_rates/html/eurofxref-graph-usd.en.html (accessed on 6 October 2021).
- Mistretta, F.; Stochino, F.; Sassu, M. Structural and thermal retrofitting of masonry walls: An integrated cost-analysis approach for the Italian context. Build. Environ. 2019, 155, 127–136. [Google Scholar] [CrossRef]
- Giresini, L.; Butenweg, C. Earthquake resistant design of structures according to Eurocode 8. In Structural Dynamics with Applications in Earthquake and Wind Engineering; Springer: Berlin/Heidelberg, Germany, 2019; pp. 197–358. [Google Scholar]


| Cost | IP tIP = 100 mm | No. 2 Tie-Rods d = 22 mm | CFRP | Plaster Removal |
|---|---|---|---|---|
| Economic (€/m2) | 190 | 12 1 | 350 | 10.0 |
| Environmental (kgCO2eq/m2) | 34 | 22 1 | 18.4 2 | 3.4 |
| Site Parameters (ULS) | |||||
| (s) | (s) | (s) | |||
| 0.2 | 2.36 | 1.42 | 0.2 | 0.6 | 2.4 |
| Spectral Parameters (ULS) | |||||
| (%) | (s) | (m/s2) (Equation (9)) | (m/s2) (Equation (7)) | ||
| 5 | 1.33 | 0.68 | 0.458 | 6.58 | 2.98 |
| Masonry Wall | |||||
| (kN/m3) | (m) | (m) | (m) | ||
| 19 | 0.5 | 0.2 | 0.2 | 13 | 0.6 |
| Steel Tie-Rods | |||||
| (MPa) | (mm2) | ||||
| 205 | 254.47 | ||||
| CFRP Strips (Uniaxial 300 g/m2) | |||||
| (mm) | (mm) | (MPa) [57] * | (MPa) | (MPa) | |
| 200 | 0.17 | 83848 | 18 | 1.8 | 0.015 |
| Forces (kN) | (m) | (m) |
|---|---|---|
| 0.25 | 3.16 | |
| 0.25 | 6.22 | |
| (Equation (11)) | - | 4.42 |
| (Equation (12)) | - | 6.00 |
| (Equation (13)) | - | 6.22 |
| Wall Configuration | (Equation (10)) | (m/s2) (Equation (6)) | (m/s2) (Equation (7)) | (Equation (1)) | (Equation (2)) |
|---|---|---|---|---|---|
| URW | 0.144 | 1.50 | 2.98 | - | - |
| RWT (2 ) | 0.294 | 3.07 | 2.98 | 1.05 | 1.06 |
| RWS (4 ) | 0.300 | 3.14 | 2.98 | 1.09 | 1.11 |
| Budget IP (€/m2) | tIP (m) | Area (m2) | tIP/λ = R (m2K/W) | R1 (m2K/W) | U1 (W/m2K) | ∆U |
| 93.98 | 0.049 | 40.862 | 1.237 | 1.738 | 0.575 | 71% |
| 140.97 | 0.074 | 40.862 | 1.855 | 2.356 | 0.424 | 79% |
| 187.96 | 0.099 | 40.862 | 2.473 | 2.975 | 0.336 | 83% |
| 234.95 | 0.124 | 40.862 | 3.091 | 3.593 | 0.278 | 86% |
| 281.94 | 0.148 | 40.862 | 3.710 | 4.211 | 0.237 | 88% |
| 328.93 | 0.173 | 40.862 | 4.328 | 4.830 | 0.207 | 90% |
| Budget CFRP (€/m2) | ns | Cost | Cost/m2 | (m/s2) | (m/s2) | |
| 6.02 | 2 | 246.00 | 6.02 | 1.50 | 2.32 | 55% |
| 9.03 | 3 | 369.00 | 9.03 | 1.50 | 2.73 | 82% |
| 12.04 | 4 | 492.00 | 12.04 | 1.50 | 3.14 | 109% |
| 15.05 | 5 | 615.00 | 15.05 | 1.50 | 3.55 | 137% |
| 18.06 | 6 | 738.00 | 18.06 | 1.50 | 3.96 | 164% |
| 21.07 | 7 | 861.00 | 21.07 | 1.50 | 4.37 | 191% |
| Budget IP (€/m2) | tIP (m) | Area (m2) | tIP/λ = R (m2K/W) | R1 (m2K/W) | U1 (W/m2K) | ∆U |
| 88.26 | 0.046 | 40.862 | 1.161 | 1.663 | 0.601 | 70% |
| 137.52 | 0.072 | 40.862 | 1.810 | 2.311 | 0.433 | 78% |
| 187.91 | 0.099 | 40.862 | 2.473 | 2.974 | 0.336 | 83% |
| 237.01 | 0.125 | 40.862 | 3.119 | 3.620 | 0.276 | 86% |
| 287.53 | 0.151 | 40.862 | 3.783 | 4.285 | 0.233 | 88% |
| 336.44 | 0.177 | 40.862 | 4.427 | 4.928 | 0.203 | 90% |
| Budget Tie-Rods (€/m2) | nT × d | Cost | Cost/m2 | (m/s2) | (m/s2) | |
| 11.74 | 2 × 18mm | 479.90 | 11.74 | 1.50 | 2.55 | 70% |
| 12.48 | 3 × 18mm | 509.85 | 12.48 | 1.50 | 3.07 | 105% |
| 12.09 | 2 × 20mm | 493.95 | 12.09 | 1.50 | 2.80 | 86% |
| 12.99 | 3 × 20mm | 530.92 | 12.99 | 1.50 | 3.45 | 130% |
| 12.47 | 2 × 22mm | 509.48 | 12.47 | 1.50 | 3.07 | 105% |
| 13.56 | 3 × 22mm | 554.21 | 13.56 | 1.50 | 3.85 | 157% |
| Tie-Rods dconst + IP | Tie-Rods dvariable + IP | CFRP + IP | |||||||
|---|---|---|---|---|---|---|---|---|---|
| Budget (€/m2) | (m/s2) | (m/s2) | (m/s2) | ||||||
| 100 | 3.07 | 1.05 | 1.06 | 2.55 | 0.70 | 0.71 | 2.32 | 0.55 | 0.56 |
| 150 | 3.07 | 1.05 | 1.06 | 3.07 | 1.05 | 1.06 | 2.73 | 0.82 | 0.83 |
| 200 | 3.07 | 1.05 | 1.06 | 2.80 | 0.86 | 0.88 | 3.14 | 1.09 | 1.11 |
| 250 | 3.07 | 1.05 | 1.06 | 3.45 | 1.30 | 1.32 | 3.55 | 1.37 | 1.39 |
| 300 | 3.07 | 1.05 | 1.06 | 3.07 | 1.05 | 1.06 | 3.96 | 1.64 | 1.66 |
| 350 | 3.07 | 1.05 | 1.06 | 3.85 | 1.57 | 1.59 | 4.37 | 1.91 | 1.94 |
| Tie-Rods dconst + IP | Tie-Rods dvariable + IP | CFRP + IP | |||||||
|---|---|---|---|---|---|---|---|---|---|
| Carbon Footprint (kgCO2eq/m2) | |||||||||
| 20 | 3.07 | 1.05 | 1.07 | 2.55 | 0.70 | 0.71 | 2.32 | 0.55 | 0.56 |
| 30 | 3.07 | 1.05 | 1.07 | 3.07 | 1.05 | 1.06 | 1.50 | 0.82 | 0.83 |
| 40 | 3.07 | 1.05 | 1.07 | 2.80 | 0.86 | 0.88 | 1.50 | 1.09 | 1.11 |
| 50 | 3.07 | 1.05 | 1.07 | 3.45 | 1.30 | 1.32 | 1.50 | 1.37 | 1.39 |
| IP | Tie-Rods dconst + IP | Tie-Rods dvariable + IP | CFRP + IP | |||||||||
|---|---|---|---|---|---|---|---|---|---|---|---|---|
| Budget (€/m2) | ||||||||||||
| 100 | 0.49 | 0.75 | 1.05 | 0.60 | 0.70 | 0.97 | 0.60 | 0.70 | 0.97 | 0.58 | 0.71 | 0.99 |
| 150 | 0.37 | 0.81 | 1.13 | 0.43 | 0.78 | 1.09 | 0.43 | 0.78 | 1.09 | 0.42 | 0.79 | 1.10 |
| 200 | 0.30 | 0.85 | 1.18 | 0.34 | 0.83 | 1.16 | 0.34 | 0.83 | 1.16 | 0.34 | 0.83 | 1.16 |
| 250 | 0.25 | 0.87 | 1.22 | 0.28 | 0.86 | 1.20 | 0.28 | 0.86 | 1.20 | 0.28 | 0.86 | 1.20 |
| 300 | 0.21 | 0.89 | 1.24 | 0.23 | 0.88 | 1.23 | 0.23 | 0.88 | 1.23 | 0.24 | 0.88 | 1.23 |
| 350 | 0.19 | 0.91 | 1.26 | 0.20 | 0.90 | 1.25 | 0.20 | 0.90 | 1.25 | 0.21 | 0.90 | 1.25 |
| IP | Tie-Rods dconst + IP | Tie-Rods dvariable + IP | CFRP + IP | |||||||||
|---|---|---|---|---|---|---|---|---|---|---|---|---|
| Carbon Footprint (kgCO2eq/m2) | ||||||||||||
| 20 | 0.46 | 0.77 | 0.94 | 0.52 | 0.74 | 0.90 | 0.52 | 0.74 | 0.90 | 0.53 | 0.73 | 0.90 |
| 30 | 0.35 | 0.83 | 1.01 | 0.38 | 0.81 | 0.99 | 0.38 | 0.81 | 0.99 | 0.38 | 0.81 | 0.99 |
| 40 | 0.28 | 0.86 | 1.05 | 0.30 | 0.85 | 1.04 | 0.30 | 0.85 | 1.04 | 0.30 | 0.85 | 1.04 |
| 50 | 0.23 | 0.88 | 1.08 | 0.24 | 0.88 | 1.07 | 0.24 | 0.88 | 1.07 | 0.25 | 0.88 | 1.07 |
Publisher’s Note: MDPI stays neutral with regard to jurisdictional claims in published maps and institutional affiliations. |
© 2021 by the authors. Licensee MDPI, Basel, Switzerland. This article is an open access article distributed under the terms and conditions of the Creative Commons Attribution (CC BY) license (https://creativecommons.org/licenses/by/4.0/).
Share and Cite
Giresini, L.; Casapulla, C.; Croce, P. Environmental and Economic Impact of Retrofitting Techniques to Prevent Out-of-Plane Failure Modes of Unreinforced Masonry Buildings. Sustainability 2021, 13, 11383. https://doi.org/10.3390/su132011383
Giresini L, Casapulla C, Croce P. Environmental and Economic Impact of Retrofitting Techniques to Prevent Out-of-Plane Failure Modes of Unreinforced Masonry Buildings. Sustainability. 2021; 13(20):11383. https://doi.org/10.3390/su132011383
Chicago/Turabian StyleGiresini, Linda, Claudia Casapulla, and Pietro Croce. 2021. "Environmental and Economic Impact of Retrofitting Techniques to Prevent Out-of-Plane Failure Modes of Unreinforced Masonry Buildings" Sustainability 13, no. 20: 11383. https://doi.org/10.3390/su132011383
APA StyleGiresini, L., Casapulla, C., & Croce, P. (2021). Environmental and Economic Impact of Retrofitting Techniques to Prevent Out-of-Plane Failure Modes of Unreinforced Masonry Buildings. Sustainability, 13(20), 11383. https://doi.org/10.3390/su132011383