Article

Developing Climate Resilience in Aridlands Using Rock Detention Structures as Green Infrastructure

by
Laura M. Norman
1,*,
Benjamin L. Ruddell
2,
Deborah J. Tosline
3,
Michael K. Fell
2,
Blair P. Greimann
4 and
Jay R. Cederberg
5
1
Western Geographic Science Center, U.S. Geological Survey, Tucson, AZ 85745, USA
2
School of Informatics, Computing, and Cyber Systems, Northern Arizona University, Flagstaff, AZ 86001, USA
3
Phoenix Area Office Bureau of Reclamation, Glendale, AZ 85306, USA
4
Denver Federal Center, Bureau of Reclamation, Denver, CO 80225, USA
5
Arizona Water Science Center, U.S. Geological Survey, Tucson, AZ 85745, USA
*
Author to whom correspondence should be addressed.
Sustainability 2021, 13(20), 11268; https://doi.org/10.3390/su132011268
Submission received: 31 August 2021 / Revised: 30 September 2021 / Accepted: 1 October 2021 / Published: 13 October 2021

Abstract

:
The potential of ecological restoration and green infrastructure has been long suggested in the literature as adaptation strategies for a changing climate, with an emphasis on revegetation and, more recently, carbon sequestration and stormwater management. Tree planting and “natural” stormwater detention structures such as bioswales, stormwater detention basins, and sediment traps are popular approaches. However, the experimental verification of performance for these investments is scarce and does not address rock detention structures specifically. This 3-year study investigates the infiltration, peak flow mitigation, and microclimate performance of a natural wash stormwater retention installation using one-rock dams in an urban park in Phoenix, Arizona, USA. Field data collected during the study do not depict change in the hydrogeomorphology. However, hydrologic modeling, using data collected from the field, portrays decreases in peak flows and increases in infiltration at the treated sites. Additionally, we observe a lengthening of microclimate cooling effects following rainfall events, as compared with the untreated sites. In this urban arid land setting, the prospect that rock detention structures themselves could reduce warming or heat effects is promising.

1. Introduction

People living in arid land regions are particularly vulnerable to extreme climate events, such as heat, drought, and flooding. According to climate change projections, global weather patterns and climate regimes will sustain increases in mean temperature and changes in patterns of precipitation, amongst other outcomes [1,2]. Land and resource managers are seeking solutions to adapt, mitigate, and respond to change and increase resilience for vulnerable populations. Green Infrastructure (GI) has been adopted to address challenges of global environmental change in urban areas. A GI using vegetation lowers air and surface temperatures, by providing shade, retaining water, and increasing evapotranspiration [3] and can also help manage stormwater. In a study of courtyards with shade trees and grass, a daytime temperature reduction of up to 2.5 °C was documented [4]. Urban parks and stormwater retention areas have dramatically lower surface temperatures during the day and dramatically lower air temperatures during the day–night transition due to evaporation in a Phoenix-area neighborhood [5].
In the Madrean Archipelago Ecoregion, southwestern United States, and Northern Mexico [6,7], restoration practitioners are installing rock detention structures (RDS) in rural and ex-urban settings to achieve similar benefits. The installation of RDS, ranging in size from small one-rock dams, to check dams, to large gabion structures, can stabilize erodible channels and increase flow volumes over time [8,9,10,11]. This infrastructure traps sediment in ephemeral streams to hold water and slowly release it in a more perennial fashion [8,11]. The sediment also provides a nutrient-rich environment for plants to grow [12]. Riparian vegetation can maintain or increase viability around structures [13,14]. This potential of RDS to provide ecosystem services, such as water provisioning, habitat provisioning, nutrient cycling, erosion control, flood prevention, and social values, has been explored in exurban areas [11]. RDS can also help mitigate some impacts of climate change. For example, riparian vegetation was shown to flourish around structures, despite drought conditions at Cienega San Bernardino [13,14]. Additionally, RDS store and sequester carbon [12]. One could infer that the increased vegetation at RDS would lower nearby temperatures and further sequester greenhouse gases. However, there have been no studies to test how RDS themselves could impact climate.
Microclimates are meteorological phenomena, ranging from a few centimeters to a few kilometers, that describe how the temperature, humidity, shortwave and thermal radiative loads, etc., of a specific place is distinct within the climate of a larger area. Microclimates are important especially to people, plants, and animals, because the microclimate is the “felt climate” that impacts health and well-being. For the purposes of the urban environment, microclimate exists at roughly the one-meter scale, which is the “human scale” at which the urban environment is constructed and managed [15,16]. Microclimate management is a well-known service of the urban landscape, especially urban landscapes that are intentionally crafted and expensively maintained, and has been shown to impact people’s health, for example by lowering heat in the residential yardscape, or by making playground temperatures cooler [17,18,19]. Surface materials, soil moisture, vegetation, shade, and water retention have significant effects on microclimate. We developed a study to test how RDS, when used as a GI in a semiarid urban landscape, would (i) impact stormwater and (ii) alter climate. This research builds on the work of others and provides insight into how RDS, an understudied GI tool, could be used as a local climate adaptation and peak flow mitigation management strategy.

Study Area

Phoenix, Arizona, USA, is in the northeast part of the Sonoran Desert and is the fifth largest city in the United States by population; it is one of the fastest-growing urban areas in the United States [20]. The City of Phoenix is also among the hottest of any major city in the U.S., characterized by long, hot summers, with an average high temperature of 41.2 °C, warm transitional seasons, and short, mild to chilly winters [21]. The mean temperatures are 1.8–2.2 °C warmer in the city limits due to urban heat island effect than in surrounding rural areas [22,23]. Average annual precipitation over the past 30 years is 204 mm (8.04 in [24]), most of which falls during the summer months, when North American Monsoon rains can cause flooding problems. Like the majority of western land in the United States, Phoenix has been in a drought episode that began around 2000 and is thought to be part of a bigger megadrought that will likely last for decades [25]. Government planning documents identify goals to develop the City’s local climate resilience to heat, drought, and flood, with plans to implement green infrastructure as a strategy [26].
The South Mountain Park is managed by the City of Phoenix and is the largest urban park in North America and is sacred to Native Americans. The maximum elevation in the park is 823 m (2700 ft). The steep mountains are a substantial source of runoff and associated sediment during heavy rainfalls. The Civilian Conservation Corps (CCC) built trails, dams, and other features in the area in the 1940s. The study area includes a small watershed (0.34 km2) at the base of South Mountain Park that includes Heard Scout Pueblo property and drains into the Colorado River basin (Figure 1). The site is comprised of eroded channels that convey storm flows and sediments into a downstream residential neighborhood.

2. Materials and Methods

This research examines the impacts of RDS on local hydrology, sediment, and temperature. Baseline rainfall/runoff response conditions were established before structures were installed. Innovative monitoring equipment, including video cameras/pressure transducers; digital terrain models; sediment samplers/sediment chains; soil moisture sensors/monitoring wells; and weather stations were established. In addition, small Unmanned Aircraft System (sUAS) surveys were completed to document geomorphology. A surface-water model was applied to track the flow of water and potential infiltration before and after RDS installations to simulate impacts. Tosline et al. [27] provided the suite of methodology used to instrument the reach.
Natural Channel Designs, Inc., a civil engineering, habitat restoration, and natural resource planning company, created a novel layout design to curb erosion and restore the wash, and completed RDS installations (one rock dams) in December 2018 (Figure 2). Additional rock plugs and simple rock structures were installed in eroded areas at the site in January 2019.

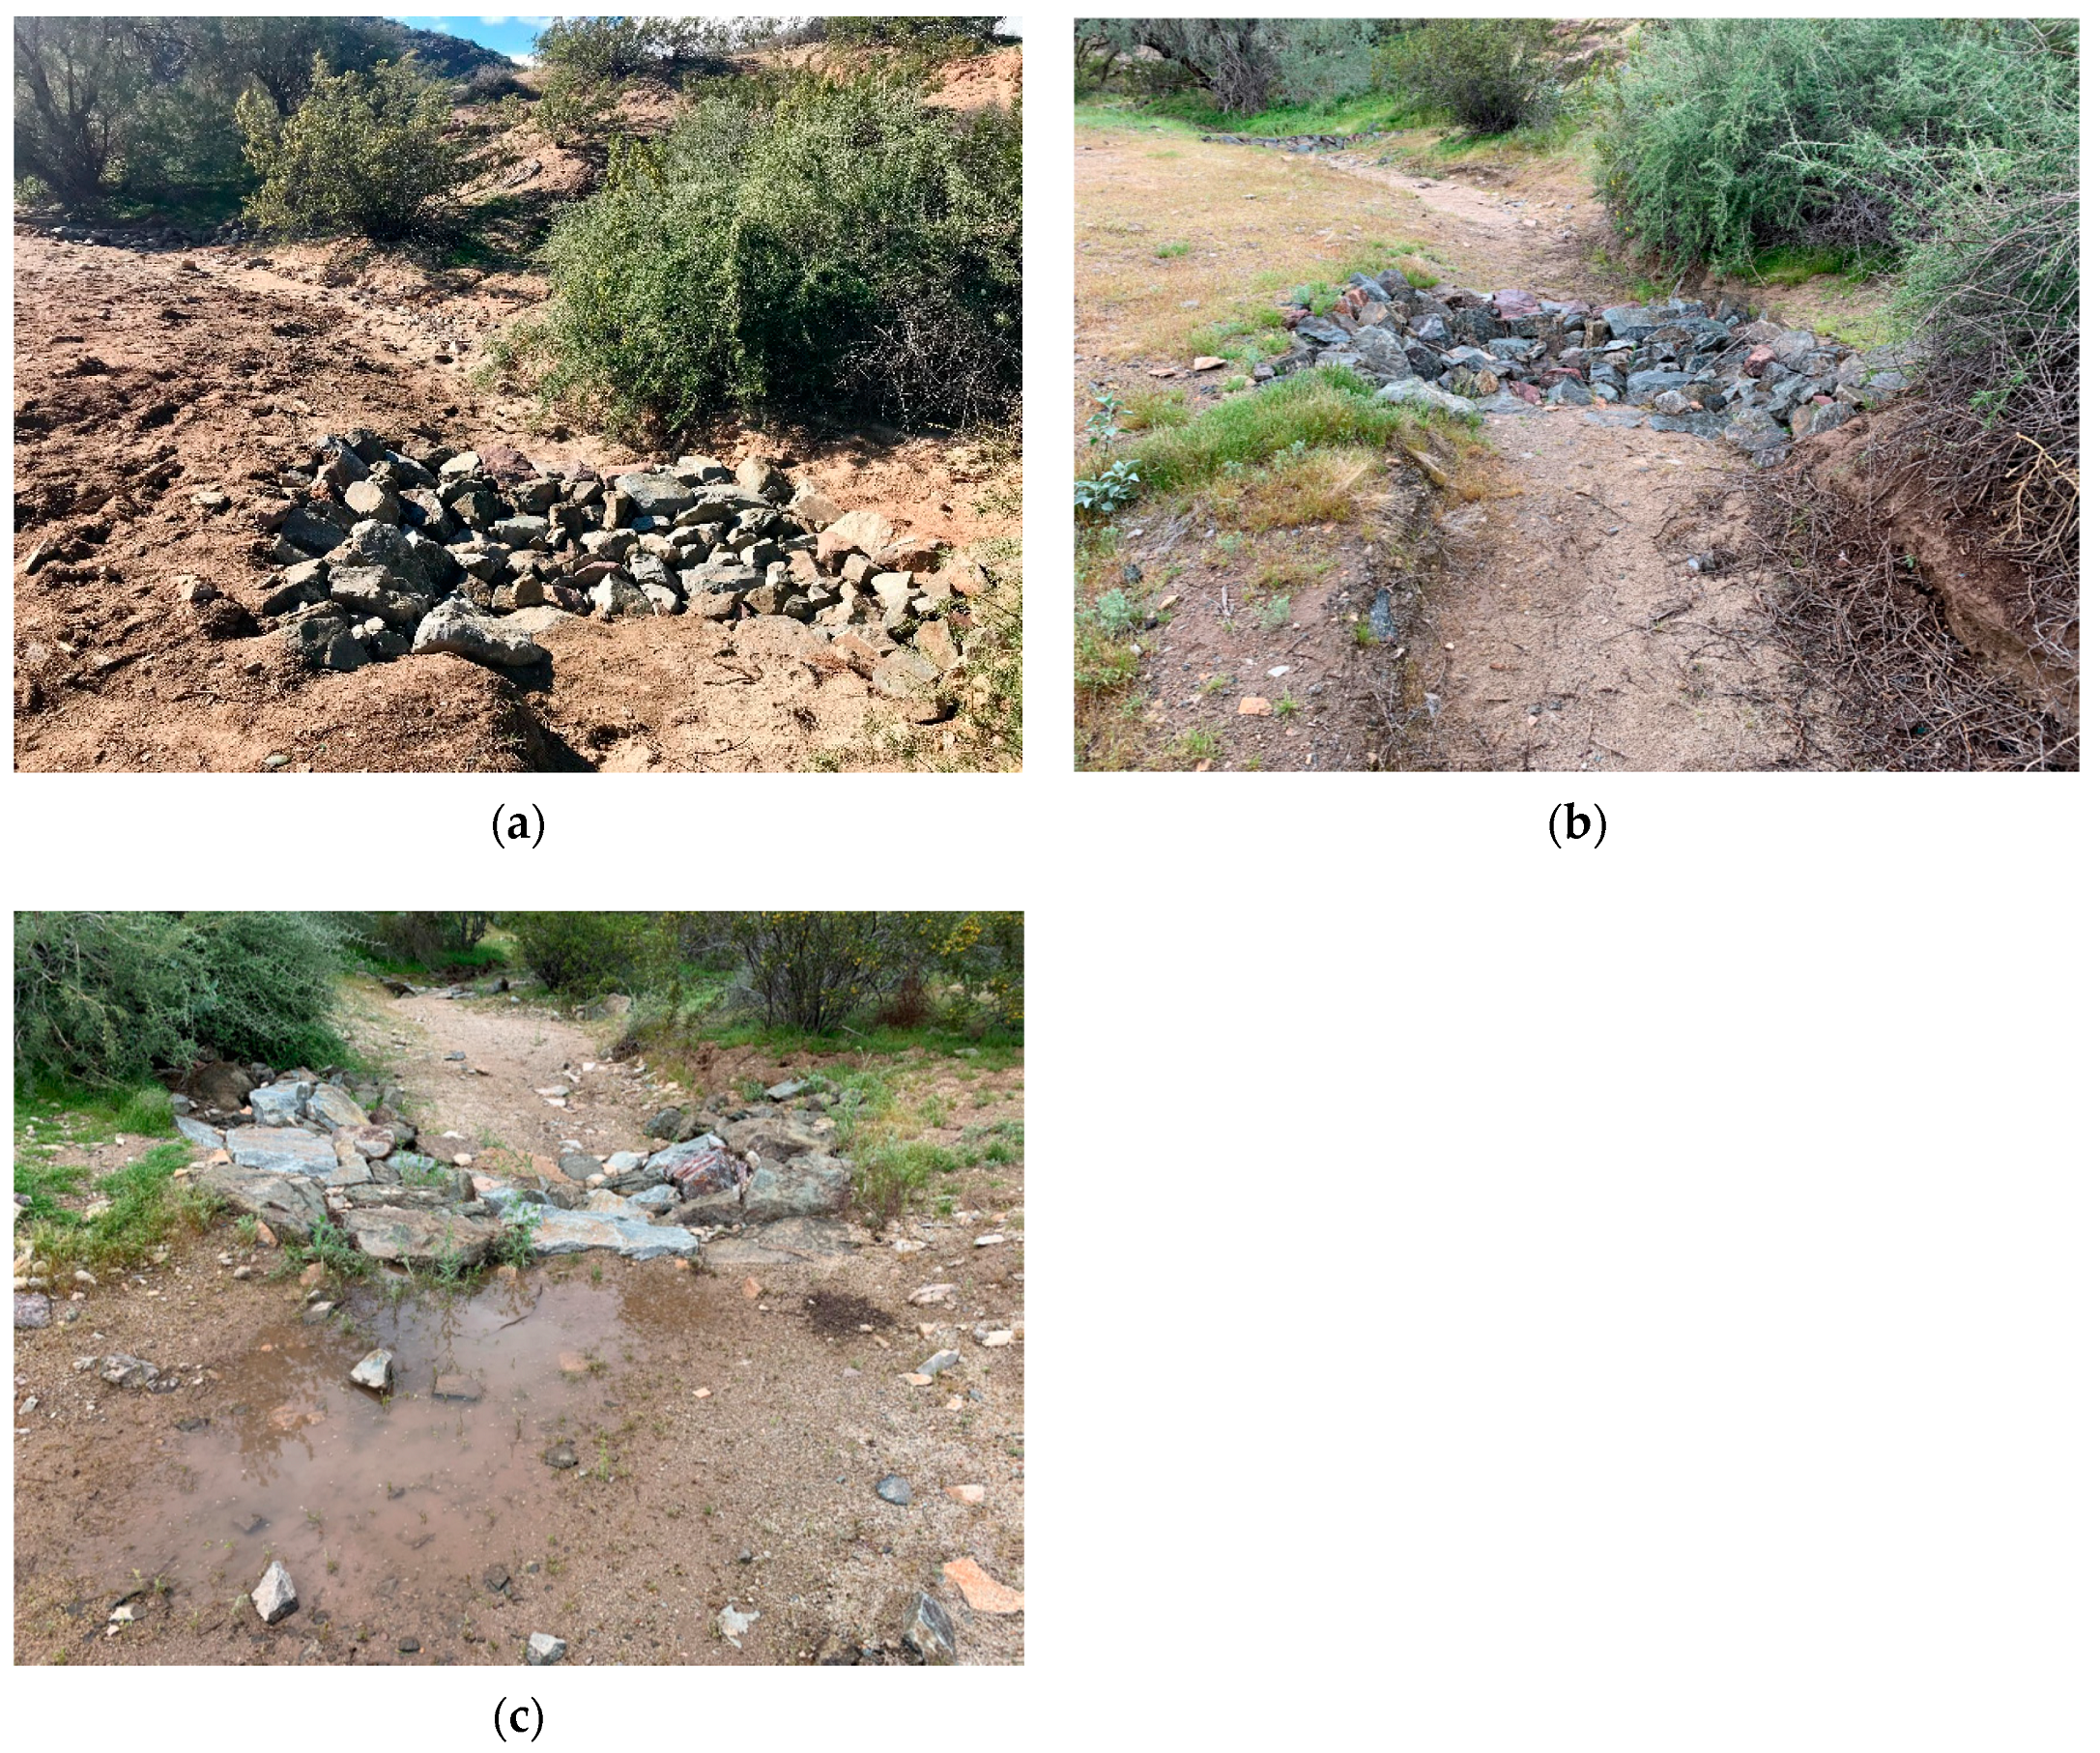
2.1. Weather Stations

Calibrated WeatherHawk weather stations were employed to assess potential differences in precipitation across the study site. These weather stations use a tipping-bucket rain gauge and an integral air temperature plus relative humidity sensor (shaded, shielded). The sensors were mounted on a steel mast at a height of two meters above ground level. The package also recorded wind speed and direction and shortwave incoming solar radiation, which were not used in this study. The stations logged data in programmable increments, set to 10-min increments.
On 28 and 19 June 2017, two weather stations were installed adjacent to the study channel: one in the upgradient portion of the watershed (southern boundary), adjacent to the mountain front, and the other downgradient (northern boundary), and collocated with the surface-water monitoring equipment (Figure 1). The upgradient station was located on colluvium at the base of South Mountain and is 405 m (1327 ft), measured as a straight line, from the downgradient station, located northeast on alluvium near the boundary of our study area and residential development. Because the urban park is on a north-facing mountain slope, two stations were used to control for possible differences in microclimates between the retention installations [28]. Significant differences in microclimate between the two sites were not detected. Small concrete pads were poured for the weather stations to provide a stable, level installation surface, and wire mesh fencing was installed on the perimeter of the concrete pads for protection. The upgradient weather station battery malfunctioned and was replaced, and data collection began on 20 July 2017. Site visits to observe conditions and to download data from the upgradient and downgradient weather stations were conducted every 4 to 6 weeks. The upgradient and downgradient weather stations were monitored from 28 June 2017, through 13 March 2020, when the United States declared a National Emergency due to the COVID-19 pandemic. At that time, the field work was deemed non-essential and further site visits were not approved. Processed weather station data have been provided in Tosline et al. [27].
Microclimate temperatures were analyzed over the period of the study to investigate how the RDS’ effects on sedimentation, retention, vegetation, or infiltration affect the microclimate. The analysis focused on differences between pre-treatment and post-treatment microclimates, and, in particular, on the microclimates after rainfall events, when retained stormwater can significantly alter the localized ecohydrology. Temperature and relative humidity (RH) anomalies were calculated by subtracting the month’s average temperature or RH at the same time of day from the actual temperature value. We used the monthly averages, as they were not dominated by short storm effects. The average anomaly following rainfall events is calculated as a weighted mean of anomalies following all rainfall events.

2.2. Hydrologic Monitoring and Modeling

A streamflow monitoring station was installed at the lower reach and computed using standard methods [29]. Estimates of streamflow were also obtained utilizing video of streamflow events collected on site in conjunction with large-scale particle image velocimetry (LSPIV) techniques. Monitoring included sampling for suspended sediment concentration using an automated sampler and monitoring channel scour using sediment chains. Infiltration rate data was used to compute hydraulic conductivity, and measured at two sites in the Heard Scout Pueblo (HSP) study area, measured within the top few centimeters. These data provide estimates of the flows and geomorphology and potential of the channel sediments to uptake and store water to assess the efficacy of RDS on the respective hydrologic system (equipment and installation are described in Tosline et al. [27]).
We used an uncalibrated model to extend the hydrologic budget and predict the impacts of the structures across the study area. The numerical model, SRH-2D (v 3.0), is a two-dimensional (2D) mobile-bed hydraulics and sediment transport model for river systems developed by Reclamation [30]. SRH-2D was used to model the hydraulics and infiltration with and without RDS in the ephemeral channel study site. Observed weather, infiltration, and streamflow were used as qualitative input to the model. The numerical model used one uniform infiltration rate to obtain the total cumulative infiltration with and without the grade control structures and results were compared with each other.
Geometry describing the channel without-RDS was based on a survey prior to the installation of the structures and with-RDS geometry was developed by increasing the elevation of the existing conditions’ mesh by the observed as-built height of the RDS (during photo documentation). The as-built height was predominantly 0.15 m from the channel bottom, although several structures ranged between a height of 0.15 and 0.3 m. To drive the model, we simulated velocity at a steady flow of 0.51 cm (m3/s), which is within the range of potential values for a 2-year flood. The velocity magnitudes were typically 1.3 to 1.7 m/s in the main channel of the upper portion of the domain, while the channel velocities were 0.5 to 1 m/s in the lower portion of the domain.

3. Results

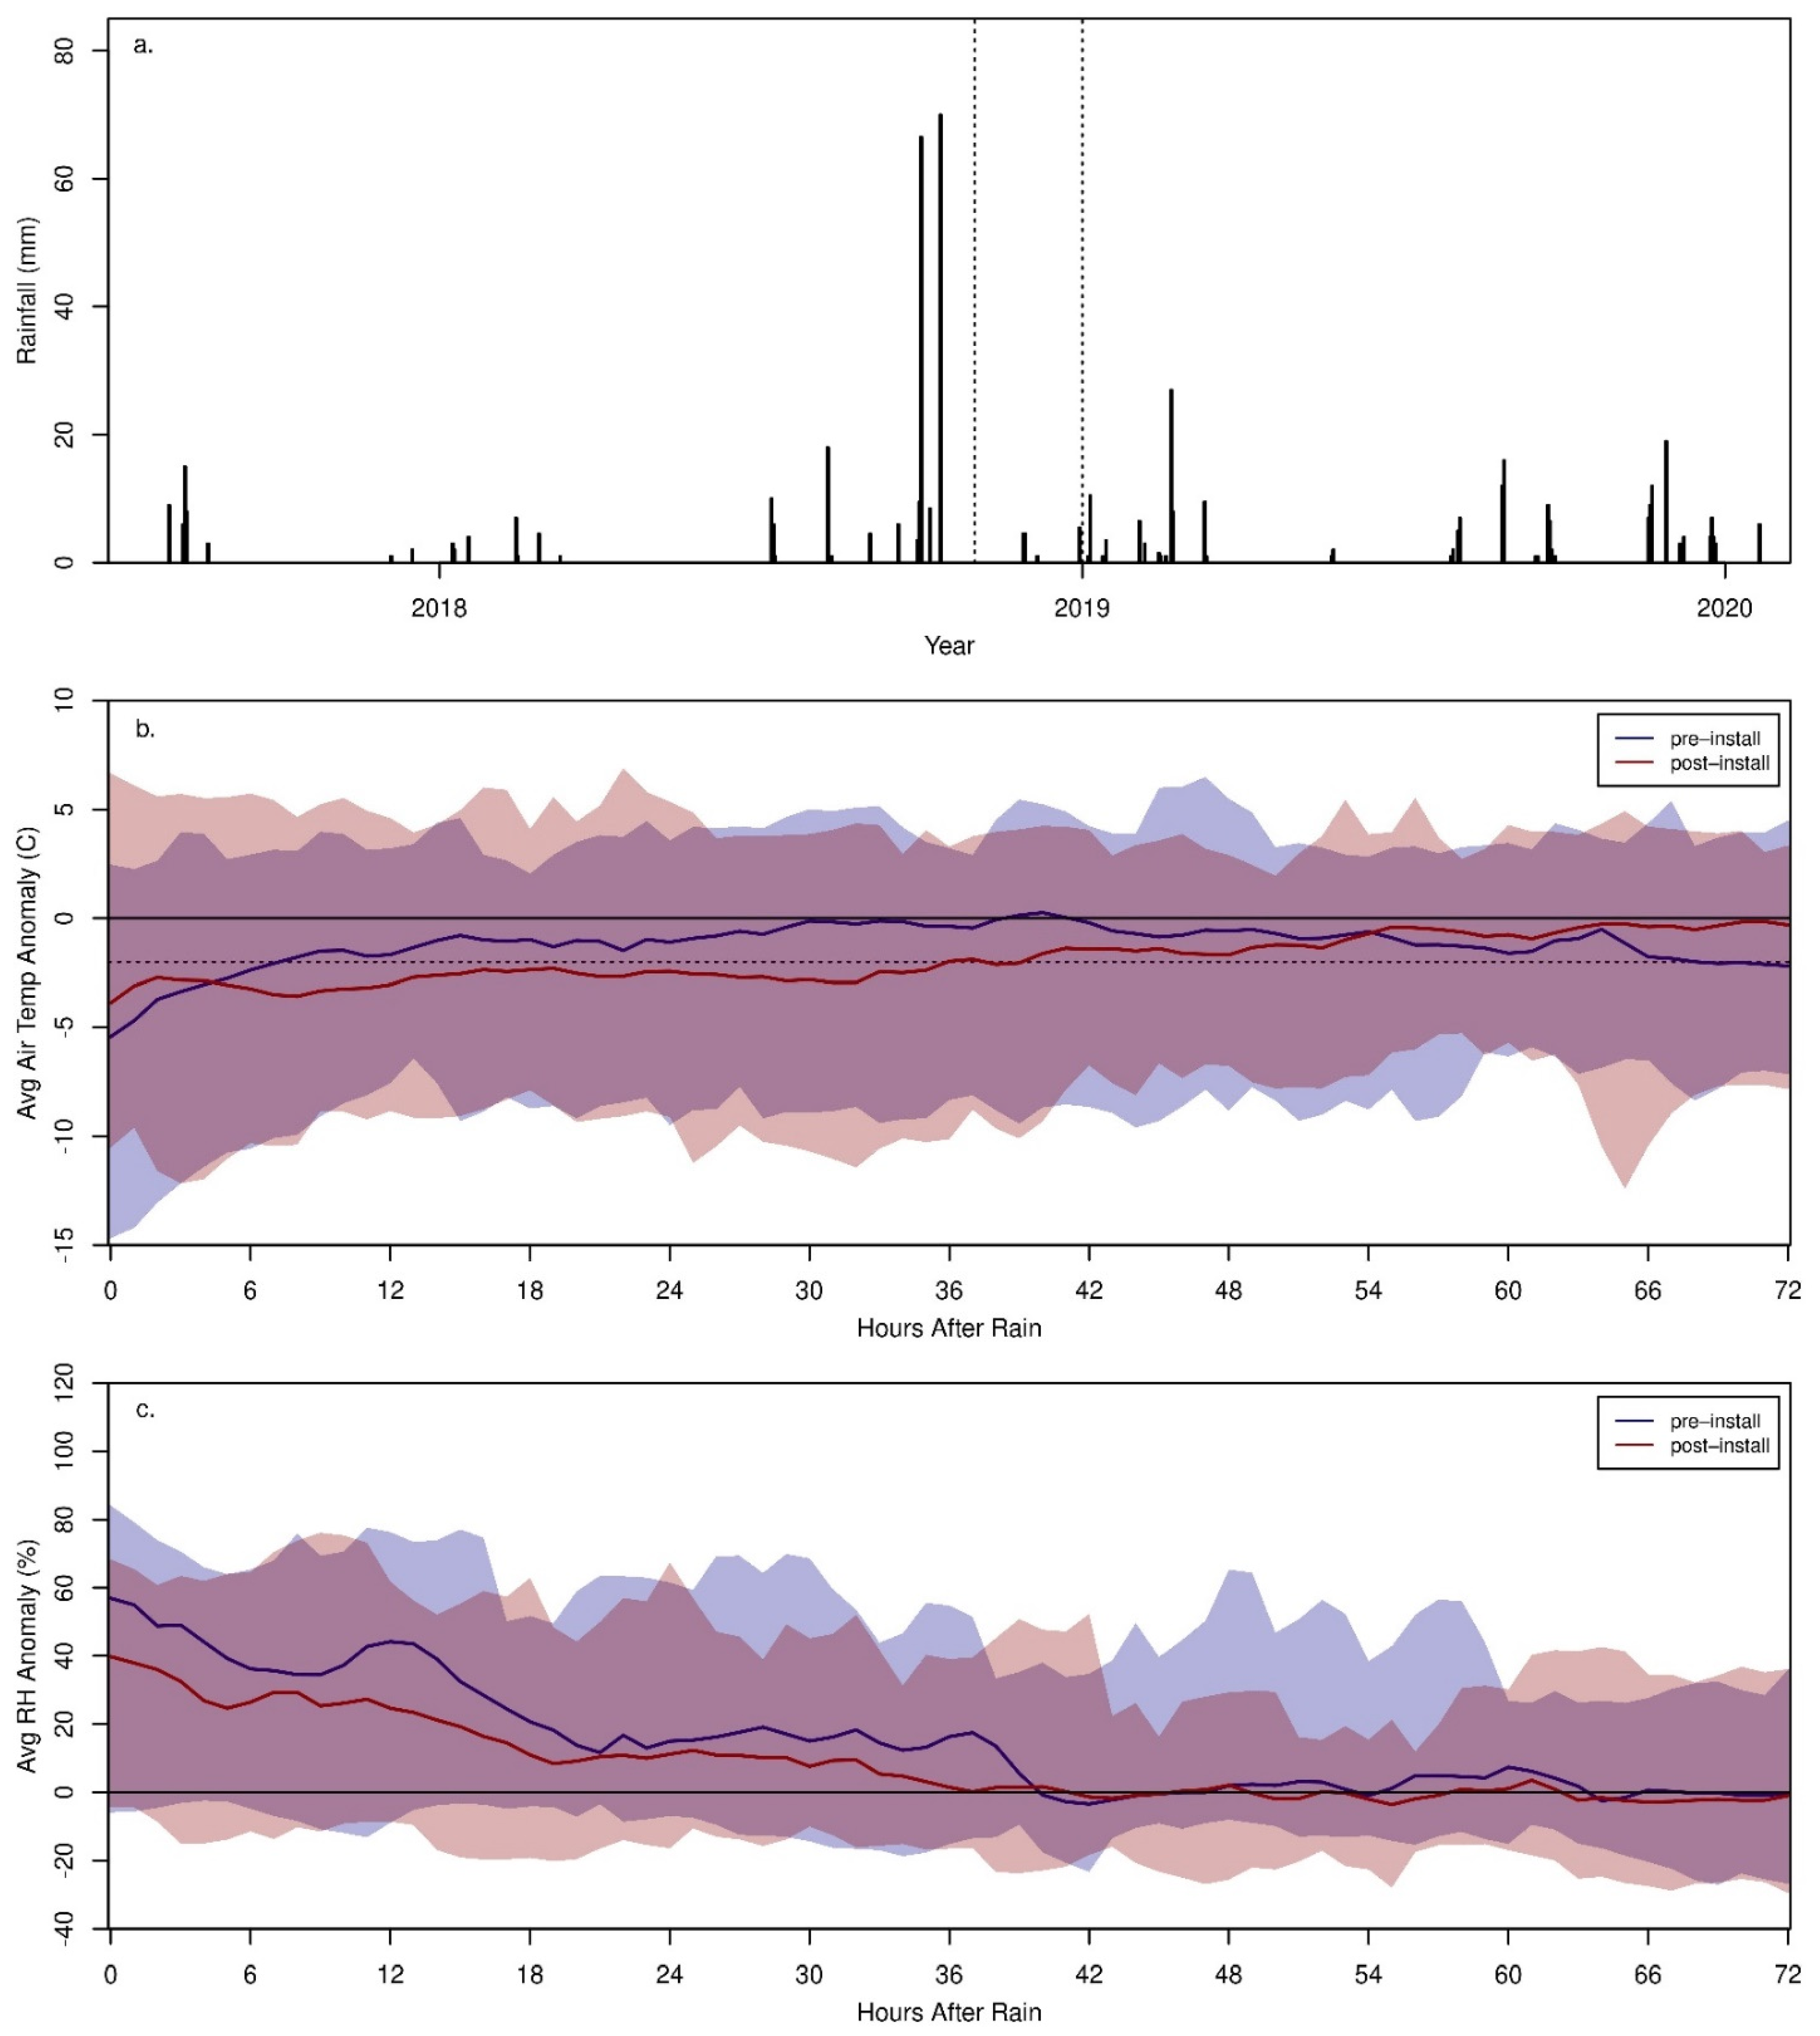
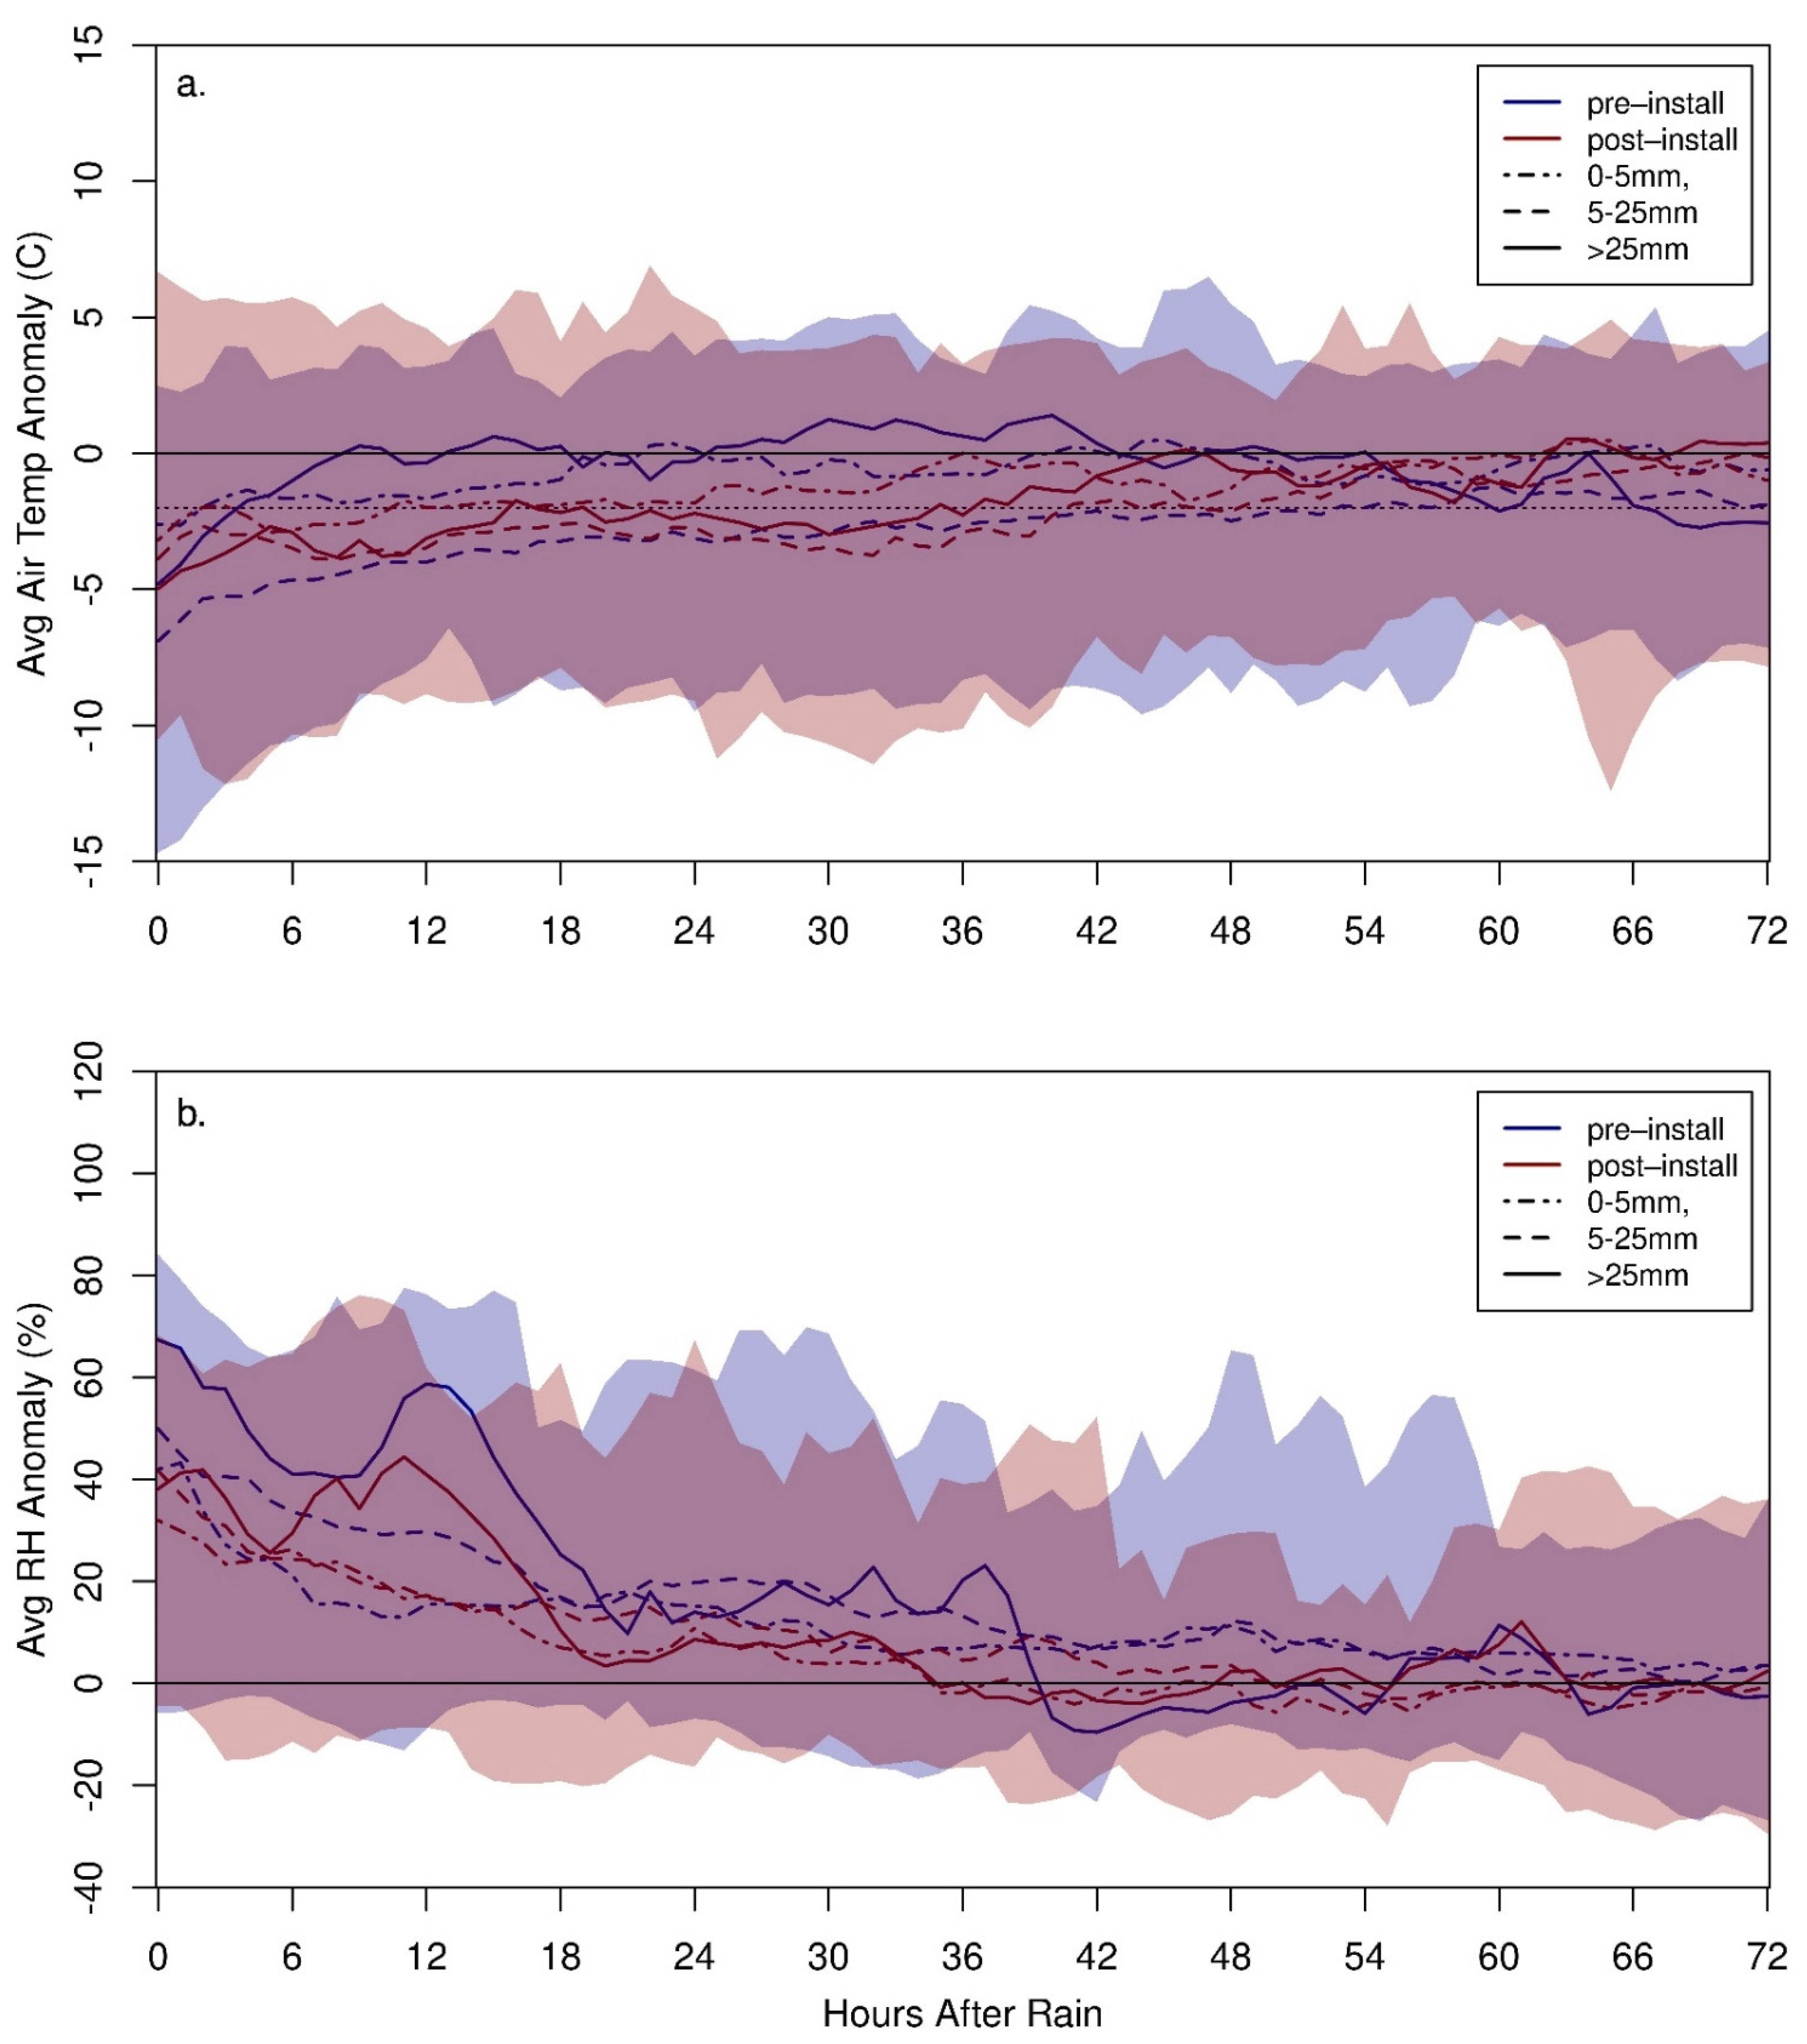
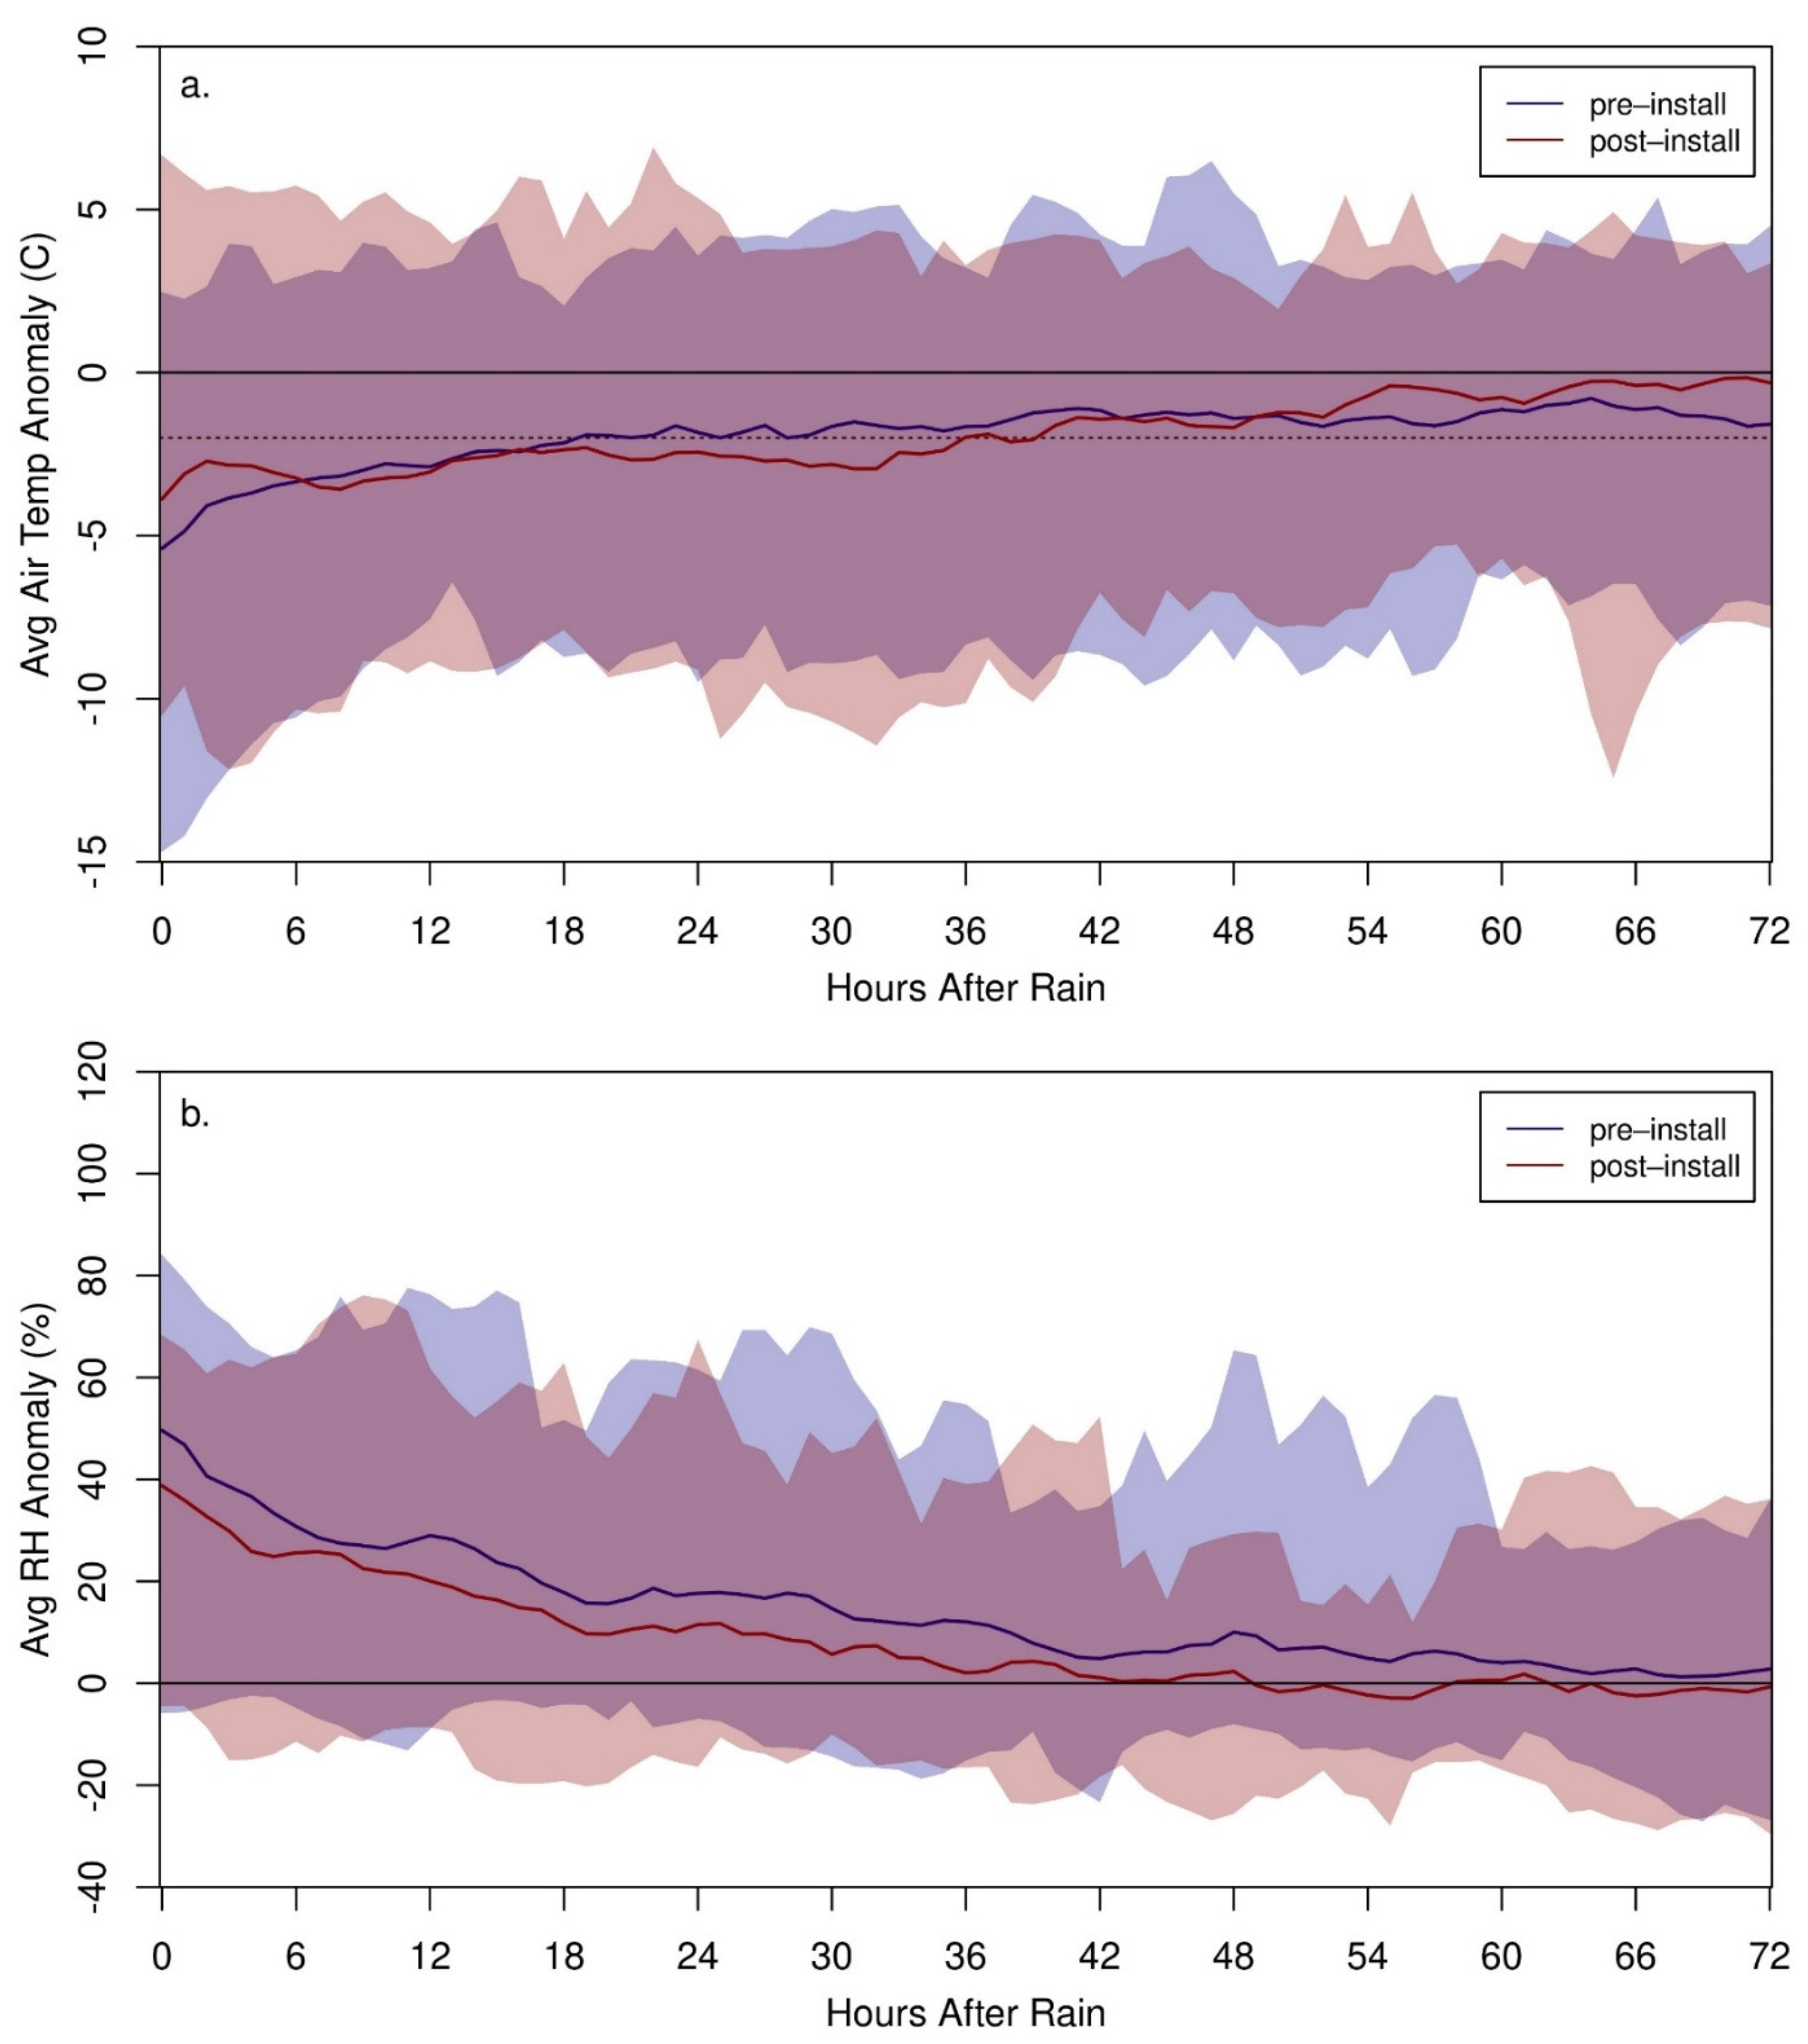
3.1. Weather Stations

A challenge of this analysis is the relatively small number of rainy days (69). We cannot establish statistical confidence for results owing to the small number and size of rainfall events recorded; however, preliminary findings are novel to the investigation of RDS and justifies the need for additional study. Monitoring data from the upgradient and downgradient weather station installations showed that precipitation events correlate between the upgradient and downgradient stations. All events from the two stations are included individually in the analysis, making no distinction between the stations. Monthly average values were derived from each station independently for its events (Figure 3a; all processed weather station data are provided in Tosline et al. [27]. We calculated the difference between the pre- and post-treatment microclimates following rainfall events and observed the maximum and minimum range of differences.
Pre- and post-treatment values of the anomaly of the average hourly air temperature (degrees Celsius) and of the 15-min relative humidity (%), including the average across all precipitation events of the mean, minimum, and maximum values, for post-rainfall time lags ranging up to 72 h. The results are most relevant for larger rain events, exemplified when weighted based on rain event size, where larger rainfall events are emphasized (millimeters per event divided by the sum of rainfall from all events; Figure 3b,c). For more information on the influence of rain event size and to see the unweighted data, see Figure A1 and Figure A2 in the Appendix A of this manuscript.
After a rainfall event, microclimate air temperatures were roughly 3 °C below normal, and relative humidities were roughly 40% above normal, as compared with the control period when no rainfall had recently occurred. These rainfall-induced anomalies decay quickly and disappear within about a day. Post-treatment/install, the air temperature remains depressed by roughly three degrees for about 32 h after the rainfall, while the pre-treatment air temperature is depressed by 3 degrees for 6 h and 1 degree for about 24 h. The data indicate that the treatment creates roughly 2–3 °C of microclimate cooling effect relative to the pretreatment, with both showing a corresponding increase in relative humidity for roughly two days after the rainfall event.

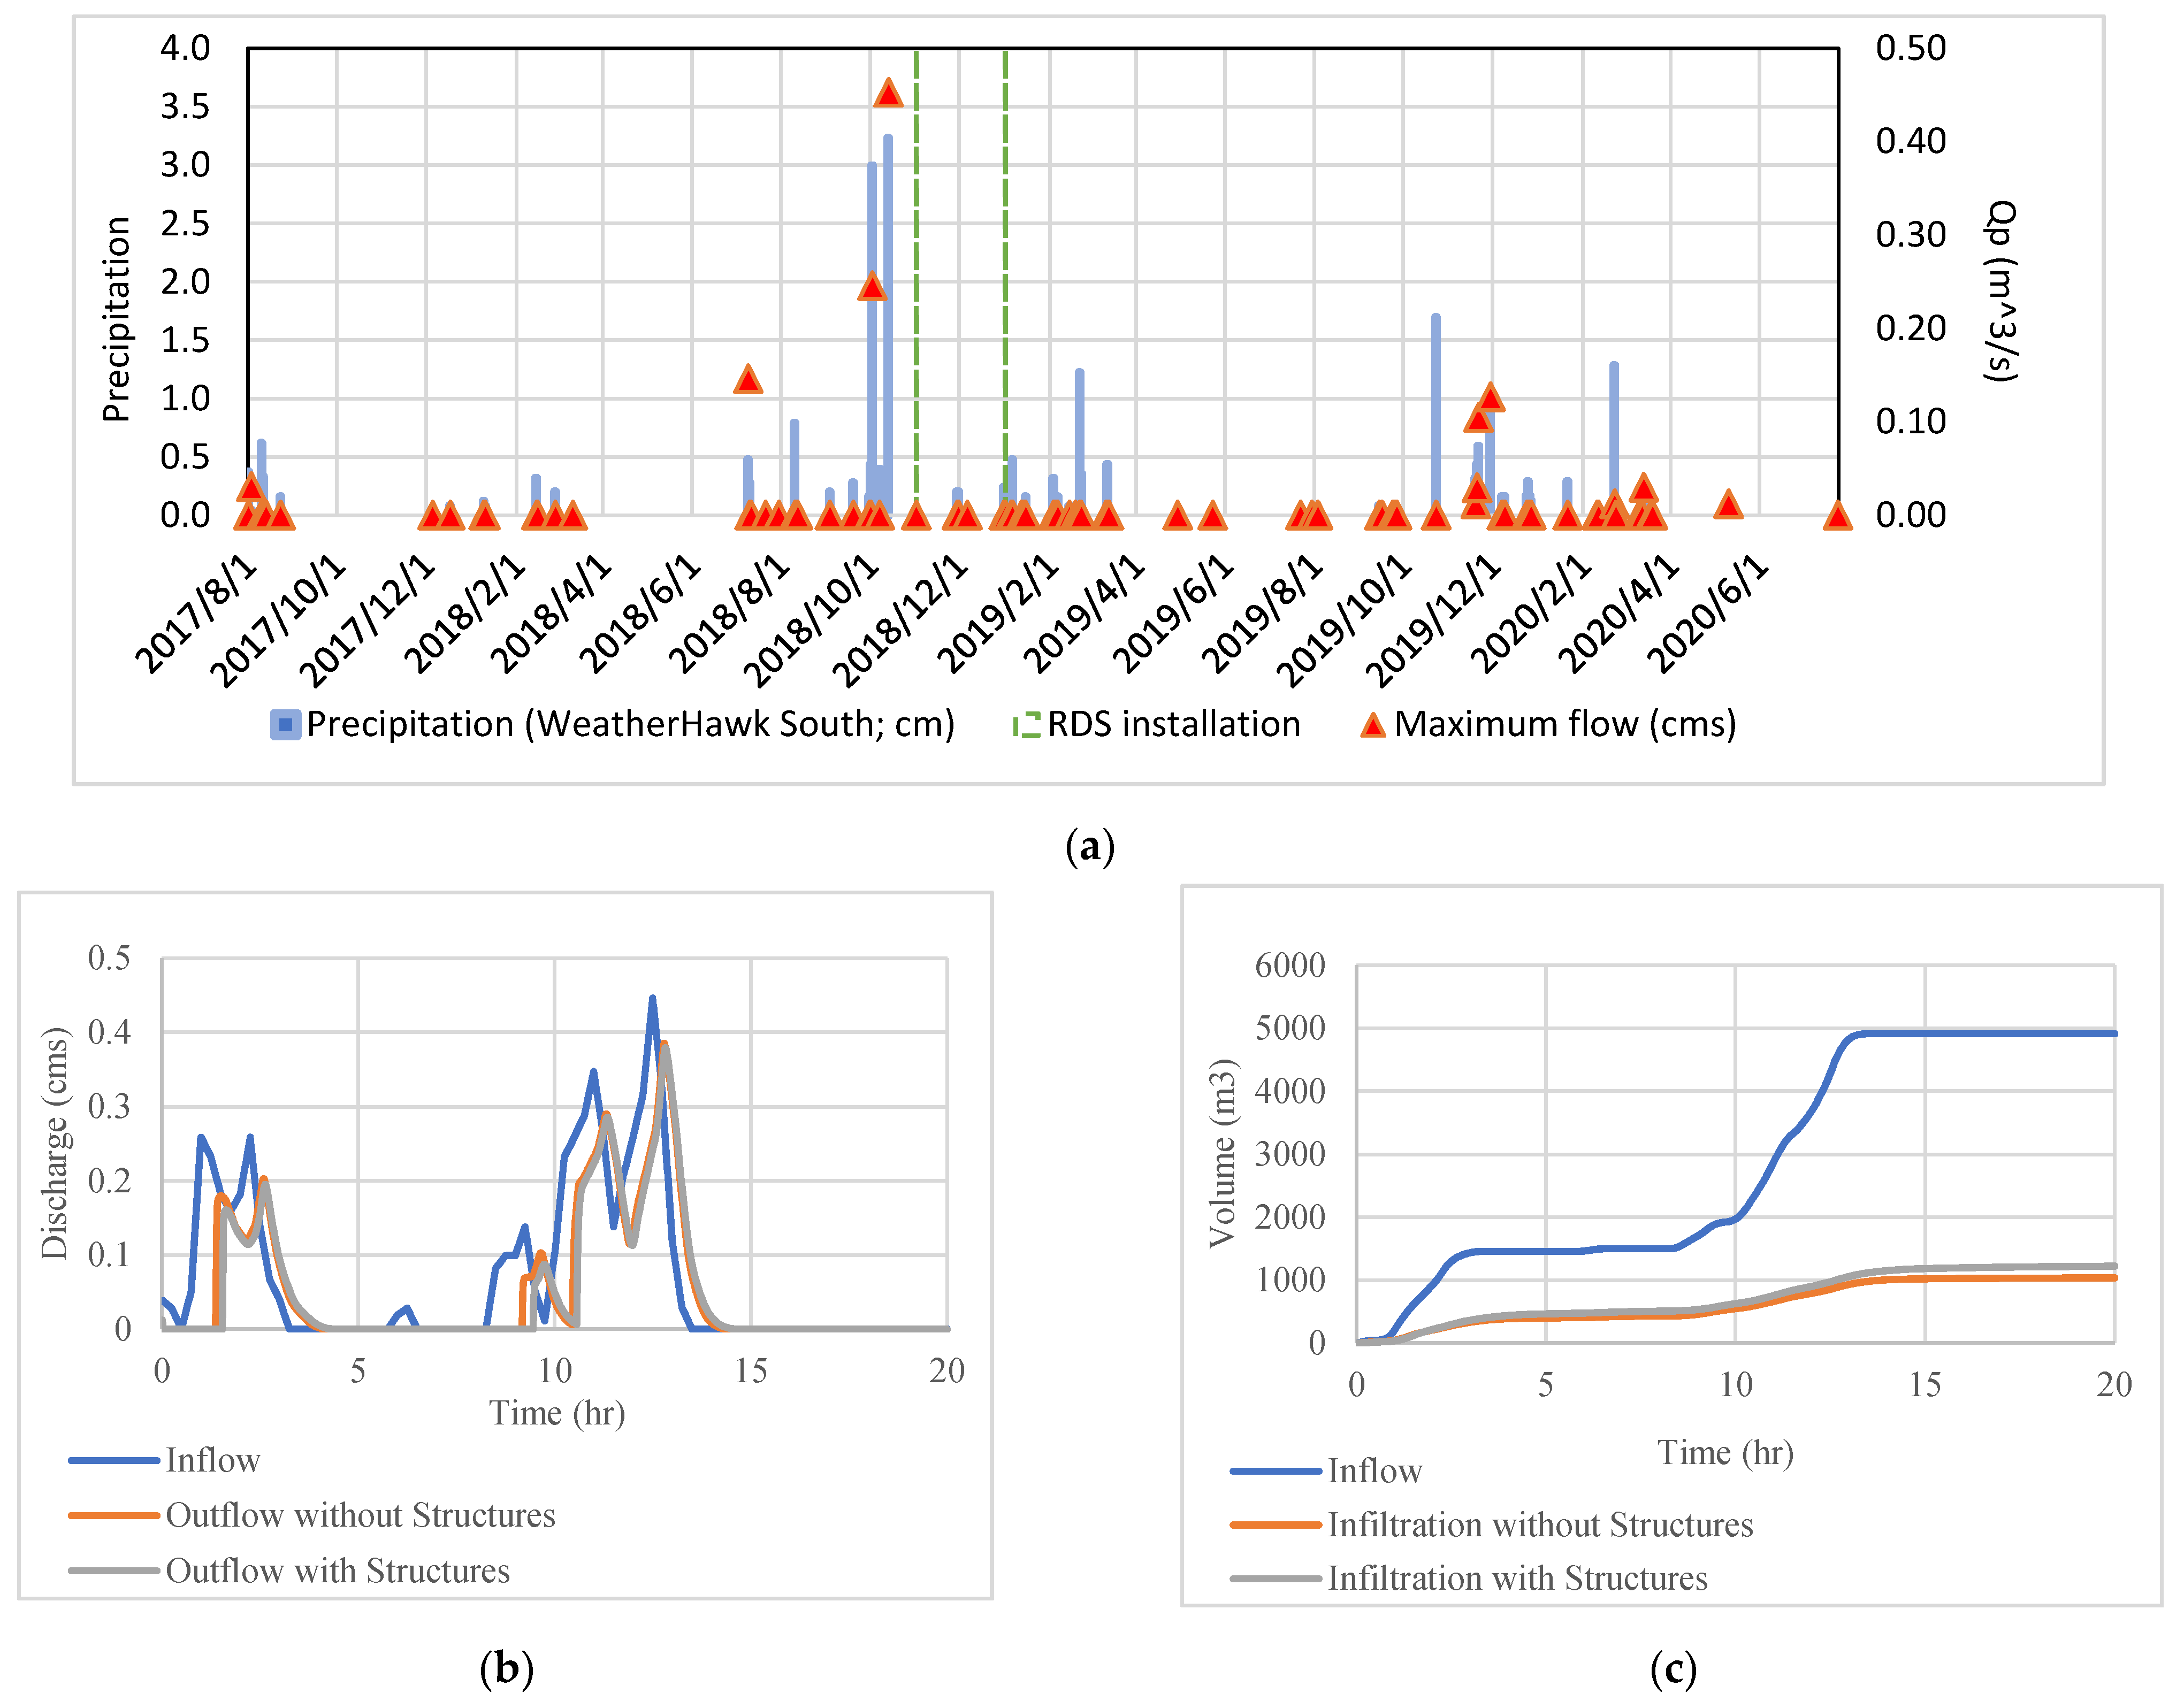
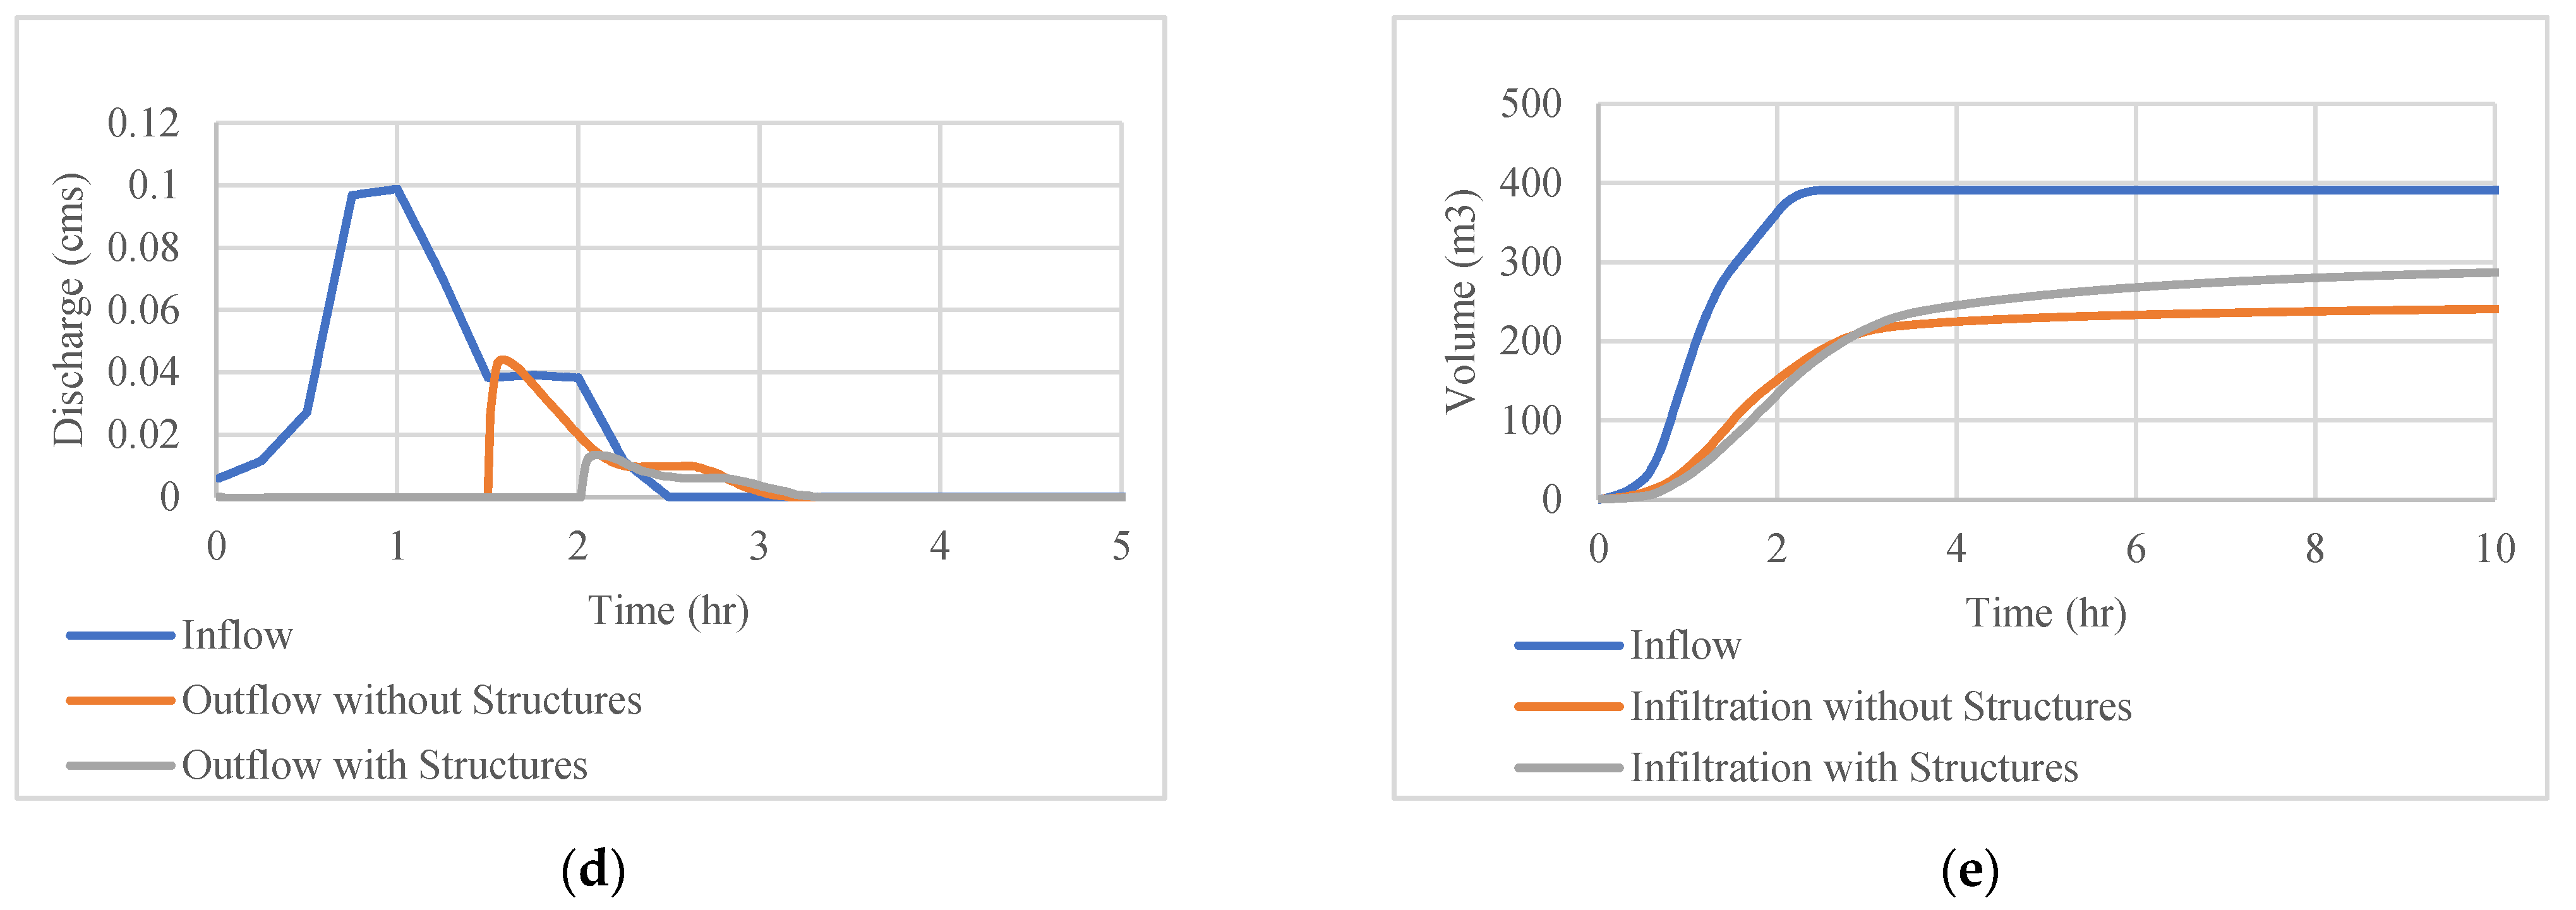
3.2. Hydrologic Monitoring and Modeling

Streamflow at this site during the period of record was extremely rare and the channel was typically dry. Streamflow events that did occur were short in duration in response to only 12 of the recorded precipitation events. The rainfall-runoff response time appears to be muted, delayed, and shows reduced peak flows after RDS installed in November 2018–January 2019 (Figure 4a). A nearly-complete record of streamflow was collected from 7 July 7 2017 to 28 July 2020, which is accessible through the USGS Water Data for the Nation (2021).
Two varied storms documented in the study were used to simulate flows using the numerical model, SRH-2D: (i) 13 October 2018, the first significant pre-RDS installation precipitation event (3.23 cm; ~3 h, 1000-year event, and the largest in our study), and (ii) 29 November 2019, a significant post-RDS precipitation event (0.87 cm; ~1 h, 5-year event, 4th largest in our study; Figure 4). Note that the modelled peak flow, which occurs before the structures are installed (0.44 cms; Figure 4b) is reflected by the stream gage captured from that data (0.45 cms; Figure 4a). The smaller storm flow event that was modelled after the structures were installed is not as accurate (0.04 cms; Figure 4d) vs. what was measured on the ground after this event (0.13 cms; Figure 4a). For both storm events, the runoff ratio measured on site (precipitation resulting in runoff) is ~5.5%. The model depicts lower and delayed maximum flow (peaks) after the structures are installed.
The calculated values of unsaturated hydraulic conductivity as a function of matric potential (K(h)) were in the range typical of sands and fine gravels, with values ranging from (0.14 × 10⁻³) to (93.89 × 10⁻³) cm/s, and saturated hydraulic conductivity (Ksat) values ranged from (0.01 × 10⁻³) to (9722 × 10−3) cm/s [27]. The very high hydraulic conductivity measured in the field represents mere centimeters of top surface conditions (not deeper layers needed to calculate infiltration). The recommended percolation rate for “Sand and gravel mixture with low silt-clay content” ranges between (70 × 10−3) and (2.0 × 10⁻³) cm/s, as recommended in the state standard for hydrologic modeling [31,32]. We used the average from this range (1.0 × 10⁻³ cm/s), as the hydraulic conductivity in the model, to calculate infiltration rates at HSP.
The model predicted increased the upstream infiltration depth of many of the structures. A sensitivity analysis of infiltration rates was also conducted, finding the total amount of infiltration sensitive to the hydraulic conductivity, but the relative difference in infiltration was not sensitive to the absolute values of the hydraulic conductivity. For sensitivity analysis, different infiltration rates were used in the 2D numerical model, and the total cumulative infiltration rate with grade control structures are consistently larger than that without structures. Our modeling results do not confirm the absolute amount of infiltration, only that the structures cause a slight increase in it for each event input (Figure 4c,e). The cumulative infiltration predicted by the model estimates that the structures could increase the infiltration by approximately 15%.

4. Discussion

While our study focused on a single channel in a very large urban park, the possibilities to impact the larger city and climate is encouraging. In the case of Phoenix, AZ, USA, where mean temperatures are 1.8–2.2 °C warmer due to urban heat island effect [22,23], RDS/GI installations could negate this effect if enough structures were established. Globally, arid lands cover 41% of the land surface, and various regions could benefit from similar treatments. The simplicity of the facilitation and preliminary empirical results presented makes this a valuable option and addition to the cascading list of ecosystem services associated with RDS that improve health and well-being in aridlands.
Our results are dependent on local parameters and context, but can considered for similar project types at larger scales in hot semiarid climates. The observed cooling magnitude is likely very contextual (e.g., local relative humidity, shading, air temperature), and the duration is also likely a function of local parameters (e.g., soil type and vegetation type and density). The recent climate conditions over the Southwest have not been conducive for monsoon moisture to reach the study area. Instead, they have led to a prolonged period of dangerous heat. As of 21 July 2020, Phoenix had not received any measurable precipitation (at least 0.01 inches) in more than 90 days. This prolonged drought limited our rainfall/runoff analyses and prevented a rigorous analysis of storm flow conditions pre- and post-RDS installations.
The hydrology data collected at our study site did not portray the hypothesized delayed rainfall-runoff responses or an increase in percentage runoff from rainfall from the installation of RDS [27]. This initial response is not unusual, and we attribute it to climate-related factors (lack of rainfall) and the extremely dry antecedent conditions of the study area (lack of previous flows), which limited the total volume of water and sediment detention. Soil and soil-moisture controls the unsaturated hydraulic conductivity and thus the occurrence of “infiltration excess overland flow” [33]. In longer-term RDS-installations, with more precipitation, this response is identified in the beginning of the rainy season and is reversed as water is stored in the soils accumulating behind RDS [8,11].
Our model analyses extended our study parameters to predict potential impacts over time. The model predicted a slight reduction and delay in peak flows for small events when RDS are installed (Figure 4). This reduction and delay are consistent with the literature for gabions [34,35] and check dams [36]. Study areas that can accumulate storage in the system over time portray a delayed release of higher volumes of runoff [8,10,13]. The model estimates that RDS could increase the infiltration by approximately 15% over time, slightly larger than the average infiltration increases (~10%) measured at the Babacomari Ranch in southeastern Arizona, where gabions had been constructed [10]—this was confirmed in the field using the infiltrometer. We were unable to quantify any change in erosion or sedimentation, which we attribute to the limited and very low amount of flow events, impacts from construction, and lack of runoff-induced sediment movement. However, modelled larger-storm events resulted in the prediction of reduced peak flow (and flooding) when structures are simulated, which supports the potential reduction of erosion and sediment transport.
As an aside, green-up in vegetation, depicted in the photographs (Figure 2), is indicative of the phenology of the landscape (Spring vs. Fall) and did not appear to vary during the 3-year timeframe. Due to dry conditions during and following RDS installations, there was no establishment of vegetation until precipitation events in late February/early March 2020. Photos taken on 13 March 2020 showed volunteer native vegetative growth within the RDS. While vegetation is known to reduce temperatures where RDS/GI are installed, we did not notice increases in vegetation during the study. These were casual observations ancillary to our study. We do not attribute the cooling effect result herein to be associated with vegetation but attribute it to evaporative cooling from sustained high soil moisture behind RDS structures. However, previous studies suggest that RDS can improve vegetation health and maintenance at structures and up to 5km downstream, despite drought conditions, over a 30-year timeframe [13,14]. This will undoubtably add to the cooling effects of the structures themselves at HSP over time.
Continued research extended over time to examine rainfall-runoff response in wetter and longer timeframes, to better investigate geomorphologic and hydroclimatic response, is warranted. The innovative monitoring and careful redundancy of data acquisition established at the HSP interwoven with the potential to extend minimal findings using a well-established model proved critical for studying dryland hydrology. In addition, the existing comprehensive monitoring design established in this research endeavor provides a good opportunity and baseline to continue stormwater monitoring the impacts of RDS at HSP in the future.

5. Conclusions

Our research objective was to document the hydrologic and climatic impacts of small rock detention structures (RDS) used as Green Infrastructure (GI) in an arid land environment challenged by urban heat island effects. Microclimate, discharge, and geomorphic conditions were monitored pre- and post-RDS installations. The number and magnitude of precipitation events occurring over the 3-year study was small, given the drought conditions this dryland environment was experiencing. However, modelling facilitated our study, projecting RDS to reduce peak flow events (a mitigation strategy for flooding) and increase infiltration by approximately 15% (a climate adaptation strategy to recharge the aquifers). Additionally, our monitoring results demonstrate that RDS create roughly a 3-degree Celsius microclimate cooling effect, as compared with the untreated channel. We attribute cooling to the increased moisture stored in increased sediment, evaporation, and latent heat expulsion from the evaporation on the treated site. Further investigation is warranted to better document these effects and build statistical confidence. Nevertheless, microclimate cooling is an important objective of urban GI in hot/dry cities such as Phoenix, Arizona, USA, and this finding establishes an ecosystem service potential for climate regulation and provides a potential adaptation strategy that reduces the negative effects of climate change.

Author Contributions

Conceptualization, L.M.N., D.J.T. and B.L.R.; methodology, L.M.N., D.J.T., B.L.R. and B.P.G.; software, M.K.F. and B.P.G.; validation, B.L.R., M.K.F. and J.R.C.; formal analysis, L.M.N., D.J.T. and B.L.R.; investigation, L.M.N., B.L.R., D.J.T., M.K.F., B.P.G. and J.R.C.; resources, D.J.T.; data curation, B.L.R., D.J.T., M.K.F., B.P.G. and J.R.C.; writing—original draft preparation, L.M.N., B.L.R., D.J.T. and M.K.F.; writing—review and editing, L.M.N., B.L.R., D.J.T., M.K.F., B.P.G. and J.R.C.; visualization, L.M.N., D.J.T., M.K.F., B.P.G. and J.R.C.; supervision, L.M.N., B.L.R. and D.J.T.; project administration, D.J.T.; funding acquisition, D.J.T. All authors have read and agreed to the published version of the manuscript.

Funding

This research was conducted by the Bureau of Reclamation’s S&T Program (S&T #1751), with support from Northern Arizona University and the Land Change Science (LCS) Program of the U.S. Geological Survey.

Data Availability Statement

Data supporting reported results can be found online at Tosline et al. [27] and through the USGS [37].

Acknowledgments

We thank the Boy Scouts of America at the Heard Scout Pueblo, partners from the Sky Island Restoration Collaborative (SIRC), and all partners, participants, and stakeholders listed in Tosline et al. [27]. Victor Huang from the Bureau of Reclamation helped with the numerical modeling. Geoff DeBenedetto, Brandon Forbes, Bruce Gungle, and James Callegary from the USGS Arizona Water Science Center helped collect survey data for this project. We also appreciate the careful peer reviews of this manuscript provided by Gregg Garfin and Margaret Garcia. References to commercial vendors of software products or services are provided solely for the convenience of users when obtaining or using USGS software. Any use of trade, firm, or product names is for descriptive purposes only and does not imply endorsement by the U.S. Government.

Conflicts of Interest

The authors declare no conflict of interest.

Appendix A

Figure A1. This figure shows average (a) air temperature and (b) relative humidity (RH) anomalies of two weather stations plotted during the study period (July 2017 to March 2020) for all rain events parsed into size categories. Pre- (blue) and post- (red) treatment/installation show the minimum and maximum values encountered for the overall dataset. Red and Blue bands show the minimum and maximum values encountered, and the line is the mean where (a) temperature (where the dotted line indicates −2 °C) and (b) relative humidity.
Sustainability 13 11268 g0a1
Figure A2. This figure shows the Temperature and RH anomalies occurring after rainfall events without any weighting applied (equal weights), for both sites and all rainfall events, pre- (blue) and post- (red) treatment/installation. Red and Blue bands show the minimum and maximum values encountered, and the line is the mean where (a) temperature (where the dotted line indicates −2 °C) and (b) relative humidity.
Sustainability 13 11268 g0a2

References

  1. Seager, R.; Ting, M.; Held, I.; Kushnir, Y.; Lu, J.; Vecchi, G.; Huang, H.-P.; Harnik, N.; Leetmaa, A.; Lau, N.-C.; et al. Model Projections of an Imminent Transition to a More Arid Climate in Southwestern North America. Science 2007, 316, 1181–1184. [Google Scholar] [CrossRef] [PubMed]
  2. Udall, B.; Overpeck, J. The Twenty-First Century Colorado River Hot Drought and Implications for the Future. Water Resour. Res. 2017, 53, 2404–2418. [Google Scholar] [CrossRef] [Green Version]
  3. Demuzere, M.; Orru, K.; Heidrich, O.; Olazabal, E.; Geneletti, D.; Orru, H.; Bhave, A.G.; Mittal, N.; Feliu, E.; Faehnle, M. Mitigating and adapting to climate change: Multi-functional and multi-scale assessment of green urban infrastructure. J. Environ. Manag. 2014, 146, 107–115. [Google Scholar] [CrossRef]
  4. Shashua-Bar, L.; Potchter, O.; Bitan, A.; Boltansky, D.; Yaakov, Y. Microclimate Modelling of Street Tree Species Effects Within the Varied Urban Morphology in the Mediterranean City of Tel Aviv, Israel. Int. J. Clim. 2010, 30, 44–57. [Google Scholar] [CrossRef]
  5. Häb, K.; Middel, A.; Ruddell, B.L.; Hagen, H. TraVis—A Visualization Framework for Mobile Transect Data Sets in an Urban Microclimate Context. In Proceedings of the April 2015 IEEE Pacific Visualization Symposium (PacificVis), Hangzhou, China, 14–17 April 2015; pp. 167–174. [Google Scholar] [CrossRef]
  6. Norman, L.M.; Pulliam, H.R.; Girard, M.M.; Buckley, S.M.; Misztal, L.; Seibert, D.; Campbell, C.; Callegary, J.B.; Tosline, D.J.; Wilson, N.R.; et al. Editorial: Combining the Science and Practice of Restoration Ecology—Case Studies of a Grassroots Binational Restoration Collaborative in the Madrean Archipelago Ecoregion (2014–2019). Air Soil Water Res. 2021, 14. [Google Scholar] [CrossRef]
  7. Warshall, P. The Madrean Sky Island Archipelago: A Planetary Overview; US Department of Agriculture, Forest Service, Rocky Mountain Forest and Range Experiment Station: Fort Collins, CO, USA, 1995; pp. 6–18. [Google Scholar]
  8. Norman, L.M.; Niraula, R. Model Analysis of Check Dam Impacts on Long-Term Sediment and Water Budgets in Southeast Arizona, USA. Ecohydrol. Hydrobiol. 2016, 16, 125–137. [Google Scholar] [CrossRef] [Green Version]
  9. Norman, L.M.; Sankey, J.B.; Dean, D.; Caster, J.; DeLong, S.; DeLong, W.; Pelletier, J.D. Quantifying Geomorphic Change at Ephemeral Stream Restoration Sites Using a Coupled-Model Approach. Geomorphology 2017, 283, 1–16. [Google Scholar] [CrossRef]
  10. Norman, L.M.; Callegary, J.B.; Lacher, L.; Wilson, N.R.; Fandel, C.; Forbes, B.T.; Swetnam, T. Modeling Riparian Restoration Impacts on the Hydrologic Cycle at the Babacomari Ranch, SE Arizona, USA. Water 2019, 11, 381. [Google Scholar] [CrossRef] [Green Version]
  11. Norman, L.M. Ecosystem Services of Riparian Restoration: A Review of Rock Detention Structures in the Madrean Archipelago Ecoregion. Air Soil Water Res. 2020, 13, 117862212094633. [Google Scholar] [CrossRef]
  12. Callegary, J.B.; Norman, L.M.; Eastoe, C.J.; Sankey, J.B.; Youberg, A. Preliminary Assessment of Carbon and Nitrogen Sequestration Potential of Wildfire-Derived Sediments Stored by Erosion Control Structures in Forest Ecosystems, Southwest USA. Air Soil Water Res. 2021, 14, 117862212110017. [Google Scholar] [CrossRef]
  13. Norman, L.; Villarreal, M.; Pulliam, H.R.; Minckley, R.L.; Gass, L.; Tolle, C.; Coe, M. Remote Sensing Analysis of Riparian Vegetation Response to Desert Marsh Restoration in the Mexican Highlands. Ecol. Eng. 2014, 70, 241–254. [Google Scholar] [CrossRef] [Green Version]
  14. Wilson, N.R.; Norman, L.M. Analysis of Vegetation Recovery Surrounding a Restored Wetland Using the Normalized Difference Infrared Index (NDII) and Normalized Difference Vegetation Index (NDVI). Int. J. Remote. Sens. 2018, 39, 3243–3274. [Google Scholar] [CrossRef] [Green Version]
  15. Erell, E.; Pearlmutter, D.; Williamson, T. Urban Microclimate: Designing the Spaces Between Buildings; Earthscan: London, UK, 2011; ISBN 978-1-84407-467-9. [Google Scholar]
  16. Rosenberg, N.J.; Blad, B.L.; Verma, S.B. Microclimate: The Biological Environment, 2nd ed.; Wiley: New York, NY, USA, 1983; ISBN 978-0-471-06066-6. [Google Scholar]
  17. Jenerette, G.D.; Harlan, S.L.; Buyantuev, A.; Stefanov, W.L.; Declet-Barreto, J.; Ruddell, B.L.; Myint, S.W.; Kaplan, S.; Li, X. Micro-Scale Urban Surface Temperatures Are Related to Land-Cover Features and Residential Heat Related Health Impacts in Phoenix, AZ USA. Landsc. Ecol. 2016, 31, 745–760. [Google Scholar] [CrossRef]
  18. Hall, S.J.; Learned, J.; Ruddell, B.; Larson, K.L.; Cavender-Bares, J.; Bettez, N.; Groffman, P.M.; Grove, J.M.; Heffernan, J.B.; Hobbie, S.E.; et al. Convergence of Microclimate in Residential Landscapes across Diverse Cities in the United States. Landsc. Ecol. 2015, 31, 101–117. [Google Scholar] [CrossRef]
  19. Vanos, J.K.; Middel, A.; McKercher, G.R.; Kuras, E.R.; Ruddell, B.L. Hot Playgrounds and children’s Health: A Multiscale Analysis of Surface Temperatures in Arizona, USA. Landsc. Urban Plan. 2016, 146, 29–42. [Google Scholar] [CrossRef] [Green Version]
  20. Chow, W.T.L.; Brennan, D.; Brazel, A.J. Urban Heat Island Research in Phoenix, Arizona: Theoretical Contributions and Policy Applications. Bull. Am. Meteorol. Soc. 2012, 93, 517–530. [Google Scholar] [CrossRef] [Green Version]
  21. Wang, Y.; Ran, L.; Fang, N.; Shi, Z. Aggregate Stability and Associated Organic Carbon and Nitrogen As Affected by Soil Erosion and Vegetation Rehabilitation on the Loess Plateau. Catena 2018, 167, 257–265. [Google Scholar] [CrossRef]
  22. Brazel, A.; Gober, P.; Lee, S.; Grossman-Clarke, S.; Zehnder, J.; Hedquist, B.; Comparri, E. Determinants of Changes in the Regional Urban Heat Island in Metropolitan Phoenix (Arizona, USA) Between 1990 and 2004. Clim. Res. 2007, 33, 171–182. [Google Scholar] [CrossRef] [Green Version]
  23. Yang, Z.; Dominguez, F.; Gupta, H.; Zeng, X.; Norman, L. Urban Effects on Regional Climate: A Case Study in the Phoenix and Tucson “Sun Corridor”. Earth Interactions 2016, 20, 1–25. [Google Scholar] [CrossRef]
  24. Durre, I.; Squires, M.F.; Vose, R.S.; Yin, X.; Arguez, A.; Applequist, S. NOAA’s 1981–2010 U.S. Climate Normals: Monthly Precipitation, Snowfall, and Snow Depth. J. Appl. Meteorol. Clim. 2013, 52, 2377–2395. [Google Scholar] [CrossRef]
  25. Williams, A.P.; Cook, E.R.; Smerdon, J.E.; Cook, B.I.; Abatzoglou, J.T.; Bolles, K.; Baek, S.H.; Badger, A.M.; Livneh, B. Large contribution from anthropogenic warming to an emerging North American megadrought. Science 2020, 368, 314–318. [Google Scholar] [CrossRef] [PubMed]
  26. Iwaniec, D.M.; Cook, E.M.; Davidson, M.J.; Berbés-Blázquez, M.; Grimm, N.B. Integrating Existing Climate Adaptation Planning into Future Visions: A Strategic Scenario for the Central Arizona–Phoenix Region. Landsc. Urban Plan. 2020, 200, 103820. [Google Scholar] [CrossRef]
  27. Tosline, D.; Norman, L.M.; Greimann, B.P.; Cederberg, J.; Huang, V.; Ruddell, B.L. Impacts of Grade Control Structure Installations on Hydrology and Sediment Transport as an Adaptive Management Strategy; Bureau of Reclamation Phoenix Area Office: Phoenix, AZ, USA, 2020. [Google Scholar]
  28. Goodrich, D.C.; Keefer, T.O.; Unkrich, C.L.; Nichols, M.H.; Osborn, H.B.; Stone, J.J.; Smith, J.R. Long-Term Precipitation Database, Walnut Gulch Experimental Watershed, Arizona, United States. Water Resour. Res. 2008, 44. [Google Scholar] [CrossRef]
  29. Rantz, S.E. Measurement and Computation of Streamflow; United States Geological Survey (USGS): Washington, DC, USA, 1982. [Google Scholar]
  30. Lai, Y.G. SRH-2D Version 2: Sedimentation and River Hydraulics—Two-Dimensional River Flow Modeling; U.S. Department of the Interior Bureau of Reclamation Technical Service Center: Denver, CO, USA, 2008; p. 109. [Google Scholar]
  31. Arizona Department of Water Resources. State Standard for Hydrologic Modeling Guidelines; 2007; p. 71. Available online: https://new.azwater.gov/sites/default/files/Hydrology_State_Standard.pdf (accessed on 30 August 2021).
  32. Lane, L.J. Transmission Losses. In National Engineering Handbook; U.S. Department of Agriculture, Soil Conservation Service: Washington, DC, USA, 1983; Chapter 19; p. 21. [Google Scholar]
  33. Horton, R.E. The Rôle of Infiltration in the Hydrologic Cycle. Trans. Am. Geophys. Union 1933, 14, 446–460. [Google Scholar] [CrossRef]
  34. Norman, L.; Huth, H.; Levick, L.; Burns, I.S.; Guertin, D.P.; Lara-Valencia, F.; Semmens, D. Flood Hazard Awareness and Hydrologic Modelling at Ambos Nogales, United States-Mexico Border. J. Flood Risk Manag. 2010, 3, 151–165. [Google Scholar] [CrossRef]
  35. Norman, L.M.; Levick, L.; Guertin, D.P.; Callegary, J.; Guadarrama, J.Q.; Gil Anaya, C.Z.; Prichard, A.; Gray, F.; Castellanos, E.; Tepezano, E.; et al. Nogales Flood Detention Study. Open-File Rep. 2010. [Google Scholar] [CrossRef] [Green Version]
  36. Norman, L.M.; Brinkerhoff, F.; Gwilliam, E.; Guertin, D.P.; Callegary, J.; Goodrich, D.C.; Nagler, P.L.; Gray, F. Hydrologic Response of Streams Restored With Check Dams in the Chiricahua Mountains, Arizona. River Res. Appl. 2016, 32, 519–527. [Google Scholar] [CrossRef] [Green Version]
  37. National Water Information System. USGS Water Data for the Nation. U.S. Geological Survey Web Interface USGS 332153112022300 UNNAMED WASH AT HEARD SCOUT PUEBLO NEAR PHOENIX, A.. Available online: http://dx.doi.org/10.5066/F7P55KJN (accessed on 27 April 2021).
Figure 1. Study area in relationship to the (A) climate in the United States, where North America Climate Monthly Mean Temperature in July (derived from Museum of Vertebrate Zoology, University of California, Berkeley, USA (2011)); (B) City of Phoenix, Arizona, USA, and Hydrologic Unit Code (HUC) 12-digit boundary dataset; and (C) infrastructure installed in Heard Scout Pueblo watershed and hydrology.
Sustainability 13 11268 g001
Figure 2. Photos of example RDS (structure #18) in wash (a) 7 December 2018 and (b) 13 March 2020 and (c) RDS (#10) looking downstream (13 March 2020) [27].
Sustainability 13 11268 g002
Figure 3. Weather Data collected from the study: (a) Average precipitation of two weather stations plotted during the study period (July 2017 to March 2020). For both sites and all rainfall events, pre- (blue) and post- (red) treatment/installation air temperature anomalies and humidities occurring after rainfall events (and purple where they overlap). Red and Blue bands show the minimum and maximum values encountered, and the line is the mean where (b) temperature and (c) relative humidity.
Sustainability 13 11268 g003
Figure 4. (a) Graph portraying southerly weather station precipitation data (cm) over the study period in relation to the peak discharge (cms) measured downstream; (b) Simulated inflow and outflows for the Heard Scout Pueblo (HSP) with and without rock detention structures(RDS) for 13 October 2018 storm event (cms): (c) Simulated cumulative infiltration for the HSP with and without RDS for the 13 October 2018 storm event (m3); (d) Simulated inflow and outflows for the HSP with and without RDS for 29 November 2019 storm event (cms); (e) Simulated cumulative infiltration for the HSP with and without RDS for the 29 November 2019 storm event (m3) [27].
Sustainability 13 11268 g004aSustainability 13 11268 g004b
Publisher’s Note: MDPI stays neutral with regard to jurisdictional claims in published maps and institutional affiliations.

