Abstract
Increasing pressures surrounding efficiency and sustainability are key global drivers in dairy farm management strategies. However, for numerous resource-based, social, and economic reasons sustainable intensification strategies are herd-size dependent. In this study, we investigated the environmental impacts of Latvia’s dairy farms with different management practices. The herd size-dependent management groups varied from extensively managed small herds with 1–9 cows, extending to stepwise more intensively managed herds with 10–50, 51–100, 100–200, and over 200 milking cows. The aim is to compare the environmental impacts of different size-based production strategies on Latvia’s dairy farms. The results show that the gross greenhouse gas emissions differ by 29%: from 1.09 kg CO2 equivalents (CO2e) per kg of raw milk for the farms with 51–100 cows, down to 0.84 kg CO2e/kg milk for farms with more than 200 cows. However, the land use differs even more—the largest farms use 2.25 times less land per kg of milk than the smallest farms. Global warming potential, marine eutrophication, terrestrial acidification, and ecotoxicity were highest for the mid-sized farms. If current domestic, farm-based protein feeds were to be substituted with imported soy feed (one of the most popular high-protein feeds) the environmental impacts of Latvian dairy production would significantly increase, e.g., land use would increase by 18% and the global warming potential by 43%. Environmental policy approaches for steering the farms should consider the overall effects of operation size on environmental quality, in order to support the best practices for each farm type and steer systematic change in the country. The limitations of this study are linked to national data availability (e.g., national data on feed production, heifer breeding, differences among farms regards soil type, manure management, the proximity to marine or aquatic habitats) and methodological shortcomings (e.g., excluding emissions of carbon sequestration, the use of proxy allocation, and excluding social and biodiversity impacts in life-cycle assessment). Further research is needed to improve the data quality, the allocation method, and provide farm-size-specific information on outputs, heifer breeding, manure storage, and handling.
1. Introduction
Dairy production systems are important and complex sources of environmental impacts including global warming, nutrient losses, water and land use [1]. The sustainable intensification of animal production is generally promoted as a way to mitigate these environmental impacts while increasing productivity [2,3]. Nevertheless, the dairy sector has shown a global trend toward intensification [4].
During the last decades following the global trend, dairy cow management systems in Latvia are intensifying rapidly [5,6,7], i.e., the role of grazing has decreased, and indoor feeding and high protein diets have increased. This intensification process has been in parallel with the concentration of the dairy industry, where small farms leave the market whereas the most competitive farms continue growing and increasing their herds [7]. Nevertheless, the dairy systems in Latvia are still very diverse and are largely determined by the number of cows in a herd. Eighty-four percent of the dairy farms are small—less than 10 animals per farm—producing 18% of the country’s raw milk. Most of them are self-sufficient farms that do not deliver dairy products to the market. A similar situation exists in many Eastern European countries as well as in developing countries [8,9,10].
Data obtained from a survey in Latvia shows significant differences in milk yield depending on the size of the herd (see Table 1). Milk yield depends on diet and the cows’ ability to consume dry matter (DM) [11]. While consumption of DM is affected by the quality and digestibility of feed and the optimum ratio of roughage and feed concentrate in the feed ration [12], diets, on the other hand, are linked to the size of the herd affecting the milk yield. The average milk yield of the farms that graze their dairy cows is lower than that of the farms who do not graze their dairy cows [13].

Table 1.
Description of the technical management routes.
Apart from the milk yields and diets of different size dairy farms, they also differ by other parameters, e.g., the milking technologies and cowsheds (heat-insulated and uninsulated) used [13], as well as the cow breeds. Two dairy cow breeds account for almost 75% of the total dairy cows in Latvia—Latvian Brown, and Black and White Holstein. However, there is no reliable data that shows how these factors create differences in a farm’s output among different farm sizes.
Empirical research on the environmental effects of intensification shows that increased dairy production per ha leads to increased impacts per ha, but environmental impacts per kg of raw milk are not as clear [15]. Other studies show that increasing milk production per ha may lead to reduced global warming potential (GWP) per kg of milk [16,17] and improvements in feed efficiency, fertility, and cow longevity are important parameters to reach increased milk yield and lower climate and land footprints per kg of milk [18,19].
This study aims to compare the environmental impacts of raw milk production by different size dairy farms in Latvia. The goal was to use the life-cycle impact assessment (LCA) method to gain insights into differences among farms in terms of their environmental impacts. In addition, the effect of protein feed substitution is also assessed. These results will help better tailor environmental policies to different size farms, and thus decrease the environmental impacts of dairy farming.
2. Materials and Methods
Life-cycle assessment (LCA) is a widely acknowledged and standardized method to evaluate environmental impacts during the entire life cycle of a product (ISO, 2006). Therefore, we developed the LCA model to capture the most important interactions in complex dairy production systems and determine cradle-to-farm gate (all processes involved in milking farms and production of inputs used in farms) environmental impacts of milking cows in Latvia.
Thus, the model describes the diversity in diets and the main inputs (energy, water, and minerals) for different milking farm management strategies in Latvia. More specifically, the system boundaries of this study include the following processes and flows: emissions from manure storage and application and enteric fermentation by ruminants, direct and indirect emissions from animal feed, energy, and water use. Diet composition is an input to this module which includes the cultivation and processing emissions of all feed resources, such as grass (including grazing and hay), alfalfa and maize silage, fodder, roots, as well as molasses, rapeseed expeller and meal, salt, minerals, and vitamins. However, infrastructure and machinery are excluded from the scope of this study.
Although heifers are an important part of the dairy production system, the growing of heifers could not be included in this study as the database used does not have information on heifer rearing processes. Heifer rearing would need a specific study because there are also big differences in the existing production practices. Small farms mostly grow the heifers in the same farm, heifer farming being a side role of the farm. Big farms, however, mostly buy heifers externally from farms that specifically concentrate on heifer farming.
In LCA, the environmental impact is expressed per functional unit, which in this study was one kg of fat and protein corrected milk (FPCM) leaving the farm-gate, which allows us to compare the environmental impacts of different farming systems—the farms with different herd sizes. The following equation was used to calculate FPCM [20]:
FPCM (kg/a) = milk (kg/a) × ((0.1226 × fat %) + (0.0776 × protein %) + 0.2534))
Dairy farms generate several outputs to the technosphere. The herd at the average Latvian dairy farm consists of nine dairy cows. Dairy cows which are severely injured or old are slaughtered and hardly any male animals are kept, while most female calves are kept and raised for herd replacement. Most of the male calves and a small number of the female calves which are not needed for herd replacement are sold shortly after birth. Therefore, the environmental impacts in this study have been allocated across these co-products utilizing a proxy mass-based allocation approach—raw milk (85.95%), cows for slaughter (12.35%), and calves (1.7%) [21]. In this study these percentual allocations are applied equally across all the farms as we are missing farm-size-specific information.
Most of the data were collected from secondary sources (see Table 1). Data on herd sizes were obtained from the Central Statistics Bureau (CSB) database [6]. Information about the protein and fat content in the milk for different size farms, used to calculate the FPCM, was obtained from the national Agriculture Data Center (ADC) [14]. These are reliable data sources that are also used in the national inventory to calculate agricultural gross greenhouse gas (GHG) emissions [22].
Diet composition as kg dry matter per cow (see Table 2) and average daily nutrient provision in feed rations for cows in different size farms (see Table 3) were obtained from the survey done by Degola et al. [23], where they obtained data about feed intake values in different size herds from 24 animal feeding experts from the Latvian Rural Advisory and Training Centre. It should be mentioned that the dietary intakes in Table 2 represent average data for each of the fodder in a particular farm group. In smaller farms, there is a wide diversity in feeding strategies, and thus the daily intake in DM differs from the daily DM consumption per cow in Table 3. However, feed related impact calculations are based on the total daily DM consumption from Table 3. Emission factors of feed production were obtained from a life-cycle inventory data from the EcoInvent 3 database [21].
Table 2.
Average daily feed intake per cow in different management groups (kg DM).
Table 3.
The average daily nutrient provision in feed rations for cows in different management groups.
We also had to use several assumptions to differentiate the farms. For heating energy use we assumed that the smallest farms (1–9 cows) were using non-heated barns, while other farms (>9 cows) were using wood biomass for the milking room heating [24]. Electricity consumption was differentiated based on the assumption that smaller farms are not using power for ventilation, milk cooling, and milking (see Table 4). However, we have to acknowledge that some of the information is missing and not covered by this study, e.g., the proximity of the farms to marine or aquatic habitats or a difference in soil quality, fertility, type, and topography among farm sizes.
Table 4.
The annual energy consumption in different management groups.
The cumulative life-cycle inventory data were assessed at the mid-point level using the ReCiPe 2016 (H) V1.02 method. Following the most relevant environmental impact categories for dairy production proposed by the European Dairy Association [25], assessments were made of:
- Gross GWP— GHG emissions from cattle (feed production, enteric fermentation, and manure), excluding carbon sequestration, expressed in kg CO2 equivalents (CO2e);
- Acidification terrestrial—NOx, NH3, or SO2 related emissions expressed in kg SO2 equivalents (SO2e);
- Marine eutrophication—emissions of nitrogen to water and soil expressed in kg N equivalents (Ne);
- Freshwater eutrophication—emissions of phosphorus to water and soil expressed in kg P equivalents (Pe);
- Land use—dairy products being at the top of the food pyramid play important role in the competition for arable land through feed production and grazing areas, and thus have a significant impact on terrestrial species via change of land cover and the actual use of the new land expressed in m2 of crop equivalents (cropeq.) [26];
- Water use—the use of water (m3) in such a way that it is evaporated, incorporated into products, transferred to other watersheds, or disposed into the sea [26];
- Fossil resource scarcity—the dairy supply chain is still heavily reliant on fossil fuel use in feed production, transport, as well as on-farm activities. Fossil resource scarcity (kg oileq.) is defined as the ratio between the energy content of the fossil resource x and the energy content of crude oil, and is based on the higher heating value of each fossil resource (crude oil, natural gas, hard coal, brown coal, and peat) [26].
Additionally, we analyzed freshwater ecotoxicity as we believe it is one of the key issues for sustainable agriculture and that dairy farmers can perform actions to reduce the toxic impact of dairy production on ecosystems [11]. Sometimes insecticides are also used directly on the animal to protect them from insects during hot summer days. However, because of the lack of reliable data, this is not included in the study.
With regards to the GWP, in this study, we tried to cover all the major emissions, but because of the lack of reliable data, soil carbon sequestration is not included in the calculation of the carbon footprint of crop production in this study. Similarly, nitrogen fixation by plants is excluded from the study as it is a soil quality dependent process and soil data for the different farm types is not available.
Annual methane emissions from enteric fermentation per cow were calculated using the following equation, provided by the United Nations Food and Agriculture Organization (FAO) [2]:
where:
Annual CH4 emission = ((DMa × Ym/100)) × (18.55/55.65)
- -
- DMa is the annual consumption of dry matter;
- -
- The methane conversion factor (Ym) value of 6.5 is realized at a digestibility of 65% (according to the IPCC 2006 guidelines at Tier 2 level);
- -
- The factor 55.65—the energy content of methane (MJ/kg CH4).
- -
- The factor 18.45—Energy intensity of feed (MJ/kg DM).
Methane emissions from enteric fermentation were calculated to be from 85.8 in the small farms to 148 kg CH4 cow−1 year−1 in the largest farms (>200 cows). The average annual national methane emission factor was calculated to be at 118 kg CH4 cow−1, while the national methane emission factor used for the year 2016 in the National Inventory was 136 kg CH4 cow−1 year−1 [22]. Latvia uses a higher emission factor for dairy cows based on a different feeding situation that is not fully characterized as stall-fed (set for Tier 1). Besides, the digestibility used for calculations of emission coefficient is lower (65% against 70% for Tier 1).
Methane emissions depend on the composition and amount of manure produced (anaerobic conditions, found at the bottom of deep lagoons, increase methane emissions) and the type of storage used [2]. Methane productivity is also determined by the quantity of volatile solids in the manure which depends on the digestibility of feed—low digestibility feed results in a high amount of volatile solids in manure which are then converted to methane. In Latvian small farms, milk cows are still mainly stanchioned, producing farmyard manure, but with increasing intensification there is a gradual transition to the producing of liquid manure [27]. It is expected that the diets of cows (high levels of grass and silage) on the smaller farms will result in higher N excretion because the amount and form of the N excreted is affected by the concentration and ruminal degradability of crude protein in the diet. However, it should be noted that these factors are not fully considered in this study as there are no data available on manure management for the different sizes of farms in Latvia. Therefore in this study, annual methane emissions of manure management and N excretion rates for dairy cows were taken from the national inventory and are set as 17.28 kg CH4 cow−1 year−1 and 113.9 kg N cow−1 yr−1 respectively [22].
3. Results
The analysis of the environmental impacts of milking cows by farms practicing different management systems in Latvia shows that the relationship between farm management practices/size and environmental impacts is not straightforward, i.e., in some impact categories (water footprint and land use) the small farms create the most burden, but in other categories (e.g., global warming, marine eutrophication, fossil resource scarcity, terrestrial acidification) the highest impacts are caused by the mid-sized farms (see Table 5).
Table 5.
Results of the characterization: comparison between environmental pressures of different size dairy farms in Latvia per kg of FPCM.
For all the farms, the largest GWP is associated with enteric fermentation and manure (see Figure 1). For smaller farms, these factors account for 61% of the GWP, but for farms with 200 or more cows these factors account for 68% of all the impact per kg of raw milk produced. The second most important process is alfalfa-grass silage, which peaks (15% of GWP) in the mid-sized farms. The next most important factor is concentrates (in our case pea and oat), which combined accounted for 9 to 15% of GWP. These feed-related GHG emissions are mostly from the energy used in field management and harvest. Emissions associated with electricity production are responsible for 2 to 3% of GWP, but in this case, smaller farms have relatively smaller electricity consumption than larger farms. Results for GWP depend mainly on different diet efficiencies and energy use. Global warming potential in our study varies from 1.1 kg CO2e/kg of milk from the farms with 51–100 cows to 0.84 kg CO2e/kg of milk from farms above 200 cows. Thus, the national average gross GWP is 0.9 kg CO2e/kg of raw milk, but GWP per cow is between 5200 kg of CO2e in the smallest farms and 7700 kg of CO2e in the farms with 51 to 100 cows (see Table 6). The total cradle-to-farm gate GWP of the milking cows in Latvia is estimated to be 1 million tons of CO2e.
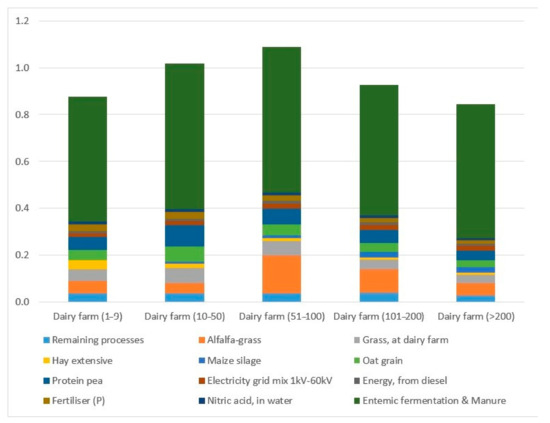
Figure 1.
Global warming potential (t CO2e/t milk) for different dairy systems in Latvia.
Table 6.
Annual GWP and land use for different management groups.
One of the important impact categories is land use, which from all the parameters analyzed has the highest coefficient of variation among the different farm sizes (26%). Land use linearly decreases from 1.02 ha per cow in the smallest farms to 0.68 ha in the largest farms (see Table 6). To produce 1 kg of raw milk the smallest farms require 1.71 m2 (including pastures), but the largest farms require only 0.76 m2 of land. The main contributors to the land use in the smallest farms are grass (50%) and protein feeds (27%), but as the farms intensify the role of grass decreases. Therefore, for the largest farms, the main contribution to land use is from protein pea (29%), grass (21%), alfalfa-grass silage (17.5%), and oat (14%). The method used to assess land use does not specify different land use categories, such as more or less productive agricultural lands.
Water footprint includes green (rainfall) and blue (freshwater stored in lakes, rivers, and aquifers) water use. The water footprint per kg of milk significantly decreases as farms get larger because the main contributor to water footprint is green water for grass production—which ranges from 88.6% in the smallest farms to 59.6% in the largest. Bluewater footprint (mostly used as drinking water for cows) accounts only for 1.7% of the water footprint in the smallest farms, increasing to 6.3% in the largest.
The differences in terrestrial acidification among the different size farms are minor (the coefficient of variation is 8%; see Table 4), but the impacts are highest for the farms with 10–50 cows and decreases for the largest farms. The largest contributor to terrestrial acidification for all the farms is ammonia emissions accounting for 53–67.5% of all impacts, but the next most important process is the growing of grass in pastures on the dairy farms due to manure from cows which is responsible for 17–24%. As ammonia accounts for most of the terrestrial acidification, the rankings are likely related to the amount and ruminal degradability of the protein as well as a level of milk production. As a result, it would seem that the amount of acidification could be constant across herd sizes if diets and cow genetic potential were equalized.
In the case of marine and freshwater eutrophication, the largest environmental impacts are on farms with 10–100 cows. The differences in these parameters among different management groups are large, with the coefficient of variation being 22% and 28%, respectively. Nitrogen flows into marine waters is estimated to be from 0.0037 kg Ne per kg of raw milk from the farms with 51–100 cows to 0.0018 kg Ne in the largest farms (see Table 4). The main contributor to marine eutrophication from milk production on the larger farms is alfalfa-grass silage feed (46% of all the impact from the farms with 51–100 cows to 30% in the largest farms), followed by grass grown at the farm (18–26%). However, for the smaller farms, the main processes contributing to marine eutrophication are grass and oat, which combined contribute more than 70% of all impacts. With regards to freshwater eutrophication, the two management groups which include the smallest farms (up to 50 cows) have the highest impact—0.00023 kg Pe/kg of FPCM. However, the main contribution to freshwater eutrophication from all the farms is from grass, followed by oat and alfalfa-grass silage.
Additionally, for freshwater ecotoxicity the largest environmental impact is from farms with 10–50 cows. The largest contributors are concentrates (oat ~30% and pea (24–31%)) (see Table 4). Alfalfa-grass silage is also responsible for a significant part of freshwater ecotoxicity—contributing 18% of all the terrestrial ecotoxicity impact from the smallest farms to 13% from the largest farms.
The results of our study demonstrate that the production of one kg of milk needs 37–62 g of oil equivalent fossil resources (see Table 4). In this case, the highest fossil resource intensity is for farms with 51–100 cows. The main contributors are production of alfalfa-grass silage (13–26%), protein feeds (17–25%), and fertilizer (P) (10–15%).
Additionally, we looked at changes in the environmental impacts of supplementary protein substitution. In this case, we analyzed substituting pea in the combined feed with soy, as it is increasingly entering the market as a high-protein feed for dairy cows in Latvia. For this, we used global process data on the environmental impacts of soy meal production from the Ecoinvent database [21]. Results demonstrated that most of the environmental impacts would increase, e.g., GWP for the farms with 10–50 cows would increase by 57% and for the largest farms by 32% (see Figure 2), but on average GWP per kg of milk would increase by 43%. As a result of the substitution, the land use in the smallest farms would increase by 12% and for other farms by 19%, on average increasing the land use of raw milk production by 18%. These increasing impacts are mostly linked to the soy production-related land-use change, domestic transport, and industrial processing [28]. However, it can also be assumed that introducing soybean meal to the diets of the dairy cows would decrease the protein supplement fed to keep the diets isonitrogenous.
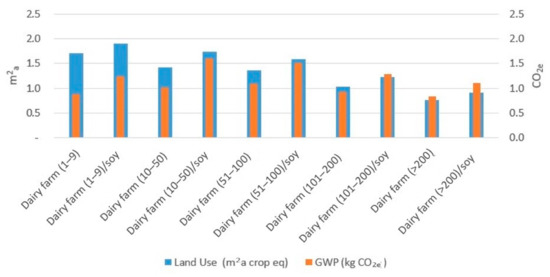
Figure 2.
Impact on land use and GWP per kg of FPCM if pea in cow diet was substituted by soy.
4. Discussion and Conclusions
Our results show that the environmental impacts of milking cows are different on farms with different management strategies. For some of the impact categories, e.g., global warming, marine eutrophication, terrestrial acidification, and ecotoxicity, the highest environmental impacts are for mid-sized farms with 10 to 50 cows. In general, the trend of most environmental impacts is decreasing as the farms increase in size, thus partly confirming that many of the environmental impacts assessed here decrease with increasing milk yields [29,30,31]. However, the smallest farms perform worse than the mid-sized farms with 10–50 cows only in two out of eight environmental impact categories.
The largest farms (>200 cows), through increasing protein content in their feed and choosing more productive breeds, have managed to significantly increase their milk yields and thus, also improve the environmental performance on certain environmental impact categories of production. Our results demonstrate that dairy system intensification generally provides a significant decrease in all of the impact categories assessed, when measured per kg of raw milk. The most significant reduction was observed for water and land use. These results are somewhat different from others that argue that intensification decreases eutrophication and land use per kg of raw milk but has no clear effects on other impact categories.
In our study, for all the farms enteric fermentation had the largest impact on the GWP, followed by feeds (alfalfa, protein feeds, and grass) and electricity consumption. Increasing the consumption of concentrated feeds in the largest herds lead to higher milk yields and thus, helped to decrease relevant environmental impacts. The global warming potential of the raw milk at the farm gate in different LCA studies varies significantly—from 0.9 to 2.4 kg CO2e per kg of milk [27,32]. Results from our study are on the bottom line of this spectrum. This could be explained with the scope of the study excluding heifer rearing, which could increase the global warming potential of the milk by roughly 1/5 [33].
Differences in the environmental impacts of different farms can be explained by differences in feeds and diets of lactating cows as well as by differences in energy use of these farms, as the smallest farms are less energy-intensive in their performance but are more reliant on grazing (grass consumption). Higher milk yields are obtained in the larger farms, which have been achieved by incorporating proteins that are more resistant to ruminal degradation—soy or pea protein may be more efficiently used than proteins in forages like alfalfa.
It should be also noted that dairy cows in traditional systems provide other essential services, e.g., biodiversity protection and the conservation of cultural landscapes [34]. Unfortunately, as in the current study, these grazing benefits (e.g., carbon sequestration, biodiversity) are excluded due to the lack of approved assessment methods, and thus intensive systems are likely favored [35]. As a result, our study highlights the potential conflict between GHG emission and land use efficiencies and other environmental objectives, similar to Edwards-Jones et al. [36], and further emphasizes the need for the development of scientifically robust methods to assess carbon sequestration, biodiversity, and social impacts. Carbon sequestration is not covered by this study, but it is clear that optimized grazing, pasture improvement, and the restoration of degraded pastures are critical in increasing grassland carbon sequestration [37].
In addition, the specification and characterization of land and water use by different areas and crops could provide more insights. Grass production often takes place in areas unsuitable, or at least economically not profitable, for other crop production. Thus, the higher land use of small farms (of which 50% is of grass) may not reflect the higher land use of highly productive agricultural land. Similarly, the method used to assess water use in the paper does not reflect water availability or scarcity. Thus, also regarding water use, the higher impact of small farms may not reflect an actual higher water consumption of scarce water resources.
We can also assume that smaller farms tend to use cultivated local protein feeds which have a relatively lower environmental impact than the soybean byproducts commonly used in larger conventional farms. From this study, the total national pea consumption is estimated to be 157 thousand tons of peas a year. According to the FAO data in 2017 only 29.5 thousand tons of dry pea were produced in Latvia [38]. However, not all of the on-farm production of peas for domestic consumption is included in the national statistics.
It should be also considered that soy (one of the most popular high-protein feeds) production results in other social-ecological impacts [39], e.g., land acquisitions [40] and biodiversity loss [41], which are not properly covered by this study. In assessing soy production-related climate impacts, it would be also important to include LUC-related emissions. Additionally, local characterizations of water use to reflect a scarcity of water would improve the understanding of the water use of different crops from different countries.
One of the main policy recommendations from this study is to differentiate the policy approach to different size dairy farms in Latvia. The largest problems are with the management of farms with a herd size of 10–50 cows as they have some of the highest environmental impacts because their feeding strategy does not deliver higher milk yields. These farms should receive better training in feeding strategies as most likely they are overfeeding their cattle. Farms with a diverse range of cow breeds should also develop diversified feeding strategies for each of the breeds. The use of an automatic feeding system normally linked to milking robots could help to do this, as they increase the possibility of controlling the nutritional value of feed concentrates for each particular cow.
The smallest farms (≤9 cows) on another hand should be supported as self-sufficient providers and as important mechanisms for landscape and biodiversity conservation. Small farms with a higher fat content in the milk they produce should be encouraged to focus on differentiated production, e.g., cheese making. The smallest farms also should be supported in the use of cultivated local protein feeds and utilize cow manure effectively to create regenerative benefits in their field area [42]. Small farms are also important in terms of the efficiency of utilizing local sources of dry matter. Their feeding strategies appeared to be the most flexible of all the management groups. Thus, small farms also need support for this purpose. Diverse feeding strategies in small farms also would be a proxy for enhanced biodiversity.
However, we should also acknowledge that this study has several limitations linked to national data availability (e.g., national data on feed production, heifer breeding, differences among farms regards soil type, manure management, and the proximity to marine or aquatic habitats) and methodological shortcomings (e.g., excluding emissions of carbon sequestration, the assessment method of water use, the use of proxy allocation, and the integration of social and biodiversity impacts in LCA). There is a need for the development of a national LCA inventory to further improve the quality and possibilities for environmental impact assessment.
Author Contributions
J.B. led the conceptualization, data collection, model development, calculations, interpretation of results, and writing of the manuscript; S.K. and H.H. contributed to research design, model development, analysis, interpretation of results, and writing of the manuscript. All authors have read and agreed to the published version of the manuscript.
Funding
This research was partly financed by the specific support objective activity 1.1.1.2. “Post-doctoral Research Aid” of the Republic of Latvia (Project No. 1.1.1.2/VIAA/1/16/065 “Developing New Tools for the Sustainability Assessment of the Bioeconomy”), funded by the European Regional Development Fund (Project id. N. 1.1.1.2/16/I/001). The APC was funded by authors.
Institutional Review Board Statement
Not applicable.
Informed Consent Statement
Not applicable.
Data Availability Statement
The data presented in this study are available on request from the corresponding author.
Conflicts of Interest
The authors declare no conflict of interest.
References
- Mu, W.; van Middelaar, C.; Bloemhof, J.; Engel, B.; de Boer, I. Benchmarking the environmental performance of specialized milk production systems: Selection of a set of indicators. Ecol. Indic. 2017, 72, 91–98. [Google Scholar] [CrossRef]
- Gerber, P.; Vellinga, T.; Opio, C.; Henderson, B.; Steinfeld, H. Greenhouse Gas Emissions from the Dairy Sector, A Life Cycle Assessment; FAO Food and Agriculture Organisation of the United Nations. Animal Production and Health Division: Rome, Italy, 2010. [Google Scholar]
- Garnett, T.; Appleby, M.C.; Balmford, A.; Bateman, I.J.; Benton, T.G.; Bloomer, P.; Burlingame, B.; Dawkins, M.; Dolan, L.; Fraser, D. Sustainable intensification in agriculture: Premises and policies. Science 2013, 341, 33–34. [Google Scholar] [CrossRef] [PubMed]
- Alvarez, A.; del Corral, J.; Solís, D.; Pérez, J.A. Does Intensification Improve the Economic Efficiency of Dairy Farms? J. Dairy Sci. 2008, 91, 3693–3698. [Google Scholar] [CrossRef] [PubMed]
- Pilvere, I.; Nipers, A.; Krievina, A. Analysis of the factors affecting cost efficiency in the dairy industry in Latvia. Econ. Sci. Rural. Dev. Conf. Proc. 2016, 41, 251–258. [Google Scholar]
- CSB. Grouping of Farms of All Kinds by the Number of Cattle and Dairy Cows at End of Year (LLG240); Central Statistical Bureau of Latvia: Rīga, Latvia, 2019. [Google Scholar]
- Pilvere, I.; Nipers, A.; Krievina, A.; Upite, I. Development prospects of milk production in various size farm groups in Latvia. In Proceedings of the 19th International Scientific Conference Engineering for Rural Development, Jelgava, Latvia, 20–22 May 2020. [Google Scholar]
- Aubron, C.; Cochet, H.; Brunschwig, G.; Moulin, C.-H. Labor and its productivity in Andean dairy farming systems: A comparative approach. Hum. Ecol. 2009, 37, 407–419. [Google Scholar] [CrossRef]
- Bernard, J.; Le Gal, P.-Y.; Triomphe, B.; Hostiou, N.; Moulin, C.-H. Involvement of small-scale dairy farms in an industrial supply chain: When production standards meet farm diversity. Animal 2011, 5, 961–971. [Google Scholar] [CrossRef]
- Verhees, F.; Malak-Rawlikowska, A.; Stalgiene, A.; Kuipers, A.; Klopčič, M. Dairy farmers’ business strategies in Central and Eastern Europe based on evidence from Lithuania, Poland and Slovenia. Ital. J. Anim. Sci. 2018, 17, 755–766. [Google Scholar] [CrossRef]
- Nordborg, M.; Davis, J.; Cederberg, C.; Woodhouse, A. Freshwater ecotoxicity impacts from pesticide use in animal and vegetable foods produced in Sweden. Sci. Total Environ. 2017, 581, 448–459. [Google Scholar] [CrossRef]
- Osītis, U. Govju ēdināšana (Cow Feeding); Latvian Agricultural Advisory and Training Centre: Ozolnieki, Latvia, 2002; p. 45. [Google Scholar]
- Nipers, A.; Pilvere, I.; Valdovska, A.; Proskina, L. Assessment of key aspects of technologies and cow farming for milk production in Latvia. In Proceedings of the 15th International Scientific Conference “Engineering for Rural Development”, Jelgava, Latvia, 25–27 May 2016; pp. 175–181. [Google Scholar]
- ADC. Pārraudzības Rezultāti Ganāmpulkos 2017/2018 Pārraudzības Gadā (Monitoring Results of Herds in 2017/2018); Agricultural Data Center: Rīga, Latvia, 2019. [Google Scholar]
- Crosson, P.; Shalloo, L.; O’brien, D.; Lanigan, G.; Foley, P.; Boland, T.; Kenny, D. A review of whole farm systems models of greenhouse gas emissions from beef and dairy cattle production systems. Anim. Feed Sci. Technol. 2011, 166, 29–45. [Google Scholar] [CrossRef]
- Bell, M.; Wall, E.; Russell, G.; Simm, G.; Stott, A. The effect of improving cow productivity, fertility, and longevity on the global warming potential of dairy systems. J. Dairy Sci. 2011, 94, 3662–3678. [Google Scholar] [CrossRef]
- Casey, J.; Holden, N. The relationship between greenhouse gas emissions and the intensity of milk production in Ireland. J. Environ. Qual. 2005, 34, 429–436. [Google Scholar] [CrossRef] [PubMed]
- Audsley, E.; Wilkinson, M. What is the potential for reducing national greenhouse gas emissions from crop and livestock production systems? J. Clean. Prod. 2014, 73, 263–268. [Google Scholar] [CrossRef]
- Yan, M.-J.; Humphreys, J.; Holden, N. Life cycle assessment of milk production from commercial dairy farms: The influence of management tactics. J. Dairy Sci. 2013, 96, 4112–4124. [Google Scholar] [CrossRef]
- 20. IDF. Common carbon footprint approach for dairy: The IDF guide to standard lifecycle assessment methodology for the dairy sector. Bull. Int. Dairy Fed. 2010, 445, 1–46.
- Wernet, G.; Bauer, C.; Steubing, B.; Reinhard, J.; Moreno-Ruiz, E.; Weidema, B. The ecoinvent database version 3 (part I): Overview and methodology. Int. J. Life Cycle Assess. 2016, 21, 1218–1230. [Google Scholar] [CrossRef]
- MEPRD. Latvia’s National Inventory Report Submission under UNFCCC and the Kyoto Protocol Common Reporting Formats (CRF) 1990–2017; Ministry of Environmental Protection and Regional Development: Riga, Latvia, 2019. [Google Scholar]
- Degola, L.; Cielava, L.; Trūpa, A.; Aplociņa, E. Feed rations in different size dairy farms. In Proceedings of the Zinātniski praktiskā konference “Līdzvarota Lauksaimniecība”, Jelgava, Latvia, 25–26 February 2016; pp. 161–168. [Google Scholar]
- Lauku, T. Racionālu Piena Lopkopības Ražošanas Modeļu Rokasgrāmata (Handbook of Rational Dairy Production Models). Available online: http://www.laukutikls.lv/racionalu-piena-lopkopibas-razosanas-modelu-rokasgramata (accessed on 16 July 2020).
- EDA. Product Environmental Footprint Category Rules for Dairy Products; European Dairy Association: Bruxelles, Belgium, 2018. [Google Scholar]
- Huijbregts, M.; Steinmann, Z.; Elshout, P.; Stam, G.; Verones, F.; Vieira, M.; Hollander, A.; Zijp, M.; Van Zelm, R. ReCiPe 2016: A Harmonized Life Cycle Impact Assessment Method at Midpoint and Endpoint Level Report I: Characterization; National Institute for Public Health and the Environment: Bilthoven, The Netherlands, 2016. [Google Scholar]
- Priekulis, J.; Āboltiņš, A. Calculation methodology for cattle manure management systems based on the 2006 IPCC guideline. In Nordic View to Sustainable Rural Development, Proceedings of the 25th NJF Congress, Riga, Latvia, 16–18 June 2015; NJF Latvia: Riga, Latvia, 2015; pp. 274–280. [Google Scholar]
- Gil, J. Carbon footprint of Brazilian soy. Nat. Food 2020, 1, 323. [Google Scholar] [CrossRef]
- Nemecek, T.; Schmid, A.; Alig, M.; Schnebli, K.; Vaihinger, M. Variability of the global warming potential and energy demand of Swiss cheese. In Proceedings of the SETAC Europe 17th LCA Case Studies Symposium, Budapest, Hungary, 28 February–1 March 2011. [Google Scholar]
- Gerber, P.; Vellinga, T.; Opio, C.; Steinfeld, H. Productivity gains and greenhouse gas emissions intensity in dairy systems. Livest. Sci. 2011, 139, 100–108. [Google Scholar] [CrossRef]
- Knapp, J.; Laur, G.; Vadas, P.; Weiss, W.; Tricarico, J. Invited review: Enteric methane in dairy cattle production: Quantifying the opportunities and impact of reducing emissions. J. Dairy Sci. 2014, 97, 3231–3261. [Google Scholar] [CrossRef]
- Thomassen, M.A.; van Calker, K.J.; Smits, M.C.; Iepema, G.L.; de Boer, I.J. Life cycle assessment of conventional and organic milk production in the Netherlands. Agric. Syst. 2008, 96, 95–107. [Google Scholar] [CrossRef]
- Mc Geough, E.; Little, S.; Janzen, H.; McAllister, T.; McGinn, S.; Beauchemin, K. Life-cycle assessment of greenhouse gas emissions from dairy production in Eastern Canada: A case study. J. Dairy Sci. 2012, 95, 5164–5175. [Google Scholar] [CrossRef]
- Plieninger, T.; Höchtl, F.; Spek, T. Traditional land-use and nature conservation in European rural landscapes. Environ. Sci. Policy 2006, 9, 317–321. [Google Scholar] [CrossRef]
- Ripoll-Bosch, R.; De Boer, I.; Bernués, A.; Vellinga, T.V. Accounting for multi-functionality of sheep farming in the carbon footprint of lamb: A comparison of three contrasting Mediterranean systems. Agric. Syst. 2013, 116, 60–68. [Google Scholar] [CrossRef]
- Edwards-Jones, G.; Plassmann, K.; Harris, I. Carbon footprinting of lamb and beef production systems: Insights from an empirical analysis of farms in Wales, UK. J. Agric. Sci. 2009, 147, 707–719. [Google Scholar] [CrossRef]
- Chang, J.; Ciais, P.; Gasser, T.; Smith, P.; Herrero, M.; Havlík, P.; Obersteiner, M.; Guenet, B.; Goll, D.; Li, W. Climate warming from managed grasslands cancels the cooling effect of carbon sinks in sparsely grazed and natural grasslands. Nat. Commun. 2020, 12, 118. [Google Scholar] [CrossRef] [PubMed]
- FAO Stat. Food and Agriculture Organisation of the UN (FAO) Statistics Database: Production, Trade, Supply; FAO: Rome, Italy, 2019. [Google Scholar]
- Eriksson, M.; Ghosh, R.; Hansson, E.; Basnet, S.; Lagerkvist, C.-J. Environmental consequences of introducing genetically modified soy feed in Sweden. J. Clean. Prod. 2018, 176, 46–53. [Google Scholar] [CrossRef]
- Borras Jr, S.M.; Kay, C.; Gómez, S.; Wilkinson, J. Land grabbing and global capitalist accumulation: Key features in Latin America. Can. J. Dev. Stud./Rev. Can. D’études Du Développement 2012, 33, 402–416. [Google Scholar] [CrossRef]
- Crenna, E.; Sinkko, T.; Sala, S. Biodiversity impacts due to food consumption in Europe. J. Clean. Prod. 2019, 227, 378–391. [Google Scholar] [CrossRef]
- Schreefel, L.; Schulte, R.; de Boer, I.; Schrijver, A.P.; van Zanten, H. Regenerative agriculture–the soil is the base. Glob. Food Secur. 2020, 26, 100404. [Google Scholar] [CrossRef]


Publisher’s Note: MDPI stays neutral with regard to jurisdictional claims in published maps and institutional affiliations. |
© 2021 by the authors. Licensee MDPI, Basel, Switzerland. This article is an open access article distributed under the terms and conditions of the Creative Commons Attribution (CC BY) license (http://creativecommons.org/licenses/by/4.0/).