1. Introduction
Pedestrian movements are an important segment of the entire urban mobility and sustainable urban planning and design has to consider walkability of urban spaces as an important issue. The analysis and evaluation of walkability is the subject of numerous works in the literature [
1,
2]. Different works show evaluations of walkability through specific indicators [
1,
2,
3] also developed through some software tools for the evaluation of walkability [
4].
The modeling of pedestrian behavior in this context is an important tool in better understanding the influential factors, as it enables the analysis of a large number of scenarios and potentially dangerous interactions, without affecting the actual system and endangering the safety of pedestrian movements.
When considering pedestrian movements, route selection and pedestrian behavior at different types of intersections are connected and should be observed in the context of the entire pedestrian movement [
5]. The route selection must be observed in the spatial and semantic context and influential factors related to the motivation, content of the location and psychology are numerous [
6], as well as the ones related to the dynamics of changing preferences of the users [
7], which should be analyzed in generating time-based origin-destination matrices. In order to analyze pedestrian behavior at a specific type of intersection, the most commonly applied is modeling at microsimulation level. In the study [
8] Zeng et al. use an adjusted social force model in analyzing the influential parameters of pedestrian behavior at signalized intersections. Modeling results show good results in predicting individual trajectory and collision avoidance behavior with conflicting vehicles.
In study [
9] Bansal et al. formulated a model to explore the variation and examine the influential factors on pedestrian crossing speed at signalized intersection. The correlation analysis depicts that the pedestrian crossing speed has significant negative correlation with the crosswalk width, the crosswalk length, the width of the pedestrian island, the classification of road, average traffic flow and average pedestrian delay. The variation in the percentile crossing speeds exists among different age groups, group sizes, and crossing patterns but the statistical analysis indicates no significant difference between genders. The model has been developed using the stepwise linear regression (MLR) and as variables the width of crosswalk, width of pedestrian island, and average depth of delay were included. The reliability of the model is 70%.
Analyses of factors influencing pedestrian speed at signalized crosswalks was also done on the basis of field investigation in Taiwan [
10]. The significance of variables in the regression analysis in this study indicated that sex, temperature, weather, number of lanes, signal type, and pedestrian phase length significantly affect pedestrian walking speeds at crosswalks. In this case, the reliability of the model was around 18%.
These studies show that pedestrian movement is under significant influence of cultural heritage of a specific environment and conditions in which it was developed, therefore such models are not universally applicable. The adjustment of the microsimulation model of pedestrian movements to actual traffic conditions and location conditions, i.e., its’ calibration and validation through field measurements, is an essential prerequisite for successful application of modeling. In the study [
11], Gruden et al. achieved an improvement in the reliability of microsimulation models for pedestrians by applying neural networks in the model calibration process. The use of neural networks in modeling of pedestrian movements has shown to produce good results. Chakraborty et al. [
12] used an artificial neural network technique to develop a pedestrian fatal crash frequency model at the intersection level. In the research [
13] Zhang et al. used neural network for prediction of pedestrians’ red-light crossing intentions while Das et al. [
14] used an artificial neural network for traffic flow modelling to build a relationship between different pedestrian flow parameters. A comparison of results linear regression model between observed and estimated values for speed and flow parameters, the performance of ANN model gives better fitness to predict data as compared to the deterministic models.
The structure of the pedestrian flow is non-homogeneous, so special attention should be paid to vulnerable pedestrian groups [
15] such as elderly people, ill people, people with mobility difficulties, visually impaired pedestrians and children. The numerical indicators of child road traffic injury deaths [
16,
17,
18] clearly indicate the need to pay particular attention to this global problem.
Studies show different hazard perception of current traffic situation in different age groups of pedestrians. The research results of pedestrians’ hazard-perception skills in complex traffic scenes [
19] show the dependence of contextual variables and risk perception. The simple and usual design of the conflict zone, and less additional environmental content, results in greater attention in the analysis of the current traffic situation. According to the results of the study, the children and teens are highly influenced by the distraction of attention.
Authors Luo et al. presented the results of using virtual reality technology to identify risky pedestrian behaviors among Chinese children [
20]. The impact of cognitive and perceptual development on pedestrian behavior of children was analyzed and discussed. The roles of distraction, temperament and personality, and social influences from parents and peers were analyzed.
In the study [
21] Gitelman et al. observed child pedestrian behaviors at crosswalks of urban intersections aiming to characterize their behavior patterns and identify risk factors that may lead to injury. Multivariate logistic regression models were adjusted to identify factors associated with crossing on red and with non-checking vehicle traffic at un-signalized crosswalks. The results show that in addition to the age of children, different attention distractors have a significant impact on children’s risky behavior in traffic. The reality of models generating different traffic scenarios and predicting the behavior of pedestrians and of individual groups of vulnerable traffic users, such as children, is vital for successful testing of new technologies such is the applicability of autonomous vehicles [
22].
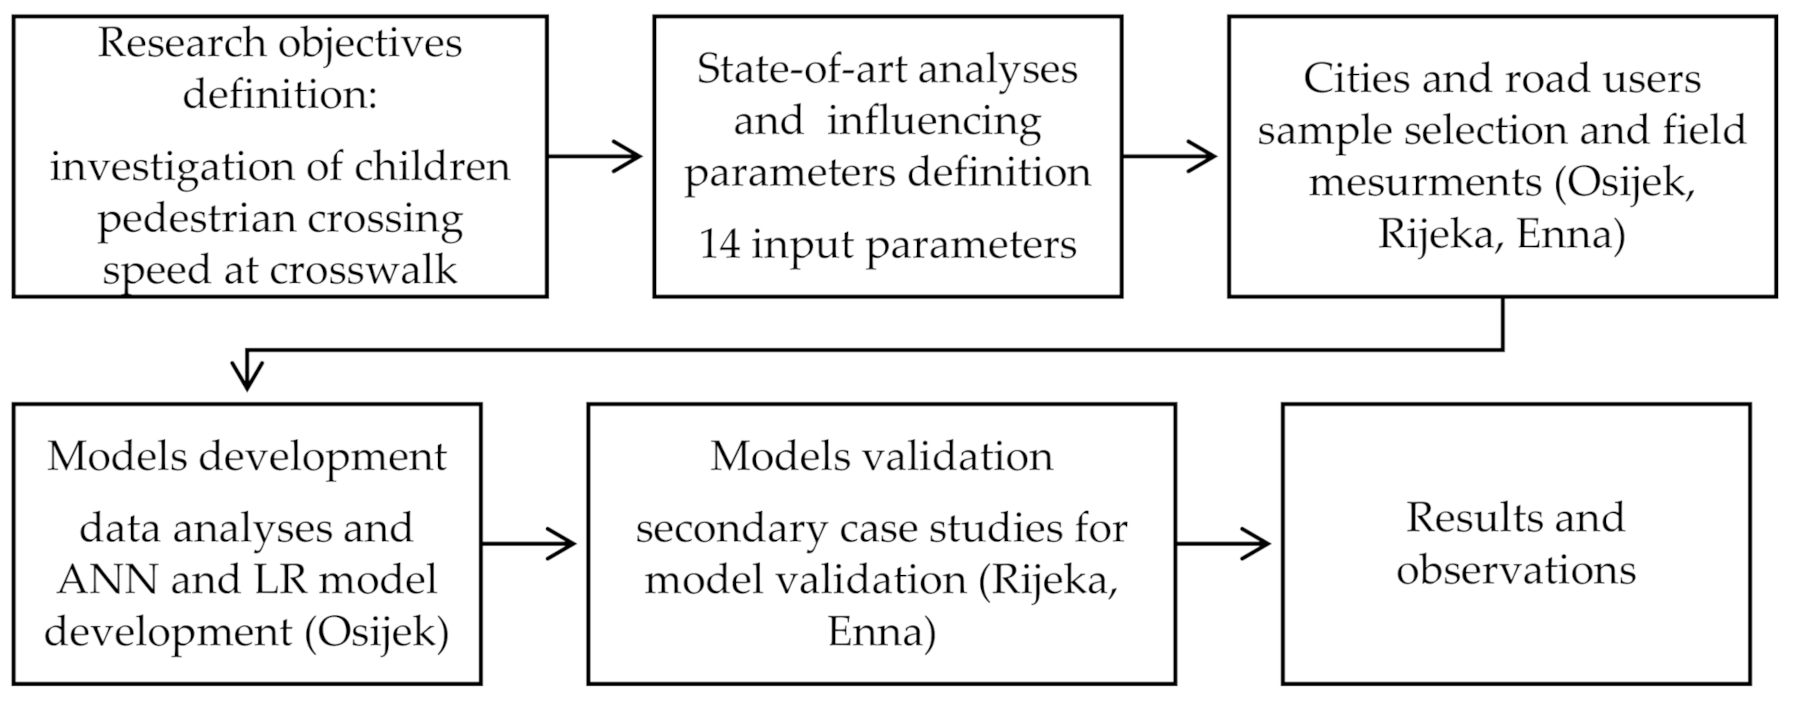
In this paper we presented the development of a model for prediction of children pedestrian crossing speed for children aged 5–15 at a signalized pedestrian crosswalk. Two models have been developed—a model based on neural network and a multiple linear regression model. Both models were developed on a set of data collected during measurements carried out in situ at the actual intersections in the city of Osijek, Croatia. In both cases, the model is based on 300 data on the children’s movement speed on signalized pedestrian crosswalks on primary city roads located near a primary school, and as parameters, both models include the traffic infrastructure features and the characteristics of children and their movement. The aim is to develop a reliable model of the neural network, and for the same data, a multiple linear regression model and compare reliability indicators for both models. Data collection was performed within the framework of the project of the Croatian Science Foundation Problems in the Behavior of School-aged Children: The Role of Executive Functions, Individual, Family and Genetic Factors-ECLAT, project leader Assoc. prof. Silvija Ručević, HRZZ-IP-2016-06-3917 (the approval of the Ethics Committee of the Josip Juraj Strossmayer University of Osijek, Faculty of Humanities and Social Sciences, to collect data and measure different indicators of children’s executive behavior, dated 11-04-2017, reference number: 1/4/2017i). The basic steps in model formation and validation are shown in
Figure 1.
The validation of the models on urban networks of other cities shall provide an opportunity and conditions for their wider applicability. The data collected in the similar manner (same methodology) in matching conditions (location, type and position of crosswalk in road network) in the city of Rijeka, Croatia and Enna, Italy were used to validate the models. One of the cities has some similarities with Osijek (same country, educational system, size) and the other is very different (size, different country and traffic system) so the analyzes of application of developed models in similar but also completely different environment will be discussed also.
2. Influential Parameters and Field-Testing Methodology
The influential parameters were selected based on analysis of existing studies among those that resulted important when it comes to research of pedestrian behavior. Many studies have shown that children’s behavior in traffic is influenced by their age, gender [
21,
23,
24] control of inhibitors, parental expectations and beliefs [
25], parental supervision [
26], the complexity of the situation [
19], the distraction of attention [
27,
28], and various development and other parameters that are not measurable in real traffic conditions.
The procedure for crossing a signalized pedestrian crosswalk involves the reaction time and time in the conflict zone (the time of crossing the conflict zone), but the two segments were considered separately, as the previous research [
29] found that they do not have the same influencing parameters and that those parameters that are the same do not have the same weighing coefficients. Distractors such as moving in a group and mobile phone use have the greatest impact on the reaction time [
29]. The use of mobile phone has a smaller impact on the speed of crossing the conflict zone than it has on the reaction time, while the movement of children in the group is still a significant distractor for the speed of crossing the conflict zone. In this research, the children pedestrian speed in conflict area of crosswalk—from the first step to the traffic lane to the first step on the sidewalk—was considered for analyzes and model development, as this is the most critical area considering traffic safety.
2.1. Selection of the Influential Parameters
In this study, 14 parameters have been selected for analysis based on the conclusions from the studies previously performed. Selected influence parameters can be grouped as follows: the characteristics of the children observed (age, gender, physical disabilities), pedestrian flow parameters (total number of pedestrians and number of children on pedestrian crosswalk), manner of movement (alone, in a group, accompanied by an adult), risky behaviors (running, distractions), and infrastructure (length and width of pedestrian crosswalk, length of traffic light cycle and green pedestrian time). Thirteen input parameters are included in further analysis, which were measured or observed in actual traffic conditions. The length of the traffic light cycle at the observed intersections was the same (90 sec), so the impact of this parameter could not be analyzed. The parameters included in this study are shown and described in
Table 1.
Most of the children included in these field measurements were included in the previous phases of the study and laboratory tests [
29], so their characteristics (age, gender, physical disabilities) were previously determined. Psychological characteristics, more detailed cognitive development indicators and developmental difficulties, such as hyperactivity, and their impact on the observed dependent variable have not been analyzed at this stage of research.
Crossing time was measured in the field, but due to the different geometric characteristics of the pedestrian crosswalks where data were collected, the chosen dependent variable was mean crossing speed achieved by children at the length of crosswalk.
2.2. Field Testing Methodology
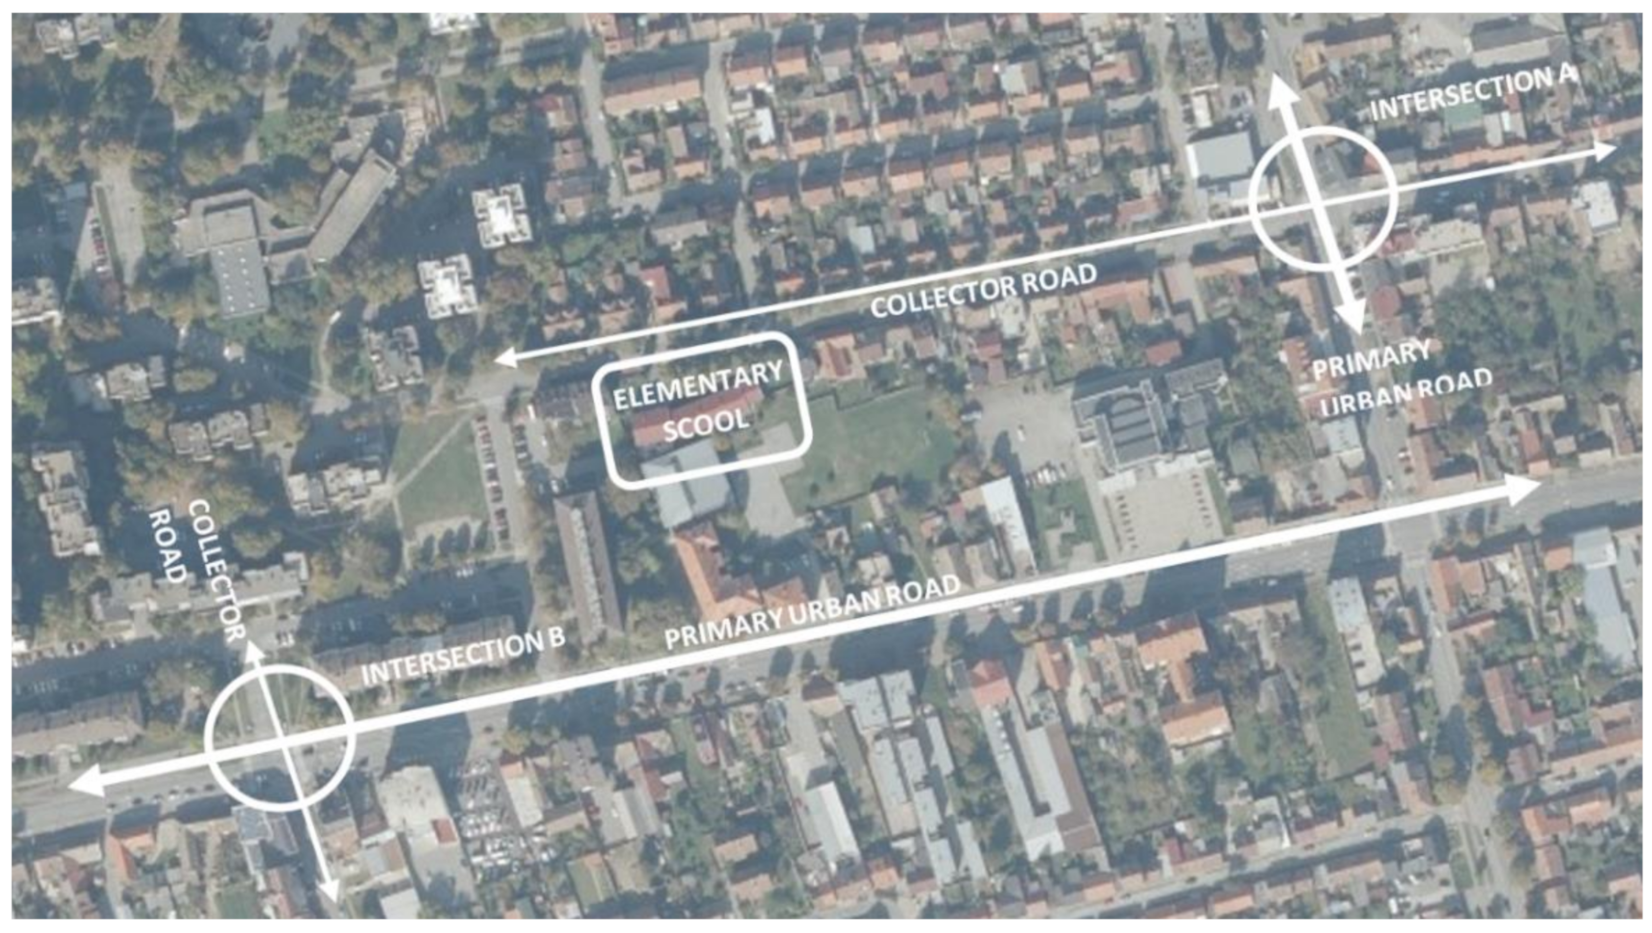
Data collection was performed at two intersections (Intersections A and Intersection B) with a total of 8 pedestrian crosswalks. Data were collected by video camera recording in real traffic conditions, from the first floor of a building near the intersections. Children were recorded during the usual journey to school in order to establish their, as realistic as possible, traffic behavior. The recordings were made during working days in May and June 2019. Sites were selected at collector and primary urban roads in the buffer area of primary schools and kindergarten (
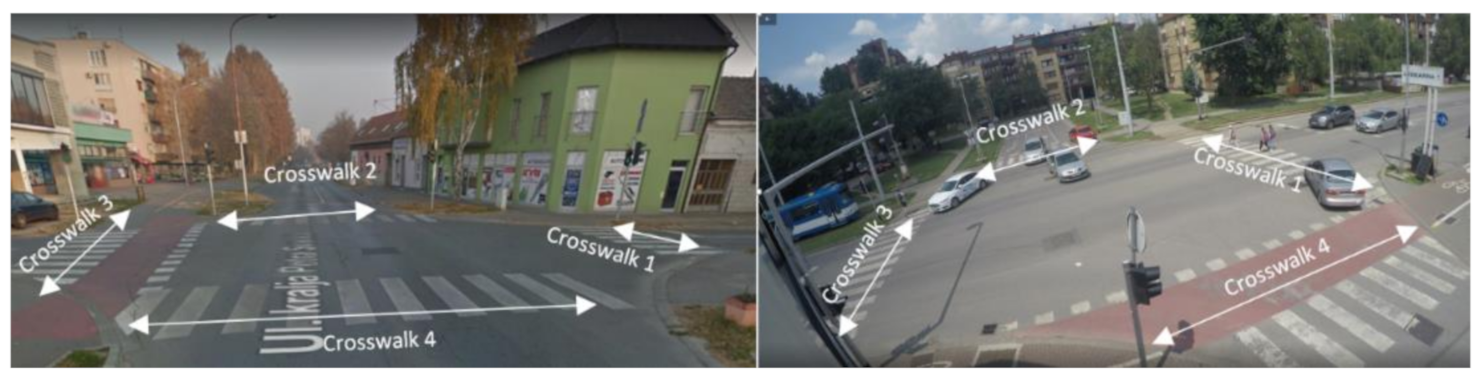
Figure 2). Two pedestrian crosswalks at each of the observed intersections (
Figure 3) have exactly the same geometric (width and length) and regulatory characteristics (duration of green pedestrian time, duration of cycle), so the number of data collected at these crosswalks can be observed, conditionally speaking, uniformly (
Table 2). In this context, it can be said that 6 pedestrian crosswalks of different geometric and regulatory characteristics have been observed.
3. Statistical Analysis of Collected Data
Based on video processing from the selected pedestrian crosswalks, a database of 300 measurements was made and parameters were defined (according to
Table 1). Of the children-pedestrians analyzed, 47% were girls, and 53% were boys, 26% were children walking in a group, and 6% were crossing the pedestrian crosswalk accompanied by an adult. In the overall population of children analyzed, 6% of children spoke on the mobile phone and 7% used the mobile device in some other way while crossing the road. Regarding the distribution of children by age, the fewest number of children were up to 5 years and 6-7 years of age, only 1.5% and 6% respectively, while all other age groups were represented by at least 13% and at most 25% of the sample (which is a minimum of 39 and a maximum of 75 children by age category). Overall, 3.3% of children were running while crossing the road, all of them in age groups from 6 to 11 (AG2, AG3, AG4) and mostly 8-year-olds.
The basic characteristics of the measured crossing speed of the entire database of field measurements are shown in
Table 3.
Anderson–Darling test results showed that measured dependent variable does not follow normal distribution (
Table 3). A probability plot of the observed dependent variables is shown in
Figure 4.
Taking into account that the measured data do not follow the normal distribution, analysis of the selected influential parameters was made using the non-parametric Kruskal–Wallis test, significance level of α = 0.05 was set. According to the results of Kruskal–Wallis test shown in
Table 4,
p-values confirm influence of the specific input parameter on the dependent variable—crossing speed (bold in
Table 4).
According to the results shown in
Table 4, two parameters have not shown to be influential: supervision by adults (I5) and width of pedestrian crosswalk (I 11).
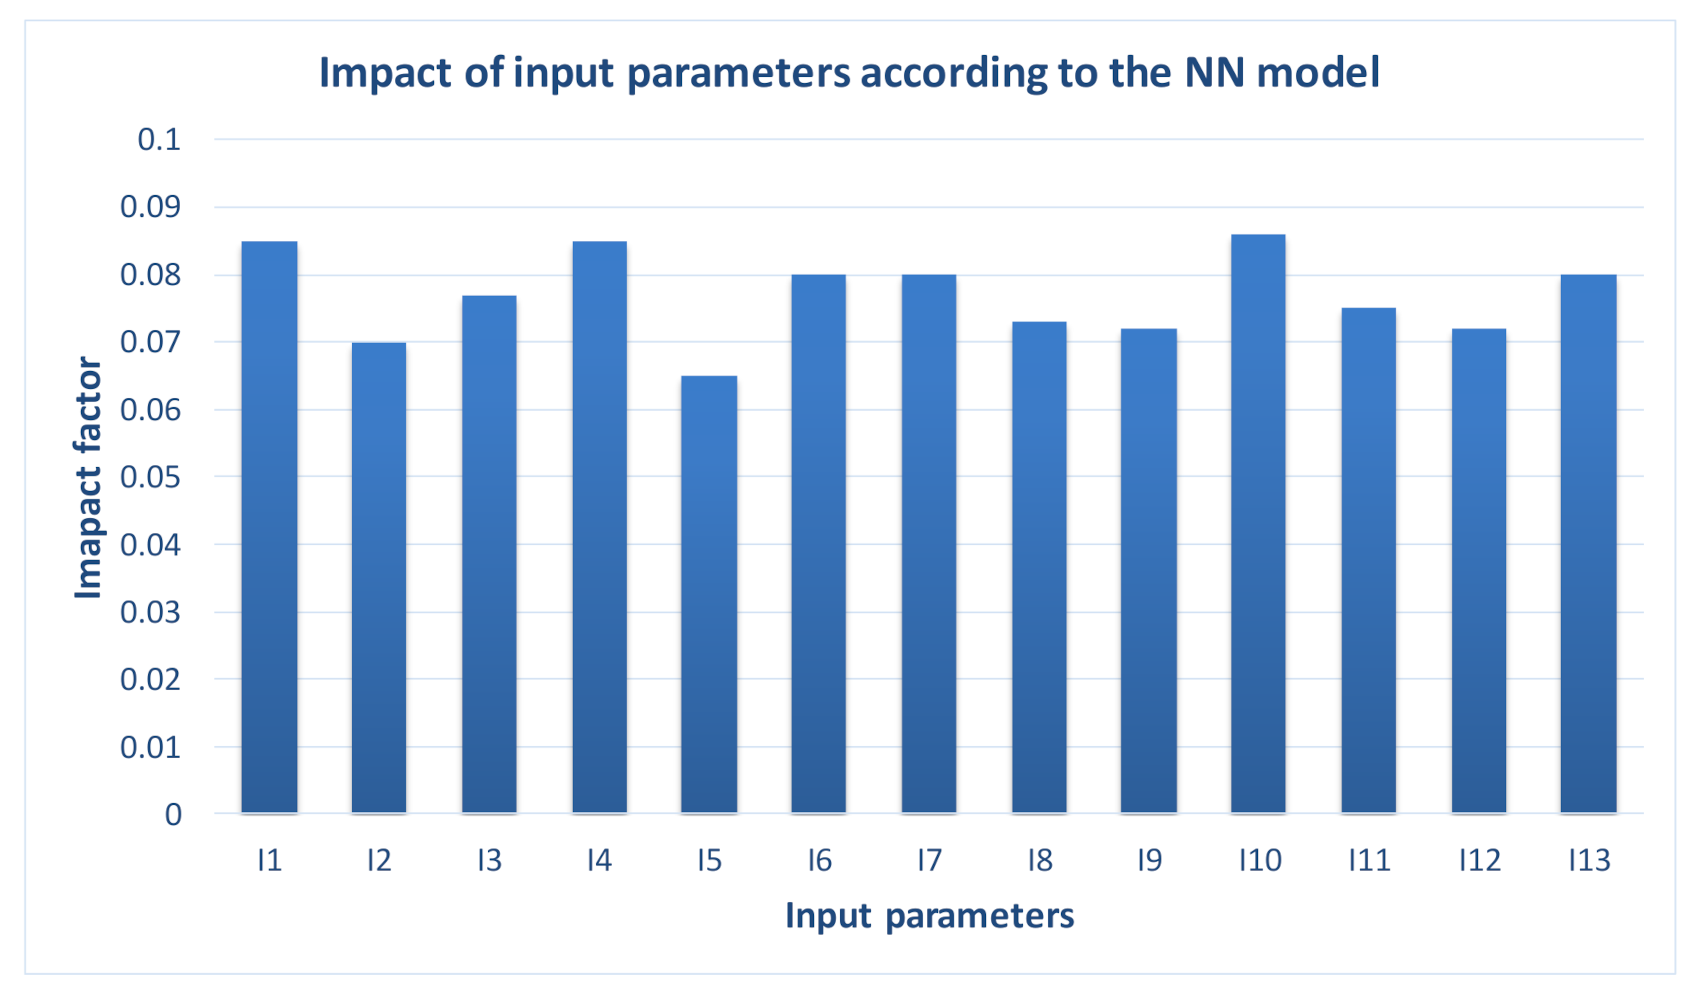
The influence of each input parameter on the prediction results, as recognized by the neural network, is shown in
Figure 5. According to the results obtained by the neural network, all parameters are influential, and the following parameters have the greatest influence: children age group (I1), movement in a group (I4) and length of pedestrian crosswalk (I10). By taking into account the analyses, all parameters described in
Table 1 were used to form a model.
4. Description of Models for Children-Pedestrian’s Crossing Speed
Within the framework of this paper two models for prediction of children’s crossing speed at a signalized pedestrian crosswalk were developed. The first model was made using neural networks, and the second model was made as a multiple linear regression model. Given below is a description of the models, modeling results, and their comparison and validation of the model on the basis of the data measured in the other cities.
4.1. Neural Network Model Description
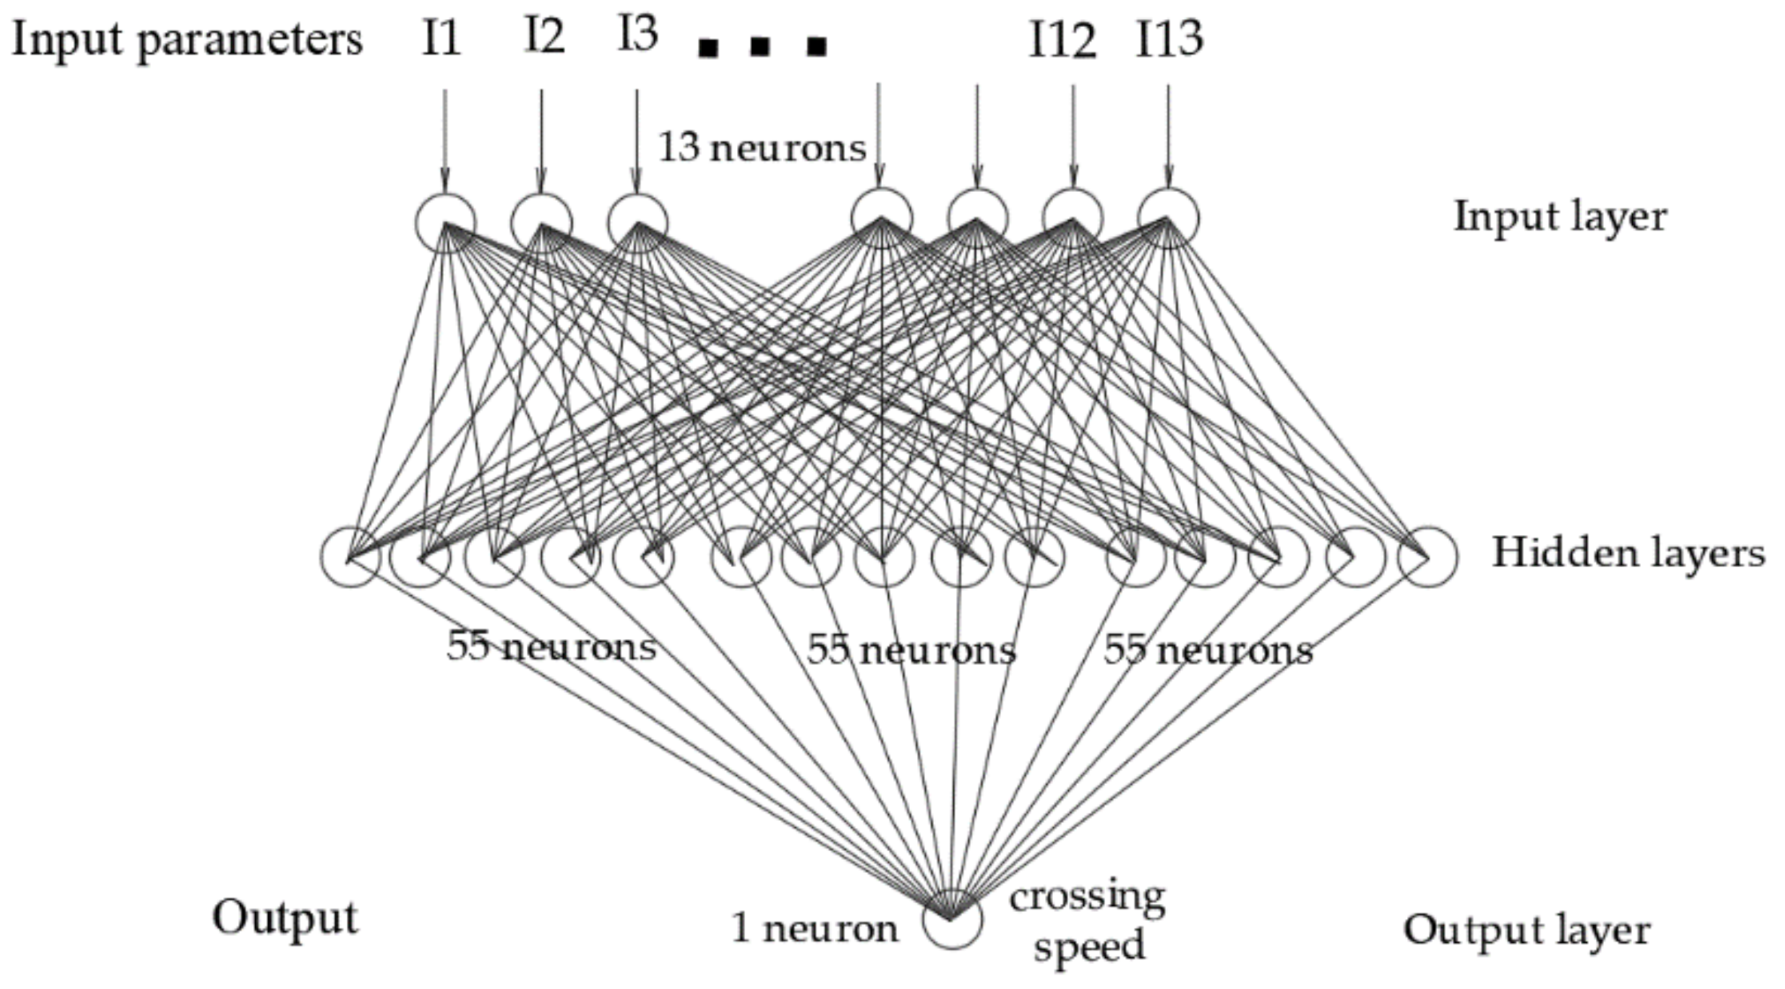
The database of 300 measured data in actual traffic conditions was used to define and train the neural network. The total database was divided into two sets, 80% of the data (240) was used for training and 20% (60) of the data was utilized for testing of generalizations. More than 20 neural network types and configurations were tested in NeuroShell2 software, with a different number of hidden layers and a different number of neurons in hidden layers, and the best results that each network gave when applied to the test dataset were memorized. The best response was obtained from Ward nets with three hidden layers and 55 neurons in each hidden layer, network characteristics and activation functions are given in
Table 5.
Ward nets, better known as feedforward networks, are neural networks structured in such a way that the neurons of a layer have as input signals, the outputs of the neurons in the precedent slab [
30]. A feedforward network in which each neuron of one layer is linked to the ones of the adjacent layer is called fully connected.
The number of neurons in the hidden layers is greater than the one recommended in the literature [
30], but this network configuration (
Figure 6) has given better learning and generalization results than the one with the initial number of neurons in the hidden layers.
There is no adopted rule as to which activation functions are used for which type of problem. There are some experiential and experimental recommendations [
31], but for complex problems the optimal activation function cannot be determined in advance. In the past few years, the use of visualization tools and techniques gives a better insight into the propagation of data in NN hidden layers [
32] exploring different aspects of NN training, topology, and parametrization [
33]. Special attention is paid to the process of activation of neurons in hidden layers through sets of activation functions and data propagation within hidden layers of the network, and the results show that different activation results between hidden layers are essential in creating an efficient internal network architecture [
34].
Existing researches and models regarding pedestrian behavior at crosswalks [
11,
29] as well as previous models describing vehicles movements [
35] suggest that different activation functions give better results in this kind of problems.
The learning process for the back-propagation network type is described by authors Basheer and Hajmeer [
36].
4.2. Linear Regression Model Description
The multiple linear regression model establishes the relationship between multiple input (predictor) variables (y
I) and the dependent variable f(y) observed. Mathematical model can be easily described by the expression (1)
The stepwise regression method was used to select the input variables for the multiple linear regression model i.e., the method of gradual expansion and reduction of the model dimension. This method considers all input variables regardless of the strength of the correlation connection and the significance of each variable is reexamined in each step. For the purposes of model development by using the stepwise regression method, individual input variables (Age group and Movement in a group) were divided into sub-variables, in order to analyze in more detail, the influence of children’s age as well as individual or group movement. The age group variable is divided into seven sub-variables (AG1–AG7) while the movement in a group variable is divided into 5 sub-variables (MG1–MG5).
Table 6 shows those variables and sub-variables whose inclusion in the model achieved the lowest Mean absolute error (MAE). It is evident that, of all input variables and sub-variables, the final model does not include some age groups (AG3, AG4, AG5, and AG6), gender, supervision, group movements (group greater than 2, i.e., MG3, MG4, and MG5), number of children on pedestrian crosswalk and pedestrian green time.
In order for the developed model to be applicable on other traffic networks, the input parameters must satisfy certain model assumptions, pedestrian crosswalk length 7–14 m, pedestrian crosswalk width 2.2–4.5 m, children running while crossing the road, presence of the children with special needs—disabilities, individual movement of children or in a group of 2, use of a mobile phone, multiple number of pedestrians (both children and adults) who cross the road at the same time (up to a maximum of 11) and children up to 7 years of age and over 15 years of age.
5. Modeling Results
The comparison of model prediction results and data measured in real traffic conditions was evaluated through selected statistical indicators [
37,
38,
39].
The correlation coefficient is a statistical measure of the strength of the relationship between the relative movements of two variables. The values range is [−1, 1]
Mean absolute error (MAE)
Minimum and maximum absolute error (minAE, maxAE)
Some additional statistical methods used to validate models are as follows:
Root-mean-squared error of prediction (RMSEp), defined as the square root of the average of the squared differences between the measured (ym) and predicted (yp) y-values
The accuracy of a model (Model Accuracy, Ac) is the percentage difference between the predicted and actual data. The mean accuracy of a model (Āc) for a series of tests is the arithmetic average of Ac. The closer the Āc of a model is to zero the more accurate the model is. A mean model accuracy of zero means that the model does not, on average, underestimate or overestimate the measured values.
The total accuracy (Am) of the model Am = Āc − standard deviation of Ac.
5.1. The Results of the Neural Network Model
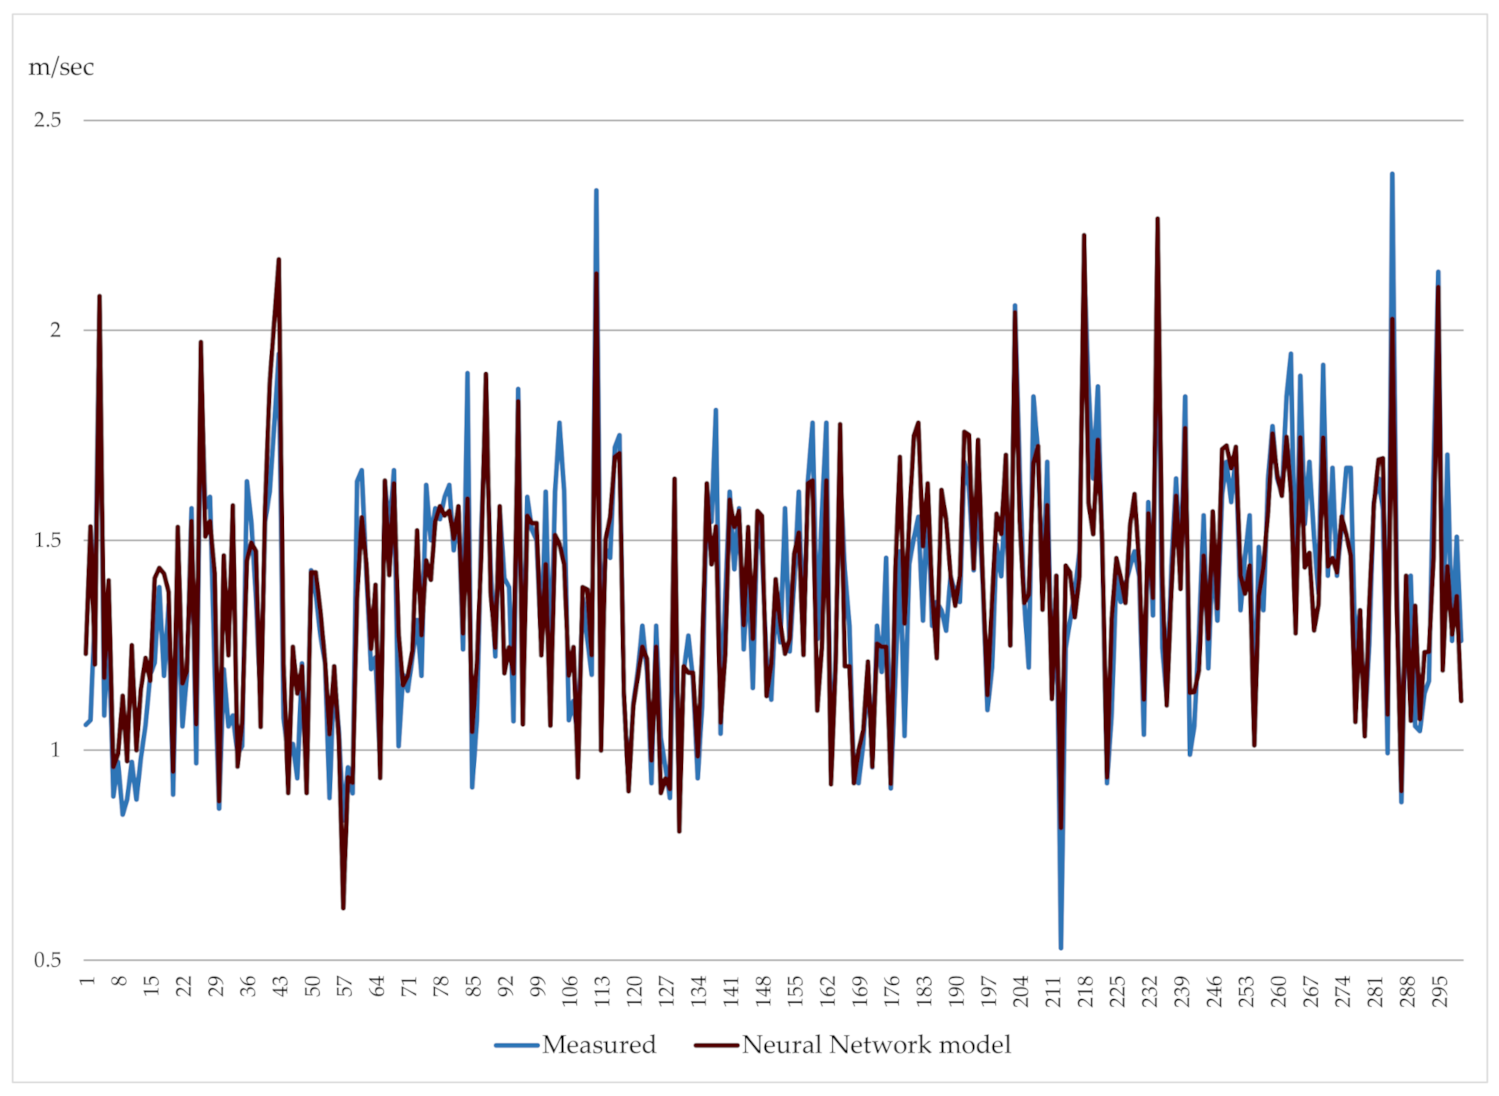
The prediction results of the children crossing speed provided by the neural network model show that the achieved correlation is 89.63% with the measured data, mean absolute error is 0.098 m/s. All model rating indicators (
Table 7) show that the model gives a good prediction of children crossing speed.
Figure 7 shows a comparison of the prediction provided by the neural network with the data measured in actual traffic conditions across the database.
5.2. Multiple Linear Regression Model Results
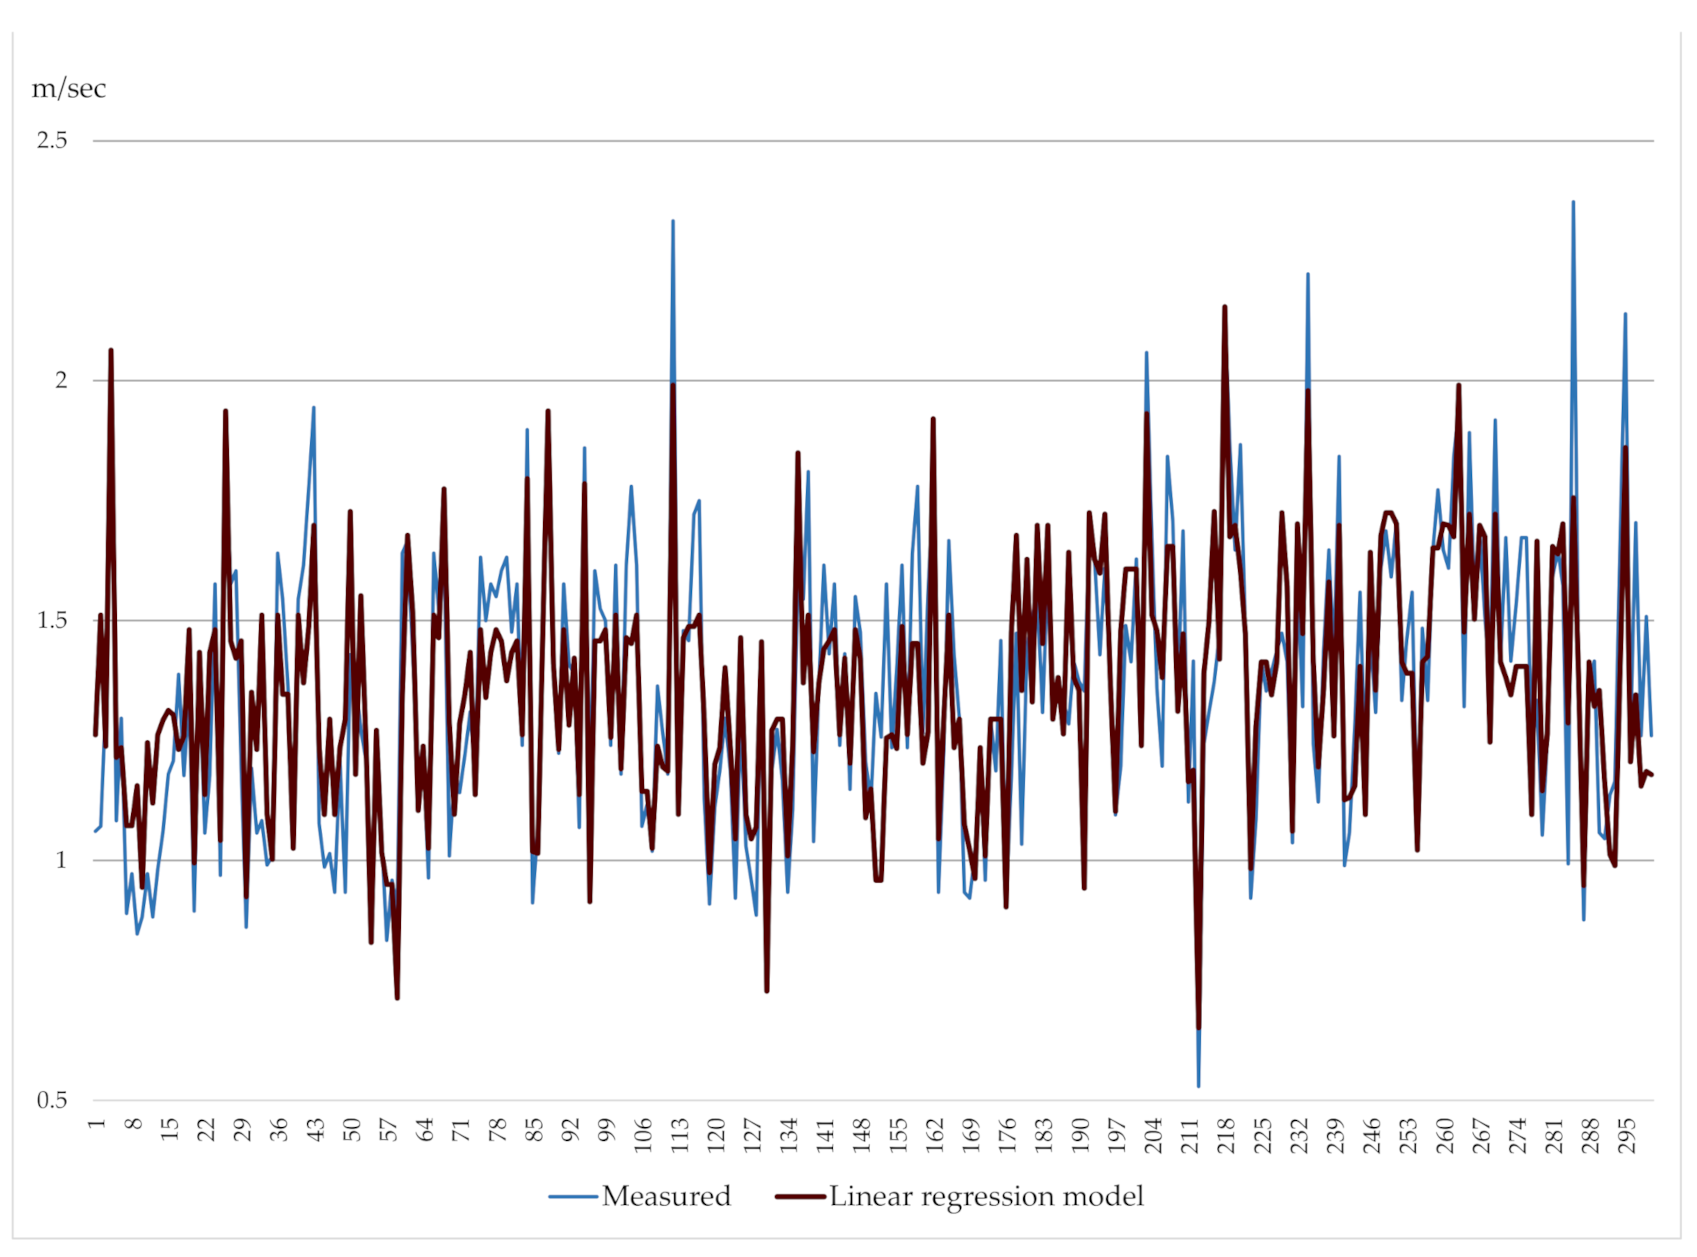
The results of the prediction provided by the LR model show achieved correlation of 84% with the measured data and mean absolute error is MSE = 0.127 m/s. According to model rating indicators (
Table 7) the linear regression model is applicable in the prediction of the observed dependent variable.
Figure 8 shows a comparison of the prediction provided by the LR model with the data measured in real traffic conditions.
5.3. Model Comparison According to Selected Indicators
The comparison of neural network model and multiple linear regression model according to the selected model rating indicators is shown in
Table 7.
According to the results shown in
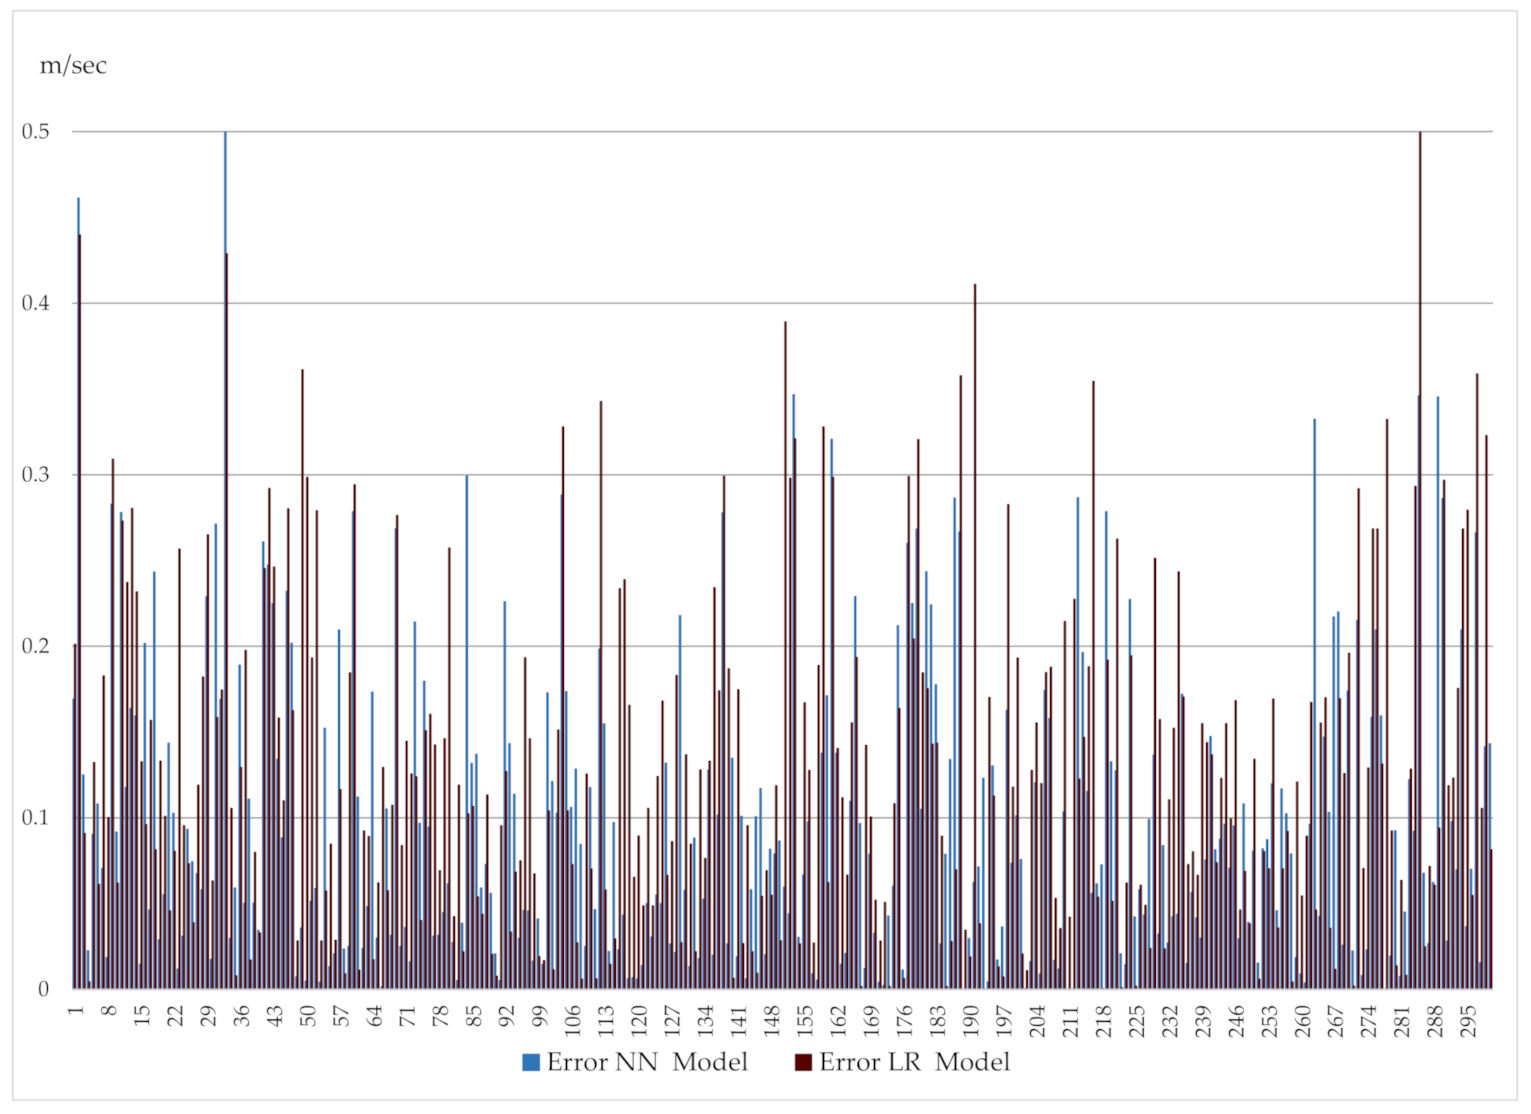
Table 7, better prediction results are achieved by the neural network model, it has a higher correlation coefficient and a lower mean absolute prediction error. The linear regression model gives acceptable results, and its advantage is broad applicability, as it does not require specific software or expertise. The results of both models show that they were applicable in local conditions, which was expected. The model validation results shown below, made in two very different urban traffic networks, provide insight into the possibility of a wider application of the model.
Figure 9 shows a comparison of absolute error values, as the absolute difference between measured (
ym) and predicted (
yp)data
for both models observed.
6. Models Validation
The validation of the models was made on an available measurement basis with the same methodology in the other two urban environments—in the city of Rijeka, Croatia and Enna, Italy. Rijeka and Osijek are cities with a similar number of inhabitants, around 100.000 inhabitants, but with significantly different spatial, urban and traffic conditions. While City of Rijeka is situated in very complex topographical conditions and has high inhabitation density (2900 inh/km
2), city of Osijek has very favorable location and inhabitation density of 640 inh/km
2 [
40]. The fact influences also, as shown in previous research, the traffic operation and management [
41]. Enna is a smaller city according to the number of inhabitants (around 30,000 inhabitants) and has a significantly different traffic system and habits.
In both cities (Rijeka, Enna), the experiment was conducted under the same conditions: the intersections were located at the vicinity of elementary school at the primary roads, the experiment was done during morning hours when children go to school at signalized pedestrian crosswalks. In all three cities the research included the categories of children aged 5–15 as in Osijek and the selected parameters explained in the previous chapter were elaborated in the same manner.
6.1. First Validation of the Models—Rijeka
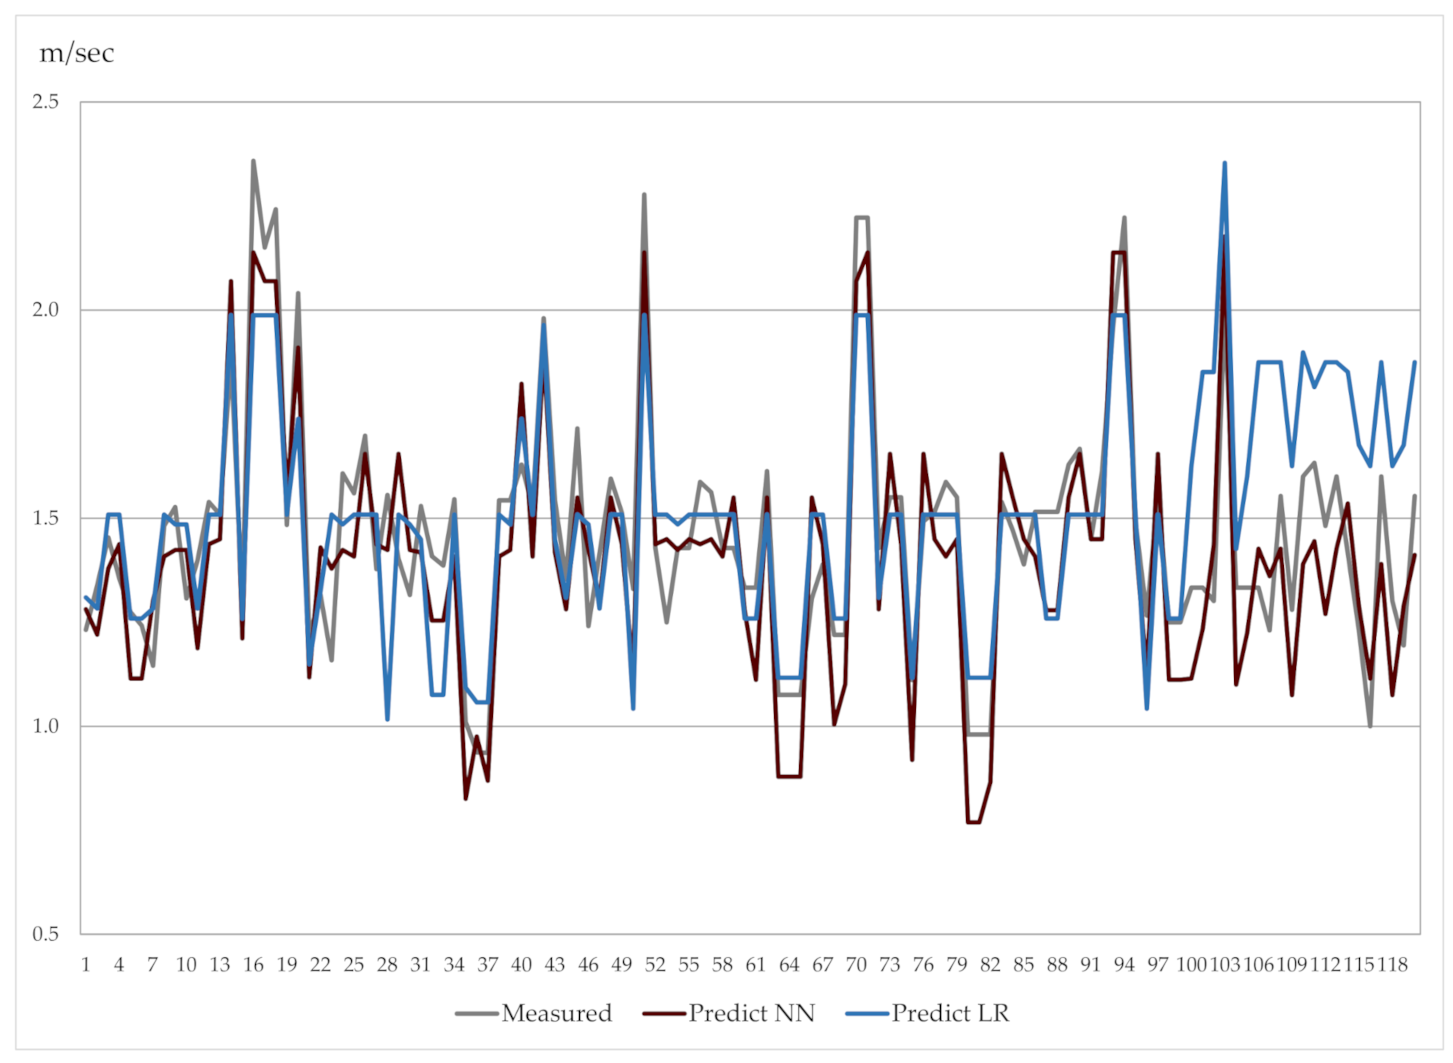
The base of pedestrian speeds of children-pedestrians in Rijeka available for model validation consisted of 120 measurements. Model comparison according to selected model rating indicators for database measured in Rijeka is shown in
Table 8. The validation results of both models compared to the measured data in situ are shown in
Figure 10.
The validation results of the neural network model on Rijeka’s urban traffic network (
Table 8,
Figure 9) show equally good prediction results as for the urban traffic network for which the model was developed (Osijek). Results show that the multiple linear regression model developed for Osijek can be used for preliminary assessment of children pedestrian’s speed in real traffic conditions in Rijeka, but for more detailed analysis, a model based on the data measured in local conditions should be developed.
6.2. Second Validation of the Models—Enna
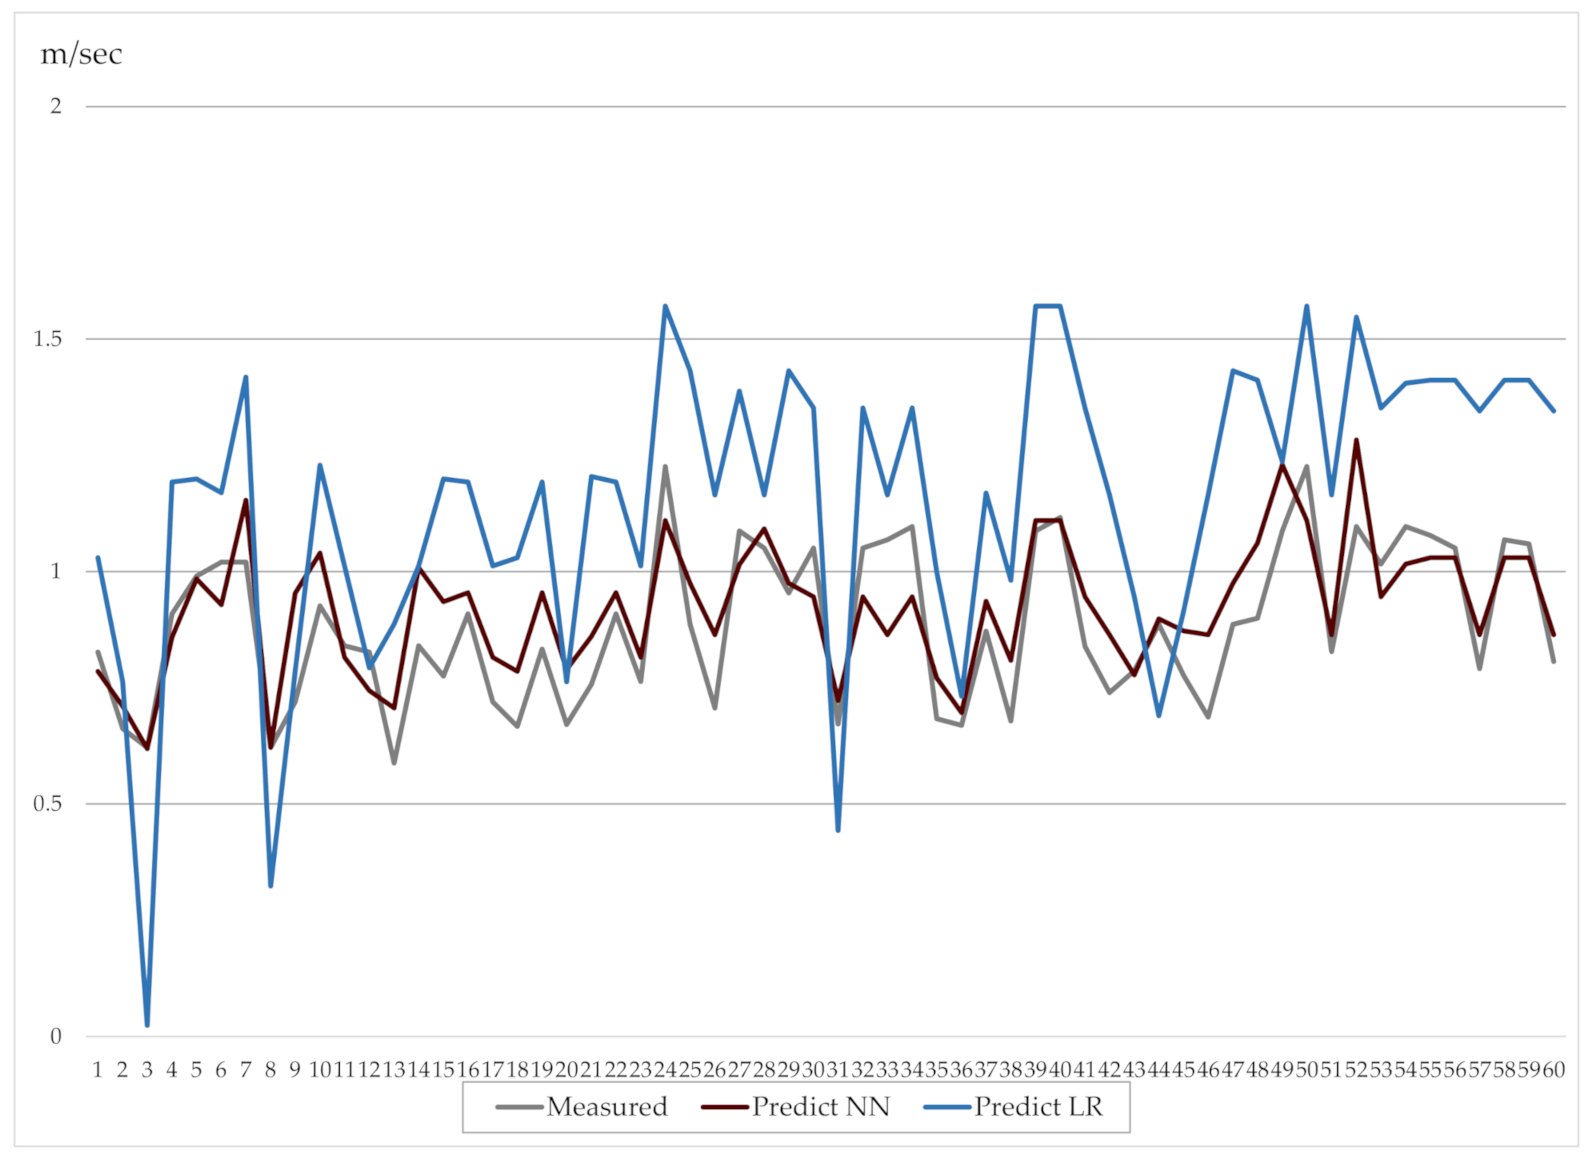
The children-pedestrian speed base in Enna, Italy, available for model validation was 60 measurements. Model comparison according to selected model rating indicators for the measured database in Enna is shown in
Table 9. The validation results of both models compared to the measured data in situ are shown in
Figure 11.
The validation results of the neural network model in Enna’s urban traffic network (
Table 9,
Figure 10) show that the neural network model is also applicable in conditions of the urban traffic network of another country in an urban environment with significantly different features (number of inhabitants, spatial and traffic conditions). The multiple linear regression model for children-pedestrians at signalized pedestrian crossings developed for Osijek, however, is not applicable in Enna. The mean error (MEA) of this model for Enna is twice as big than the one obtained for the data set measured in Rijeka
The analysis of the circumstances of the children’s movements at the observed intersections in Enna shows that a large number of children was supervised (organized assistants at the intersections, adult supervision), that children do not run on crosswalks and that the behavior of children is different from the one recorded in Osijek and Rijeka. For better insight into the performance of the model, a larger database of measured data than the existing one should be provided, and greater reliability of the model would be obtained for a linear regression model developed based on locally measured data.
7. Discussion
This paper deals with the development of a model of the speed of children-pedestrians at signalized pedestrian crosswalks, developed based on data collected in real traffic conditions. The models were developed using a database of 300 measurements collected in the urban traffic network of the city of Osijek, Croatia, and validation was carried out on data from two other urban networks, Croatia (Rijeka) and Italy (Enna). City of Rijeka has very similar number of inhabitants but different space organization and that resulted in different traffic conditions, so it is interesting to analyze possibilities of applying the model developed in Osijek in these changed circumstances. The City of Enna is very different from other two cities both in size, organization, traffic system, and culture.
Two models have been developed to predict the speed of children’s movement in the conflict zone, the neural network model and the multiple linear regression model. The performance of the model was assessed through eight selected indicators. The neural network model has better predictive performance indicators, with a correlation coefficient of 0.896 and mean average error (MEA) of 0.098 in comparison with the multiple linear regression model with correlation coefficient 0.840 and MAE 0.127. Both models are applicable to the local traffic network of the city of Osijek. The advantage of linear regression model is that it is easier to apply, it does not require expert software, which we see as an essential prerequisite for the ability to use the model in another environment. The impact of all input parameters on crossing speed has been analyzed during development of both models.
The neural networks model assesses that all input parameters are influential but the largest weighing coefficients are assigned to the children age, the movement in a group and to the length of the pedestrian crosswalk. While developing the multiple linear regression model, the carried out nonparametric statistical test (Kruskal-Wallis test) detected two parameters that have no effect on the speed of children-pedestrians at signalized pedestrian crosswalks and these are supervision by adults (I5) and width of pedestrian crosswalk (I11). In case of the first parameter, supervision by adults, the test result is partly unexpected because in some previous studies this parameter was shown to be significant [
26]. Analysis of the database found that only 6% of this situation was recorded in the entire database, which could be an explanation for the obtained result. The impact of second parameter, width of pedestrian crosswalk, is expected and probably more clearly visible [
9] at a stronger pedestrian traffic load than that recorded in this database and it will be addressed in further research.
For the development of the multiple linear regression model, the variables Age group and Movement in a group have been introduced into the model divided in sub-variables, and the number of input variables from the initial 13 has been increased to 23. The model was developed by a stepwise regression method, which identified 12 of the 23 input parameters as significant. Length of the pedestrian crosswalk, running across the crosswalk, individual movement of children (MG1), disabilities, use of the mobile phone, and the presence of the youngest children (AG1) have the greatest impact on crossing speed of all input parameters. When analyzing the age of children according to the multiple linear regression model, the impact of the youngest children (AG1 and AG2, children up to seven years) is significant, as well as the impact of the oldest group of children (AG7, older than 15 years) although the impact of the latter is slightly lower, while other categories are not recognized as significant. It is similar to the Movement in a group, where the model has detected a strong impact when children move individually (MG1) and a slightly lower impact when they are moving in a group of 2 (MG2), while other groups are excluded from the model development.
It is evident that both models recognize the two parameters as the most significant, and these are one geometric parameter (crosswalk length), and the manner of movement (individually or in a group).
An analysis of the applicability of the model outside of the local urban traffic network conditions based on which the models are developed is carried out through validation of the model. The first validation was made for the urban traffic network of the city of Rijeka in Croatia, for which the earlier research has shown that driving dynamics and driver reaction times differ from the conditions in Osijek [
41]. The second validation was made for a database from Enna in Italy. The validations were performed on available databases of 120 measurements (Rijeka) and 60 measured data (Enna), the measurements were performed for the same age group of children and using the same methodology as in Osijek. The results of the validation of the model show that the model of the neural network is applicable to both observed validation networks.
The achieved results, i.e., a correlation coefficient 0.905, MAE 0.129 for Rijeka, Croatia and correlation coefficient 0.822 and MAE 0.085 for Enna, Italy, show that the selected input parameters are influential in both monitored validation networks and that the model can be used for optimizing the geometric and regulatory characteristics of the conflict zone, as well as for analyzing the impact of different conflict zone solutions on vulnerable traffic users such are children. Validation results of the neural network model indicate a potential for its broader applicability than local.
The multiple linear regression model on the validation databases achieves weaker results. Rijeka had a correlation coefficient of 0.705 and MAE 0.159 indicating that the model could be used for e.g., a preliminary assessment of the variant solutions. However, for more sensitive analyses, a multiple linear regression model should be developed on a locally measured database.
The multiple linear regression model is not applicable on the validation base for Enna because it has a significant mean average error, which is twice the size of what the same model shows for Rijeka database. The traffic analysis at the monitored pedestrian crosswalks in Enna shows that children are mostly supervised (organized intersection assistants), which affects their slower movement speed in the conflict zone, and there is no running across the crosswalk which is a form of risky behavior. Considering that the multiple linear regression model recognizes the input parameter of supervision as insignificant, a significant prediction error has been obtained. The neural network model recognizes the significance of this parameter, so the prediction error is therefore significantly smaller.
8. Conclusions
The application of the model is an indispensable tool in analyzing the functional and safety features of the traffic system and its users, as experimentation in the real system is usually not acceptable. The particular challenge is to model the behavior of children in traffic, as they have their own specific characteristics when compared to the other categories of pedestrians.
In this paper two models for the speed of children-pedestrians at signalized pedestrian crosswalks were developed, validated and compared: a model of neural networks and a model based on linear regression. A signalized pedestrian crosswalk is a regulated traffic situation with clear rules, and the analysis of existing researches and children pedestrian behavior in actual traffic conditions has set out 14 parameters that can affect the behavior and speed of children in zones of signalized pedestrian crosswalks. The parameters are grouped into traffic infrastructure elements (length and width of the pedestrian crosswalk; length of green pedestrian light, length of cycle) and children’s characteristics (gender, age, potential disability) and their movement (group movement, use of the mobile phone when moving, running). No other cognitive development indicators for children are included in the models, except for the age of children.
A model that for the purpose of prediction uses more (13 in total) influential parameters, which is the neural network model, provided higher accuracy for the environment for which it was developed, (Osijek, Croatia) as well as for the two environments where the model was validated (Rijeka, Croatia; Enna, Italy).
The model based on multiple linear regression was also shown as applicable, except for Osijek on whose measurement base it was developed, in one of the validation bases—Rijeka, while the applicability indicators of the model are negative for Enna and the model should not be applied. When applying this type of model, it is important to know the basic premise of the model, the conditions in which the model was developed, its purpose and limitations, which was well illustrated by the application of the multiple linear regression model in Enna where the model is not applicable since it does not take the supervision parameter into account, which in the case of Enna has proven to be significant. The results of validation of the linear regression model in Enna show that the impact of supervision on children’s behavior at signalized pedestrian crosswalk needs to be further investigated.
The limitations of this research are in the size of the database, which does not cover some forms of behavior sufficiently to show the significance of its impact, such as the behavior of children in the case of adult supervision. The analysis of the database shows a relatively small percentage of cell phone use, although increasing the database would probably increase that percentage somewhat, it still does not represent the dominant distractor of attention in young children in local traffic condition.
Further research shall focus on increasing the database in all environments, as well as on a more detailed analysis of the geometric characteristics of the conflict zone, whose impact is not clearly defined by this research (impact of the width of pedestrian crosswalk, geometry of the pedestrian island) and the regulation parameters (impact of cycle length and green time for pedestrians). The continuation of the research would also comprehend the impact of the weather conditions and temperature on children’s behavior in the conflict zone as well as the examination of additional distractors, such as food or drink consumption, environmental content—static (billboards, shop windows) and dynamic (familiar person, child or group of children on the opposite side of the road) etc. An analysis of the sequence of children’s crossing speed would give a detailed and qualitative insight into the influence of various factors that occur during children’s crossing of a pedestrian crosswalk (e.g., the influence of the appearance of red light on children speed increase) and will be tested in future researches. Based on the experience obtained by of this research, it is planned to continue to explore the speed of children on non-signalized pedestrian crosswalks that have own significant particularities and where additional parameters become relevant, such as the dynamic characteristics of the vehicle traffic flow.
The application of the model of prediction of the vulnerable traffic groups’ behavior, in this case children, becomes a significant tool for optimizing the design elements and assessing the variant solutions for parts of the traffic system where they move on a daily basis and which needs to be adapted to their requirements. The continuous education of children regarding traffic behavior has a limited reach, if not combined with other preventive measures, among which the design of traffic infrastructure is one of the more important. Models of behavior prediction of vulnerable pedestrian groups become significant in the analysis of new traffic technologies, such as the interaction of autonomous vehicles with pedestrians.
Author Contributions
Conceptualization, I.I.O., A.D.-T., S.Š. and T.C.; methodology, I.I.O., A.D.-T. and S.Š.; software, I.I.O. and S.Š.; validation, I.I.O., A.D.-T. and S.Š.; formal analysis, A.D.-T.; investigation, I.I.O., A.D.-T. and S.Š.; resources, I.I.O., A.D.-T., S.Š. and T.C.; data curation, I.I.O., A.D.-T. and S.Š.; writing—original draft preparation, I.I.O.; writing—review and editing, A.D.-T., S.Š. and T.C.; visualization, S.Š.; supervision, I.I.O. and A.D.-T. All authors have read and agreed to the published version of the manuscript.
Funding
This research received no external funding.
Institutional Review Board Statement
The study was conducted according to the guidelines of the Declaration of Helsinki, and approved by the Ethics Committee of the Josip Juraj Strossmayer University of Osijek, Faculty of Humanities and Social Sciences, dated 11-04-2017, reference number: 1/4/2017i.
Informed Consent Statement
Informed consent was obtained from all subjects involved in the study.
Data Availability Statement
Data collected through research presented in the paper are available on request from the corresponding authors. Data are not publicly available because their use was approved for particular scientific project.
Acknowledgments
The authors would like to acknowledge that this research was supported by the international bi-lateral Croatian—Slovenian project “Development of prediction model of pedestrian children behavior in the urban transport network”, by the project of the Croatian Science Foundation Problems in the Behavior of School-aged Children: The Role of Executive Functions, Individual, Family and Genetic Factors-ECLAT and by the project “Transport infrastructure in the function of sustainable mobility” (uniri-tehnic-18-143—1289) supported by the University of Rijeka, Croatia.
Conflicts of Interest
The authors declare no conflict of interest.
References
- Blečić, I.; Congiu, T.; Fancello, G.; Trunfio, G.A. Planning and Design Support Tools for Walkability: A Guide for Urban Analysts. Sustainability 2020, 12, 4405. [Google Scholar] [CrossRef]
- Annunziata, A.; Garau, C.; Garau, C. A Literature Review on Walkability and its Theoretical Framework. Emerging Perspectives for Research Developments. In International Conference on Computational Science and Its Applications, Cagliari, Italy, 1–4 July 2020; Springer: Cham, Switzerland, 2020; pp. 422–437. [Google Scholar]
- Campisi, T.; Basbas, S.; Tesoriere, G.; Trouva, M.; Papas, T.; Mrak, I. How to Create Walking Friendly Cities. A Multi-Criteria Analysis of the Central Open Market Area of Rijeka. Sustainability 2020, 12, 9470. [Google Scholar] [CrossRef]
- Blečić, I.; Cecchini, A.; Congiu, T.; Fancello, G.; Trunfio, G.A. Walkability explorer: An evaluation and design support tool for walkability. In International Conference on Computational Science and Its Applications, Naples, Italy, 4–6 June 2014; Springer: Cham, Switzerland, 2014; pp. 511–521. [Google Scholar]
- Papadimitriou, E.; Yannis, G.; Golias, J. Critical Assessment of Pedestrian Behaviour Models. Transp. Res. Part F Traffic Psychol. Behav. 2009, 12, 242–255. [Google Scholar] [CrossRef]
- Kielar, P.M.; Borrmann, A. Modeling Pedestrians’ Interest in Locations: A Concept to Improve Simulations of Pedestrian Destination Choice. Simul. Model. Pract. Theory 2016, 61, 47–62. [Google Scholar] [CrossRef]
- Bierlaire, M.; Robin, T. Pedestrians Choices. In Pedestrian Behavior; Timmermans, H., Ed.; Emerald Group Publishing Limited: Bingley, UK, 2009; pp. 1–26. [Google Scholar] [CrossRef]
- Zeng, W.; Chen, P.; Nakamura, H.; Iryo-Asano, M. Application of Social Force Model to Pedestrian Behavior Analysis at Signalized Crosswalk. Transp. Res. Part C Emerg. Technol. 2014, 40, 143–159. [Google Scholar] [CrossRef]
- Bansal, A.; Goyal, T.; Sharma, U. Modelling the Pedestrian Speed at Signalised Intersection Crosswalks for Heterogeneous Traffic Conditions. Promet. Traffic Transp. 2019, 681–692. [Google Scholar] [CrossRef]
- Chang, C.Y.; Woo, T.H.; Wang, S.-F. Analysis of pedestrian walking speeds at crosswalks in Taiwan. J. East Asia Soc. Transp. Stud. 2011, 9, 1186–1200. [Google Scholar]
- Gruden, C.; Ištoka Otković, I.; Šraml, M. Neural Networks Applied to Microsimulation: A Prediction Model for Pedestrian Crossing Time. Sustainability 2020, 12, 5355. [Google Scholar] [CrossRef]
- Chakraborty, A.; Mukherjee, D.; Mitra, S. Development of pedestrian crash prediction model for a developing country using artificial neural network. Int. J. Inj. Control Saf. Promot. 2019, 26, 283–293. [Google Scholar] [CrossRef]
- Zhang, S.; Abdel-Aty, M.; Yuan, J.; Li, P. Prediction of Pedestrian Crossing Intentions at Intersections Based on Long Short-Term Memory Recurrent Neural Network. Transp. Res. Rec. 2020, 2674, 57–65. [Google Scholar] [CrossRef]
- Das, P.; Parida, M.; Katiyar, V.K. Analysis of interrelationship between pedestrian flow parameters using artificial neural network. J. Modern Transp. 2015, 23, 298–309. [Google Scholar] [CrossRef]
- Constant, A.; Lagarde, E. Protecting Vulnerable Road Users from Injury. PLoS Med. 2010, 7, e1000228. [Google Scholar] [CrossRef] [PubMed]
- Kyu, H.H.; Stein, C.E.; Pinto, B.C.; Rakovac, I.; Weber, M.W.; Purnat, D.T.; Amuah, J.E.; Glenn, S.D.; Cercy, K.; Biryukov, S.; et al. Causes of death among children aged 5–14 years in the WHO european region: A systematic analysis of the global burden of disease study 2016. Lancet Child Adolesc. Health 2018, 2, 321–337. [Google Scholar] [CrossRef]
- European Transport Safety Council (ECTS): Reducing child deaths on European Roads, PIN Flash Report 34, February 2018. Available online: https://etsc.eu/wp-content/uploads/PIN-FLASH_34.pdf (accessed on 1 December 2020).
- Ministarstvo Unutarnjih Poslova RH: Bilten o Sigurnosti Cestovnog Prometa 2019. (In Croatian). Available online: https://mup.gov.hr/UserDocsImages/statistika/2020/Pokazatelji%20javne%20sigurnosti/bilten_promet_2019.pdf (accessed on 1 December 2020).
- Meir, A.; Oron-Gilad, T. Understanding complex traffic road scenes: The case of child-pedestrians’ hazard perception. J. Saf. Res. 2020, 72, 111–126. [Google Scholar] [CrossRef] [PubMed]
- Luo, H.; Yang, T.; Kwon, S.; Zuo, M.; Li, W.; Choi, I. Using virtual reality to identify and modify risky pedestrian behaviors amongst Chinese children. Traffic Inj. Prev. 2020, 21, 108–113. [Google Scholar] [CrossRef]
- Gitelman, V.; Levi, S.; Carmel, R.; Korchatov, A.; Hakkert, S. Exploring patterns of child pedestrian behaviors at urban intersections. Accid. Anal Prev. 2019, 122, 36–47. [Google Scholar] [CrossRef]
- Schwab, B.; Beil, C.; Kolbe, T.H. Spatio-Semantic Road Space Modeling for Vehicle–Pedestrian Simulation to Test Automated Driving Systems. Sustainability 2020, 12, 3799. [Google Scholar] [CrossRef]
- Barton, B.K.; Schwebel, D.C. The roles of age, gender, inhibitory control, and parental supervision children’s pedestrian safety. J. Pediatr. Psychol. 2007, 32, 517–526. [Google Scholar] [CrossRef]
- Gorrini, A.; Vizzari, G.; Bandini, S. Age and Group-driven Pedestrian Behaviour: From Observations to Simulations. Collect. Dyn. 2016, 1, 1–16. [Google Scholar] [CrossRef]
- Gielen, A.C.; DeFrancesco, S.; Bishai, D. Child pedestrians: The role of parental beliefs and practices in promoting safe walking in urban neighborhoods. J. Urban Health 2004, 81, 545–555. [Google Scholar] [CrossRef]
- Rosenbloom, T.; Ben-Eliyahu, A.; Nemrodov, D. Children’s crossing behavior with an accompanying adult. Saf. Sci. 2008, 46, 1248–1254. [Google Scholar] [CrossRef]
- Byington, K.W.; Schwebel, D.C. Effects of mobile internet use on college student pedestrian injury risk. Accid. Anal. Prev. 2013, 51, 78–83. [Google Scholar] [CrossRef] [PubMed]
- Schwebel, D.C.; Stavrinos, D.; Byington, K.W.; Davis, T.; O’Neal, E.E.; de Jong, D. Distraction and pedestrian safety: How talking on the phone, texting, and listening to music impact crossing the street. Accid. Anal. Prev. 2012, 45, 266–271. [Google Scholar] [CrossRef] [PubMed]
- Ištoka Otković, I. A Model to Predict Children’s Reaction Time at Signalized Intersections. Safety 2020, 6, 22. [Google Scholar] [CrossRef]
- Trenn, S. Multilayer perceptrons: Approximation order and necessary number of hidden units. IEEE Trans. Neural Netw. 2008, 19, 836–844. [Google Scholar] [CrossRef] [PubMed]
- Wang, Y.; Li, Y.; Song, Y.; Rong, X. The Influence of the Activation Function in a Convolution Neural Network Model of Facial Expression Recognition. Appl. Sci. 2020, 10, 1897. [Google Scholar] [CrossRef]
- Rauber, P.E.; Fadel, S.G.; Falcao, A.X.; Telea, A.C. Visualizing the hidden activity of artificial neural networks. IEEE Trans. Vis. Comput. Graph. 2017, 23, 101–110. [Google Scholar] [CrossRef]
- Hohman, F.M.; Kahng, M.; Pienta, R.; Chau, D.H. Visual Analytics in Deep Learning: An Interrogative Survey for the Next Frontiers. IEEE Trans. Vis. Comput. Graph. 2018, 25, 2674–2693. [Google Scholar] [CrossRef]
- Cantareira, G.D.; Etemad, E.; Paulovich, F.V. Exploring Neural Network Hidden Layer Activity Using Vector Fields. Information 2020, 11, 426. [Google Scholar] [CrossRef]
- Ištoka Otković, I.; Tollazzi, T.; Šraml, M. Calibration of microsimulation traffic model using neural networks approach. Expert Syst. Appl. 2013, 40, 5965–5974. [Google Scholar] [CrossRef]
- Basheer, I.A.; Hajmeer, M. Artificial neural networks: Fundamentals, computing, design, and application. J. Microbiol. Methods 2000, 43, 3–31. [Google Scholar] [CrossRef]
- Yeniay, O.; Goktas, A. A comparison of partial least squares regression with other prediction methods. Hacet. J. Math. Stat. 2002, 39, 99–111. [Google Scholar]
- Liu, H.; Gopalkrishnan, V.; Quynh, K.T.N.; Ng, W.K. Regression models for estimating product life cycle cost. J. Intell. Manuf. 2009, 20, 401–408. [Google Scholar] [CrossRef]
- Krstić, H.; Marenjak, S. Maintenance and operation costs model for university buildings. Teh. Vjesn. 2017, 24, 193–200. [Google Scholar] [CrossRef]
- Škunca, S. Koliko su hrvatski gradovi doista veliki? Prostorno planiranje kao čimbenik razvoja u županijama. Zb. Rad. 2015, 183–191. (In Croatian). Available online: https://zavod.pgz.hr/projekti/publikacije/zbornik4 (accessed on 1 December 2020).
- Ištoka Otković, I.; Deluka-Tibljaš, A.; Šurdonja, S. Validation of the calibration methodology of the micro-simulation traffic model. Transp. Res. Proc. 2020, 45, 684–691. [Google Scholar] [CrossRef]
Figure 1.
Flow chart of models development and validation.
Figure 1.
Flow chart of models development and validation.
Figure 2.
Locations of the intersections—City of Osijek, Croatia.
Figure 2.
Locations of the intersections—City of Osijek, Croatia.
Figure 3.
Intersection A (left)—crosswalks 1 and 3 on collector road and crosswalks 2 and 4 on primary road; Intersection B (right)—crosswalks 1 and 3 on primary road and crosswalks 2 and 4 on collector road.
Figure 3.
Intersection A (left)—crosswalks 1 and 3 on collector road and crosswalks 2 and 4 on primary road; Intersection B (right)—crosswalks 1 and 3 on primary road and crosswalks 2 and 4 on collector road.
Figure 4.
Probability plot of children crossing speed.
Figure 4.
Probability plot of children crossing speed.
Figure 5.
Impact of input parameters on speed prediction according to the NN model.
Figure 5.
Impact of input parameters on speed prediction according to the NN model.
Figure 6.
Network configuration that gave the best prediction results.
Figure 6.
Network configuration that gave the best prediction results.
Figure 7.
Comparison of measurements and prediction of neural network model for the crossing speed.
Figure 7.
Comparison of measurements and prediction of neural network model for the crossing speed.
Figure 8.
Comparison of measurements and LR model prediction for crossing speed.
Figure 8.
Comparison of measurements and LR model prediction for crossing speed.
Figure 9.
Comparison of the absolute error values for both models.
Figure 9.
Comparison of the absolute error values for both models.
Figure 10.
Validation of the model for the crossing speed measurement database in Rijeka.
Figure 10.
Validation of the model for the crossing speed measurement database in Rijeka.
Figure 11.
Model validation for the crossing speed measurement database in Enna.
Figure 11.
Model validation for the crossing speed measurement database in Enna.
Table 1.
Selected input parameters.
Table 1.
Selected input parameters.
| No. | Parameters | Designation |
|---|
| 1. | age group (AG1→≤ 5 years old children; AG2→6-7; AG3→8-9; AG4→10-11; AG5→12-13; AG6→14-15; AG7→>15) | I1 |
| 2. | gender [girl→0, boys→1, for mixed groups (number of boys/total number of children)] | I2 |
| 3. | children with special needs (motoric disabilities, impaired vision and blindness, wheelchair mobility, etc.) [no→0, minor interference→0,5, yes→1] | I3 |
| 4. | movement in a group—the number of children in a group [number]—the whole group has the same crossing time and it is one data in a database, and the crossing time is the total transition time from the first to the last member of the group | I4 |
| 5. | supervision by adults [no→0; yes→1] | I5 |
| 6. | mobile—messages/internet—occupying visual attention [no→0; yes→1] | I6 |
| 7. | mobile—talking, listening to the music—not occupying visual attention [no→0; yes→1] | I7 |
| 8. | number of children on pedestrian crosswalk [number] | I8 |
| 9. | total number of pedestrians on pedestrian crosswalk (with children) [number] | I9 |
| 10. | length of pedestrian crosswalk [m] | I10 |
| 11. | width of pedestrian crosswalk [m] | I11 |
| 12. | green time for pedestrians [s] | I12 |
| 13. | traffic signal cycle length [s] | -SEGEND:ffefc9c3-8f59-404e-aa49-55c9cf63aba1:112 |
| 14. | running [no→ 0; yes→ 1]—took this parameter into consideration as a form of risky behavior (because it implies movement when both legs are above pavement level) | I13SEGEND:b65f404b-56b5-440b-87c0-abf00a1a4a2c:115 |
Table 2.
Basic characteristics of the observed crosswalks.
Table 2.
Basic characteristics of the observed crosswalks.
| Intersection | Crosswalk | Length (m) | Width (m) | Cycle Length (s) | Pedestrian Green Time (s) | Number of Crossings |
|---|
| A | 1 | 7 | 3 | 90 | 50 | 48 |
| 3 | 9.3 | 4.5 | 90 | 50 | 58 |
| 2/4 | 10.5 | 3.1 | 90 | 20 | 74 |
| B | 1/3 | 14 | 3.1 | 90 | 13 | 72 |
| 2 | 9.2 | 2.5 | 90 | 52 | 18 |
| 4 | 9.2 | 2.2 | 90 | 52 | 30 |
Table 3.
Descriptive Statistics of dependent variable-crossing speed and Anderson-Darling test results.
Table 3.
Descriptive Statistics of dependent variable-crossing speed and Anderson-Darling test results.
| | N | Mean | SD | Median | Min | Max | Variance | AD | p-Value |
|---|
| Osijek | 300 | 1.3630 | 0.2981 | 1.3529 | 0.5287 | 2.3729 | 0.0888 | 0.913 | 0.020 |
Table 4.
Influence of specific input parameters on dependent variables based on the Kruskal-Wallis test.
Table 4.
Influence of specific input parameters on dependent variables based on the Kruskal-Wallis test.
| | I1 | I2 | I3 | I4 | I5 | I6 | I7 | I8 | I9 | I10 | I11 | I12 | I13 |
|---|
| H | 19.6 | 10.70 | 7.87 | 70.19 | 3.02 | 6.46 | 9.42 | 27.06 | 23.89 | 57.95 | 6.79 | 37.05 | 37.18 |
| p | 0.03 | 0.013 | 0.005 | 0.000 | 0.082 | 0.011 | 0.009 | 0.000 | 0.001 | 0.000 | 0.147 | 0.000 | 0.000 |
Table 5.
Basic characteristics of the chosen Ward net neural network.
Table 5.
Basic characteristics of the chosen Ward net neural network.
| Layers | 1 (Input) | 2 (Hidden) | 3 (Hidden) | 4 (Hidden) | 5 (Output) |
|---|
| Neurons | 13 | 55 | 55 | 55 | 1 |
| Activation function | Linear [−1, 1] | Gaussian | Tanh | Gaussian compact | Logistic |
Table 6.
Parameters (independent variables) of the multiple linear regression model.
Table 6.
Parameters (independent variables) of the multiple linear regression model.
| Parameters | Coefficient Value | Standard Error | t | Pr > |t| |
|---|
| intercept | −0.463 | 0.171 | −2.711 | 0.007 |
| width of pedestrian crosswalk | 0.031 | 0.014 | 2.142 | 0.033 |
| number of pedestrians | −0.024 | 0.005 | −4.526 | <0.0001 |
| length of pedestrian crosswalk | 0.061 | 0.004 | 13.941 | <0.0001 |
| age group 1 (≤5 y) | 0.442 | 0.075 | 5.878 | <0.0001 |
| age group 2 (6–7 y) | 0.175 | 0.041 | 4.250 | <0.0001 |
| age group 7 (>15 y) | 0.059 | 0.027 | 2.187 | 0.030 |
| children with disabilities | 0.739 | 0.097 | 7.651 | <0.0001 |
movement in a group 1
(individual movement) | −0.345 | 0.036 | −9.697 | <0.0001 |
movement in a group 2
(group of 2) | −0.119 | 0.039 | −3.007 | 0.003 |
| mobile—messages/internet | 0.225 | 0.037 | 6.163 | <0.0001 |
| Mobile—talking | 0.219 | 0.041 | 5.296 | <0.0001 |
| running | −0.479 | 0.040 | −11.857 | <0.0001 |
Table 7.
Model comparison.
Table 7.
Model comparison.
| | Corel. coef. | MAE | minAE | maxAE | RMSEp | Āc | Am |
|---|
| NN model | 0.896 | 0.098 | 0.000 | 0.501 | 0.132 | 0.018 | −0.087 |
| LR model | 0.840 | 0.127 | 0.000 | 0.617 | 0.161 | 0.014 | −0.109 |
Table 8.
Comparison of the models for the Rijeka database.
Table 8.
Comparison of the models for the Rijeka database.
| | Corel.coef. | MAE | minAE | maxAE | RMSEp | Āc | Am |
|---|
| NN model | 0.905 | 0.129 | 0.000 | 0.252 | 0.143 | −0.042 | −0.138 |
| LR model | 0.705 | 0.159 | 0.000 | 0.643 | 0.217 | 0.041 | −0.113 |
Table 9.
Model comparison for Enna database.
Table 9.
Model comparison for Enna database.
| | Corel.coef. | MAE | minAE | maxAE | RMSEp | Āc | Am |
|---|
| NN model | 0.822 | 0.085 | 0.001 | 0.234 | 0.101 | 0.053 | −0.057 |
| LR model | 0.748 | 0.313 | 0.033 | 0.598 | 0.343 | 0.297 | 0.015 |
| Publisher’s Note: MDPI stays neutral with regard to jurisdictional claims in published maps and institutional affiliations. |
© 2021 by the authors. Licensee MDPI, Basel, Switzerland. This article is an open access article distributed under the terms and conditions of the Creative Commons Attribution (CC BY) license (http://creativecommons.org/licenses/by/4.0/).


