1. Introduction
The factors that affect housing rental fees and prices have been and continue to be scrutinized in the literature. The characteristics of dwellings such as where they are located have been increasingly recognized as being decisive in shaping housing prices and rents. Home values vary across space, whereby those located in large cities tend to be more expensive than those located in small towns, and within large cities, there are differences, with the center regions typically being more expensive than the suburbs [
1,
2,
3,
4]. This space hierarchy can be seen at a more micro level when the territory is institutionally organized in small units with autonomous administration, as is the case in Portugal.
Locational differences affecting home values can result from the distance to an urban center, measured through the travel time or the travel cost, but also from the housing facilities and surrounding amenities. The existence of public infrastructures such as schools and hospitals and all features that can be specific to the local administrative unit [
5,
6,
7,
8,
9,
10,
11] are among the relevant amenities. Suburban areas differ according to their architectural presentation, type of infrastructures, population density, the socio-economic strata of the resident population (which are usually connected with their wage and education levels), and even the ratio of domestic citizens to migrants. If the distance to the main center contributes to accentuating these features and homogenizing them within a gradient, it is still possible to distinguish between types of suburbs using the same features combined with additional amenities such as the proximity to coastal areas or climate, increasing the complexity of modern location. Modern cities are polycentric, and thus not susceptible to a linear treatment of the effect of distance on the price of houses [
1,
8].
In Portugal, the rental fees of dwellings in the capital city, Lisbon, are considerably higher than those of dwellings located 10 miles from its center. Within Lisbon, a house located in one of its central parishes, Martires, or one of its coastal parishes can have a rent three times higher than one located in a poor parish such as Marvila. This pattern of price differentiation is replicated across the territory. Portuguese urban households seem to be willing to pay a premium not only to live in the main cities but specially to live in specific parishes within these cities, driving spatial stratification to the level of the country’s smallest administrative unit.
This paper relates to the literature that investigates the effect of urban hierarchy on housing rents by analyzing the parishes, the smallest Portuguese administrative spatial unit. It contributes to the research area in several ways. First, by focusing on this finely-grained scale, the smallest administrative unit in the Portuguese local organization system, which allows us to consider an intra-urban dimension. Second, by centering the analysis on housing rents instead of house prices, expanding our knowledge on housing markets. Housing rents and prices are shown to be strongly connected [
11] and to have an endogenous relationship [
12]. However, housing rents, which, unlike house prices, do not reflect expected future gains, are therefore more suitable for expressing households’ willingness to pay to live in certain localities. This rental analysis has not received enough attention [
13].
Finally, this manuscript uses census data to perform the estimations. The advantage of using these data is three-fold. First, it covers the entire continent of Portugal with its local characteristics, considering urban and non-urban regions separately. Second, one can benefit from crossing locational data with features from the house and household demographics. Third, it is possible to use this information together with data for mobility and the unemployment rate to capture the socio-economic environment.
This paper analyses the effect that distance within the Portuguese urban hierarchy at the parish level can have on local housing rents. We analyze whether there is persistence in the spatial pattern that housing rents are more expensive from the center to its periphery. Within municipalities, the distance to nearby parishes is measured through a kernel function, and to estimate how location affects housing rents, the geographically weighted regression is applied, controlling for factors such as the unemployment rate, mobility, and the social diversity ratio. The estimations use data retrieved from the 2011 Population and Housing Census from Statistics Portugal for 4049 civil parishes within 278 municipalities, and the empirical results indicate the existence of a hierarchical parish distance effect within the Portuguese territory.
The remainder of this paper includes
Section 2, in which the related literature is discussed.
Section 3 develops the research methodology and presents the data. In
Section 4 the empirical results are presented and discussed. Concluding comments are in the closing section.
2. Related Literature
The relevance of spatial heterogeneity of housing-price determinants and spatial autocorrelation between house prices has been recognized by scholars [
14,
15,
16]. Besides global factors, which seem to affect the housing market equally at each point in space, local factors have a spatially non-stationary effect on housing prices and rents [
17]. Considering the effect of spatial distribution on the housing market is, therefore, essential to explain the differences between housing rents.
Among global factors, household income, unemployment rate, and education level are important factors in residential choices, affecting housing demand and house prices and rents that are susceptible to spatial differences [
18,
19]. Additionally, population growth increases the demand for housing, contributing to an increase in its price and spatial heterogeneity in its valuation according to population density [
20]. The traditional hedonic price analysis [
21,
22], in which the value of a good is related to a set of its characteristics, considers the residential property as a multidimensional and durable commodity, whose value is determined by a combination of characteristics categorized as structural, locational, and neighborhood attributes. These models tend to be biased in the presence of spatial effects [
23] since they do not take into account spatial dependency and spatial heterogeneity. Spatial dependency means that nearby properties tend to have similar values, which can happen because they share similar characteristics and/or benefit from the same amenities, implying that house prices tend to converge in a given spatial area [
1,
24].
Spatial heterogeneity refers to differences that are found in house prices over space. To address these features, spatial lag or spatial error models and geographically weighted regression have been developed and applied that still consider the same classification of housing attributes, distinguishing their structural, locational, and neighborhood features.
Structural attributes of houses that determine housing values refer to features including the property’s ownership, size, age, the number of bathrooms and bedrooms, land area, and other physical characteristics [
25,
26].
Location refers to features such as accessibility, distance within the urban hierarchy [
1], and characteristics of the surroundings such as the neighborhood attributes of the residential property. Accessibility of a location can be measured in terms of physical distance, travel time of access to the center, or travel cost [
27,
28], while distance can relate to distance to the central business districts or distance to transport locations such as railway stations, metro stations, or bus stops. Distance within the urban hierarchy is responsible for a negative price gradient on interurban housing prices that reflects a productivity component from wage differences, and an amenity component reflecting households’ valuation of their access to services [
1].
Since increased accessibility raises land value [
5,
7], one should also inspect the effect that public transportation and transport infrastructure have on the relationship between location and housing prices. Property prices tend to reflect the positive externalities derived from the proximity of transportation infrastructure [
29,
30], a fact that has been corroborated by numerous empirical studies. Housing rental prices of two-bedroom-one-bathroom apartments in the proximity to metro stations in Shanghai, China, are shown to display a rent premium [
13], while the effect of a Bus Rapid Transit system on home prices in Sydney, Australia is shown to marginally increase the sales prices of residential properties, controlling for features of the property, its neighborhood, and accessibility [
31]. Access to bus stops and bus travel times to essential destinations are also found to be important local determinants of home prices [
32]. Nevertheless, access to transportation may have the opposite effect on home values, preventing housing rents from increasing when it affects the quality of life in an adverse way by being responsible for increased noise and traffic congestion [
25]. Studying residential property prices in Shenzhen, China, Wu et al. [
10] identify points of interest within the city, the hot spots, namely commercial centers and green spaces, which are highly visited but that can have negative effects such as too much traffic, noise pollution, and security challenges.
Since housing prices depend on the distance and travel-time to economic centers where jobs are located, the employment structure is part of the location equation. Municipalities with higher unemployment have a negative impact on housing values [
33], while unemployment seems to slow the growth rate of home prices across segments [
34]. Moreover, areas with good job opportunities tend to have better housing quality and living conditions, implying that job accessibility is valued in the housing markets [
35]. Agnew and Lyons [
36] show that the increase in jobs caused by foreign direct investment in Ireland had an aggregate effect of over 1% in home prices. In general, households treat job opportunities as part of the location amenities.
Amenities are goods and services that are location-specific and increase the attractiveness of locations. Amenities are the third factor to be considered by models that account for spatial heterogeneity. Amenities can be natural, historical, or modern. Rising values of house prices are often the result of improved neighborhoods and the supply of infrastructures. Real estate located near commercial centers, green spaces, and other facilities become more valued.
Parks, as urban landscapes, offer several amenities to adjacent residents, leading households to be willing to pay a premium for living near them [
37,
38,
39]. Natural amenities such as open landscapes have a greater impact on urban housing prices in areas where this type of amenity is scarce and where housing and population density are higher [
40]. Nevertheless, for Shenzhen, China, Wu et al. [
41] reported mixed effects that depend on the type of park under consideration, city and community parks exerting a positive effect on home prices, but forested parks producing the opposite effect. The premium paid to live in the proximity of a landscape can depend on the floor level, with this vertical dimension contributing to the value of residential properties [
42]. The neighborhood characteristics of dwellings are shown to be more decisive for housing rental prices than their location or structural characteristics in Shenzhen [
43].
Negative amenities such as air pollution and congestion will have the opposite effect, depressing home prices [
44,
45]. Li et al. [
25] highlight the role that negative and positive amenities combined with accessibility have on single-family home values in US cities. Air pollution is a major concern in urban areas, often as a consequence of their geographic features, namely topographical and climate features. Crime is also among negative amenities and is demonstrated to drive residential property values down [
46].
The increasing propensity of the urban space structure to evolve from monocentric to polycentric is an additional heterogeneity factor creating non-linearities in the effects that variables such as accessibility may have on home prices and housing rents. The increase in the distance to three different locations in Hangzhou, China is shown to have a negative effect on home prices [
8]. These different centers follow a hierarchy in the spatial structure, one of the centers exerting a greater influence than the other two, while the three centers present a dynamic expansion over time, increasing their aggregate influence.
Housing rents represent the utility value of a house [
47] and are susceptible to similar spatial features of housing prices. Studies that focus on housing rents have highlighted analogous factors to housing prices as its main drivers. The proximity to transportations infrastructures in Athens was displayed to have either a positive or negative impact depending on the type of transportation and its externalities as provided accessibility and noise [
48]. In Beijing, China, choices of homeowners and tenants respond to the same locational, structural, and neighborhood stimulus but in residential communities with high house prices, rents may not necessarily be high [
11]. Schäfer and Hirsch [
49] show the impact of urban tourism in housing rents in Berlin, contributing to increase it, especially near tourism hotspots. In Cracow, housing rents are shown to depend on several local markets, but its decisive determinants seem to be the area of the flats and the age of the building [
50]. In spite of the similarities with house price dynamics, rent dynamics can have specific determinants as the length of rent contracts. Rondinelli and Veronesi [
51] studying Italy found rents for old tenants being well below those for new tenants.
The advantage of using methodologies such as geographically weighted regression to address the spatial heterogeneity of the housing market has been shown by Nilsson [
40], Helbich et al. [
17], Wu et al. [
10], and Cellmer et al. [
16]. These authors have proved that under spatial non-stationarity, heterogeneity, and dependence, geographically weighted regression estimations result in a better goodness-of-fit than traditional models. Geographically weighted regression (GWR) uses a weighted least squares methodology, where weights are based on the distances between each observation in the sample and all the others, to produce locally linear regression estimates for every point in space. In this sense, this methodology has been shown to have increased accuracy relative to other spatial techniques in predicting marginal price estimates such as housing rents which have a local nature [
52].
This paper considers structural, locational, and neighborhood features of houses distributed across Portuguese parishes in order to investigate the effect that distance between them can have in housing rents, contributing to the literature that studies how spatial effects and geography matter in explaining the behavior of housing rents.
3. Hierarchical Parish System and Empirical Data
The empirical grounds for the study refer to the hierarchical parish system of Portugal. A typical municipality district usually consists of municipalities made up of civil parishes. Continental Portugal has 278 municipalities and 4049 civil parishes, with a land area of 89,015 km
2 and a population of 10,047,621 in 2011. People can relocate freely within Portugal and maybe living in one parish and working in another. As shown in
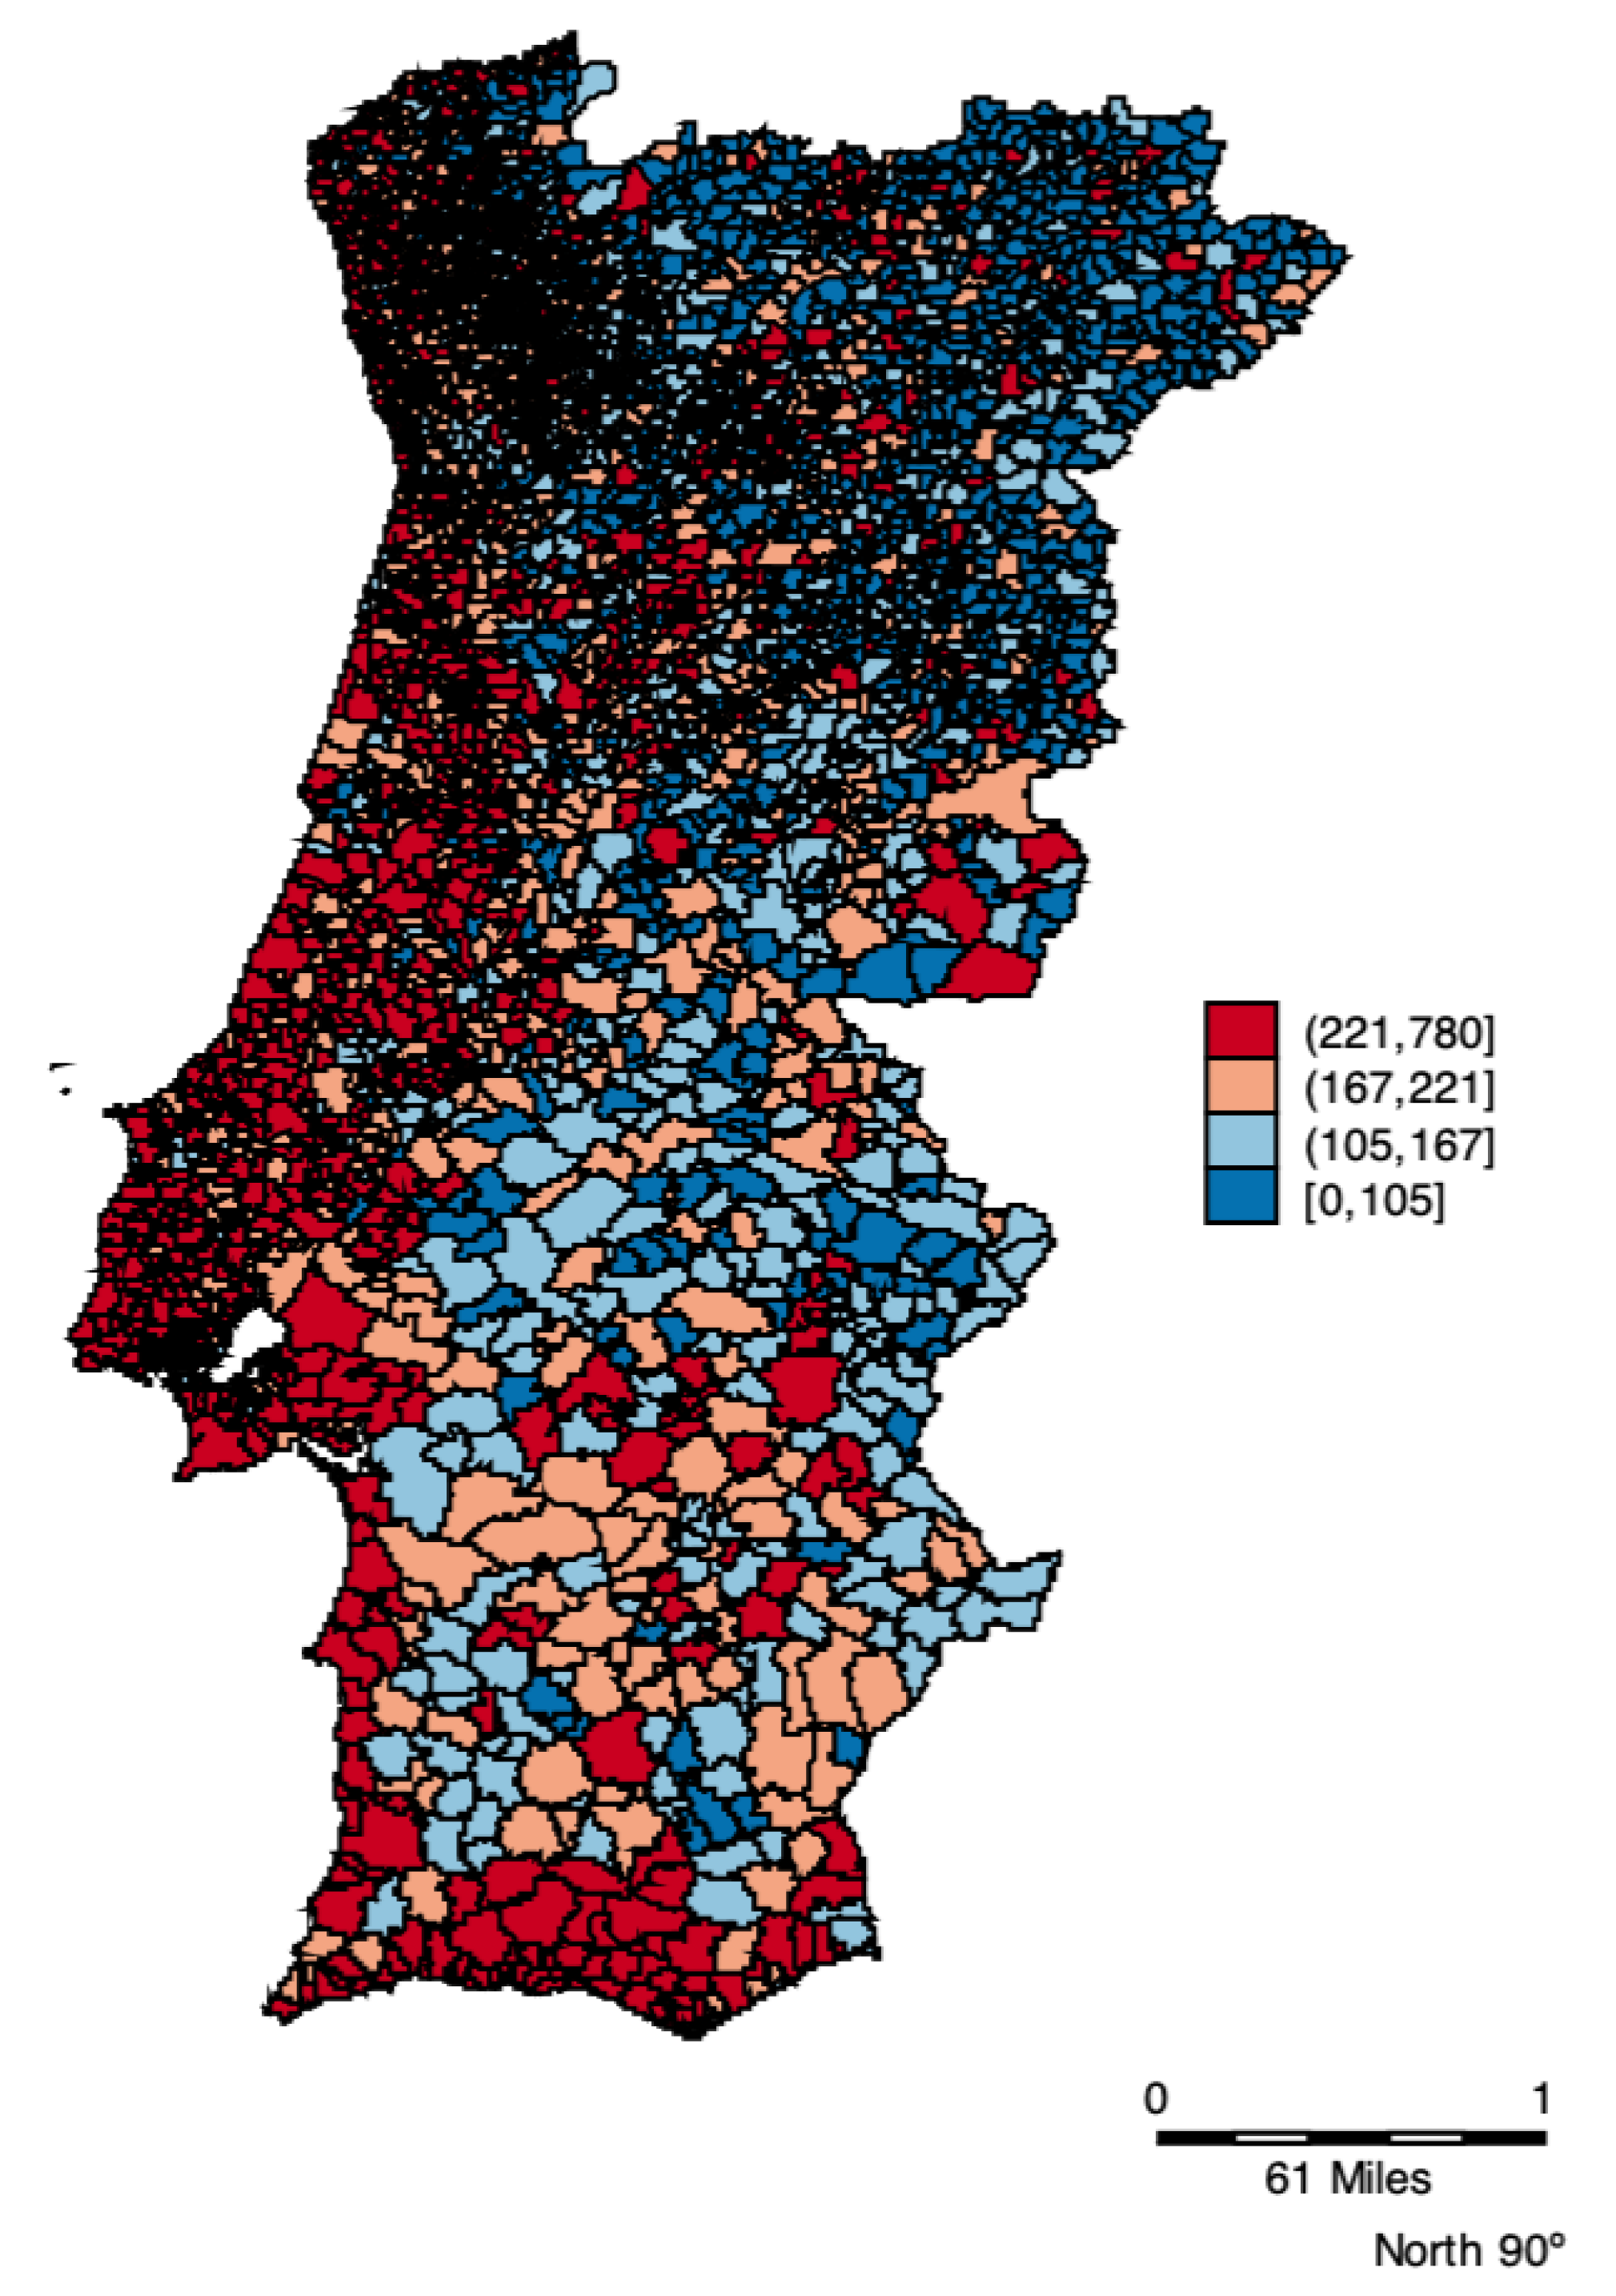
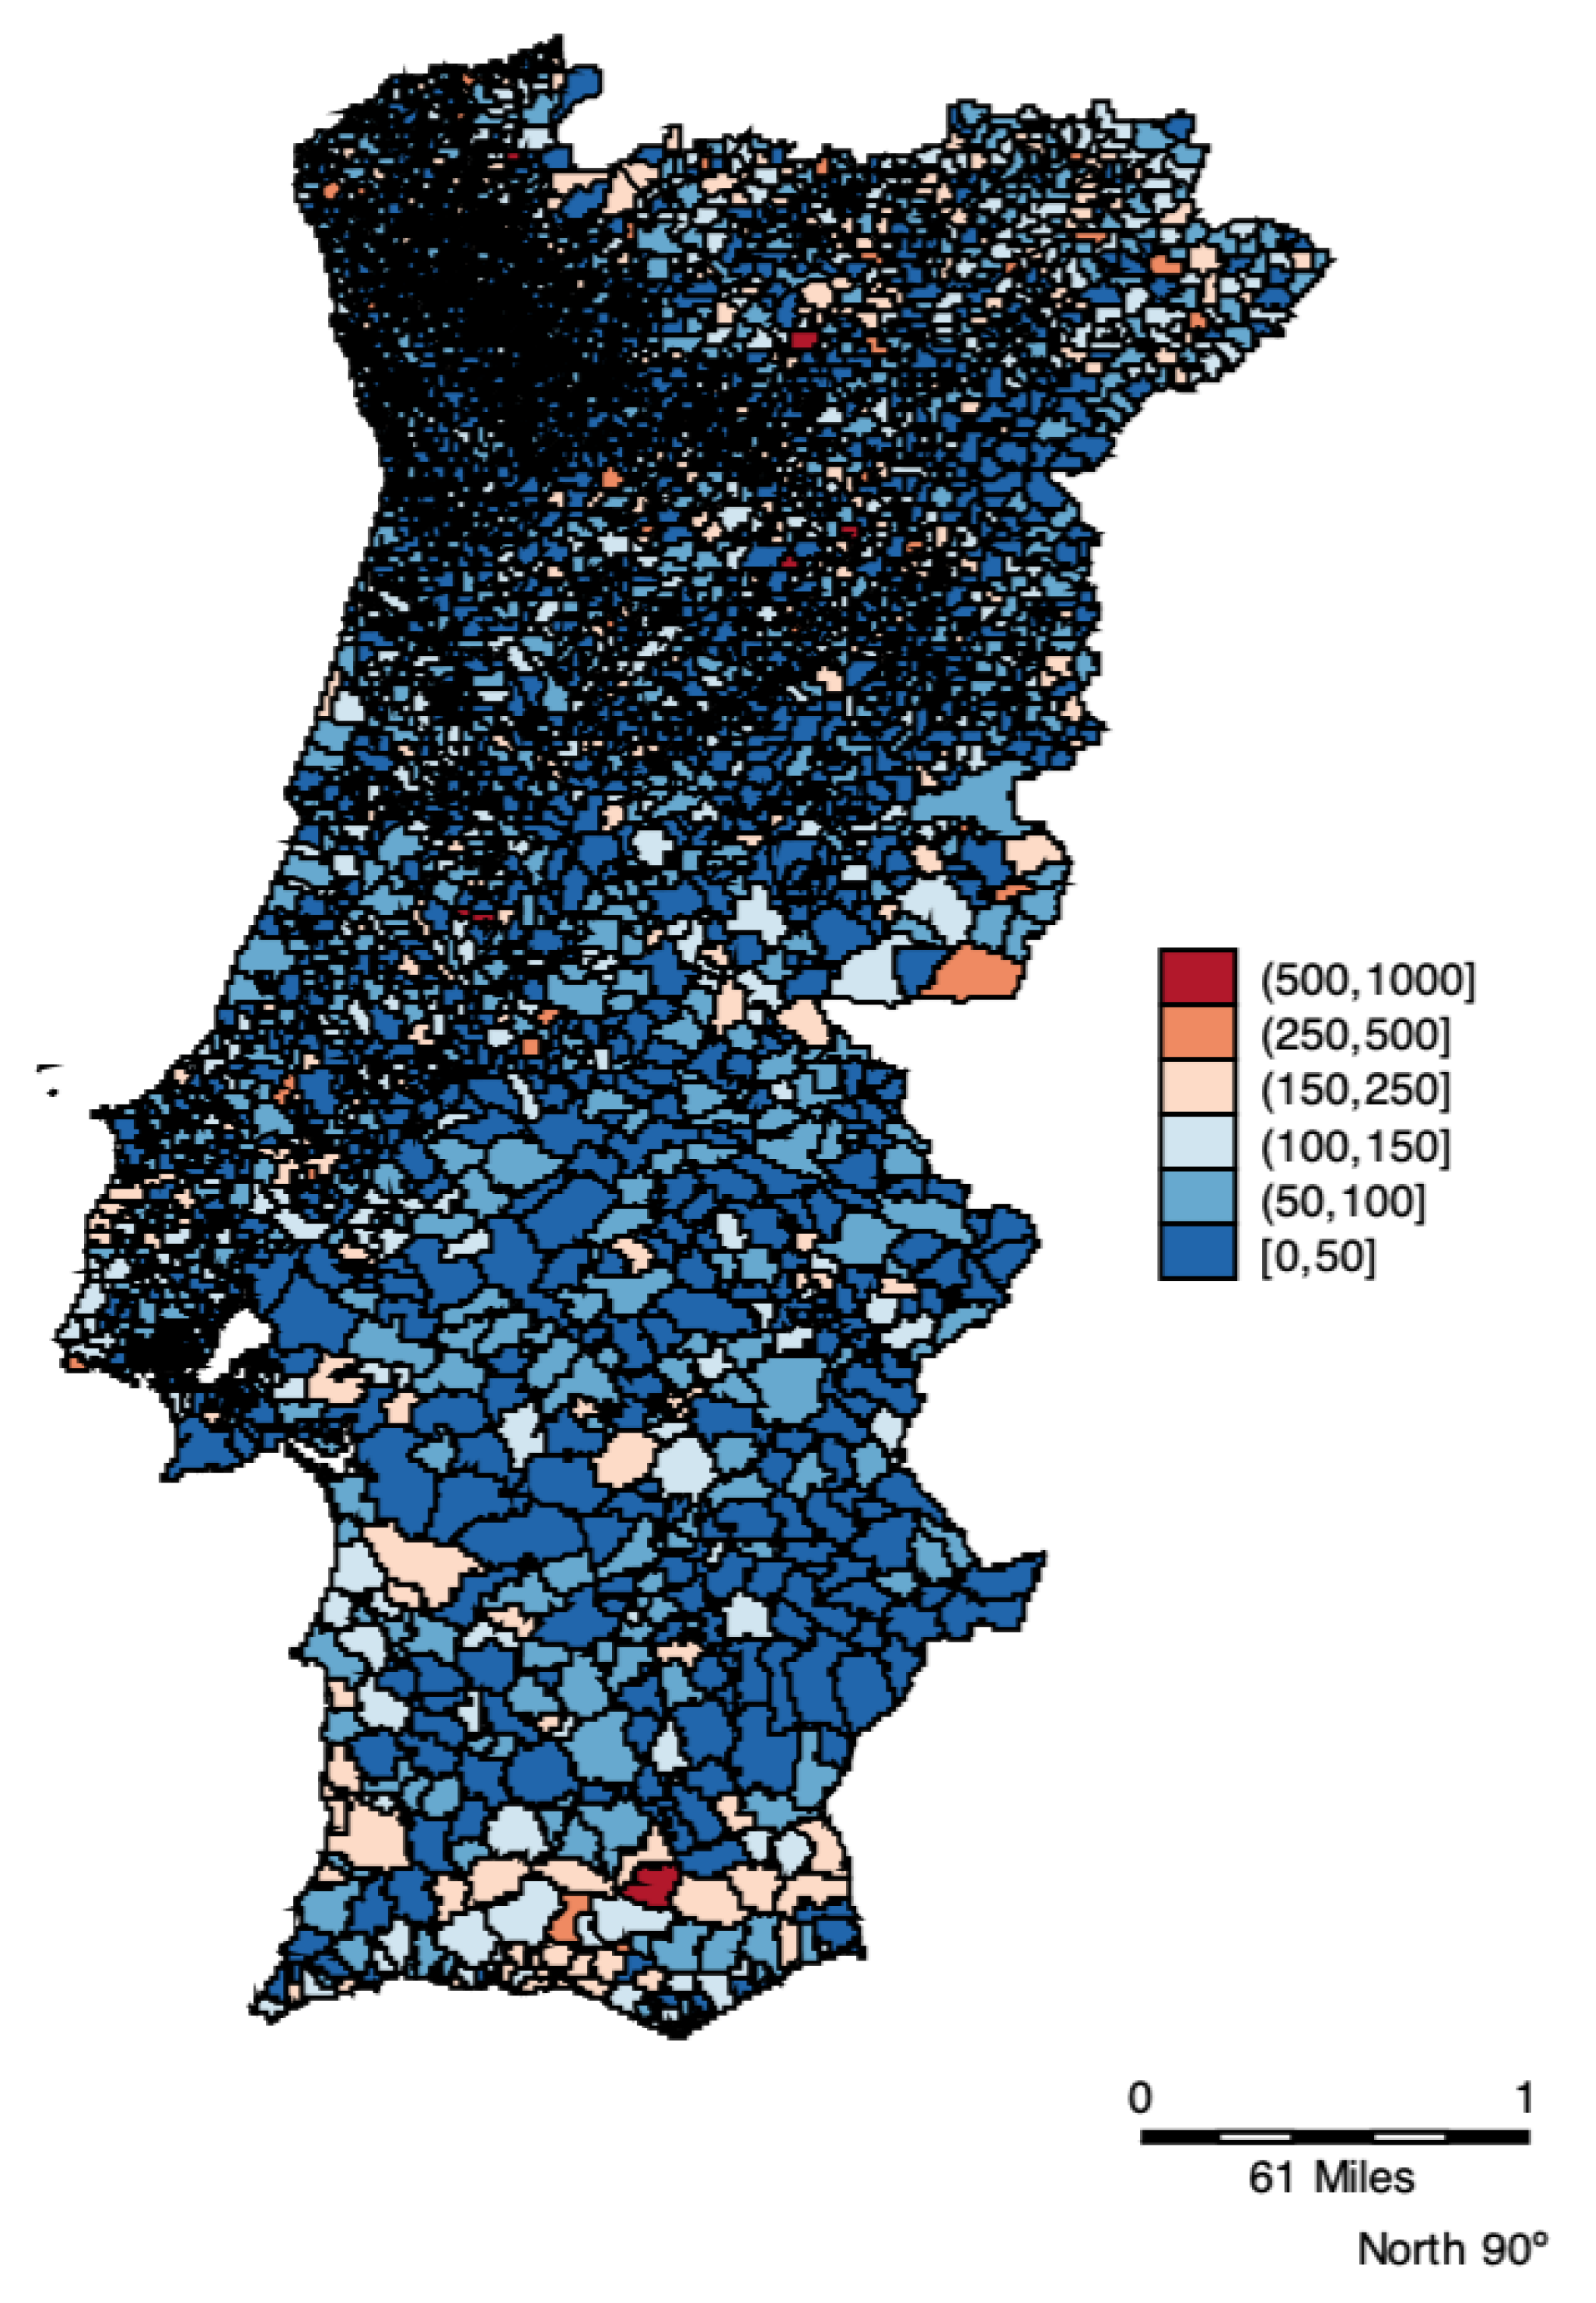
Figure 1, the parishes are unevenly distributed, being highly concentrated in the north of the country, mainly in northwestern municipalities.
The data are from Statistics Portugal, Population and housing census in 2011. The dependent variable Rent is the average monthly amount paid for renting a dwelling at the parish level (see
Figure 1). A dwelling is normally intended to accommodate only one family and is not to be used for other purposes. The spatial distribution of the house rental prices in Portugal is shown in
Figure 1. The higher rents are found mainly in the littoral municipalities, and the lower rents are concentrated mainly in the interior and northeastern municipalities. If the rent is zero, it indicates the dwelling is rented under a commutate regime or lending regime, i.e., under a contract according to a loan for use regime.
According to the related literature, several variables may influence housing rents. To analyze housing rents in Portugal at the parish level, this study accounts for different structural, socio-economic, and spatial factors. On the structural side, we analyze the number of dwellings available in the parish and the characteristic of the dwelling such as the area. The number of houses is the stock of dwellings by geographic localization. The area is the average useful area in square meters (m
2) of dwellings of usual residence. The social–economic factors include population density, unemployment, indexes of sustainability, and old-age dependency, and finally, we take into consideration if the dwelling is overcrowded. The parish population’s density is the ratio between total population and land area expressed as the number of inhabitants per square kilometer in each parish. The parish unemployment rate in each parish represents unemployed persons as a percentage of the civilian labor force. The potential sustainability ratio is the quotient between the working-age population and people aged 65 and older. The old-age dependency ratio in each parish is the ratio of the number of elderly persons (of an age at which they are generally economically inactive—i.e., 65 and over) to the number of persons of working age (from 15 to 64). Overcrowded is the proportion of overcrowded living quarters in each parish and refers to the number of rooms in relation to the number of residents in the accommodation. The calculation is made based on the following parameters (considered normal): a room for the living room; one division for each couple; a division for each other non-single person; one division for each single person over 18; one division for every two single people of the same sex between the ages of 7 and 18; one division for each single person of different sex between the ages of 7 and 18; one division for every two people under 7 years old.
Table 1 describes the variables that were used to characterize housing rents in Portugal. The descriptive statistic and expected effect sign of the variables used to proxy for parish amenities and characteristics that influence housing rents are presented in
Table 2.
To characterize the attractiveness of the municipality to which the parish belongs, we included a measure of mobility and a measure of social diversity. Commuting mobility of employed population refers to the employed resident population outside the municipality and employed nonresident population in the municipality relative to the employed resident population. The social diversity ratio reflects a measure of the degree of diversity of a territorial unit. It varies between 0 (maximum specialization) and 1 (maximum diversity). For each municipality, the calculation of this indicator is established by the weighted average of each socioeconomic group in the municipality’s population.
This study also considers how the location of a parish, i.e., distance to nearby parishes within the municipalities, affects housing rents by applying Geographically Weighted Regression (GWR) [
53,
54]. The GWR model takes account of the spatial heterogeneity of the parameter estimates by constructing a spatial weight based on the distance between a parish and all other surrounding parishes. In Equation (1), where
is the rent in parish i described by coordinates
,
is the local estimated intercept, and
represents the slope of the kth variable specific to parish i (variables described in
Table 2).
Each observation is weighted according to its proximity to parish
i. The weights used are the distance between parish
i and surrounding parishes within a radius of municipality
j,
, calculated through a kernel function as follows:
where
is the kernel function,
is the Euclidean distance between parish
i and grid point
;
is the kernel bandwidth, i.e., the radius of the kernel function at grid point
g. Our use of Kernel function to measure parish spatial accessibility is gradually discounted as distance increases. Distance has been used as a proxy for travel friction in the housing literature [
55] because it is easily computed from geo-coded locations.
When the location measure as given by Equation (2) is fixed or applied equally at each calibration point, one assumes that the weight–distance relationship is uniformly applicable across space. To account for the possibility of heterogeneity of data distribution (e.g., that data are sparse in parts of the larger area), a spatially adaptive weighting function was applied instead. This function allows for smaller bandwidths in which data are dense, and for larger bandwidths in which data are sparse. A bandwidth denotes how far out from a specific parish the other parishes will count in the calibration of parameters. The location measure as given by Equation (3) allows for such spatially adaptive bandwidths:
Thus, instead of fixing the distance, the number of nearest parishes is fixed, allowing the distance to go as far in space as needed in order to find that number of parishes. In less concentrated areas, the bandwidth could expand beyond the distance in which a case may influence house rental prices. Therefore, a limit to the maximum distance of the bandwidth was set. The maximum distance parameter restricts the bandwidth from expanding further, even if the expected data points have not been reached. There are limitations to this spatial analysis, as the relatively arbitrary selection of bandwidth limits both static and adaptive methods. Too large or too small a bandwidth poses the risk of over- or under-smoothing the original data, respectively. We tested multiple parameters for bandwidth in a sensitivity analysis.
Two hypotheses are tested by Monte Carlo simulation, the first hypothesis is that the GWR model describes the data significantly better than a global model. The second hypothesis concerns the spatial variation of the parameter estimates. Each run of the Monte Carlo simulation randomly distributes the spatial points across the observations, and the GWR process is repeated. This produces n values of the variance of the coefficient of interest, which are used as an experimental distribution. By comparing the actual variance against this distribution, an experimental significance level was obtained for the spatial variability of each individual parameter. The second hypothesis is then tested by comparing the standard error of the parameter estimates from the observed data with those from each run of the Monte Carlo simulation.
4. Results
The GWR spatial variability test (Si), mean of the local estimates, and the minimum and maximum GWR coefficients are shown in
Table 3. The ordinary least square (OLS) was also estimated in order to compare the global coefficients with the mean local coefficients and to test the global spatial autocorrelation (Moran’s I Test). The OLS model’s coefficients had the expected signs. However, the OLS model masked the local relationships between the dependent variables and the correlates since the Monte Carlo test (Si) of significance for the spatial variation in these estimates indicates that the spatial variation is significant.
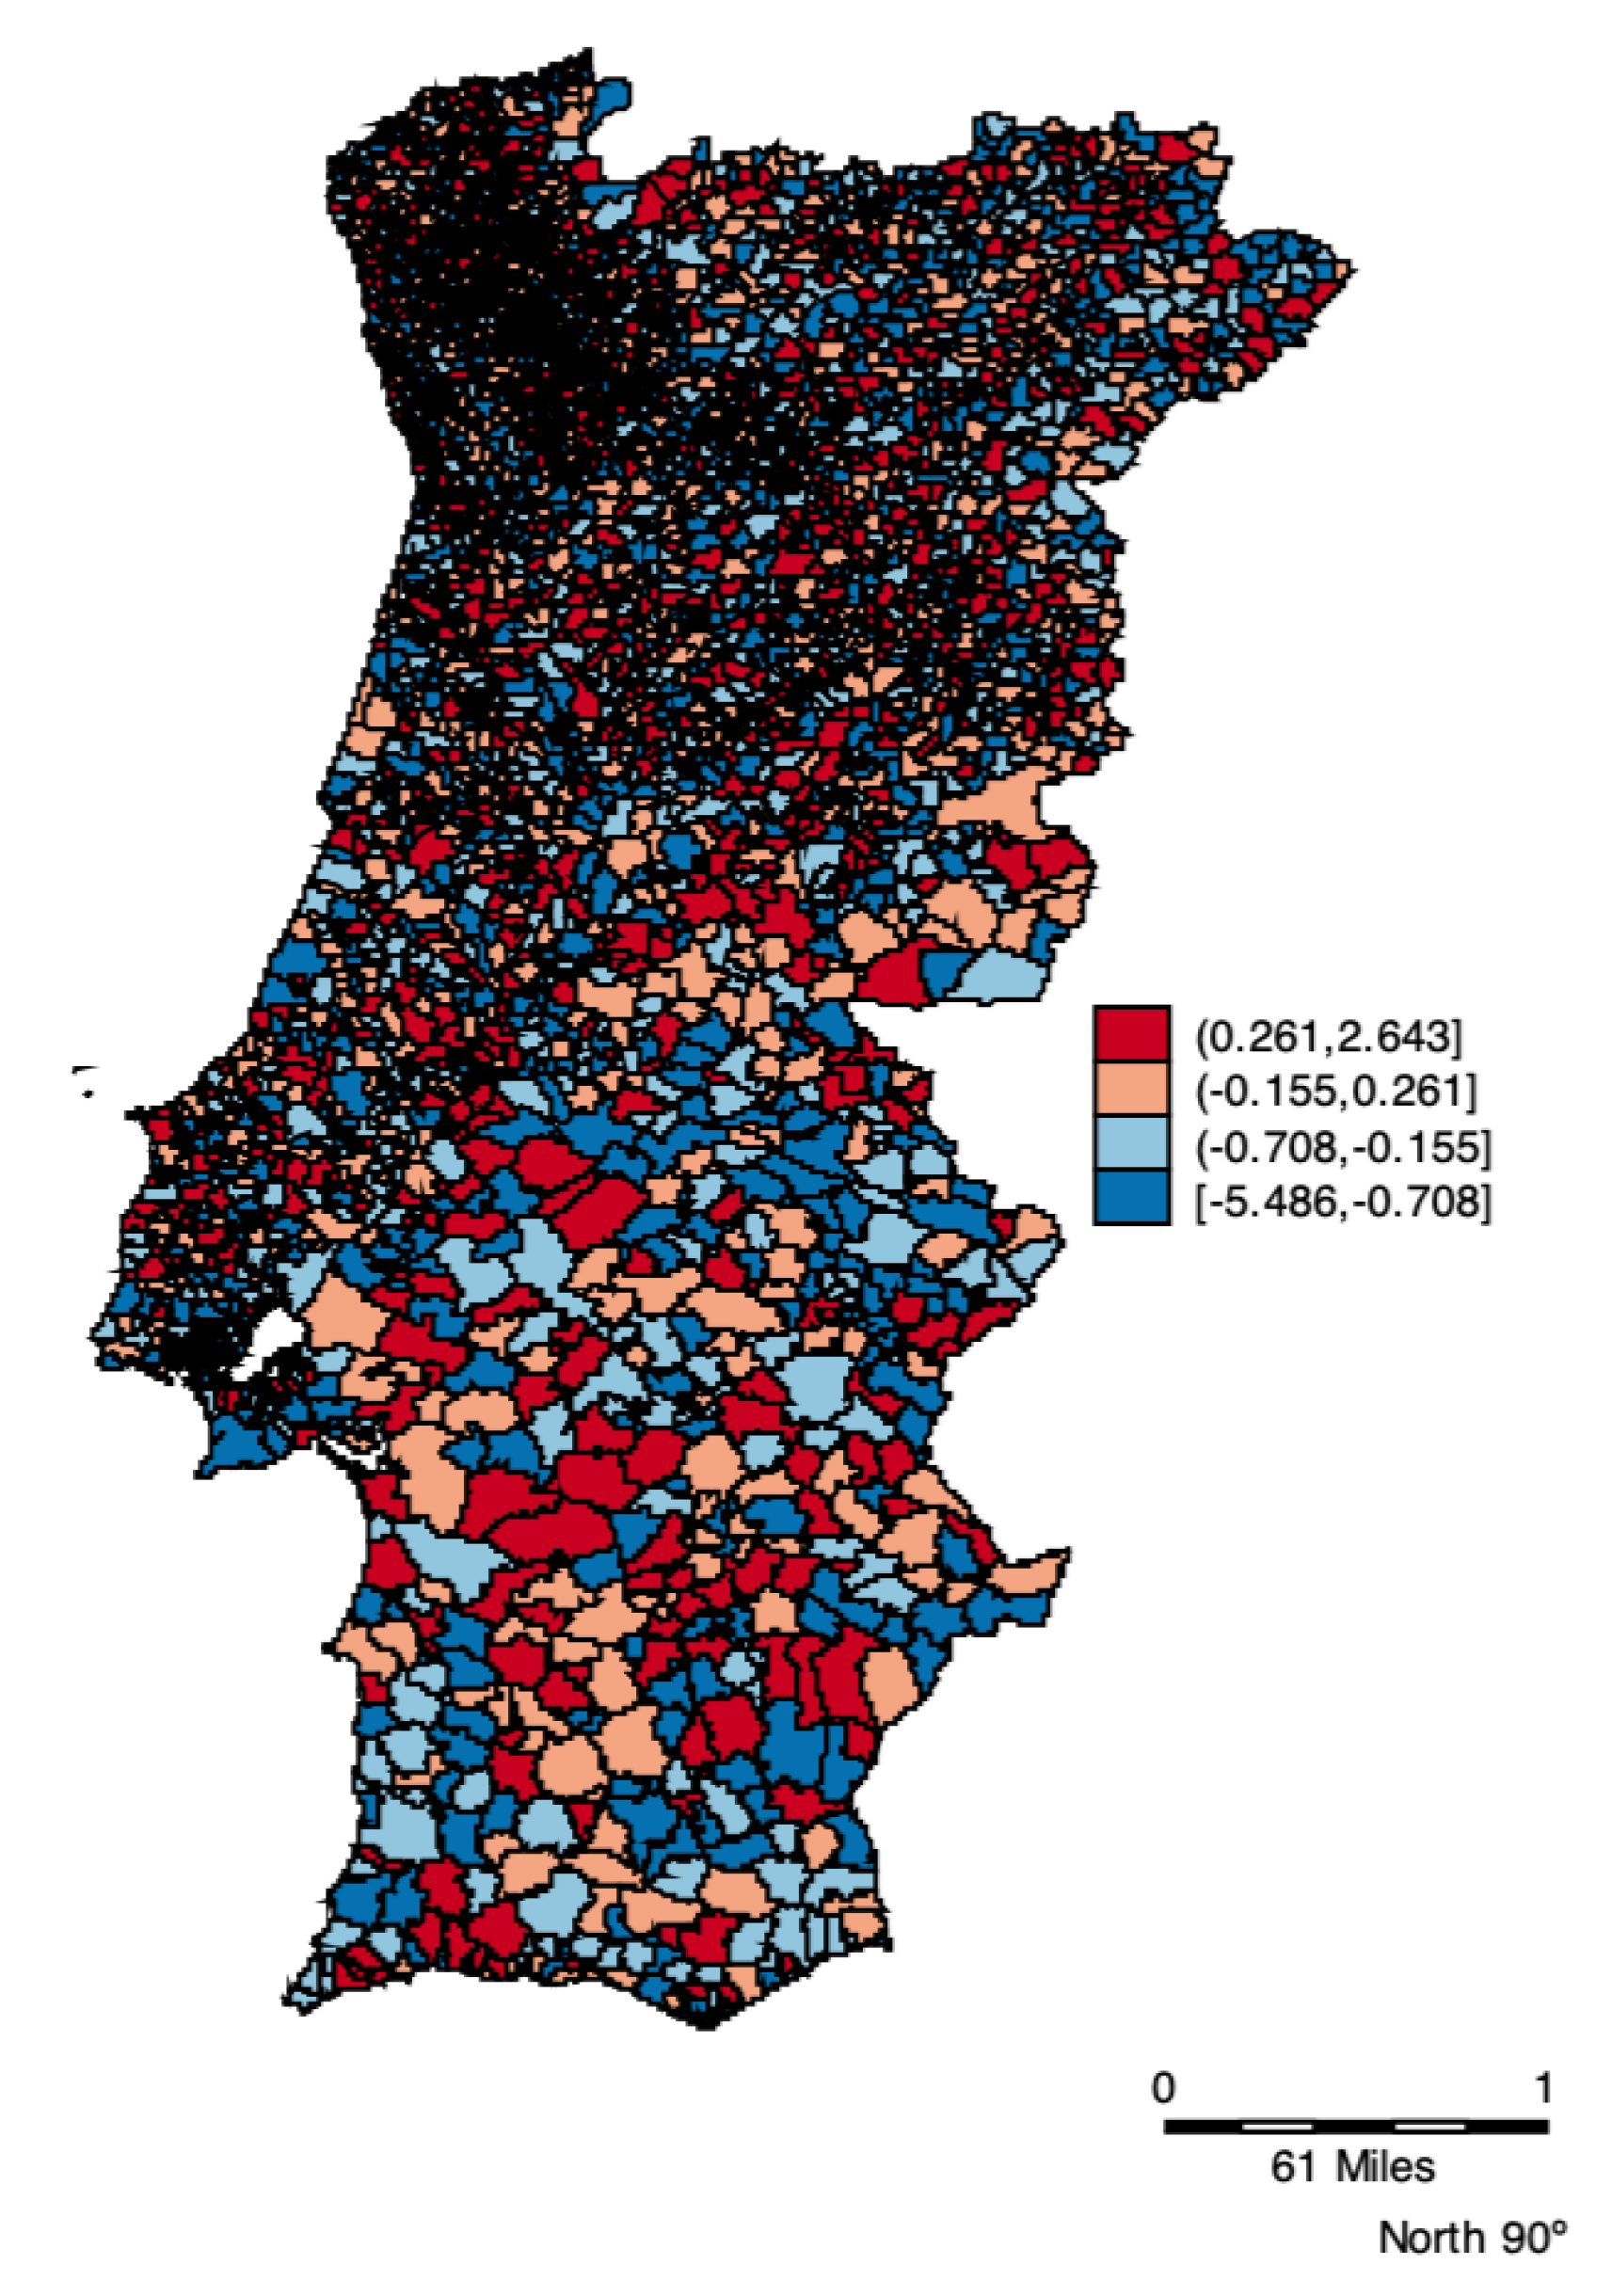
The spatial variation in the unemployment parameter depicts the differing effect of unemployment across Portugal. As shown in
Figure 2, the spatial distribution of the unemployment parameter indicates the degree of spatial non-stationarity and illustrates the interesting way in which the effects vary over space. It had a negative effect on 56% of the parishes. Contrary to the global model, in 44% of the parishes, the unemployment rate affected the house rental price positively.
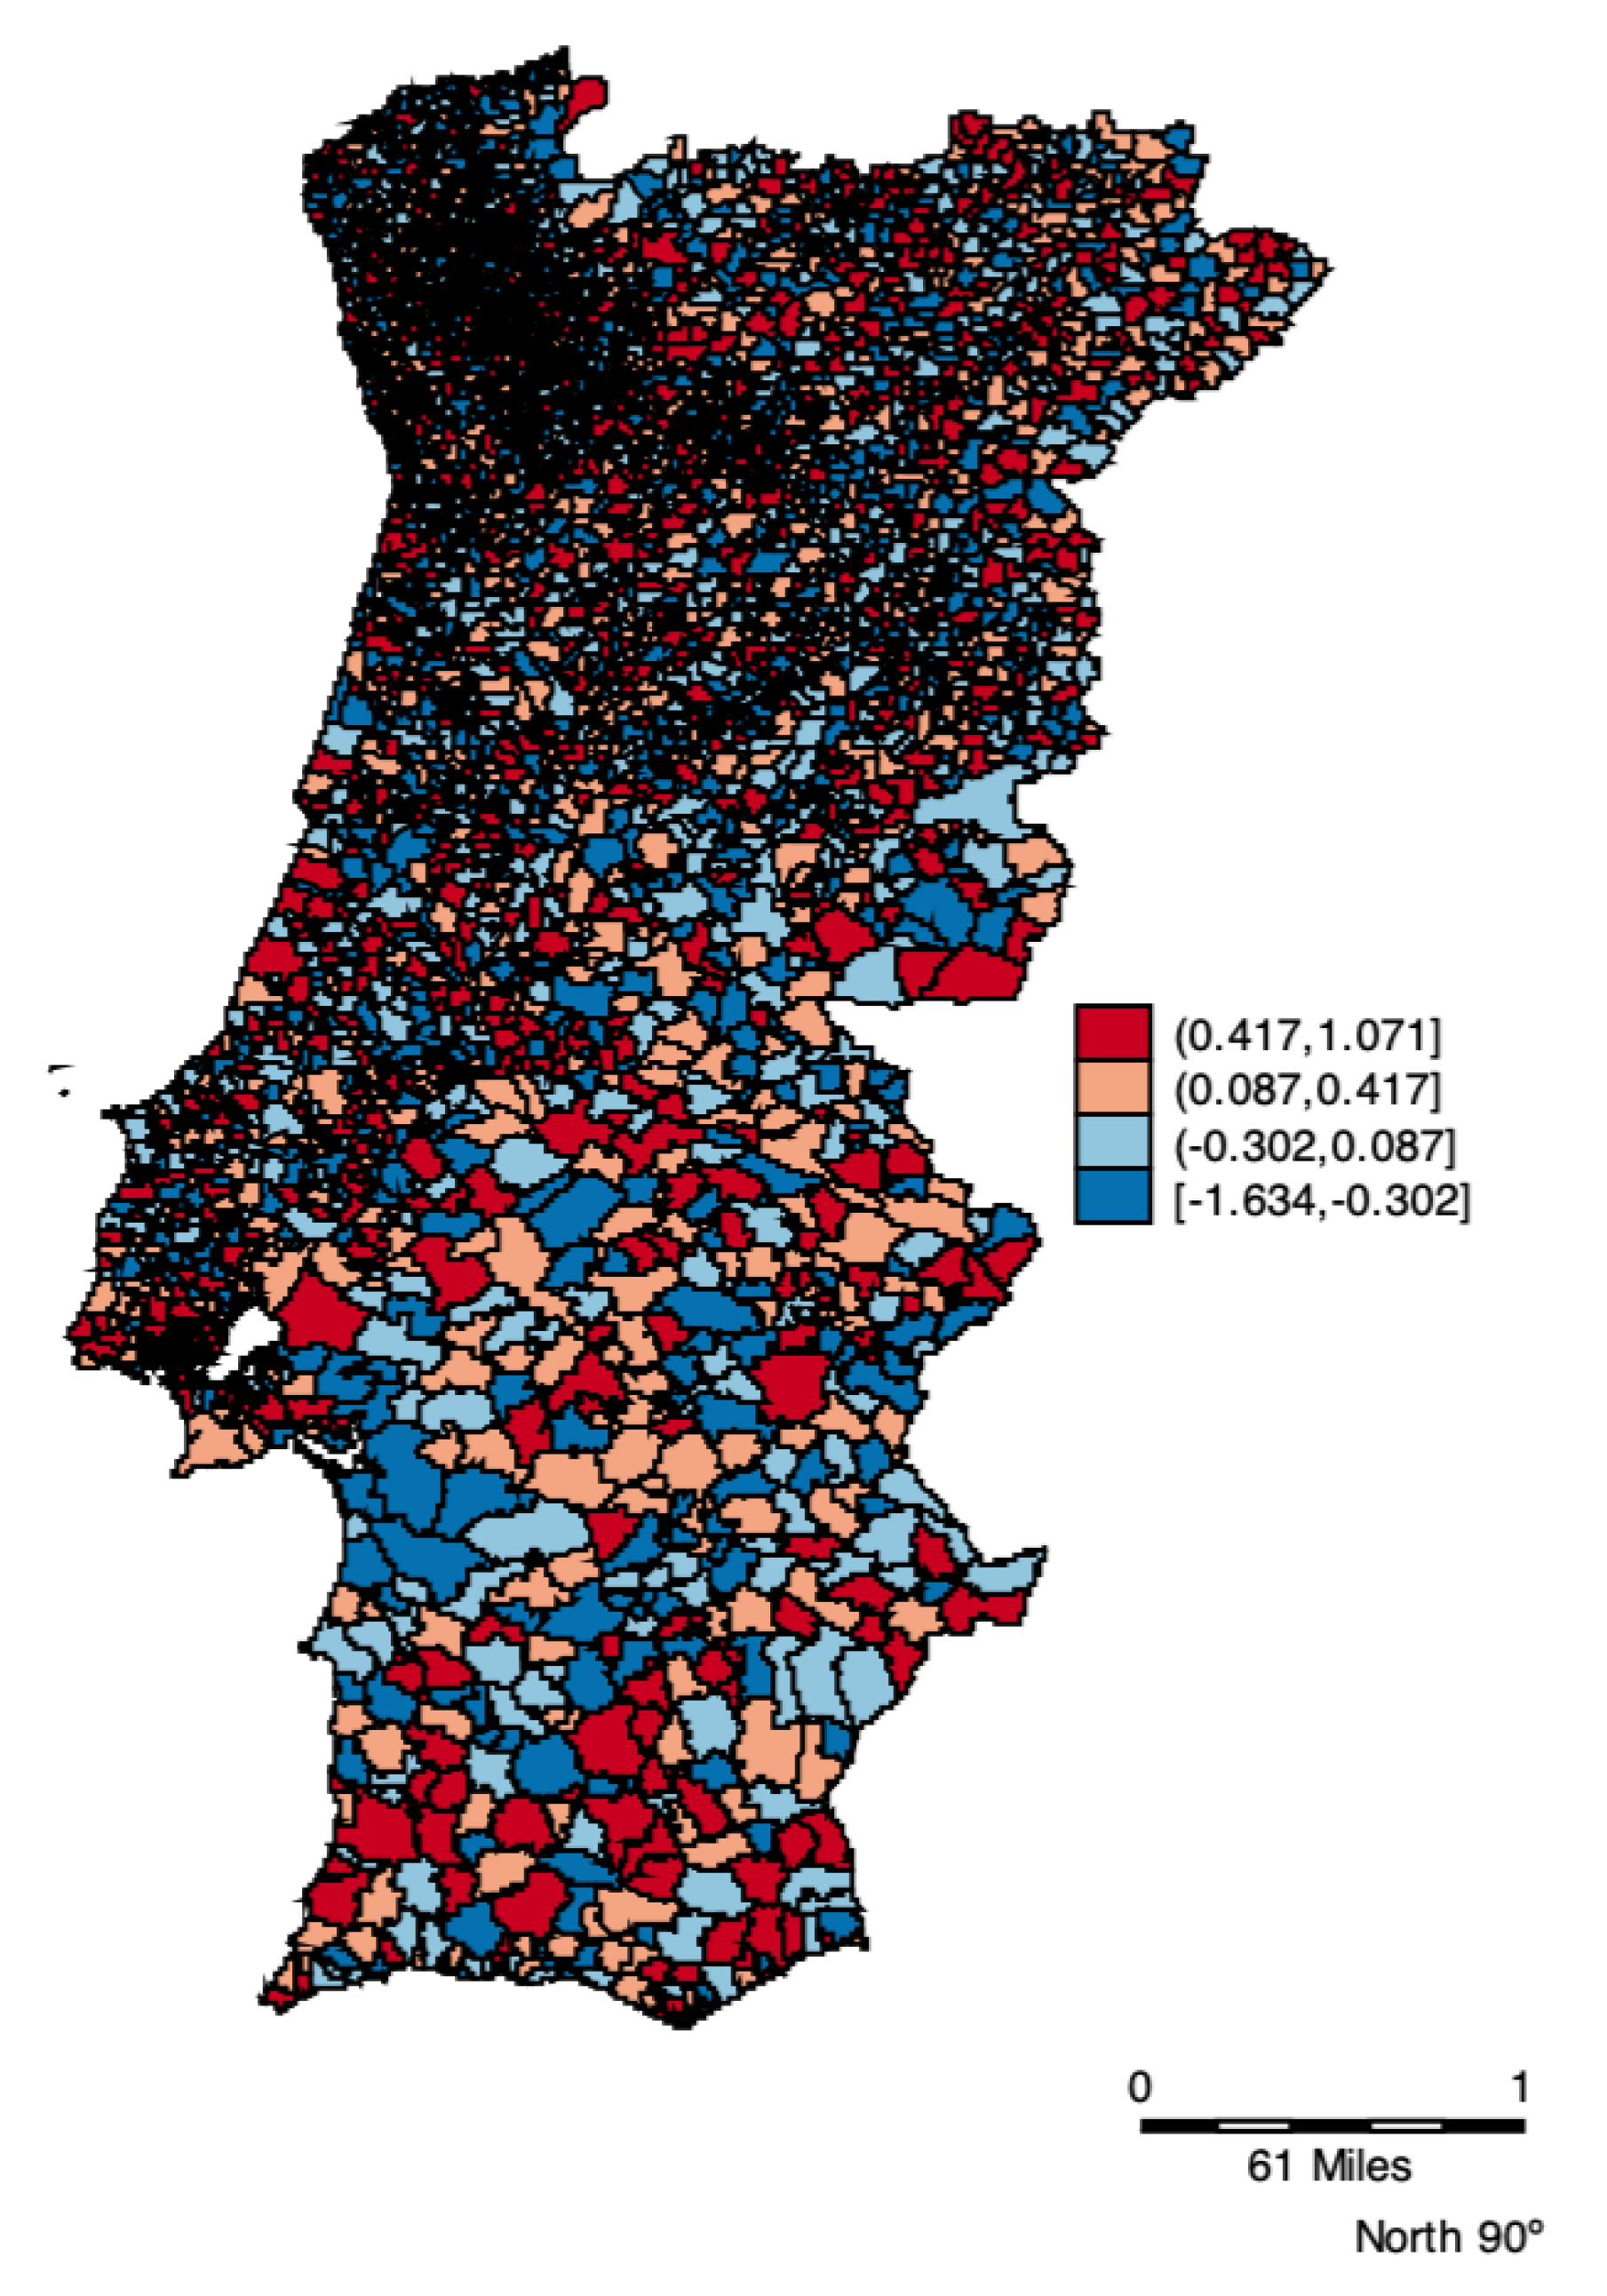
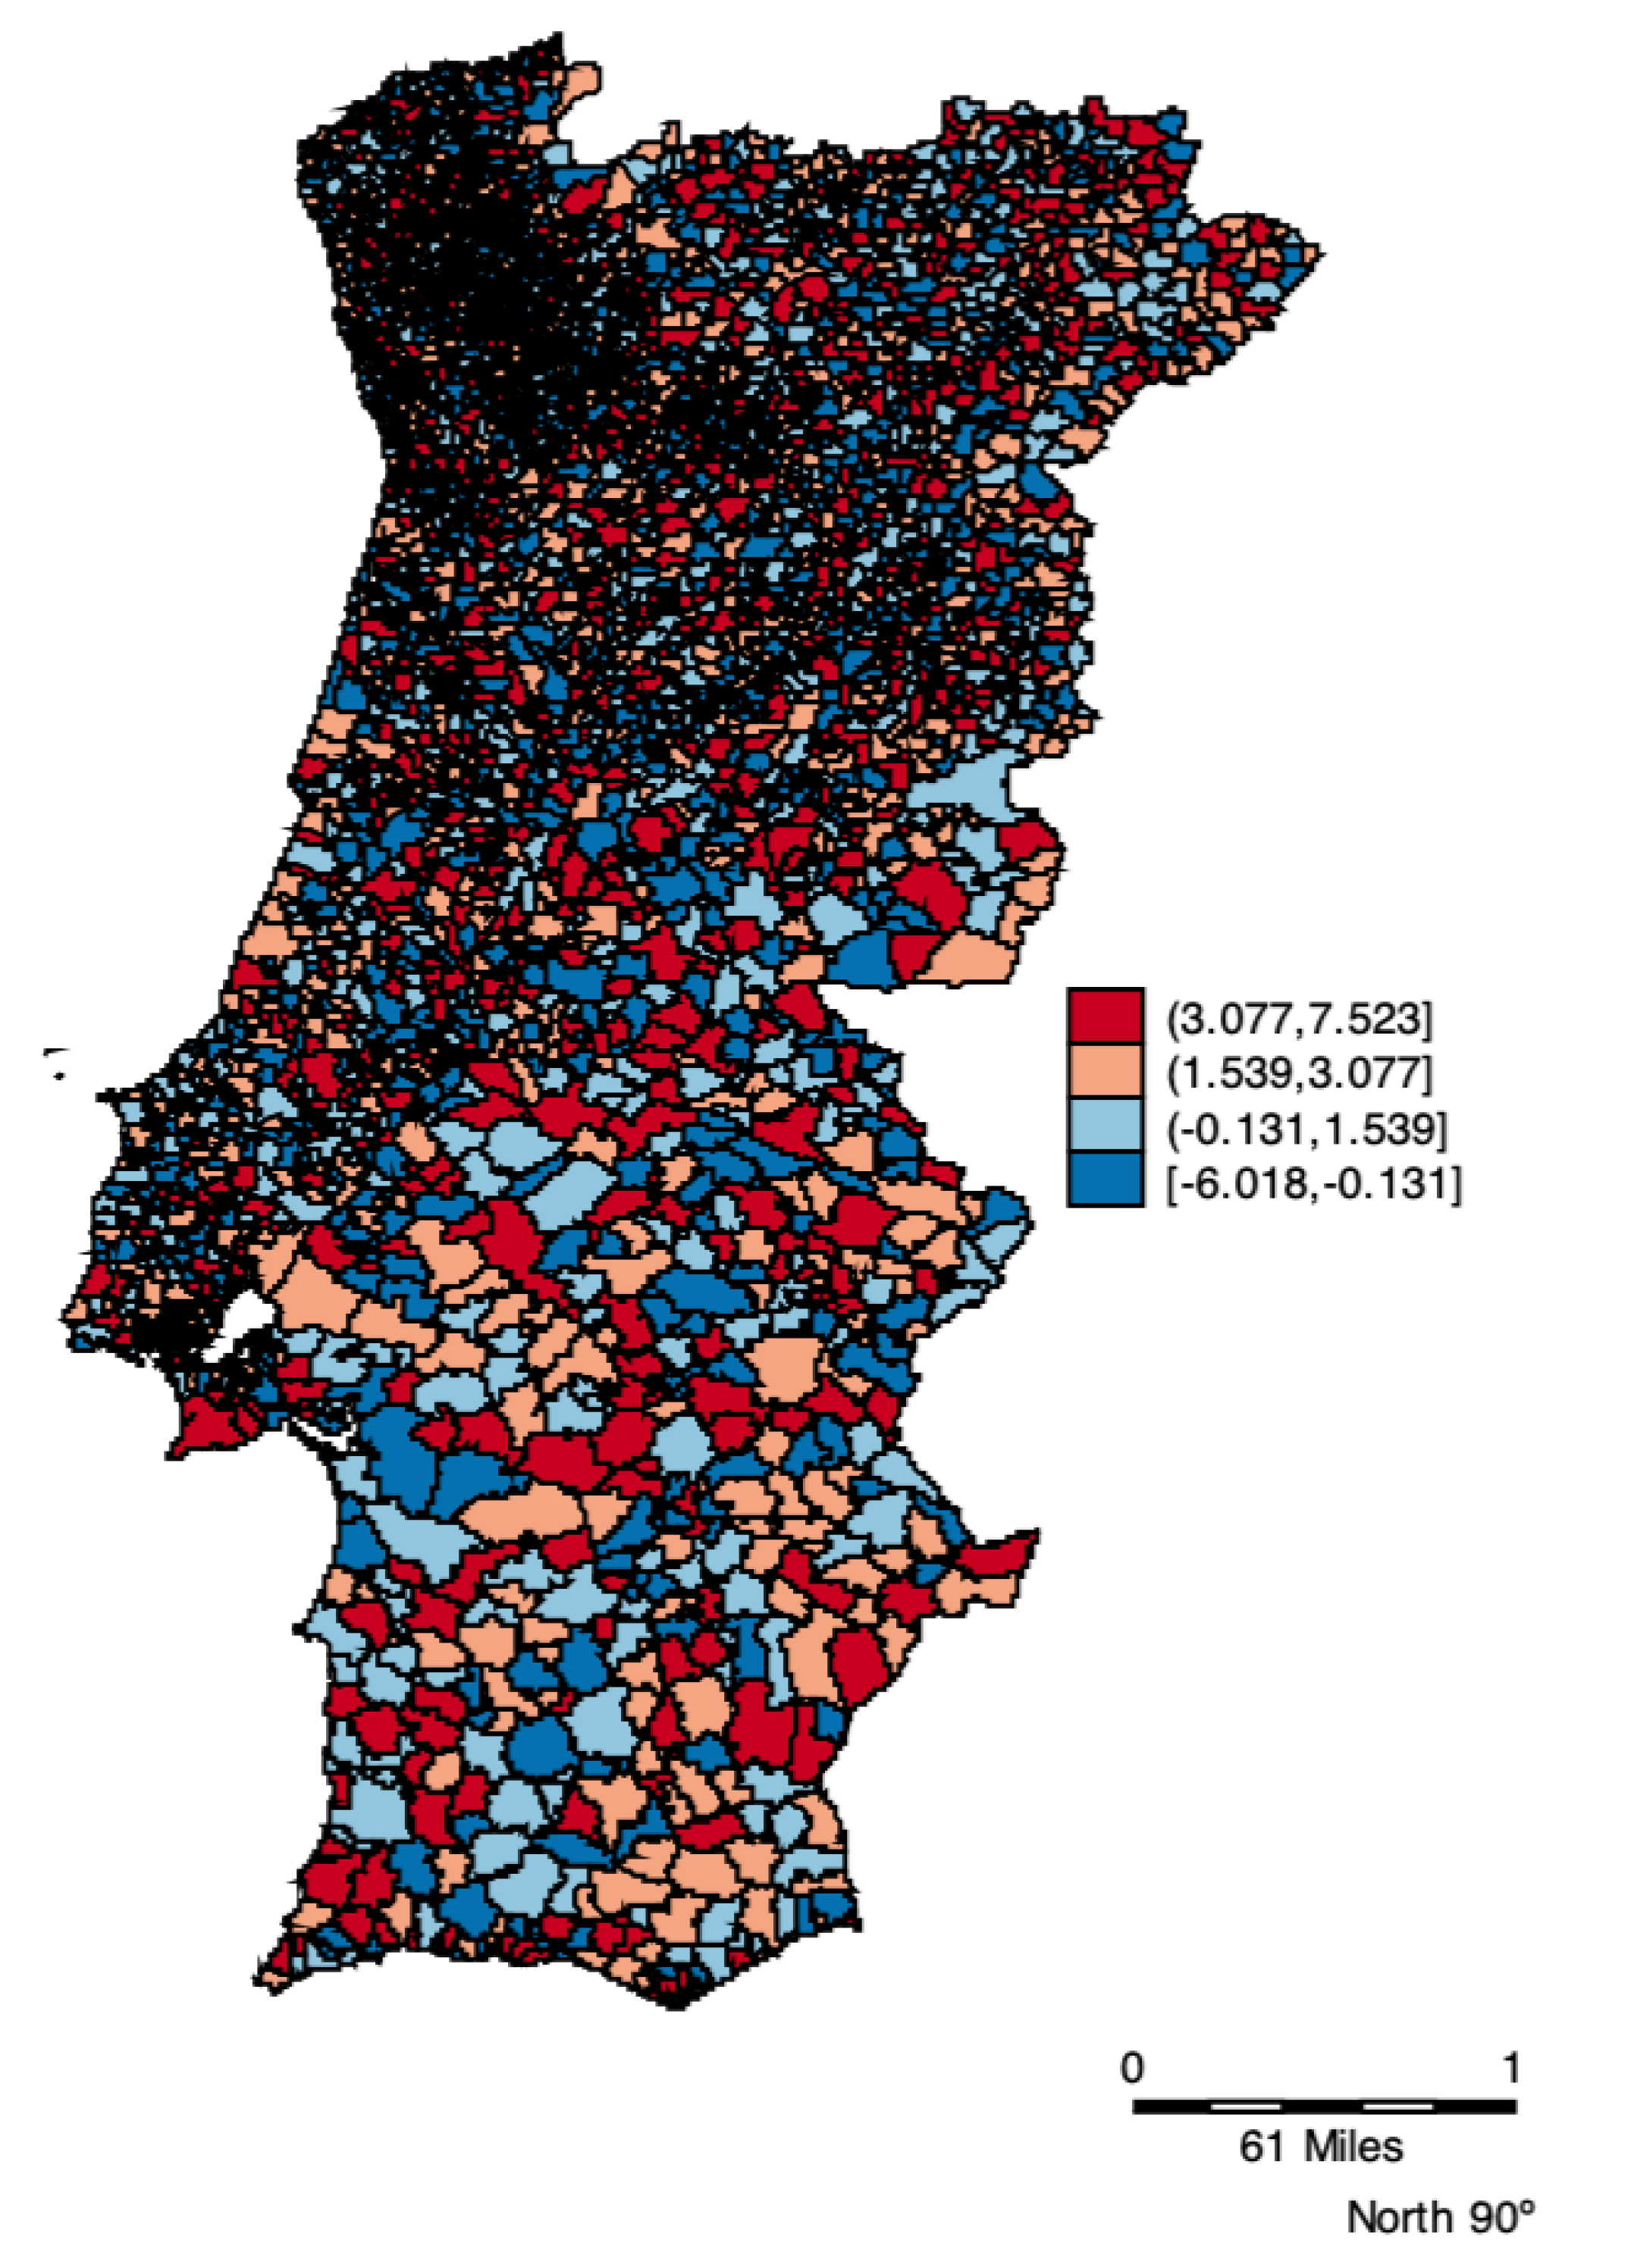
Social diversity and Mobility also had a differing effect in several parishes. Again, the spatial variation in these parameter estimates is significant. Contrary to the global model, social diversity ratio and mobility affect negatively rents in 27% and 46%, respectively, of parishes (see
Figure 3 and
Figure 4). These results may relate to peculiar demographic compositions in some parishes and respective municipalities. Clearly, global models indicate an average relationship that can disguise interesting spatial variations.
The other factors affecting rents had differing effects in some parishes, though less marked than unemployment, mobility, and social diversity ratio. Population density affects the rent positively, which corroborates empirical evidence. However, in approximately 5% of the parishes, the population density affects the rental price negatively. Beato (in Lisbon) is one of the parishes where density affects the rent negatively. Beato is a low-income parish with public-housing projects, and rents are controlled, which may explain this counterintuitive effect. The area of the dwelling affects the rent positively in 95% of the parishes. The number of dwellings available in a parish affects the rent positively, which accords with the law of supply in 82% of the parishes. In the remaining 12% of the parishes, probably social factors are stronger in explaining the rents. The proportion of houses overcrowded, which proxies for low living conditions, affects the rent negatively on average, but in 9% of the parishes, it affects the rents positively. The elderly dependency ratio affects the house rent prices negatively in 92% of parishes, whereas the sustainability index affects rents positively in 98% of the parishes.
Finally,
Figure 5 shows the GWR estimated error by parish. The majority of the parishes had a low estimated error. These values depict the accuracy with which the model replicates the observed values of housing rents in the vicinity of the parish for which the model is calibrated.
5. Discussion
Controlling for different structural, socio-economic, and spatial factors, housing rents in Portugal present strong spatial variability at the parish level. The substantial spatial non-stationarity exposed by the GWR is important to consider. In this study, the application of the methodology that controls for local variability reveals the limitation of the global coefficient’s sign and direction from one parish to another. The present results are in accordance with previous analyses showing the strength of the GWR to model housing rents at a large scale [
1]. However, the non-stationarity of housing rents in Portugal was not considered in earlier studies, and our local model casts some doubt on findings from previous studies using global models [
56].
Population density affects housing rents positively in continental Portugal, which corroborates Yang’s [
20] findings for US home prices. Nevertheless, the negative effect displayed by 5% of Portuguese parishes and the gap between its minimum and maximum estimators reveals the uneven distribution of the Portuguese population across the continent. Households concentrate around the vicinity of employment centers, and the relative distance from home to the workplace is decided by the trade-off between rents and transportation costs. As a consequence, the most peripheral parishes can sometimes display an above-average population density combined with low housing rents. This type of suburb is usually populated by low-income households. Low living conditions proxied by overcrowded dwellings affect housing rents negatively in 91% of the Portuguese parishes. This finding combined with the negative effect of population density in 5% of the Portuguese parishes highlights the negative effect of low living conditions on housing rents. The low-income households pay lower rents and live in more crowded areas, corroborating that urban spaces hierarchy patterns affect housing rents. Accetturo et al. [
57] showed that the presence of a population not socially integrated reduces housing prices when compared to other locations where populations are socially integrated.
Housing policies in Portugal are largely organized toward the planning of the metropolitan areas where the increase in the supply of buildings and dwellings occurred between 1991 and 2011 [
58]. These metropolitan areas are major tourism destinations. In tandem, a private rental sector dominates the historic centers of the largest cities, Lisbon and Porto, with protected tenants, contributing to a combination of low rents and low house quality [
59]. Density has increased around metropolitan areas that display a relatively young stock of housing and overcrowded dwellings tend to be located in densely populated areas. The results from our spatial analysis of the Portuguese housing rents corroborate the impact of the above-mentioned Portuguese housing policies on housing rents [
58].
Relative to structural factors, our results indicate that the area of the house in square meters affects the rent positively, which is in accordance with the study of Gan et al. [
60]. The number of houses available for a living had a positive effect on housing rents. New dwellings are built in parishes where the population is willing to pay and live, thus, where rents are directly related to the supply of houses. However, in 18% of the Portuguese parishes, the number of houses affects rents negatively. This finding may suggest domestic migration or seasonal demand, decreasing the overall demand for housing.
The global results for unemployment had the expected effect on rents. Overall, Portuguese households attribute value to being near employment centers, which represents security and income, i.e., higher living conditions. In these locations where employment is concentrated, the urban spaces pattern is divided by housing, offices, industrial, and commercial places. This competition for urban space usually contributes to decreasing the supply of dwellings and consequently increasing the housing rents [
5,
61]. Contrary to the global results, in 44% of the Portuguese parishes unemployment affects the rents positively. This finding may suggest that rents are high regardless of employment status in these parishes because employment is concentrated in nearby parishes to which there is good mobility. Thus, these parishes where unemployment has a positive effect on rents are mainly residential, and local employment is low. Other possibilities are that either the rents are controlled by the government or the parishes have public-housing projects. Cui et al. [
11] distinguish factors that influence housing prices from determinants that affect housing rents. The authors highlight that factors such as proximity to an employment center affected renters’ decisions more than it influenced homeowners.
The spatial variation in the sustainability parameter is highly significant and affects rents positively in 98% of the Portuguese parishes. Sustainability seeks to measure how the working-age population is sustaining the elderly. Its positive effect sheds some light on how parishes that are populated mainly by active population have higher rents. Similarly, the spatial variability in the parameter of the old-dependency ratio is significant. The elderly dependency affects rents negatively in 92% of the Portuguese parishes. Hiller and Lerbs [
62] studied 87 German cities and found that the development of a city’s age structure influences the evolution of local housing prices, namely, that while increases in real urban housing prices tend to be lower in cities that age more rapidly, housing rents are positively associated with aging. The authors conclude that the German elderly do not decrease their demand for rental dwellings. This result does not apply to the data used in this study since the long-term rents were forced by legislation to remain unchanged from the 1950s until 2012. Another possibility is that the majority of the retired population have very low income in Portugal, thus being forced to concentrate in parishes with lower housing rents.
At the municipality level the social diversity ratio, which measures the degree of diversity in terms of socioeconomic groups, affects rents positively in 73% of the parishes. This suggests that Portuguese households are willing to pay a rent premium to live where there is social diversity. This result also suggests that rents are higher in urban locations, where there is usually greater social diversity. Finally, mobility has a positive effect on housing rents in 54% of the Portuguese parishes. For similar housing features, renters are willing to pay a premium to have access to public transit convenience, as shown by Wang et al. [
13]. Famões (a parish within the municipality of Odivelas, which belongs to the Lisbon Metropolitan Area, the capital city) provides a closer look at the spatial variation of the mobility parameter. The metro (underground train) network had been recently extended to this parish at the time these data were collected, obtaining the maximum positive effect of mobility on housing rents. The negative local estimations in about 46% of the cases may indicate parishes located in rural areas, where mobility is not an important factor when deciding to rent a house.
There are several limitations to this study. Data on mobility and social diversity ratio are defined at the municipality level. These data are not available at the parish level. However, presenting the analysis at the municipality level would not capture the differences that exist within each municipality. Thus, the spatial analysis at the level of the Portuguese parishes had priority. This analysis considered all parishes of the Portuguese continent. Future research will focus on different regions and distinguish rural from urban areas. Straight-line or Euclidian distance computed from geo-coded locations was used to weight the interaction of the nearby parishes. Future research would benefit from using travel time and travel distance.
A recent analysis estimates an overall increase in property values from short-term rentals [
56,
63], which tends to increase housing rents for residents. A study on New York City showed that Airbnb had opened a new potential income flow into housing markets, which is systematic but geographically uneven, creating a new form of rent gap in culturally popular and internationally recognizable areas [
64]. Horn and Merante [
65] examine whether the increasing presence of Airbnb in Boston raises asking rents and whether the change in rents may be driven by a decline in the supply of housing offered for rent. The results suggest that a one standard deviation increase in Airbnb listings is associated with an increase in asking rents of 0.4%. However, the effect of tourism growth and the development of short-term rentals on housing rents are not addressed in this study. This model uses data from 2011, when the rents were still controlled, a period of economic crisis, and with a relatively low volume of tourism. The combination of these three effects justifies not including in this work the impact of tourism and short-term rentals on housing rents. In future research, the spatial analysis of housing rents will use data on tourism and Airbnb fees as relevant factors affecting housing rents.
This discussion identifies several avenues for methodological improvement: the search for a satisfactory adjustment for mobility and social diversity at the parish level, the inclusion of travel mode options, use of travel time or travel distance, distinguishing between rural and non-rural areas, and finally, considering non-linear effects from polycentric cities.
6. Conclusions
The present study contributes to the research on housing rents by examining and comparing the spatial distribution of housing rents in continental Portugal, using data collected at the parish level, the smallest local administrative unit. Using data on housing rents for 4049 parishes in 278 municipalities, the paper explores the spatial patterns of housing rents using the GWR methodology. This paper demonstrates the utility of incorporating spatial analytical techniques to examine housing rents across Portugal. The local GWR revealed interesting patterns that were undetected by global models.
The results suggest that the Portuguese housing rental market exhibits a heterogeneous pattern across the territory, displaying spatial variability and a hierarchical space distribution as a consequence of its locational attributes. Housing rents tend to be higher in parishes with greater population density, a higher number of dwellings, and greater potential sustainability. Large dwellings (in terms of square meters) also affect rents positively. Portuguese housing rents are inversely related to low living conditions, unemployment, and elderly dependency. Better mobility and a higher social-diversity ratio are also seen to increase housing rents in Portugal.
These findings have important policy implications. First, the set of indicators from the model seems to indicate that households pay a premium to live in urban places, where there are more houses available to rent, the concentration of employment, and increased sustainability. In urban parishes the population density is greater, facilitating social interactions and social diversification. The increase in housing rents of urban parishes can have an exclusion effect upon the population earning low real wages. Policy measures aimed at controlling rents for a low-income population may help to increase sustainability, social diversity, and lower elderly dependency in some parishes. Second, given the importance of mobility on housing rents, a well-designed public transportation system is an important policy tool to plan the Portuguese urban space pattern, pushing people away from crowded urban places toward more rural well-connected peripheries.
Third, economic shocks, as the recent COVID-19 pandemic or the previous economic and financial crisis and its implications in terms of households’ indebtedness, will likely affect housing rents. Debt and defaults tend to decrease property values and housing rents while displacing the less fortunate to peripheric areas where they can afford to pay for housing. Additionally, those that are not displaced may lack the means to invest in housing putting at stake the rehabilitation of the housing stock [
58]. The COVID-19 pandemic is a health crisis that requires physical distance imposing the digitalization of work and economic shutdown in several sectors. Thus, spatial analysis of housing rents can be useful to help urban planning policies. Shirvani Dastgerdi et al. [
66] developed a novel vision for improving housing policies in the post-COVID time to moderate the long-lasting issue of affordable housing in historic cities. Their findings are based on five historic cities in Europe, suggest that housing policies need to be supported simultaneously at both international and local levels. From the international perspective, associated cultural heritage organizations, like United Nations Educational, Scientific and Cultural Organization (UNESCO) and its advisory bodies and the World Tourism Organization (UNWTO), need to develop restriction policies that manage tourism flows in historic cities like increasing the airline taxation. At the local level, housing policies need to both ban the growth of illegal tourist accommodation in the city and locate new hotels in suburban or rural areas.
The effect of COVID-19 on care homes has been substantial [
67]. The aging society also points to the need to find housing solutions that can integrate those that live in caring homes in order to minimize the outbreak effects. A crowded location can contribute to the dissemination of a contagious disease pressing local and national authorities to find creative solutions for susceptible residential communities.


