Abstract
To continuously improve air quality, after implementation of the “Clean Air Action Plan, 2013–2017” (CAAP), the “Three-year Action Plan to Fight Air Pollution” (TYP) was further conducted from 2018 to 2020. However, the effectiveness of the TYP remains unclear in one of the major city-clusters of China, the Sichuan Basin. In this study, the bottom-up method was used to quantify the emission reduction during TYP based on the emissions inventory in Sichuan Basin in 2017 and the air pollution control measures adopted from 2018 to 2020 in each city. The reduction of PM2.5 concentration and the avoided premature deaths due to implementation of air pollution control measures were assessed by using an integrated meteorology and air quality modeling system and a concentration-response algorithm. Emissions of SO2, NOx, PM2.5, and VOCs in the Sichuan Basin have been reduced by 42.6, 105.2, 40.2, and 136.6 Gg, respectively. The control of non-electricity industry contributed significantly to the emission reduction of all pollutants, accounting for 26–49%. In addition, the control of mobile sources contributes the most to NOx reductions, accounting for 57%. The results illustrate that the focus of air pollution control in Sichuan Basin is still industrial sources. We also found that the emission reduction of NOx, PM2.5, and VOCs in Chengdu is significantly higher than that of other cities, which were about 3.4~15.4 times, 2.2~40.1 times, and 4.3~24.4 times that of other cities, respectively. In Sichuan Basin, the average reduction rate of PM2.5 concentration due to air pollution control measures was 5% on average, with the highest contributions from industry, mobile source, and dust emission control. The decrease rate in each city ranges between 1~10%, and the decreasing ratios in Dazhou (10%), Chengdu (8%), and Zigong (7%) are relatively higher. The number of premature deaths avoided due to air pollution control measures in Sichuan Basin is estimated to be 22,934. Chengdu and Dazhou have benefitted most from the air pollution control measures, with 6043 and 2713 premature deaths avoided, respectively. Our results indicate that the implementation of TYP has achieved remarkable environmental and health benefits.
1. Introduction
Fine particulate matter (PM2.5) pollution has critical impacts on human health, visibility, and climate change [1,2,3,4,5]. In 2013 and 2018, the Ministry of Ecology and Environment of the People’s Republic of China released the “Clean Air Action Plan, 2013–2017” (hereafter “CAAP”) and the “Three-year Action Plan to Fight Air Pollution, 2018–2020”, aiming to improve air quality. Since then, the reduction of pollution has given rise to significant environmental effects and has led to continuous improvement of air quality across the country [6,7,8,9]. As of 2020, both the Yangtze River Delta (YRD) and Pearl River Delta (PRD) regions have met air quality standards [10] in terms of PM2.5 concentration.
Consequently, many researchers have carried out quantitative studies to evaluate the environmental and health benefits of the prevention and control measures. On the national level, Zhang et al. (2018) [11] estimated that, during the implementation of the CAAP, anthropogenic sulfur dioxide (SO2), nitrogen oxides (NOx), carbon monoxide (CO), inhalable particulate matter (PM10), fine particulate matter (PM2.5), black carbon (BC), and organic carbon (OC) emissions in China decreased by 59%, 21%, 23%, 36%, 33%, 28%, and 32%, respectively. In particular, the emissions of power plants and industrial sectors have been significantly reduced. Yang et al. (2016) [12] analyzed the effects of coal control strategy on energy system and local pollutant reduction for 2030, pointing out that with the co-control of both source and end-of-pipe, emissions of SO2, NOX, and PM2.5 by 2030 will be reduced by 78.85%, 77.56%, and 83.32% compared to the level of 2010. Maji et al. (2018) [13] reported the PM2.5-related long-term mortality of 161 cities in China in 2015, indicating that PM2.5-related premature mortality was at 652,000, about 6.92% of total deaths in China of year 2015. Gautam et al. (2016) [14] suggested a lack of exposure and monitoring studies to inform personal exposure in the household and rural areas of Asian environments through a literature review. Recently, Wu et al. (2019) [15] and Ma et al. (2019) [16] evaluated the impact of the implementation of CAAP on the number of premature deaths and average life expectancy in cities across China, indicating that it helped to avoid approximately 60,213 premature deaths, and the life expectancy of cities in 2017 had increased 0.16 years compared with the 2013 level. Another recent study by Huang et al. (2021) [17] evaluated the effects of straw burning bans in China and found that after intensive implementation of straw burning bans, national total PM2.5 emissions from open crop straw burning activities decreased by 46.9% and the number of premature deaths avoided was 4256 in China.
On regional and urban scales, Wang et al. (2016) [18] evaluated the impact of emission control measures on the air quality in the PRD region with weather research and forecasting (WRF)/community multiscale air quality (CMAQ) model system during 2006–2014. Feng et al. (2019) [19] also used the WRF/CMAQ model system to assess the influence of shipping on air quality and potential human exposure in the YRD region. Tao et al. (2019) [20] pointed out that in the autumn and winter of 2017–2018, long-term measures in Dezhou contributed 9.4% to the improvement of PM2.5 concentration. Besides, during the autumn and winter of 2018–2019, the reduction in emissions due to long-term measures was relatively limited (5.0%). In recent years, some researchers have carried out evaluations on the effectiveness of short-term control measures adopted for major events. For example, Liu et al. (2013) [21] used air quality simulation methods and observational data to analyze the air quality improvement effects of emission reduction measures during the Guangzhou Asian Games; Li et al. (2019) [22] assessed the effectiveness of regional joint prevention and control measures during the Second World Internet Conference; and Zhan et al. (2020) [23] evaluated the effects of air pollution prevention and control measures during the “13th Five-Year Plan” (hereafter 13th FYP) period in the PRD region.
Due to its complex topography and unfavorable meteorological conditions, the Sichuan Basin is one of the five most heavily polluted regions in China [3,24,25,26]. In 2015, 82% of cities in the Sichuan Basin failed to meet the national air quality standards, with seven days of severe pollution. Related studies show that the PM2.5 concentration in Chengdu was higher than most major cities in China, including Beijing, Nanjing, and Shanghai [27,28,29,30]. Zigong had the highest particle pollution concentration over the whole Yangtze River economic belt of China [31]. To achieve the national air quality goal of the 13th FYP, after the completion of the CAAP, the People’s Government of Sichuan Province released the “Implementation of Three-year Action Plan to fight Air Pollution (2018–2020)” (hereafter TYP). The key tasks of the TYP include adjustment of industrial, energy, transportation, and land use structure as well as imposing short-term emissions reduction during severe pollution episodes [32]. Studies have evaluated the effects of air pollution prevention and control measures in Sichuan Basin, but all of them focused on implementation of the CAAP and did not carry out the health benefit assessment. For instance, Zhou et al. (2020) [7] studied the variations of chemical components in PM2.5 during 2012–2018 in Neijiang and found that the implementation of the CAAP has effectively controlled coal combustion and industrial emissions. The study only monitored one site, making it difficult to generalize to the whole city, and the effects of mitigation measures were not quantified. Similarly, Ma et al. (2019) [33] assessed the cost–benefit during the CAAP in Chengdu-Chongqing and pointed out that the environmental protection investment of the CAAP was RMB 74.6 billion. However, the environmental and health benefits were not evaluated in the study. Wang et al. (2020) [34] established the air pollutant emission inventory of Sichuan Province from 2013 to 2017 with a top-down approach and conducted a qualitative analysis of the impact of pollutant emission reduction on air quality using pearson correlation coefficient. Quantitative analysis of environmental benefits was also not carried out in that study.
The objective of this study is to quantitatively evaluate the impact of key tasks on PM2.5 concentration and associated health benefits during the TYP. We first adopted a bottom-up approach to measure every city’s air pollution control measures, put forward a detailed formula for calculating emissions reduction, and established an emission reduction inventory. Furthermore, by using the WRF/CMAQ model system and the concentration-response (C-R) algorithm, we quantified the impact of emission reduction measures on environmental and health benefits. The results of this study are intended to provide scientific basis for the prevention and control of air pollution during the 14th FYP.
2. Methodology
2.1. Emission Estimation
2.1.1. Baseline Emission Inventory
In this work, we collected the activity data of Sichuan Basin in 2017 (such as energy consumption, production output, solvent usage, vehicle stock, construction area, etc.), emission factors, and pollution control technologies, and established an anthropogenic air pollutants emission inventory for Sichuan Basin according to the method described by He (2018) [35] and various inventory compilation guidelines [36]. Air pollutants considered include SO2, NOx, CO, PM10, PM2.5, volatile organic compounds (VOCs), and ammonia (NH3). The stationary combustion SO2 sources are estimated using the material balance algorithm (Equation (1)), and other pollutants are estimated using the emission factor method (Equation (2)).
E is the total SO2 emissions; i is the i-th enterprise; n is the number of enterprises; k is the fuel type; Ck is the fuel coefficient. When k is coal burning, Ck = 17; when k is fuel oil, Ck = 20 [35]; W is the consumption of fuel, t; S is the sulfur content of the fuel, %; η is the removal efficiency of enterprise control measures, %.
where E is the annual pollutant emission; i is the type of pollutant; p is the type of emission source; A is the activity level; EF is the emission factor. Details of activity data sources, selection of emission factors, and inventory results are detailed in Xu et al. (2020) [37].
2.1.2. Emission Reduction Calculation
A detailed description of the calculation of emission reductions for each source is as follows.
(1) Industry
Industrial sources include power plants, industrial boilers, and industrial processing. The main control measures include eliminating outdated production capacity and upgrading pollutant removal technology. During the TYP, Sichuan Basin had completed a total of 6.9 million kilowatts of ultra-low emission retrofits for coal-fired units, 2 ultra-low emission retrofits for iron and steel, and 40 in-depth treatments on the cement industry. Consequently, this led to a cumulative reduction of crude steel production capacity (4.97 million tons), iron making production capacity (2,270,000 tons) as well as elimination of cement production capacity (1.86 million tons) and flat glass production (2,755,300 weight boxes). In addition, a cumulative of 565 small coal-fired boilers in built-up areas in cities at the county level and above were eliminated and transformation of 36 key enterprises’ VOC efficient treatment process were completed. In addition, 3316 automobile maintenance companies adopted low-volatility water-based paints.
The emission reductions of enterprises that were eliminated or had reduced production capacity are equal to the baseline inventory emissions, whereas for those that used ultra-low emission transformation, in-depth governance and upgrades to reduce emissions were calculated based on the activity data and pollution control efficiency in 2020 using the method described in Section 2.1.1. The data were extracted from the Sichuan Province Air Quality Control Comprehensive Decision Support Platform–Emission Inventory Management System (http://103.203.219.137:31000, accessed on 30 September 2016), and they were all self-reported by enterprises. The change in pollution control efficiency is shown in Table 1. The elimination of coal-fired boilers mostly led to the use of natural gas and electricity as alternative energy sources. Therefore, emissions are zero if electricity is used as an alternative energy source. The emission reduction is equal to the emission of the original coal-fired boiler, and if natural gas is used as an alternative energy source, the calculation is carried out by the following formula.
whereby P is the emission reduction amount, t; i is the i-th enterprise; Ap is the coal consumption of the enterprise, t; Qm is the calorific value per unit of coal, J/kg; Qt is the calorific value per unit of natural gas consumption, J/m3; EFt is the emission generation coefficient of the natural gas boiler; and ηs is the pollutant removal efficiency of gas boiler, %.

Table 1.
Changes of pollution control efficiency before and after renovation of key industries.
(2) Mobile source
Mobile source emission reduction measures mainly include phase-out of the old vehicles and the upgrading of oil products. During the TYP, a total of over 1.3 million old vehicles were phased out; National VI standard gasoline and diesel were fully supplied, and selling gasoline and diesel below National VI standard was prohibited. Besides, the “10 ppm ultra-low sulfur diesel” of vehicle diesel, ordinary diesel, and part of marine oil was realized. In this case, the emission reduction of obsolete vehicles is equal to the emission of the corresponding vehicle in the baseline inventory. The calculation formula for the emission reduction of fuel upgrade is as follows:
In this equation, P is the emission reduction; j is the vehicle type; EF is the emission factor before the fuel quality upgrade; EFi is the emission factor after the upgrade; C is the number of motor vehicles; and S is the average mileage during the corresponding period. Data sources for activity levels and emission factors are based on Xu et al. (2020) [37].
The sulfur content of fuel was 50 ppm in 2017 and 10 ppm in 2020. The pollutant emission correction factors corresponding to different standard sulfur content are shown in Table 2 (He (2018) [35]).
Table 2.
The pollutant emission correction factors corresponding to different standard and sulfur content.
(3) Dust
The main measures for dust control are to carry out special inspections, urge construction sites to implement various prevention and control measures, and at the same time increase urban road maintenance and management. Emission reductions are calculated through the improvement of the efficiency of prevention and control measures. This study obtained the dust prevention and control measures for construction sites and main roads in Chengdu, calculated the average removal efficiency of construction sites and roads compared with 2017, and obtained the improvement rate of prevention and control efficiency before and after the implementation of the TYP. The result of improvement rate is applied to other cities in the Sichuan Basin. The prevention and control measures were acquired from the Bureau of Housing and Urban-rural Development, while the prevention and control efficiency of different measures were obtained from the “Technical Guidelines for the Particulate Emission Inventories from Dust (Trial)” issued by the Ministry of Environmental Protection of the People’s Republic of China. The emission reduction calculation for this category is as follows:
where P is the emission reduction amount, t; Ei is the baseline inventory emission amount, t; is the average control efficiency in 2017; and is the average control efficiency in 2020. In 2017, most dust control measures at construction sites were setting up enclosure, with an average control efficiency of 12%. In 2020, dust control measures included yard coverage and spray, with an average control efficiency of 42%.
(4) Open biomass burning
It is important to note that the open biomass burning is prohibited, and any violation is under strict supervision of local government. According to the characteristics of straw incineration, this study calculated the emission reduction based on the comprehensive utilization efficiency of straw combined with satellite data (Equation (6)). The data on comprehensive utilization efficiency of straw was obtained from the Department of Ecology and Environment of Sichuan Province.
where P is the emission reduction amount, AD is the original straw burning amount, EF is the original straw emission factor, ρ is the comprehensive utilization rate of the original straw, ρi is the comprehensive utilization rate of the straw after the emission reduction is implemented, and m is the statistical period before emission reduction. mi is the number of satellite fire points in the statistical period after straw burning was banned. The comprehensive utilization efficiency of straw in the Sichuan Basin was 84% in 2017 and 91% in 2020.
(5) Storage and transportation
The control measures for storage and transportation sources are mainly focused on reducing the volatilization of VOCs from gas stations through oil and gas recovery. During the TYP, the Sichuan Basin completed a total of 4299 gas stations oil and gas recovery and transformation. In this category, emission reduction is mainly affected by the efficiency of oil and gas recovery, and emission reduction is computed using Equation (5). The data on oil and gas recovery efficiency was acquired from the Sichuan Provincial Economic and Information Department, which was 50% in 2017 and 80% in 2020.
2.2. Modeling System
We applied the WRF (ver. 3.9)/CMAQ (ver. 5.0.2) modeling system to predict the air quality changes. WRF is a new generation of meso-scale weather forecast model jointly developed by the United States National Center for Atmospheric Research (NCAR) and National Centers for Environmental Prediction (NCEP), which mainly provided meteorological field drivers for air quality simulation. Moreover, LAMBERT projection was applied for the WRF model. The latitude and longitude of the projection center are 103° E and 45° N, respectively; the first parallel latitude is 25° N, and the second parallel latitude is 45° N. The meteorological simulation adopted a two-layer one-way nested simulation area with resolutions of 27 km × 27 km and 9 km × 9 km, respectively. The larger domain covers East Asia and some countries in Southeast Asia, whereas the inner domain covers the entire Sichuan Province. Furthermore, CMAQ were also configured with similar grid domains adopting the projection coordinates consistent with WRF. In addition to reducing the impact of meteorological boundary conditions on the air quality model simulation, the CMAQ model domain is slightly smaller than the WRF domain. The model simulation configurations are shown in Figure 1.
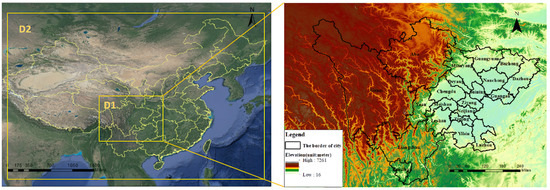
Figure 1.
Modeling domain.
The CMAQ model uses meteorological input data and emission source inventory input data to simulate the transport and diffusion process of pollutants, gas-phase chemical processes, liquid phase chemical processes, and aerosol chemical processes. In this study, the CMAQ model was configured with AERO6 module for aerosol simulation; the organic aerosol utilized the SOAP; the CB05 mechanism was used for the gas phase chemistry; while the ACM2 scheme for the vertical diffusion. Additionally, the pollutant emissions were processed using the Sparse Matrix Operator Kernel Emission (SMOKE ver. 5.3) model, which mainly processes emission source inventory data such as temporal allocation, spatial allocation, vertical allocation, and speciation and then provides data that meets the format requirements of the atmospheric chemistry transmission model. The biogenic emissions are processed based on the Model of Emission of Gases and Aerosols from Nature (MEGAN ver. 2.1). We applied the baseline and reduction emission inventory developed for the Sichuan Basin as well as other regional data in the 2017 MEIC inventory developed by Tsinghua University (HTTP://meicmodel.org, accessed on 30 April 2018). This study also adopted 2017 as the base year with the simulation period focusing on four typical months (i.e., January, April, July, and October) to represent winter, spring, summer, and autumn, respectively. The average of the four months represents the annual average.
2.3. Estimation of Health Impacts
In order to estimate the health impacts resulting from long-term exposure to PM2.5, we calculated the premature mortality due to cerebrovascular disease (stroke), ischemic heart disease (IHD), chronic obstructive pulmonary disease (COPD), and lung cancer (LC) based on a widely used C-R model [38,39,40]:
where RR is the relative risk; C refers to the simulated annual average PM2.5 concentration; C0 is the threshold value of PM2.5 concentration for each disease; and α, γ, and δ are parameters used to describe the different shapes of the C-R curve among various diseases (Jiang et al., 2015) [41]. The national premature mortality (H) attributable to PM2.5 was estimated using Equation (8) [42], where B is the provincial incidence of a given health impact (https://vizhub.healthdata.org/gbdcompare/, accessed on 16 February 2020) and P is the exposed population of each city in Sichuan derived from the 2017 Statistical Yearbook.
3. Results and Discussions
3.1. Model Verification
In this work, we compared the air pollutant concentration from typical air quality monitoring stations with the corresponding grid cell hourly average pollutant concentration simulated by the CMAQ model to verify the reliability of the modeling results (Table 3). Statistical indexes include Mean Bias (MB), Mean Error (ME), Normalized Mean Bias (NMB), and Normalized Mean Error (NME) [17,22]. The NMB statistical value corresponding to PM2.5 in most cities is within ±30%. However, the normalized mean error (NME) of the simulated value is relatively large, and the NME of some cities exceed 40%. Generally, the model underestimates the concentration of PM2.5 in each city. We note that the underestimation of PM2.5 is related to the underestimation of the precursor emission source inventory and the overestimation of wind speed under static wind conditions, especially wind speed, which is the main parameter that affects the accuracy of simulation results [43]. The overall model is relatively reliable and can be used to evaluate the environmental benefits of emission reduction by subsequent measures.
Table 3.
Evaluation of PM2.5 concentrations for cities in Sichuan Basin.
3.2. Emissions Reduction
3.2.1. Emissions Reduction
The emission reduction of various measures during the TYP are shown in Table 4. The emission reduction of SO2, NOx, PM2.5, and VOCs in Sichuan Basin in 2020 were 42.6, 105.2, 40.2, and 136.6 Gg, respectively, compared to the year 2017. The SO2 emission reductions mainly came from the control of non-electric industries, industrial boilers, and ultra-low emission transformation of power plants, which accounted for 49%, 26%, and 24% of the total SO2 emission reductions, respectively. For NOx emissions, the mobile source contributed the highest emission reduction, accounting for 57%, followed by non-electricity industry control. The PM2.5 emission reductions mainly came from the treatment of non-electric industries, dust sources, and open burning of straw accounting for more than 20% reductions. We also found that VOC emission reduction mainly came from control of non-electric industries as well as solvent use and mobile sources, accounting for 45%, 19%, and 15%, respectively. In general, the control of the non-electricity industry has made a remarkable contribution to the emission reduction of various pollutants, accounting for about 26–49%. This is mainly because, on the one hand, the discharge of pollutants in the non-electric industry was relatively high in 2017, with each pollutant discharge accounting for 21~49% [37]. On the other hand, the control of non-electric industries was the key task during the TYP, including the elimination of outdated production capacity, industrial kiln governance, steel and cement ultra-low emission transformation, etc.
Table 4.
Emission reduction of pollution source in Sichuan Basin during TYP (Gg).
Wang et al. (2020) [34] evaluated the effectiveness of air pollution prevention and control in the Sichuan Province during the CAAP and showed that the average annual emission reduction of SO2 was 19.6 Gg and for VOCs was 15.4 Gg. However, in this study, we found that during the TYP, the average annual emission reduction of SO2 and VOCs was 14.2 Gg and 45.5 Gg, respectively. Notably, the SO2 emission reduction potential has been significantly narrowed, and the reduction of VOCs has been improved during the TYP.
Additionally, the emission reduction of pollutants in each city is shown in Figure 2. We found that, in Chengdu, the emission reductions of NOx (26.5 Gg), PM2.5 (6.8 Gg), and VOCs (35.7 Gg) were 3.4~15.4 times, 2.2~40.1 times, and 4.3~24.4 times higher than in the other cities (Figure 2), which is related to higher pollutant emissions [37] and is consistent with the research results of Wang et al. (2020) [34]. Further, the difference in SO2 emission reduction among cities is relatively small. Cities such as Guang’an, Meishan, Deyang, and Dazhou have relatively high emission reductions, mainly due to measures such as ultra-low emission transformation of power plants and renovation of coal-fired boilers.
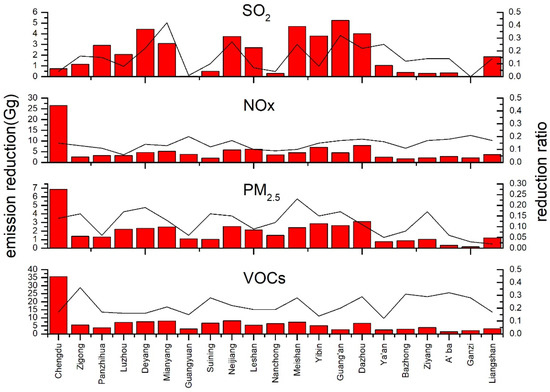
Figure 2.
Pollutant emission reduction and reduction ratio in each city.
3.2.2. Emissions Reduction Verification and Implication for Uncertainties
Figure 3 shows the comparison results of pollutant emission reduction ratio and observed concentration reduction ratio of air quality stations in cities from 2017 to 2020. In most cities, the reduction ratio of SO2, NOx, and PM2.5 emissions was consistent with the reduction ratio of observed concentration. However, there is a big difference between the change of emissions and observed concentration in some cities, such as Guangyuan, Leshan, Nanchong, and Yibin, where the emission reduction ratio of SO2 is significantly higher than the observed concentration reduction. In Deyang, the NOx emission in 2020 decreased by 14% compared with 2017, but the NO2 observed concentration increased by 4%. In Guangyuan, the reduction rate of PM2.5 was 6%, but the observed concentration increased by 19%.
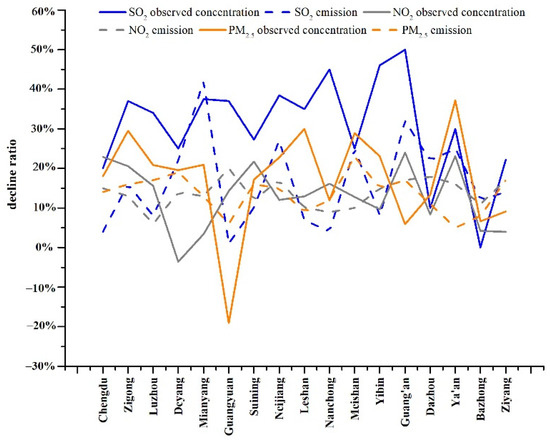
Figure 3.
Comparison of emission reduction ratio and observed concentration reduction ratio.
The difference between pollutant emissions and observed concentrations can be attributed to many factors. On one hand, after pollutants are emitted, they will undergo a series of chemical reactions. The reaction process is greatly affected by the real atmosphere, which may be the reason for the large difference between the pollutant emission and the observed concentration of individual cities [11,44,45]. On the other hand, uncertainties in both the observation and the calculation of emission reduction can also contribute to the discrepancies. Relevant studies have shown that the observed NO2 concentrations relied on chemiluminescence measurements, which may significantly overestimate NO2 concentrations [46], leading to differences between changes in emissions and observed observations. For emission reduction calculations, there are generally less uncertainties for pollutants (e.g., SO2 and NOx) whose emissions are dominated by large sources. However, for pollutants (e.g., PM2.5) whose emissions are contributed by scattered emitting sources, there is greater uncertainty [11]. The results calculated by the bottom-up method are relatively accurate [47], but non-compliance with regulations due to lack of inspection will lead to differences between estimated and real-world efficiencies of pollutant emission control facilities [48], which will affect the calculation of emission reduction. In addition, it is difficult to verify the effectiveness of measures such as phasing out coal-fired boilers and improving oil and gas recovery efficiency of gas stations, which may lead to higher uncertainty ranges in emission reduction calculations.
3.3. Impact on PM2.5 Concentration
We conducted two simulations with baseline emission inventory and reduced inventory (using 2017 weather conditions for both simulations) to quantify the contribution of emission control measures to PM2.5 concentration. Additionally, the average value of simulated concentration in the grid cells corresponding to the location of the typical air quality monitoring stations was considered as the average value of the city. As a result, the decrease proportions of PM2.5 concentration caused by the TYP measures in each city are shown in Figure 4.
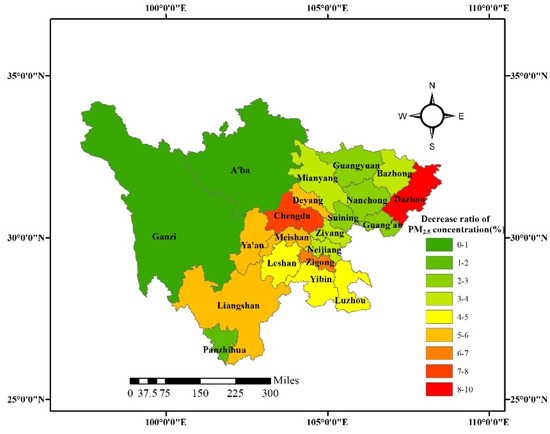
Figure 4.
Decrease ratios of PM2.5 concentration due to implementation of TYP.
Evidently, the average reduction rate of PM2.5 concentration in the Sichuan Basin is 5%, i.e., a decrease of 1.9 μg/m3. From 2017 to 2020, the reduction rate of observed PM2.5 concentration was 17%, which was higher than the reduction rate of PM2.5 caused by pollution emission reduction (5%). The differences are mainly attributed to changes in meteorology, the occurrence of COVID-19 and uncertainties in model simulation. First, the contribution of meteorological changes to PM2.5 concentration can reach −70~55% [49,50,51], and the contribution in the Sichuan Basin from 2000 to 2017 was ±10% [49]. The quantitative contribution of meteorological changes to PM2.5 concentration during the TYP needs to be further studied. Second, during the COVID-19 period in 2020, anthropogenic emissions significantly decreased, resulting in a decrease in the concentration of pollutants (e.g., PM2.5, SO2, and NO2) in most parts of the country [49,52]. The decrease of observed PM2.5 concentrations during the TYP can be partly attributed to the epidemic. Lastly, current air quality models are dependent on a priori knowledge [43], which still have substantial bias in simulating air pollutant concentrations, particularly in reproducing PM2.5 concentrations [53,54]. In this study, the model simulation underestimated PM2.5 concentration, which may understate the contribution of pollution emission reduction to the PM2.5 concentration improvement.
The reduction rate in each city ranges between 1~10%, corresponding to absolute decrease of 0.1~4.1 μg/m3. Cities including Dazhou, Chengdu, and Zigong have relatively high decline ratios, with 10%, 8%, and 7%, respectively. We also noted that the decrease in PM2.5 concentration in each city is closely related to the emission reduction for pollutants. For example, Dazhou, which has the largest decrease, has a relatively high emission reduction for all pollutants. Furthermore, the emission reductions of SO2, NOx, PM2.5, and VOCs are located in the province. No. 4, No. 2, No. 2, and No. 6 (Figure 2) indicate that the PM2.5 concentration of each city is mainly affected by local emissions, which is consistent with the study by Li et al. (2019) [22] in the YRD region. It is worth noting that emission reductions of all pollutants of Zigong are relatively low, all located at the bottom 10 of the Sichuan Basin (Figure 2). The emission reduction ratios of SO2 and NOx based on 2017 are relatively low, but the emission reduction ratios of PM2.5 and VOCs are at the sixth and first place, respectively (Figure 2). This shows that in addition to the PM2.5 emissions, VOCs emissions have a greater impact on the concentration of PM2.5 [55]. In addition, related studies show that Zigong is greatly affected by regional transmission, and the emission reduction of surrounding cities has a significant impact on PM2.5 in Zigong [56].
Further analysis on the contribution of various measures to the improvement of PM2.5 concentration are shown in Figure 5. We found that, during the implementation of TYP, non-electricity industry control and emission reduction measures contributed relatively highly to PM2.5 improvement at 2.1%, followed by mobile source emission control and dust control, each at 1.2%. The contribution of various measures to the improvement of PM2.5 concentration is consistent with its emission reduction.
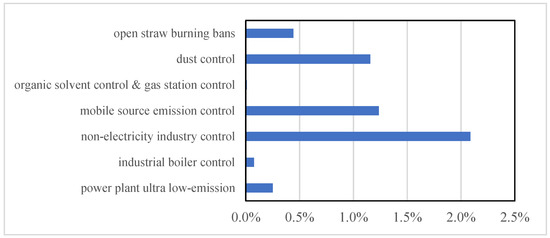
Figure 5.
Contributions of each measure in the TYP to PM2.5 improvement.
At present, the focus of the reduction of air pollutants in the Sichuan Basin is still based on industrial sources, taking into account both mobile sources and dust sources. With deepening of governance, the potential for industrial emission reduction will be narrowed, and the impact of mobile source emission reduction on air quality improvement will become increasingly prominent [23].
3.4. Impact on Human Health
In 2017, the number of premature deaths caused by PM2.5 pollution in the Sichuan Basin was 743,351 (Table 5). Among them, stroke and IHD largely accounted for 59% and 29%, respectively. In the cities, Chengdu had 2.9–156.2 times higher number of premature deaths than other cities, accounting for 21% of the total premature deaths, followed by Neijiang, Dazhou, and Nanchong, all accounting for about 7% of the total premature deaths. The number of premature deaths in cities such as A’ba, Ganzi, and Panzhihua was lower than 10,000. The number of premature deaths appears correlated with the city’s PM2.5 concentration and population.
Table 5.
The number of premature deaths in each city in 2017 and the number of premature deaths avoided after the implementation of TYP (persons).
After implementation of TYP, the number of premature deaths avoided due to the reduction of PM2.5 concentration in the Sichuan Basin was 22,934, and the number of deaths avoided due to stroke and IHD accounted for about 54% and 21% of the former number, respectively. Consequently, we found relatively high number of avoided premature deaths in Chengdu (6043) and Dazhou (2713), accounting for 26% and 12% of the Sichuan Basin, respectively. This is related to the large decrease in PM2.5 concentration. Although the PM2.5 concentration decline of Zigong was relatively high, the number of premature deaths avoided due to the improvement of PM2.5 concentration was only 955. This is mainly attributed to its small population, which was about 2.9 million at the end of 2017, accounting for only 3% of the total population of the Sichuan Basin (Sichuan Provincial Bureau of Statistics, http://tjj.sc.gov.cn/tjnj/cs/2018/indexch.htm, accessed on 15 November 2018).
The results of Ding et al. (2019) [57] showed that between 2013 and 2017 in the Sichuan Basin, the number of premature deaths avoided due to the decrease of PM2.5 concentration was 19,000, and the average number of premature deaths avoided was 3900 each year. However, in our study, we found that during the TYP in the Sichuan Basin (2018–2020), the average annual number of premature deaths avoided due to a decrease in PM2.5 concentration was 7600, which is significantly greater than the results of 2013–2017. The dynamic changes of population and PM2.5 concentration significantly affect the health assessment result [58]. The main difference between these two studies could be better explained by the difference in mortality rate applied in the calculations. In our study, we obtained the mortality rate for 2017 of each city (ranging from 0.05% to 0.09%) from the Sichuan Statistical Yearbook. On the contrary, Ding et al. (2019) [57] divided the death toll in Sichuan Province by the total population in the China Statistical Yearbook to obtain a death rate of 0.006%.
The product of urban population and the observed concentration of PM2.5 is used to express the degree of pollution exposure risk [59]. The range of changes in the degree of PM2.5 exposure risk in cities before and after the implementation of the TYP is shown in Figure 6. The increase in the number of urban residents combined with a drop in PM2.5 concentrations resulted in a 16% drop in PM2.5 exposure in the Sichuan Basin after the TYP was implemented. In most cities, population exposure levels of PM2.5 decreased by 3% to 48%. However, the degree of PM2.5 exposure in Guangyuan, A’ba, and Liangshan increased by 21%, 49%, and 9%, respectively, mainly because their observed PM2.5 concentration increased in 2020 compared with 2017.
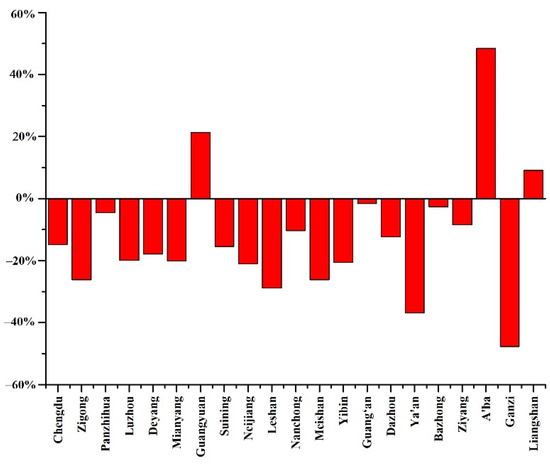
Figure 6.
The change of PM2.5 exposure risk before and after the implementation of the TYP.
4. Conclusions
In this study, emission reductions of the Sichuan Basin were calculated during the TYP. The WRF/CMAQ model and C-R algorithm were used to simulate the impact of pollution reduction on PM2.5 concentration and the health benefits.
After implementation of the TYP, the emissions of SO2, NOx, PM2.5, and VOCs in Sichuan Basin were reduced by 42.6, 105.2, 40.2, and 136.6 Gg, respectively. During the TYP, the emission reduction of the Sichuan Basin was still mainly focused on industry. It was found that the control of the non-electricity industry contributed significantly to the emission reduction of all pollutants, accounting for 26~49% of the total number. The pollutant emission reduction ratios are consistent with the observed concentration reduction ratios in most cities.
The average decline ratio of PM2.5 concentration in the Sichuan Basin due to implementation of TYP was around 5% on average, and the decreasing rate of each city ranges between 1~10%. Cities including Dazhou, Chengdu, and Zigong had relatively high decline rates. Non-electric industry governance (2.1%), mobile source emission control (1.2%), and dust control (1.2%) have relatively high contributions to the improvement of PM2.5 over the Sichuan Basin area.
The implementation of the TYP during 2018–2020 also generates significant health benefits. The number of premature deaths avoided due to the decrease of PM2.5 concentration in the Sichuan Basin is estimated to be 22,934. Chengdu and Dazhou had the most avoided premature deaths due to a significant decline in PM2.5 concentration and their large population, which accounted for 26% and 12% in the Sichuan Basin.
Author Contributions
Conceptualization, J.C. and L.L.; methodology, X.F.; software, Y.Q.; validation, Y.Z., X.F. and E.Y.; formal analysis, L.H. (Ling Huang); investigation, Y.L.; resources, L.H. (Li Han); data curation, M.H.; writing—original draft preparation, J.C.; writing—review and editing, J.W.; visualization, L.L.; supervision, E.Y.; project administration, J.C.; funding acquisition, J.C. and L.L. All authors have read and agreed to the published version of the manuscript.
Funding
This research was funded by the National Key Research and Development program of China, grant number 2018YFC0214006, and the National Natural Science Foundation of China, grant number 42075144, 41875161, 42005112.
Institutional Review Board Statement
Not applicable.
Informed Consent Statement
Not applicable.
Data Availability Statement
Not applicable.
Acknowledgments
This study was financially sponsored by the National Key Research and Development program of China (2018YFC0214006) and the National Natural Science Foundation of China (grant 42075144, 41875161, 42005112).
Conflicts of Interest
The authors declare no conflict of interest.
References
- Laden, F.; Neas, L.M.; Dockery, D.W.; Schwartz, J. Association of fine particulate matter from different sources with daily mortality in six U. S. cities. Environ. Health Persp. 2000, 108, 941–947. [Google Scholar] [CrossRef]
- Watson, J.G. Visibility: 2002. science and regulation. J. Air Waste Manag. Assoc. 2002, 52, 628–713. [Google Scholar] [CrossRef] [Green Version]
- Cui, C.; Huang, X.J.; Jiang, Y.; Ni, C.J.; Zhang, X.L.; Wang, S.G. Characteristics and sources of water-soluble ions of atmospheric par-ticulates in Zigong City. Environ. Sci. Technol. 2020, 43, 78–85. (In Chinese) [Google Scholar]
- Zhang, X.; Ding, X.; Talifu, D.; Wang, X.; Abulizi, A.; Maihemuti, M.; Rekefu, S. Humidity and PM2.5 composition determine atmospheric light extinction in the arid region of northwest China. J. Environ. Sci. 2021, 100, 279–286. [Google Scholar] [CrossRef] [PubMed]
- Gollakota, A.R.; Gautam, S.; Santosh, M.; Sudan, H.A.; Gandhi, R.; Jebadurai, V.S.; Shu, C.-M. Bioaerosols: Characterization, pathways, sampling strategies, and challenges to geo-environment and health. Gondwana Res. 2021, 99, 178–203. [Google Scholar] [CrossRef]
- Sun, X.L.; Du, S.Y.; Wang, S.X. Application and Research of Decision Support Technology Platform for Air Pollution Prevention and Control in Typical Polluted City. Res. Environ. Sci. 2021, 34, 158–171. (In Chinese) [Google Scholar]
- Zhou, Y.; Luo, B.; Yang, W.W.; Hao, Y.F.; Maimaiti, S.; Xie, S.D. Evaluation of effects of air pollution prevention and control action plan based on variations of chemical components in PM2.5 during 2012-2018 in Neijiang city. Res. Environ. Sci. 2020, 33, 563–571. (In Chinese) [Google Scholar]
- Tian, J.; Ni, H.; Han, Y.; Shen, Z.; Wang, Q.; Long, X.; Zhang, Y.; Cao, J. Primary PM2.5 and trace gas emissions from residential coal combustion: Assessing semi-coke briquette for emission reduction in the Beijing-Tianjin-Hebei region, China. Atmos. Environ. 2018, 191, 378–386. [Google Scholar] [CrossRef]
- Lu, X.; Lin, C.; Li, W.; Chen, Y.; Huang, Y.; Fung, J.C.; Lau, A.K. Analysis of the adverse health effects of PM2.5 from 2001 to 2017 in China and the role of urbanization in aggravating the health burden. Sci. Total. Environ. 2019, 652, 683–695. [Google Scholar] [CrossRef]
- MEE (Ministry of Ecology and Environment of the People’s Republic of China). China Ecology and Environment Statement 2020. 2021. Available online: http://www.mee.gov.cn/hjzl/sthjzk/zghjzkgb/202105/P020210526572756184785.pdf (accessed on 24 May 2021).
- Zheng, B.; Tong, D.; Li, M.; Liu, F.; Hong, C.; Geng, G.; Li, H.; Li, X.; Peng, L.; Qi, J.; et al. Trends in China’s anthropogenic emissions since 2010 as the consequence of clean air actions. Atmos. Chem. Phys. Discuss. 2018, 18, 14095–14111. [Google Scholar] [CrossRef] [Green Version]
- Yang, X.; Teng, F. The air quality co-benefit of coal control strategy in China. Resour. Conserv. Recycl. 2018, 129, 373–382. [Google Scholar] [CrossRef]
- Maji, K.J.; Dikshit, A.K.; Arora, M.; Deshpande, A. Estimating premature mortality attributable to PM2.5 exposure and benefit of air pollution control policies in China for 2020. Sci. Total. Environ. 2018, 612, 683–693. [Google Scholar] [CrossRef]
- Gautam, S.; Yadav, A.; Tsai, C.-J.; Kumar, P. A review on recent progress in observations, sources, classification and regulations of PM2.5 in Asian environments. Environ. Sci. Pollut. Res. 2016, 23, 21165–21175. [Google Scholar] [CrossRef] [PubMed]
- Wu, W.-L.; Xue, W.-B.; Wang, Y.-L.; Lei, Y.; Feng, T.; Cai, Z.-L. [Health Benefit Evaluation for Air Pollution Prevention and Control Action Plan in China]. Environ. Sci. 2019, 40, 2961–2966. [Google Scholar]
- Ma, G.X.; Yu, F.; Zhang, Y.S.; Peng, F. Effect of Implementation of the Action Plan on Prevention and Control of Air Pollution and Its Impact on Life Expectancy in China. Res. Environ. Sci. 2019, 32, 1966–1972. (In Chinese) [Google Scholar]
- Huang, L.; Zhu, Y.; Wang, Q.; Zhu, A.; Liu, Z.; Wang, Y.; Allen, D.T.; Li, L. Assessment of the effects of straw burning bans in China: Emissions, air quality, and health impacts. Sci. Total. Environ. 2021, 789, 147935. [Google Scholar] [CrossRef] [PubMed]
- Wang, N.; Lyu, X.P.; Deng, X.J.; Guo, H.; Deng, T.; Li, Y.; Yin, C.Q.; Li, F.; Wang, S.Q. Assessment of regional air quality resulting from emission control in the Pearl River Delta region, southern China. Sci. Total Environ. 2016, 573, 1554–1565. [Google Scholar] [CrossRef] [PubMed]
- Feng, J.; Zhang, Y.; An, J.; Li, L.; Shen, Y.; Fu, Q.; Wang, X.; Liu, J.; Wang, S.; Ding, D.; et al. The influence of spatiality on shipping emissions, air quality and potential human exposure in the Yangtze River Delta/Shanghai, China. Atmos. Chem. Phys. 2019, 19, 6167–6183. [Google Scholar] [CrossRef] [Green Version]
- Tao, S.T.; Zhang, Q.H.; An, J.Y.; Huang, D.D.; Lou, S.R.; Qiao, L.P.; Cheng, J.P.; Li, L.; Huang, C. Assessment of air pollution control effect from ground-based observation and emission inventory for the prevention and control of air pollution in autumn and winter of Dezhou City from 2017 to 2019. Res. Environ. Sci. 2019, 32, 1739–1746. (In Chinese) [Google Scholar]
- Liu, H.; Wang, X.; Zhang, J.; He, K.; Wu, Y.; Xu, J. Emission controls and changes in air quality in Guangzhou during the Asian Games. Atmos. Environ. 2013, 76, 81–93. [Google Scholar] [CrossRef]
- Li, L.; Zhu, S.; An, J.; Zhou, M.; Wang, H.; Yan, R.; Qiao, L.; Tian, X.; Shen, L.; Huang, L.; et al. Evaluation of the effect of regional joint-control measures on changing photochemical transformation: A comprehensive study of the optimization scenario analysis. Atmos. Chem. Phys. Discuss. 2019, 19, 9037–9060. [Google Scholar] [CrossRef] [Green Version]
- Zhan, J.; Wang, M.; Liu, Y.; Feng, C.; Gan, T.; Li, L.; Ou, R.; Ding, H. Impact of the ‘13th Five-Year Plan’ Policy on Air Quality in Pearl River Delta, China: A Case Study of Haizhu District in Guangzhou City Using WRF-Chem. Appl. Sci. 2020, 10, 5276. [Google Scholar] [CrossRef]
- Wang, Q.; Cao, J.; Shen, Z.; Tao, J.; Xiao, S.; Luo, L.; He, Q.; Tang, X. Chemical characteristics of PM2.5 during dust storms and air pollution events in Chengdu, China. Particuology 2013, 11, 70–77. [Google Scholar] [CrossRef]
- Chen, Y.; Xie, S.-D. Long-term trends and characteristics of visibility in two megacities in southwest China: Chengdu and Chongqing. J. Air Waste Manag. Assoc. 2013, 63, 1058–1069. [Google Scholar] [CrossRef]
- An, Z.; Huang, R.-J.; Zhang, R.; Tie, X.; Li, G.; Cao, J.; Zhou, W.; Shi, Z.; Han, Y.; Gu, Z.; et al. Severe haze in northern China: A synergy of anthropogenic emissions and atmospheric processes. Proc. Natl. Acad. Sci. USA 2019, 116, 8657–8666. [Google Scholar] [CrossRef] [Green Version]
- Gautam, S.; Patra, A.K.; Kumar, P. Status and chemical characteristics of ambient PM2.5 pollutions in China: A review. Environ. Dev. Sustain. 2019, 21, 1649–1674. [Google Scholar] [CrossRef]
- Chen, P.L.; Wang, T.J.; Hu, X.; Xie, M.; Zhuang, B.L.; Li, L. A study of chemical mass balance source apportionment of fine particulate matter in Nanjing. J. Nanjing Univ. (Nat. Sci.) 2015, 51, 524–534. [Google Scholar]
- Chen, Y.; Xie, S.D.; Luo, B. Composition and pollution characteristics of fine particles in Chengdu during 2012 to 2013. Acta Sci. Circumst. 2016, 36, 1021–1031. [Google Scholar]
- Cheng, S.; Lang, J.; Zhou, Y.; Han, L.; Wang, G.; Chen, D. A new monitoring-simulation-source apportionment approach for investigating the vehicular emission contribution to the PM2.5 pollution in Beijing, China. Atmos. Environ. 2013, 79, 308–316. [Google Scholar] [CrossRef]
- Mao, M.; Sun, H.; Zhang, X. Air Pollution Characteristics and Health Risks in the Yangtze River Economic Belt, China during Winter. Int. J. Environ. Res. Public Health 2020, 17, 9172. [Google Scholar] [CrossRef] [PubMed]
- People’s Government of Sichuan Province. Implementation of Three-year Action Plan to fight Air Pollution (2018–2020). 2019. Available online: http://www.sc.gov.cn/10462/c103044/2019/1/17/ab06a1e709964f35ab7ce48ea1c8ba30.shtml (accessed on 12 January 2019).
- Ma, G.X.; Zhou, X.; Wu, C.S.; Peng, F. Cost-Benefit Assessment of Impacts of China’s National Air Pollution Action Plan in Cheng-Yu Region. China Environ. Manage. 2019, 6, 38–43. (In Chinese) [Google Scholar]
- Wang, Y.X.; Zhang, Y.Q.; Wang, S.G. Results and analysis of air pollution prevention and control in Sichuan Province from 2013 to 2017. J. Lanzhou Univ. Nat. Sci. 2020, 56, 388–395. (In Chinese) [Google Scholar]
- He, K.B. Technical Manual for Compilation of Emission Inventory of Urban Air Pollutants. 2018. Available online: https://max.book118.com/html/2018/1116/8107025055001133 (accessed on 31 August 2018).
- MEE (Ministry of Ecology and Environment of the People’s Republic of China). 2014. Available online: http://www.mee.gov.cn/gkml/hbb/bgg/201408/t20140828_288364.htm (accessed on 20 August 2014).
- Xu, C.X.; Chen, J.H.; Li, Y.; He, M.; Feng, X.Q.; Han, L.; Liu, Z.; Qian, J. Emission Inventory and Characteristics of Anthropogenic Air Pollution Sources Based on Second Pollution Source Census Data in Sichuan Province. Environ. Sci. 2020, 41, 4482–4494. [Google Scholar]
- Xiong, L.; Li, J.; Xia, T.; Hu, X.; Wang, Y.; Sun, M.; Tang, M. Risk Reduction Behaviors Regarding PM2.5 Exposure among Outdoor Exercisers in the Nanjing Metropolitan Area, China. Int. J. Environ. Res. Public Health 2018, 15, 1728. [Google Scholar] [CrossRef] [PubMed] [Green Version]
- Lin, C.; Lau, A.K.H.; Lu, X.; Fung, J.C.H.; Li, Z.; Li, C.; Wong, A.H.S. Assessing Effect of Targeting Reduction of PM2.5 Concentration on Human Exposure and Health Burden in Hong Kong Using Satellite Observation. Remote Sens. 2018, 10, 2064. [Google Scholar] [CrossRef] [Green Version]
- Burnett, R.T.; Pope, C.A.; Ezzati, M.; Olives, C.; Lim, S.S.; Mehta, S.; Shin, H.H.; Singh, G.; Hubbell, B.; Brauer, M.; et al. An Integrated Risk Function for Estimating the Global Burden of Disease Attributable to Ambient Fine Particulate Matter Exposure. Environ. Health Perspect. 2014, 122, 397–403. [Google Scholar] [CrossRef]
- Jiang, X.; Zhang, Q.; Zhao, H.; Geng, G.; Peng, L.; Guan, D.; Kan, H.; Huo, H.; Lin, J.; Brauer, M.; et al. Revealing the Hidden Health Costs Embodied in Chinese Exports. Environ. Sci. Technol. 2015, 49, 4381–4388. [Google Scholar] [CrossRef]
- Xie, R.; Sabel, C.; Lu, X.; Zhu, W.; Kan, H.; Nielsen, C.P.; Wang, H. Long-term trend and spatial pattern of PM2.5 induced premature mortality in China. Environ. Int. 2016, 97, 180–186. [Google Scholar] [CrossRef]
- Xiao, F.; Yang, M.; Fan, H.; Fan, G.; Al-Qaness, M.A.A. An improved deep learning model for predicting daily PM2.5 concentration. Sci. Rep. 2020, 10, 1–11. [Google Scholar] [CrossRef] [PubMed]
- Lamsal, L.N.; Martin, R.V.; Padmanabhan, A.; Donkelaar, A.V.; Zhang, Q.; Sioris, C.E.; Chance, K.; Kurosu, T.P.; Newchruch, M.J. Application of satellite observations for timely updates to global anthropogenic NOx emission inventories. Geophys. Res. Lett. 2011, 38, L05810. [Google Scholar] [CrossRef]
- Valin, L.C.; Russell, A.R.; Hudman, R.C.; Cohen, R.C. Effects of model resolution on the interpretation of satellite NO2 observations. Atmos. Chem. Phys. Discuss. 2011, 11, 11647–11655. [Google Scholar] [CrossRef] [Green Version]
- Lamsal, L.N.; Martin, R.V.; Donkelaar, A.; Celarier, E.A.; Bucsela, E.J.; Boersma, K.F.; Dirksen, R.; Luo, C.; Wang, Y. Indirect vali-dation of tropospheric nitrogen dioxide retrieved from the OMI satellite instrument: Insight into the seasonal variation of nitrogen oxides at northern midlatitudes. J. Geophys. Res. 2010, 115, D05302. [Google Scholar]
- Lu, Z.; Zhang, Q.; Streets, D.G. Sulfur dioxide and primary carbonaceous aerosol emissions in China and India, 1996–2010. Atmos. Chem. Phys. 2011, 11, 9839–9864. [Google Scholar] [CrossRef] [Green Version]
- Wang, S.; Zhang, Q.; Martin, R.V.; Philip, S.; Liu, F.; Li, M.; Jiang, X.; He, K. Satellite measurements oversee China’s sulfur dioxide emission reductions from coal-fired power plants. Environ. Res. Lett. 2015, 10, 114015. [Google Scholar] [CrossRef] [Green Version]
- Xu, Y.L.; Xue, W.B.; Lei, Y.; Huang, Q.; Zhao, Y.; Cheng, S.Y.; Ren, Z.H.; Wang, J.N. Spatiotemporal variation in the impact of mete-orological conditions on PM2.5 pollution in China from 2000 to 2017. Atmos. Environ. 2020, 223, 117215. [Google Scholar] [CrossRef]
- Huang, Q.; Wang, T.; Chen, P.; Huang, X.; Zhu, J.; Zhuang, B. Impacts of emission reduction and meteorological conditions on air quality improvement during the 2014 Youth Olympic Games in Nanjing, China. Atmos. Chem. Phys. Discuss. 2017, 17, 13457–13471. [Google Scholar] [CrossRef] [Green Version]
- Zhang, W.J.; Wang, H.; Zhang, X.Y.; Peng, Y.; Zhong, J.T.; Wang, Y.Q.; Zhao, Y.F. Evaluating the contributions of changed meteoro-logical conditions and emission to substantial reductions of PM2.5 concentration from winter 2016 to 2017 in Central and Eastern China. Sci. Total Environ. 2020, 716, 136892. [Google Scholar] [CrossRef] [PubMed]
- Mohammed, A.A.; Al, Q.; Hong, F.; Ahmed, A.; Ewees, D.Y.; Mohamed, A.E. Improved ANFIS model for forecasting Wuhan City air quality and analysis COVID-19 lockdown impacts on air quality. Environ. Res. 2021, 194, 110607. [Google Scholar]
- Chen, K.; Wang, M.; Huang, C.; Kinney, P.L.; Anastas, P.T. Air pollution reduction and mortality benefit during the COVID-19 outbreak in China. Lancet Planet. Health 2020, 4, e210–e212. [Google Scholar] [CrossRef]
- Bao, R.; Zhang, A.C. Does lockdown reduce air pollution? Evidence from 44 cities in northern Chin. Sci. Total Environ. 2020, 731, 139052. [Google Scholar] [CrossRef] [PubMed]
- Wu, M.; Wu, D.; Xia, J.R.; Zhao, T.L.; Yang, Q.J. Analysis of Pollution Characteristics and Sources of PM2.5 Chemical Components in Chengdu in Winter. Environ. Sci. 2019, 40, 76–85. [Google Scholar]
- Lei, Y.; Zhang, X.L.; Kang, P.; Wang, H.L.; Qing, Q.; Ou, Y.H.; Lu, N.S.; Deng, Z.C. Analysis of Transport Pathways and Potential Sources of Atmospheric Particulate Matter in Zigong, in South of Sichuan Province. Environ. Sci. 2020, 41, 3021–3030. [Google Scholar]
- Ding, D.; Xing, J.; Wang, S.; Liu, K.; Hao, J. Estimated Contributions of Emissions Controls, Meteorological Factors, Population Growth, and Changes in Baseline Mortality to Reductions in Ambient PM2.5 and PM2.5-Related Mortality in China, 2013–2017. Environ. Health Perspect. 2019, 127, 67009. [Google Scholar] [CrossRef]
- Huang, B.; Wang, J. Big spatial data for urban and environmental sustainability. Geo-Spatial Inf. Sci. 2020, 23, 125–140. [Google Scholar] [CrossRef]
- Habil, M.; Massey, D.; Taneja, A. Personal and ambient PM2.5 exposure assessment in the city of Agra. Data Brief 2016, 6, 495–502. [Google Scholar] [CrossRef] [Green Version]
Publisher’s Note: MDPI stays neutral with regard to jurisdictional claims in published maps and institutional affiliations. |
© 2021 by the authors. Licensee MDPI, Basel, Switzerland. This article is an open access article distributed under the terms and conditions of the Creative Commons Attribution (CC BY) license (https://creativecommons.org/licenses/by/4.0/).