Article

The Impact of Air Quality on Inbound Tourist Arrivals over China Based on Grey Relational Analysis

1
Business School, Shandong Normal University, Jinan 250358, China
2
School of Environmental and Chemical Engineering, Shanghai University, Shanghai 200444, China
*
Author to whom correspondence should be addressed.
Sustainability 2021, 13(19), 10972; https://doi.org/10.3390/su131910972
Submission received: 3 August 2021 / Revised: 15 September 2021 / Accepted: 28 September 2021 / Published: 2 October 2021
(This article belongs to the Special Issue Air Quality: Sustainability of Human Society)

Abstract

:
Air pollution has a significant impact on tourism; however, research in this area is still limited. In this study, we applied grey relational analysis to panel data from 31 provinces in China and evaluated the relationship between air quality and inbound tourist arrivals. The study focused on provincial-level disparities for the different key air quality evaluation standards during 2009–2012 and 2013–2019. For instance, we considered PM10, SO2, NO2 and the excellent and good ratings of Air Pollution Index (API) during 2009–2012 and the additional PM2.5, CO, O3 and the excellent and good ratings of Air Quality Index (AQI) from 2013 to 2019. Results indicate that: (1) Inbound tourist arrivals are significantly and positively affected by ambient air quality, and the impact from 2013 to 2019 was greater than that from 2009 to 2012; (2) there is regional diversity in inbound tourist arrivals, and the impact of the different air quality indicators varies; (3) inbound tourists showed greater sensitivity to air pollution under the AQI standard; (4) the impact of air quality indicators on the inbound tourist arrivals shows grey relational order, and the concentration of PM2.5, PM10 and SO2 have less impact than NO2, CO and O3 on changes in tourism numbers; (5) consistency in the air quality impact on foreign tourists and compatriot tourists from HK, MO and TW varies by air quality indicators. This study highlights the need for appropriate measures to improve air quality for high-quality and sustainable development of inbound tourism.

1. Introduction

Tourism is among the fastest growing emerging industries in the world and is a key sector that promotes economic growth and employment [1]. Development of inbound tourism is an important sign to evaluate the globalization state and maturity of a country’s (or region’s) tourism industry. Since 2010, China has become the third largest tourist destination with rapidly developing tourism market. However, from 2012 to 2014, China’s air pollution deteriorated, and the number of inbound tourists declined. According to the study by Asian Development Bank, less than 1% of China’s 500 large cities met the World Health Organization (WHO) air quality standards in 2012 [2]. In addition, according to the 2014 World Environmental Performance Index (EPI), China ranked 118 out of 178 countries and regions [3]. Consequently, since 2013 the Chinese government has vigorously promoted the prevention and control of air pollution, contributing to improving air quality [4,5] and rebounding inbound tourist arrivals. As a result, great changes have taken place in both China’s air quality and inbound tourists in the past decade.
Lots of attention has been paid to the relationship between air pollution and tourism. Some scholars have argued that environmental pollution, particularly air pollution, has an interactive relationship (or even a reverse causality) with tourism development [1,6,7,8,9,10,11]. At the same time, air quality is characterized by hidden risks that worry tourists more than disaster risks and affect tourists’ risk perceptions and travel experiences, thus influencing their destination choices and other travel behaviors [8,9,10,11,12,13,14,15]. Therefore, air quality is a major factor in determining the competitiveness of tourist destinations and a key issue in the tourist decision-making process [16,17,18,19,20,21]. Recent studies on the Chinese inbound tourism market have shown that air quality pollution caused by high concentrations of air pollutants such as PM2.5 (fine particulate matter, particles with diameters lower than 2.5 µm) can have enormous negative impact [22,23,24] and a significant negative correlation [8,22,25,26,27,28] on the number of inbound tourists. The allocation of time for tourism activities caused by tourist avoidance psychology can lead to tourism seasonality [17]. Increased air pollution may also negatively affect the image of China as a tourist destination through public opinion reports and even reduce the willingness of inbound tourists to visit China, resulting in negative tourism demand and harming the tourism industry [14,29,30,31]. In addition, environmental changes and air pollution have a damaging impact on tourism, making it a serious challenge for tourism to face depleted resources, reduced investment and weakened government support [6].
A review of relevant related studies shows that current researchers have mainly focused on the impact of air quality on inbound tourism on a micro and macro level. At the micro level, questionnaires and interviews are used to evaluate the impact of air quality on tourists’ perceptions, satisfaction and their decision-making behavior. On the other hand, time-series-based panel data are used at the macro level in conjunction with quantitative measures (such as regression analysis) to study the impact of air pollution on tourism. Indeed, the negative impact of air pollution on inbound tourism is characterized by heterogeneity in terms of regional differences [32], but comparative studies on the inter-regional differences in the impact of ambient air quality on tourism development are less common. In addition, China used different air quality evaluation indicators, Air Pollution Index (API) and Air Quality Index (AQI), to measure air quality before and after 2012, respectively. It is therefore necessary to use a comprehensive dataset and variables to compare the impact of air quality on the number of inbound tourists in China among different provinces under different ambient air quality evaluation systems.
In view of bridging the existing research gap, this study attempted to evaluate the impact of air pollution on tourism in different provinces of China using detailed statistical data. Taking the shift year 2012 as a demarcation point due to different ambient air quality standards, we analyzed the changes of inbound tourist arrivals with regard to the changes of ambient air quality in China based on API and AQI indicators from 2009 to 2012 and from 2013 to 2019, respectively. In addition, we evaluated the differences at the provincial- level under the different air quality evaluation systems. The results of this work will be beneficial in suggesting continued improvement of air quality and promotion of high-quality and sustainable development of inbound tourism in China.

2. Methodology

2.1. Data Collection

2.1.1. Selection of the Study Period

We collected a decade of data from 2009 to 2019, during which China experienced substantial changes in air pollution. Subsequently, inbound tourism is highly sensitive and susceptible to the global socioeconomic shocks and epidemic effects (such as the global financial crisis in 2008 and COVID-19 in 2020). This may obstruct the accurate measurement of air pollution’s impact on inbound tourism. Therefore, we ignored two years (2008 and 2020) to obtain a relatively consistent period from 2009 to 2019. Furthermore, the relevant data we could find were only updated to 2019.
Furthermore, since China’s ambient air quality evaluation standard changed in 2013 (specific description of the change is given in Section 2.1.2 below), we unavoidably chose the two different air quality data periods (i.e., from 2009 to 2012 and from 2013 to 2019), each with different indicators.

2.1.2. Selection of Variables

It is important to note that China’s statistical caliber of inbound tourism is different from that applied by the United Nations World Tourism Organization (UNWTO), particularly in terms of the number of inbound tourists and overnight tourists. Internationally, the word “tourist” often refers to those who stay more than 24 h and less than one year without gaining any economic benefits from the visiting country. In tourism field they are also known as overnight tourists. In China the number of overnight tourist arrivals can provide a better reflection of the status of inbound tourism because one-day visits play a small role in the national tourism market. Too many of China’s one-day excursionists, however, are Chinese compatriots from Hong Kong (HK), Macao (MO) and Taiwan (TW). Therefore, the number of inbound one-day excursionists was not considered in this study.
Additionally, based on the accessibility of data and China’s special classification for inbound tourists, this study divided the number of inbound overnight tourists into the number of foreign tourists and the number of compatriots from HK, MO and TW (abbreviated as “NFT” and “NCT”, respectively). Both the NFT and NCT were selected as the indicators for changes of inbound tourist arrivals in 31 provinces in mainland China from 2009 to 2019.
Typically, inbound tourists generally consider megacities in various provinces as preferred destinations or as important tourist transfer stations, which means that the air quality of provincial capitals can (to some extent) represent the air quality of inbound tourist destinations. Therefore, we chose the air quality data from 31 provincial capitals to represent the air quality in the corresponding provinces.
It is worth noting that before 2013, (i.e., the study period between 2009–2012), China implemented the old ambient air quality standard: China’s National Ambient Air Quality Standards (CNAAQS) GB3095-1996 (issued by Environmental Protection Agency, on 18 January 1996, namely API standard, which was revised in 2000), which focused on monitoring the concentration of PM10, SO2 and NO2. However, since 2013, (i.e., the study period between 2013–2019), China’s provincial capitals implemented the new ambient air quality standard: CNAAQS GB3095-2012 (issued by Ministry of Environmental Protection, on 29 February 2012, namely AQI standard) and Technical Regulation on Ambient Air Quality Index (TRAAQI) HJ633-2012 (issued by Ministry of Environmental Protection, on 29 February 2012), incorporating CO, O3 and PM2.5, in the calculation of AQI and with a primary focus on monitoring six air pollutants (PM10, SO2, NO2, CO, O3 and PM2.5), as well as a more stringent grading restriction.
API and AQI are different indexes that evaluate air quality under different ambient air quality standards (Table 1). Evidently, when API and AQI are below 100, the air quality is characterized above Grade II, and the corresponding air quality classification is excellent or good. People are generally satisfied with or accepting of this class of air quality, where outdoor activities (including tourism activities) are more suitable. As a result, we evaluated inbound tourism with the excellent and good rating of air quality. Table A1 and Table A2 show the standard limit differences before and after 2012 and a comparison between China and international standards, respectively [33,34,35,36].
According to the TRAAQI HJ633-2012, AQI is formulated by Equations (1) and (2):
I A Q I P = I A Q I H i I A Q I L o B P H i B P L o ( C p B P L o ) + I A Q I L o
where IAQI refers to the sub-index of AQI for pollutant P; CP refers to the concentration value of pollutant P; BPHi is the nearest higher value in Table A1; BPLo is the nearest lower value in Table A1; IAQIHi is the corresponding IAQI of BPHi in Table A1 and IAQILo is the corresponding IAQI of BPLo in Table A1.
A Q I = max { I A Q I 1 , I A Q I 2 , , I A Q I n }
According to Technical Requirements for Urban Ambient Air Quality Daily Report and Forecast (2008), API is formulated as above. The IAPI and its corresponding air pollutant concentration limit refer to Table A1.
Considering the significant differences in the evaluation of air quality standards before and after 2012 and in order to ensure the comparability and effectiveness of data analysis, this study selected: the average annual concentrations of PM10 (2009–2019), PM2.5 (2013–2019), SO2 (2009–2019), NO2 (2009–2019); the daily average 95th percentile concentration of CO (2013–2019); the daily maximum 8 h 90th percentile concentration of O3 (2013–2019); the annual excellent and good classification of the API (“EGR”: 2009–2012) and the annual excellent and good classification of the AQI (“EGR”: 2013–2019).
Moreover, all the data used in this study for inbound tourists and for the air quality indicators from the 31 provinces in mainland China were extracted from the China Statistical Yearbook (2010–2020), compiled by National Bureau of Statistics of China, which is a reputable authority with detailed records.

2.2. Grey Relational Analysis

The grey relational analysis method measures the degree of relationship between factors of two systems, according to the degree of similarity or dissimilarity between the factors. Essentially, in the grey system process (or with uncertain information) development, an observation can be made whether the change trend of two factors (which vary over time or from object to object) is consistent. If the degree of synchronous change is high, then the degree of relationship between the two factors is high, and vice versa. In general, the grey relational analysis provides a quantitative measure for the development and change of a system. Dynamic process analysis can be integrated to seek the relationship between each sub-system (or factor) in the system through a quantitative analysis method. Therefore, this method was chosen in this study to measure the relationship between changes of ambient air quality and inbound tourist arrivals.

2.2.1. Selected Data Columns

For grey relational analysis, we first formulated reference data columns containing the number of inbound overnight tourists received by the 31 provinces from 2009 to 2019. The selected indicators include NFT for Y1 and NCT for Y2, which are expressed by Yj.
The compared data columns in grey relational analysis are listed as the ambient air quality of different provincial capitals from 2009 to 2012 and from 2013 to 2019. In the former period, the ambient air quality indicators include PM10 for X1, SO2 for X2, NO2 for X3 and EGR for X4, while during the latter period the ambient air quality indicators selected include PM10 for X1, PM2.5 for X2, SO2 for X3, NO2 for X4, CO for X5, O3 for X6 and EGR for X7.
Therefore, the ambient air quality indicators from 2009 to 2019 are expressed by Xi, Xi = (X1, X2, X3, X4) from 2009 to 2012 and Xi = (X1, X2, X3, X4, X5, X6, X7) from 2013 to 2019. The indicators’ descriptions and abbreviations are shown in Table 2.

2.2.2. Grey Relational Degree Calculation

  • Absolute Difference Sequence
To figure out the absolute difference Δ i , j between yij and xij in different regions [37,38,39]:
Δ i , j ( k ) = | y i j ( k ) x i j ( k ) |
where k denotes different provinces or provincial capitals, xij(k) denotes the corresponding value of each compared sequence for the i-th air quality indicator in the k-th provincial capital in the j-th year and yij(k) is the corresponding value of each reference sequence for the i-th inbound tourist arrivals indicator in the k-th province in the j-th year.
2.
Grey Relational Coefficient
Relevance is essentially the difference of geometric shapes between curves, so the difference between curves is taken as a measure of relational degree. For the reference sequence {yij(k)} and the comparison sequence {xij(k)}, the difference between each comparison curve and the reference curve in each region can be expressed by the following relationship [37,38,39].
ξ i , j ( k ) = min min | y i j ( k ) x i j ( k ) | + ρ max max | y i j ( k ) x i j ( k ) | | y i j ( k ) x i j ( k ) | + ρ max max | y i j ( k ) x i j ( k ) |
where ρ denotes the resolution coefficient. When ρ is smaller, the resolution function is larger, and ρ ∈ (0,1), is often taken as 0.5 [40], as in this study.
3.
Grey Relational Degree
Considering the large numbers of grey relational coefficients and the widely scattered information (which prohibits effective comparative analysis), we concentrated the relational coefficients by averaging as follows [37,38,39]:
r i , j = 1 N k = 1 N ξ i , j ( k )
where rij is the grey relational degree of comparison curve xi and reference curve yi. The larger the value of rij, the greater impact yi has on xi.
To calculate the grey relational degree, we take the number of inbound tourists as Yj, and ambient air quality or air pollutants as Xi in the 31 provinces in mainland China. Finally, the grey relational degree G(Yj, Xi) in the two periods (from 2009 to 2012 and from 2013 to 2019) was then computed using DPS9.01 software. We chose equalization to eliminate dimension [37,38,39].

3. Results and Discussion

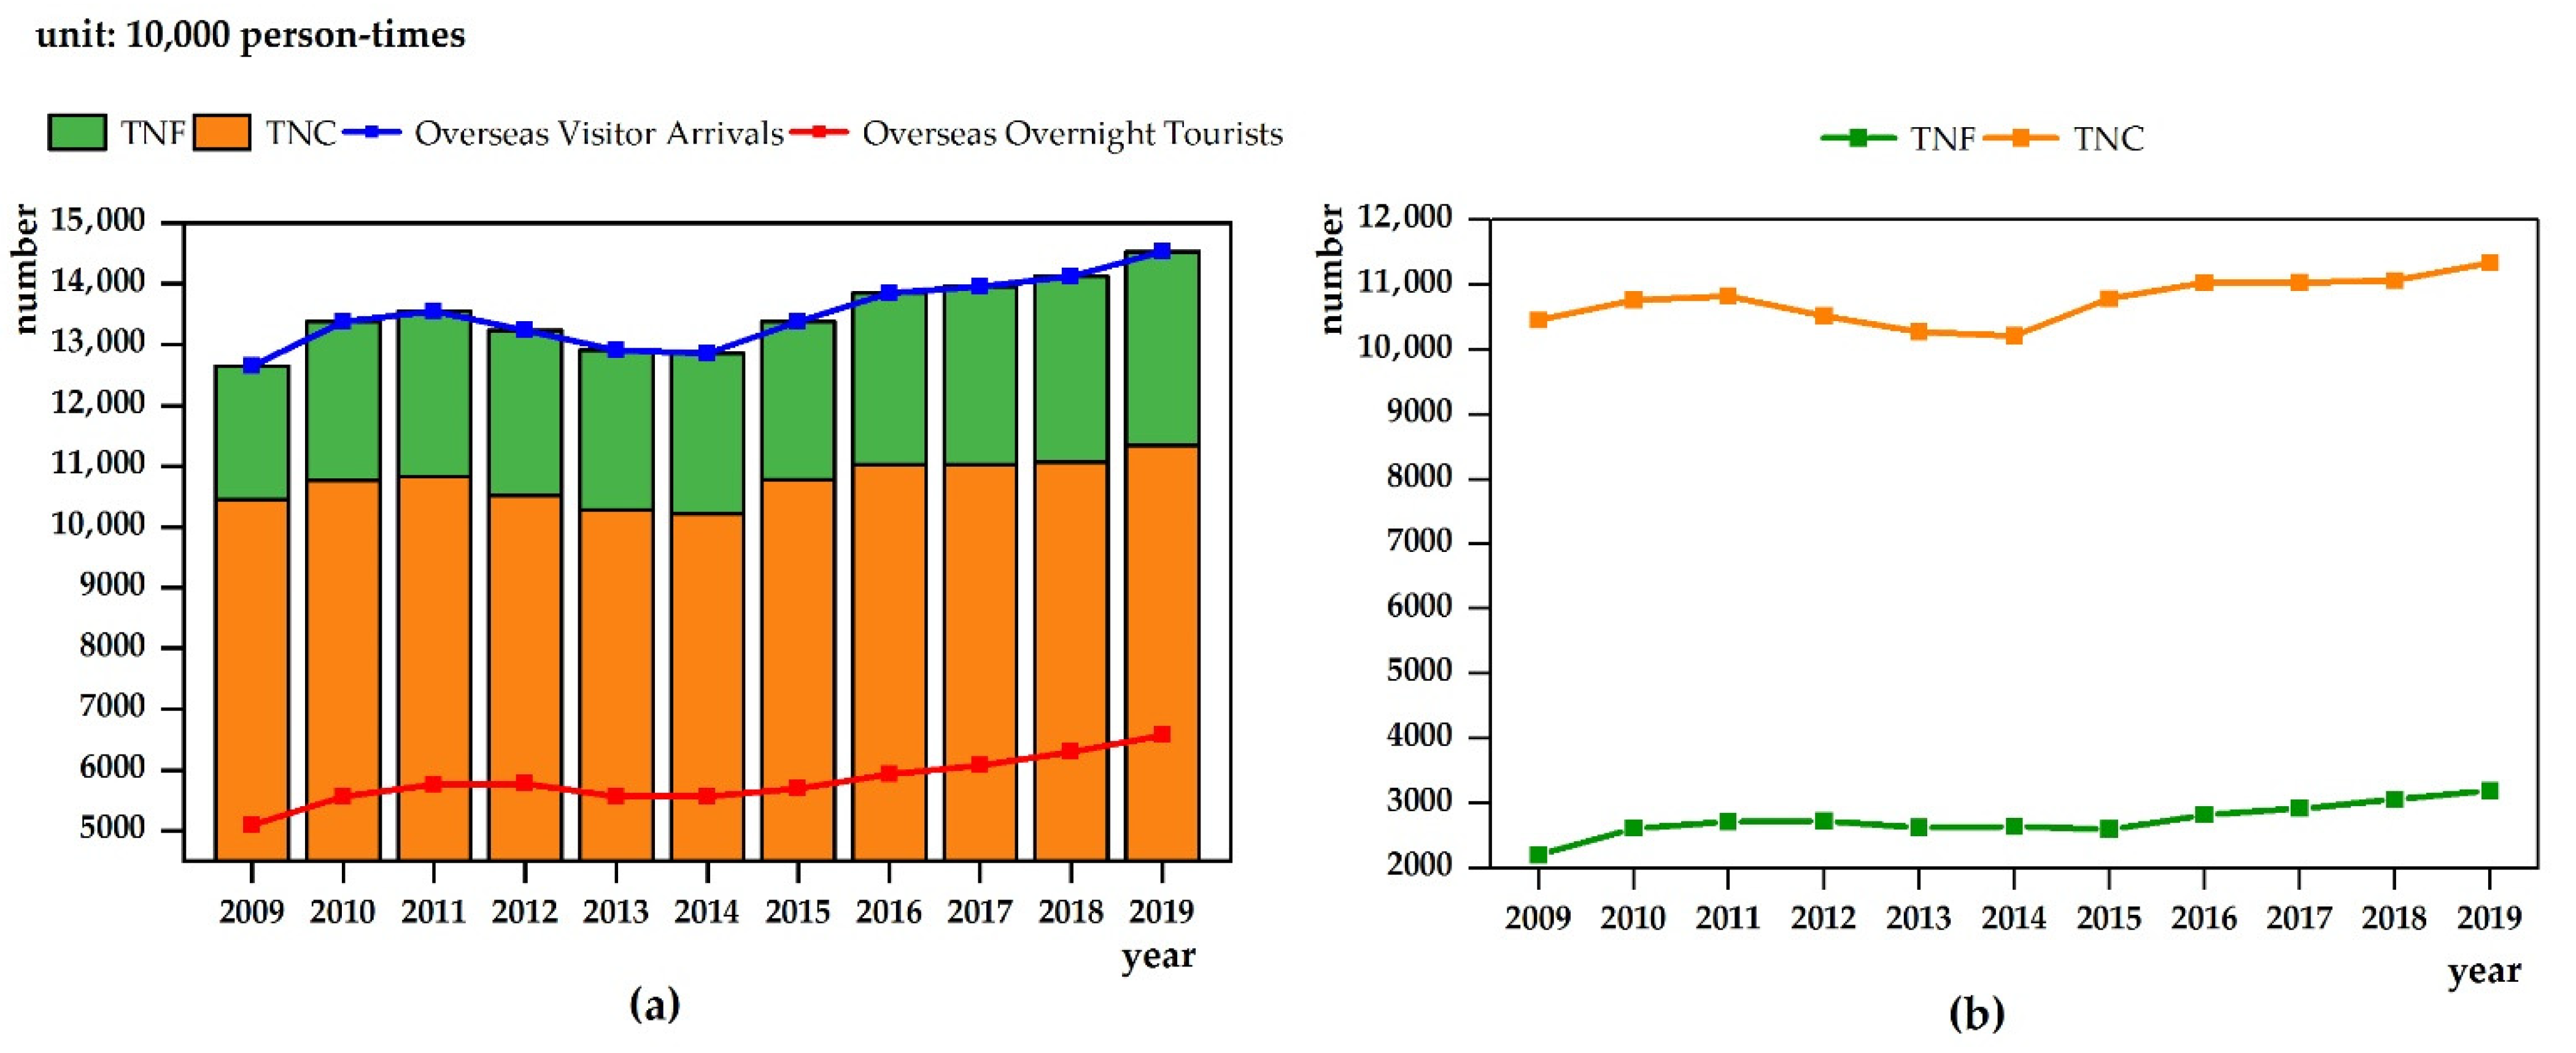
3.1. Changes in the Number of Inbound Tourists and in Ambient Air Quality

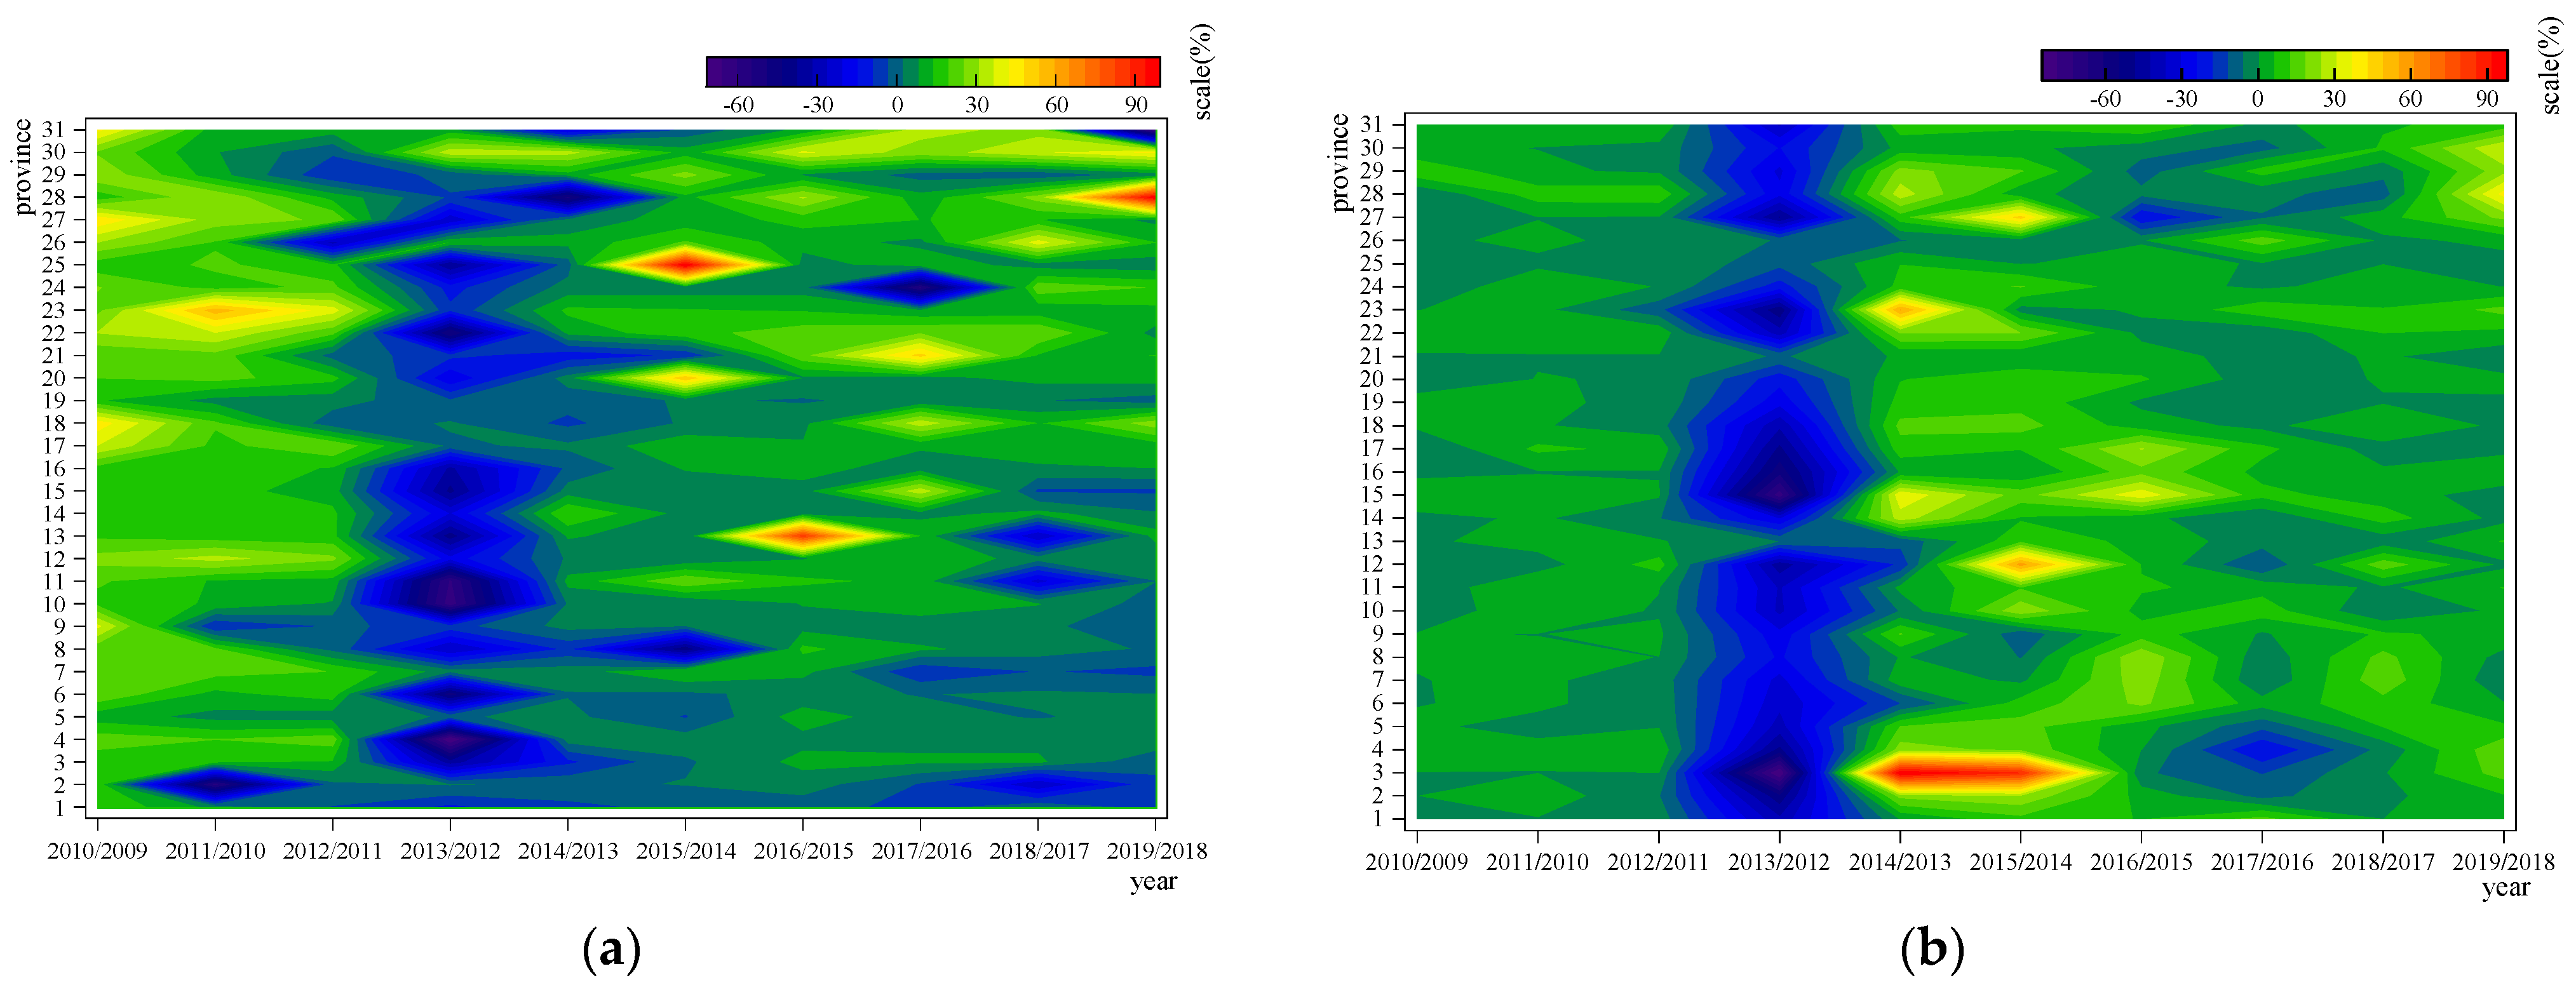
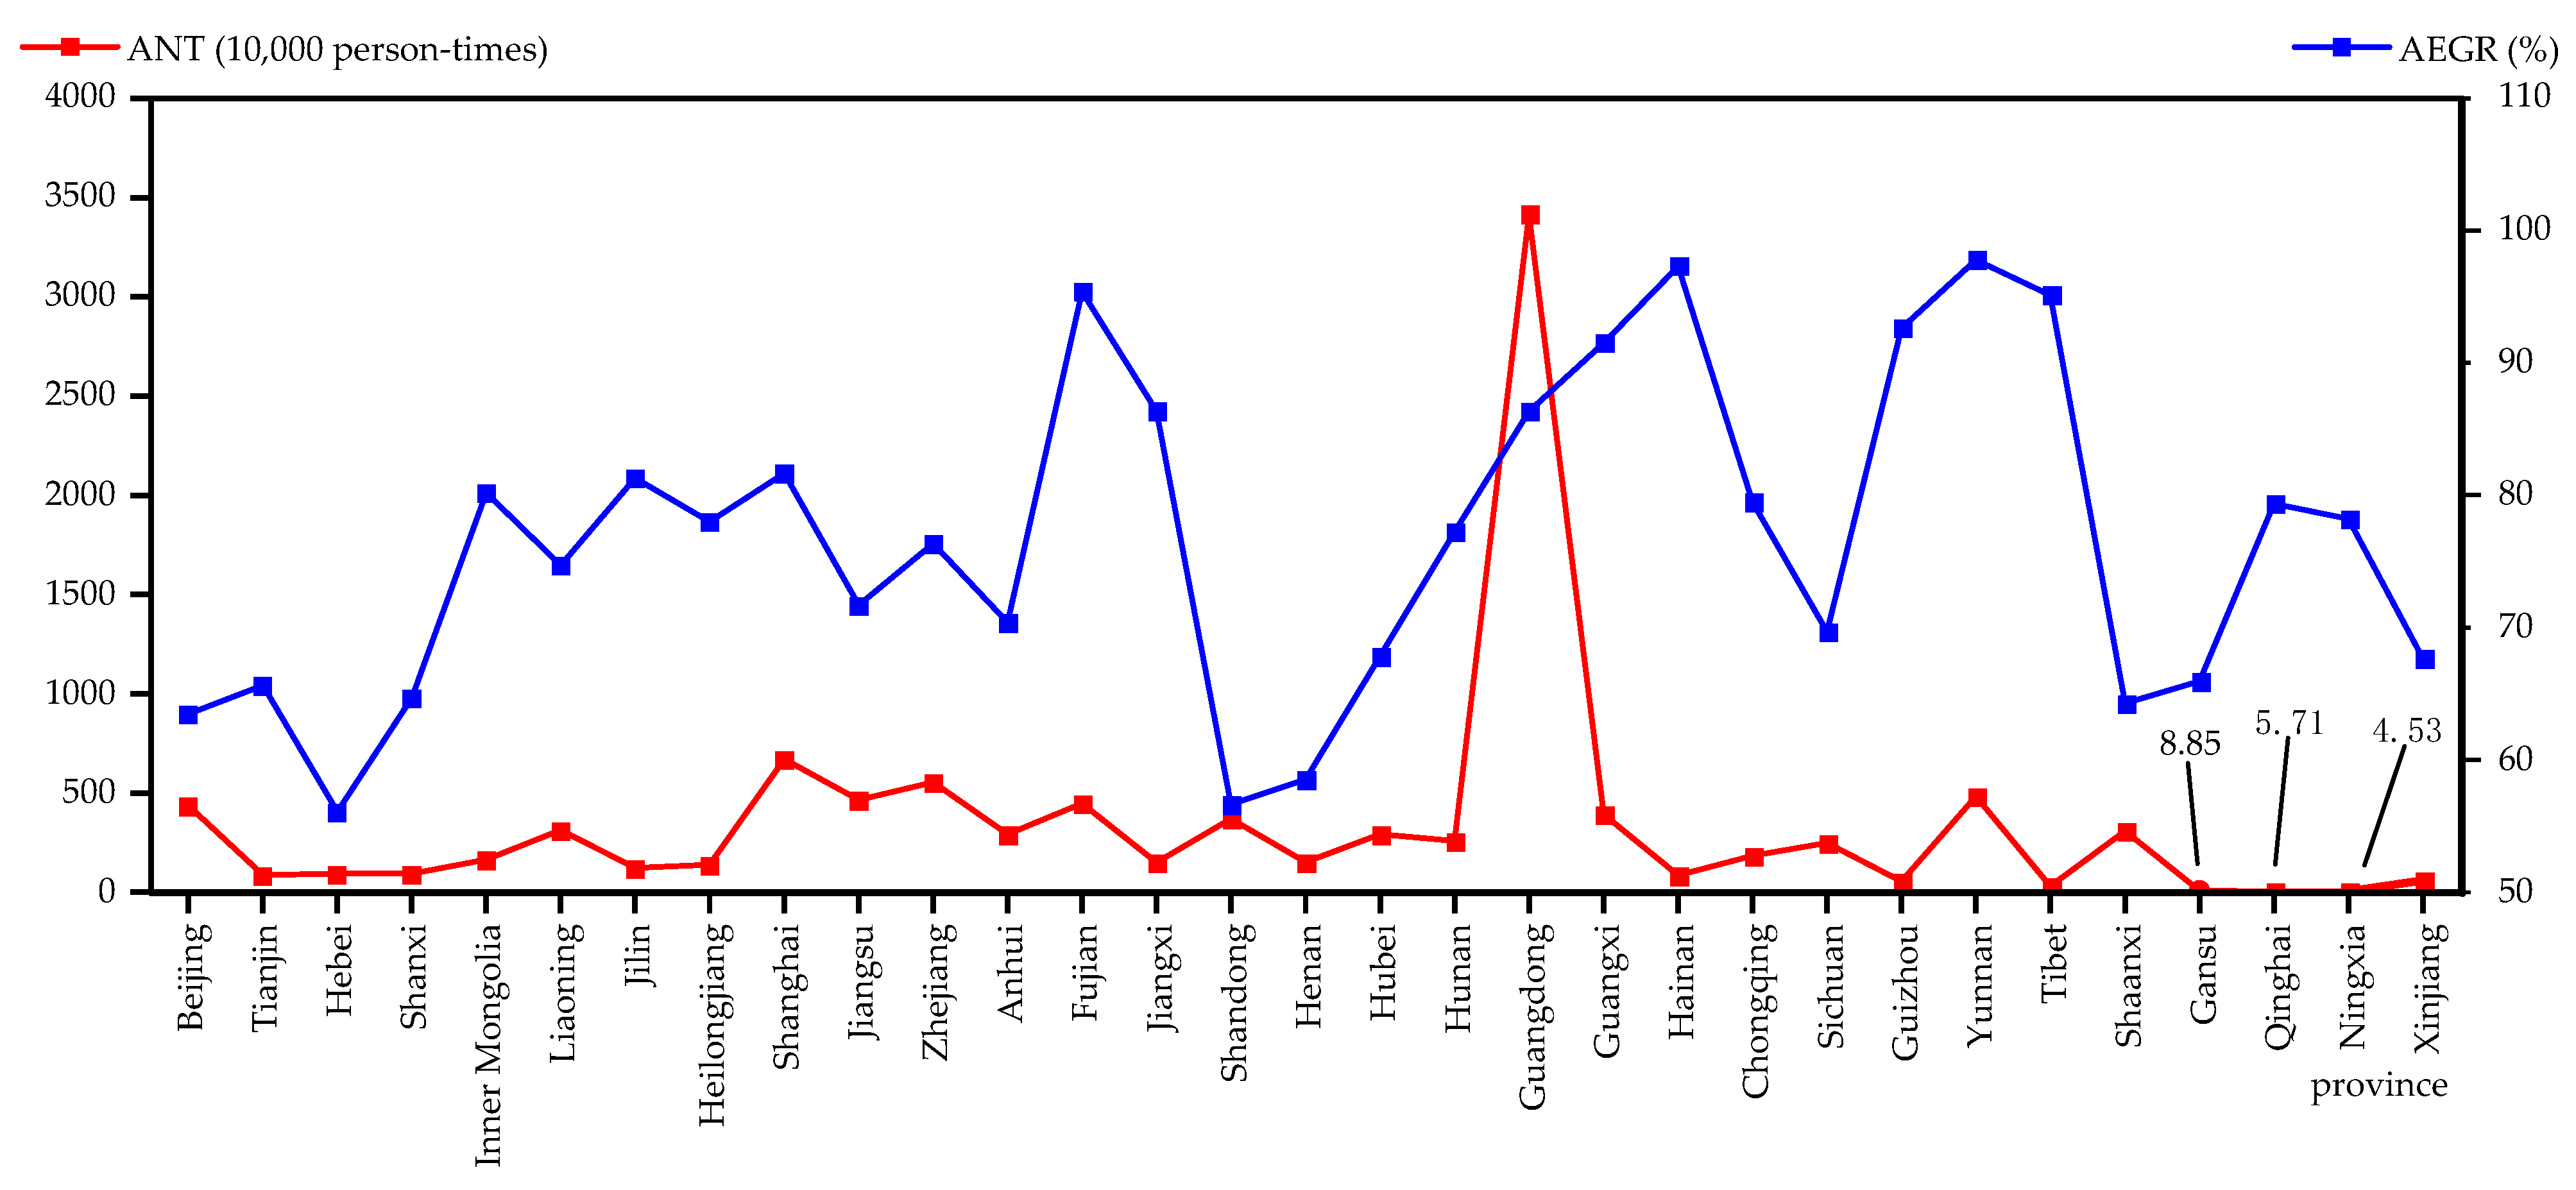
3.1.1. Changes in the Number of Inbound Tourists in Chinese Provinces

From 2009 to 2019, the number of inbound tourists and overnight tourists in China showed a consistent trend, with an annual average of overnight tourists accounting for 43.04% of the total number of inbound tourists received, as shown in Figure 1a. Evidently, the number of inbound tourists rose between 2009 to 2011, and declined from 2011 to 2014. We also noted related decline of inbound overnight tourists from 2012 to 2014 but with a one-year lag. From 2014 to 2016, the number of inbound tourists rose rapidly, and similarly, the number of overnight tourists also rose progressively from 2014, both peaking in 2019. The detailed changes in the number of inbound tourists and overnight tourists in China from 2009 to 2019 are shown in Table 3, and we note a larger rate of change of the overnight tourists than that of inbound tourists.
In Figure 1b, TNC shows more fluctuation than TNF, especially during 2012–2015, and is approximately 4 times as much as TNF.
Generally, according to year-to-year changes, the number of inbound overnight tourists showed a positive growth from 2009 to 2012 and from 2014 to 2019 and a negative growth from 2012 to 2014, especially from 2012 to 2013 when inbound tourism fell into a downturn, as shown in Figure 2a.

3.1.2. Changes in Ambient Air Quality in Provincial Capitals

From 2009 to 2019, there were slight changes of EGR in the 31 provincial capitals. Notably, from 2012 to 2014, there was a negative change, especially between 2012–2013 when the EGR in 31 provincial capitals decreased significantly, while the rest of the years mainly exhibited a positive change (Figure 2b).
As is shown in Figure 3, from 2009 to 2019, the trend of EGR and the annual number of inbound tourists in China’s 31 provinces are relatively consistent. Apart from Guangdong, which receives most of its inbound tourists from HK and MO (due to its special geographic, economic and political position), other regions with good air quality generally tend to receive more inbound tourists. On the contrary, regions with poor air quality receive fewer inbound tourists.
It is evident that the changes of air quality in the 31 provinces from 2009 to 2019 have a certain impact on the changes of inbound tourists, particularly the inter-provincial differences of inbound tourists, as there are differences in the comparative advantages of inbound tourism in terms of ambient air quality. However, inbound tourists in provinces with different EGR need further analysis. Although there are obvious spatial differences in the impact of economic extroversion, tourism resources and geographical distance on inbound tourism among the provinces, the change of ambient air quality has a more direct impact, for instance, the decline of China’s ambient air quality from 2013 to 2014, the overall decline of the number of inbound tourists in China, as well as the improvement of ambient air quality from 2009 to 2012 and from 2015 to 2019 and the corresponding increase in the number of inbound tourists in China. Therefore, the grey relational analysis method was used in this study to explore the impact of China’s ambient air quality changes on inbound overnight tourists from 2009 to 2019 and the inter-provincial impact differences among the 31 provinces.

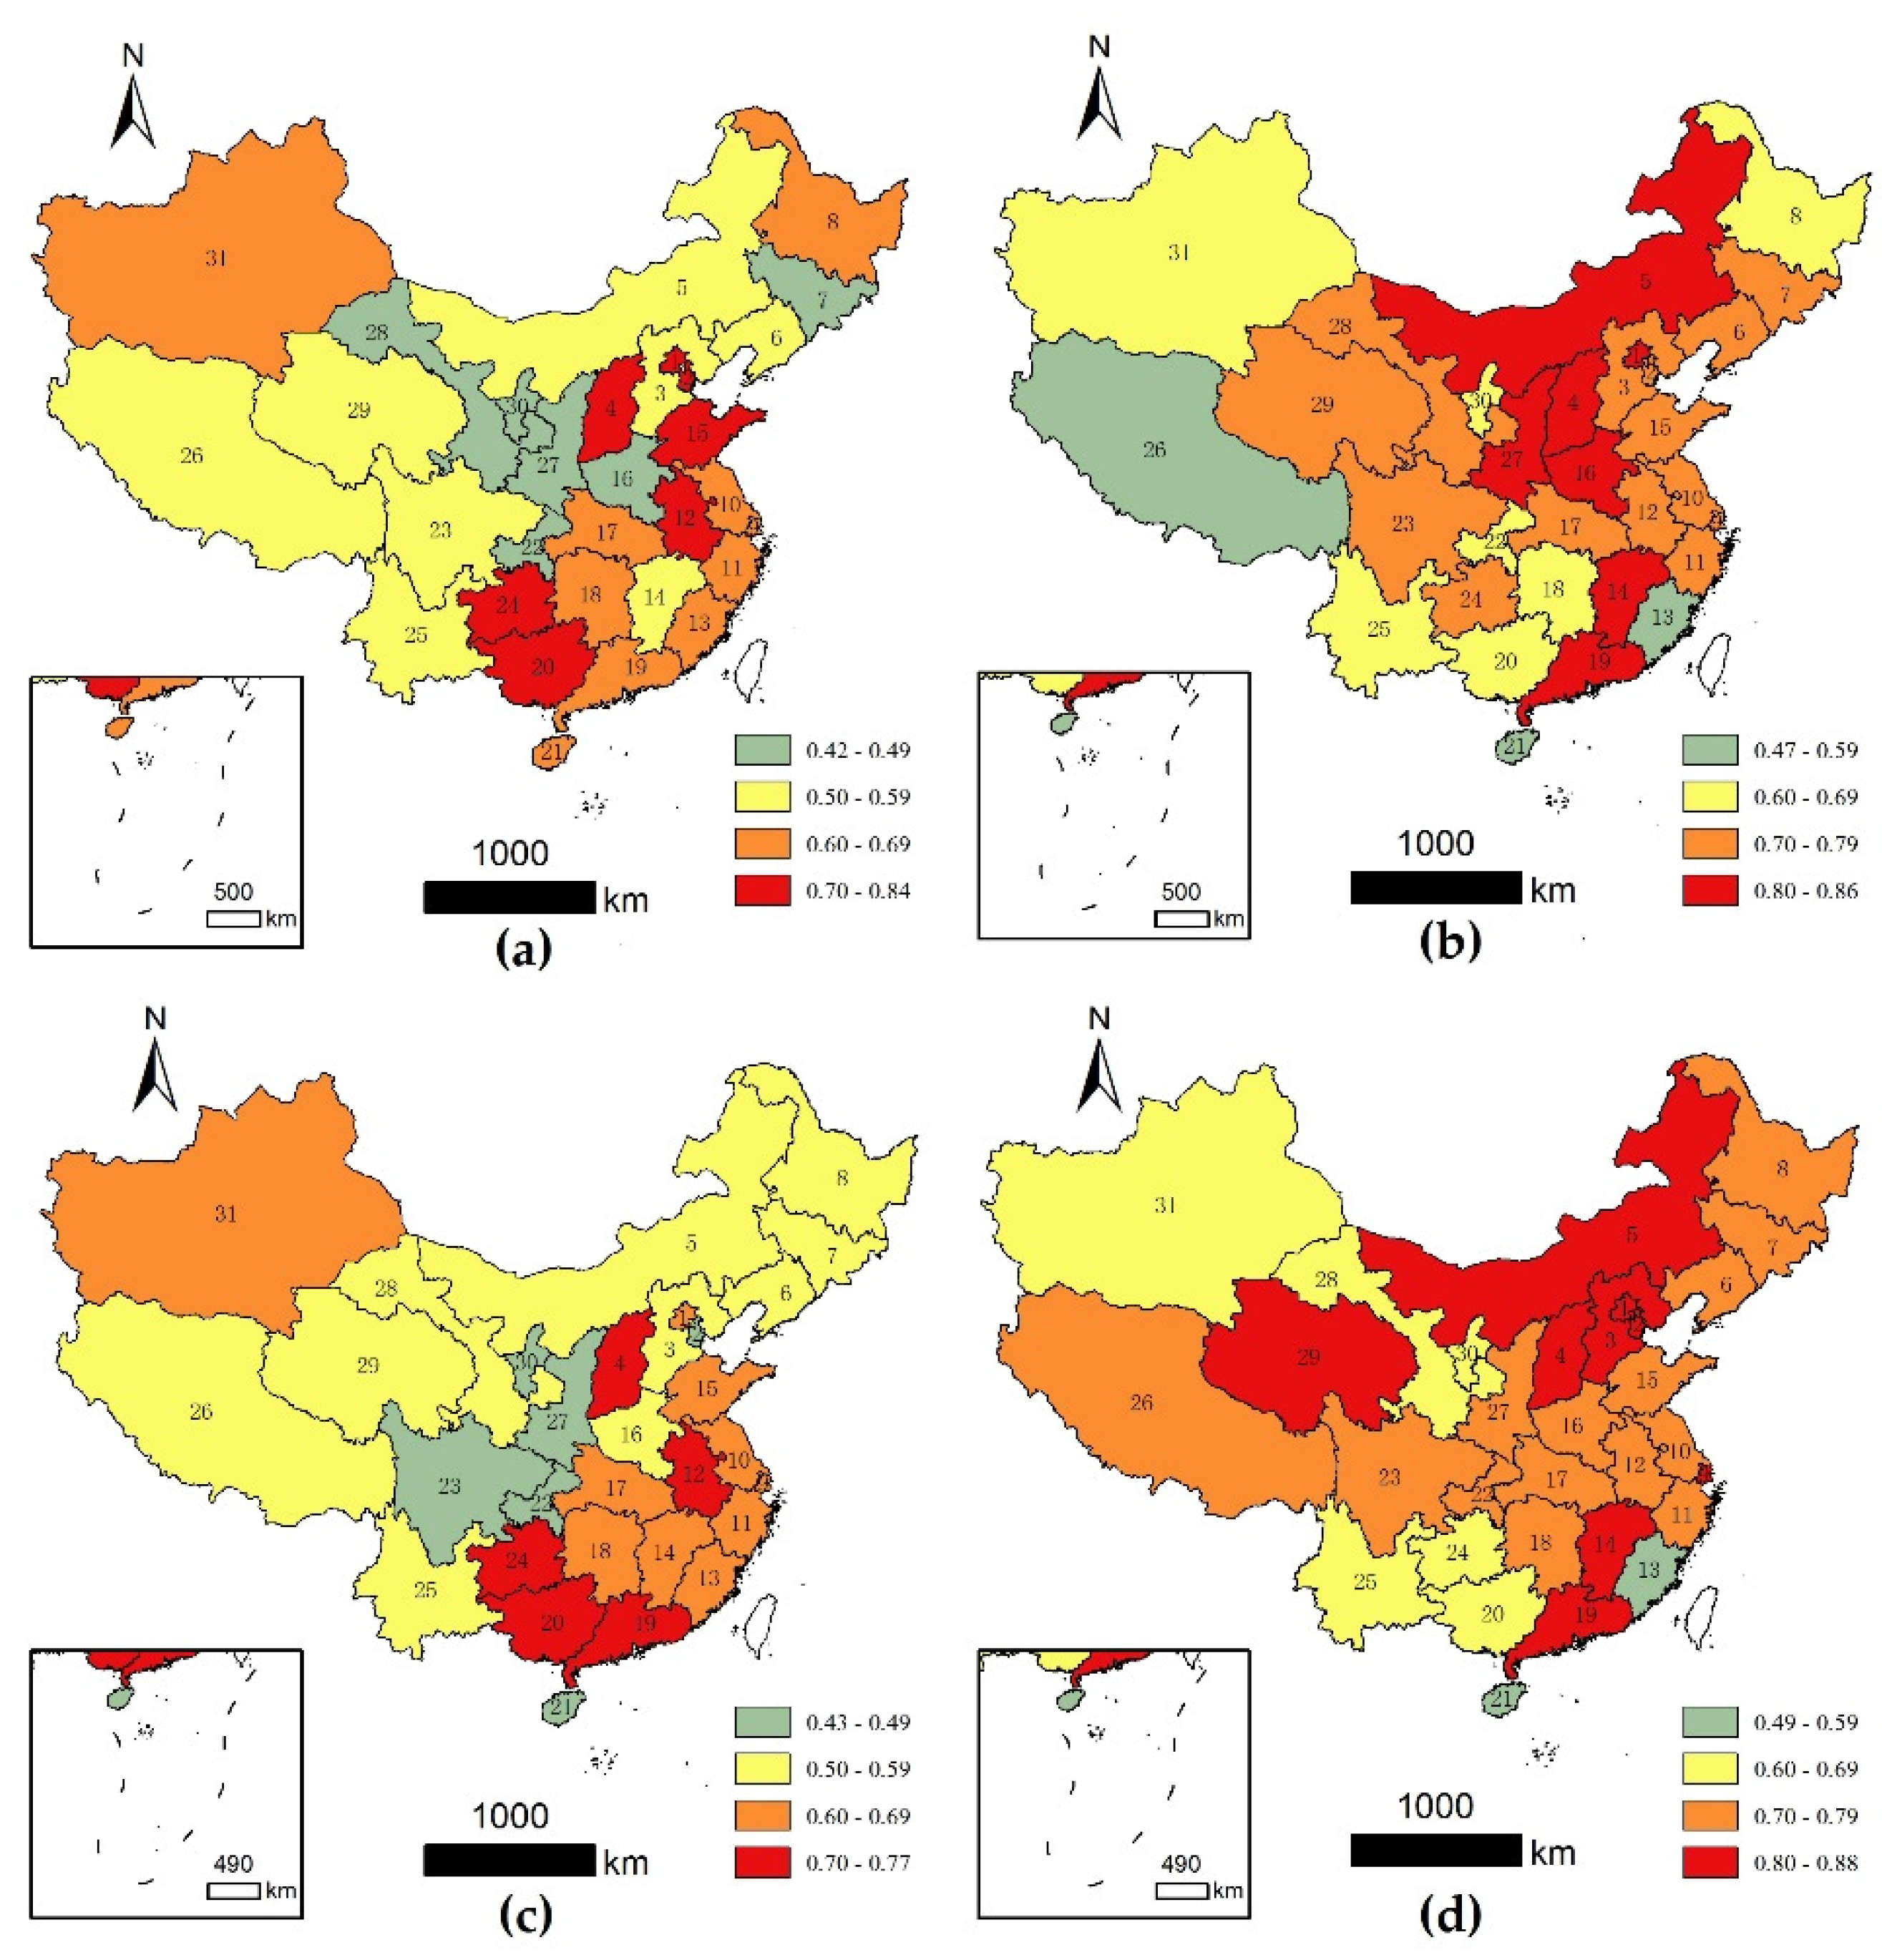
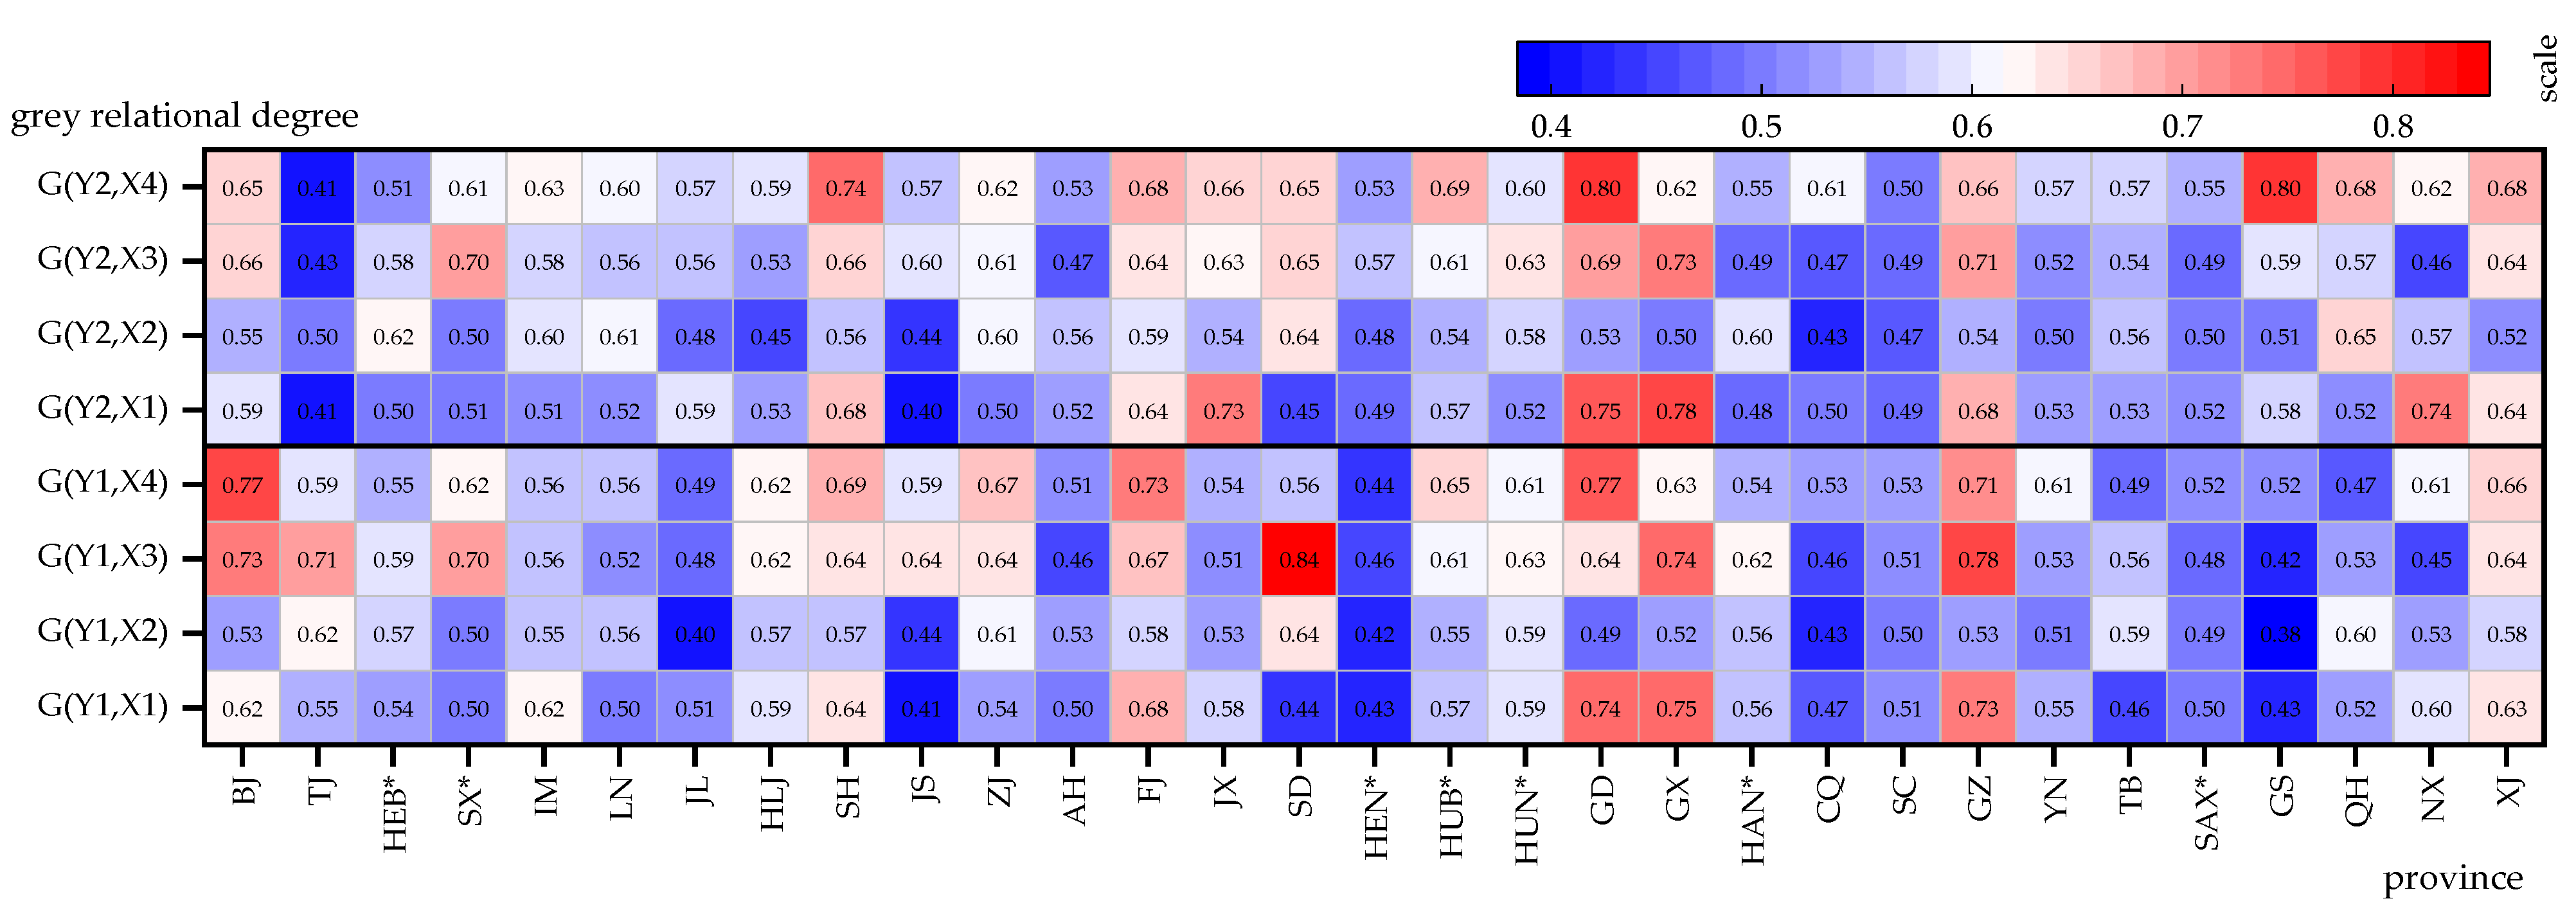
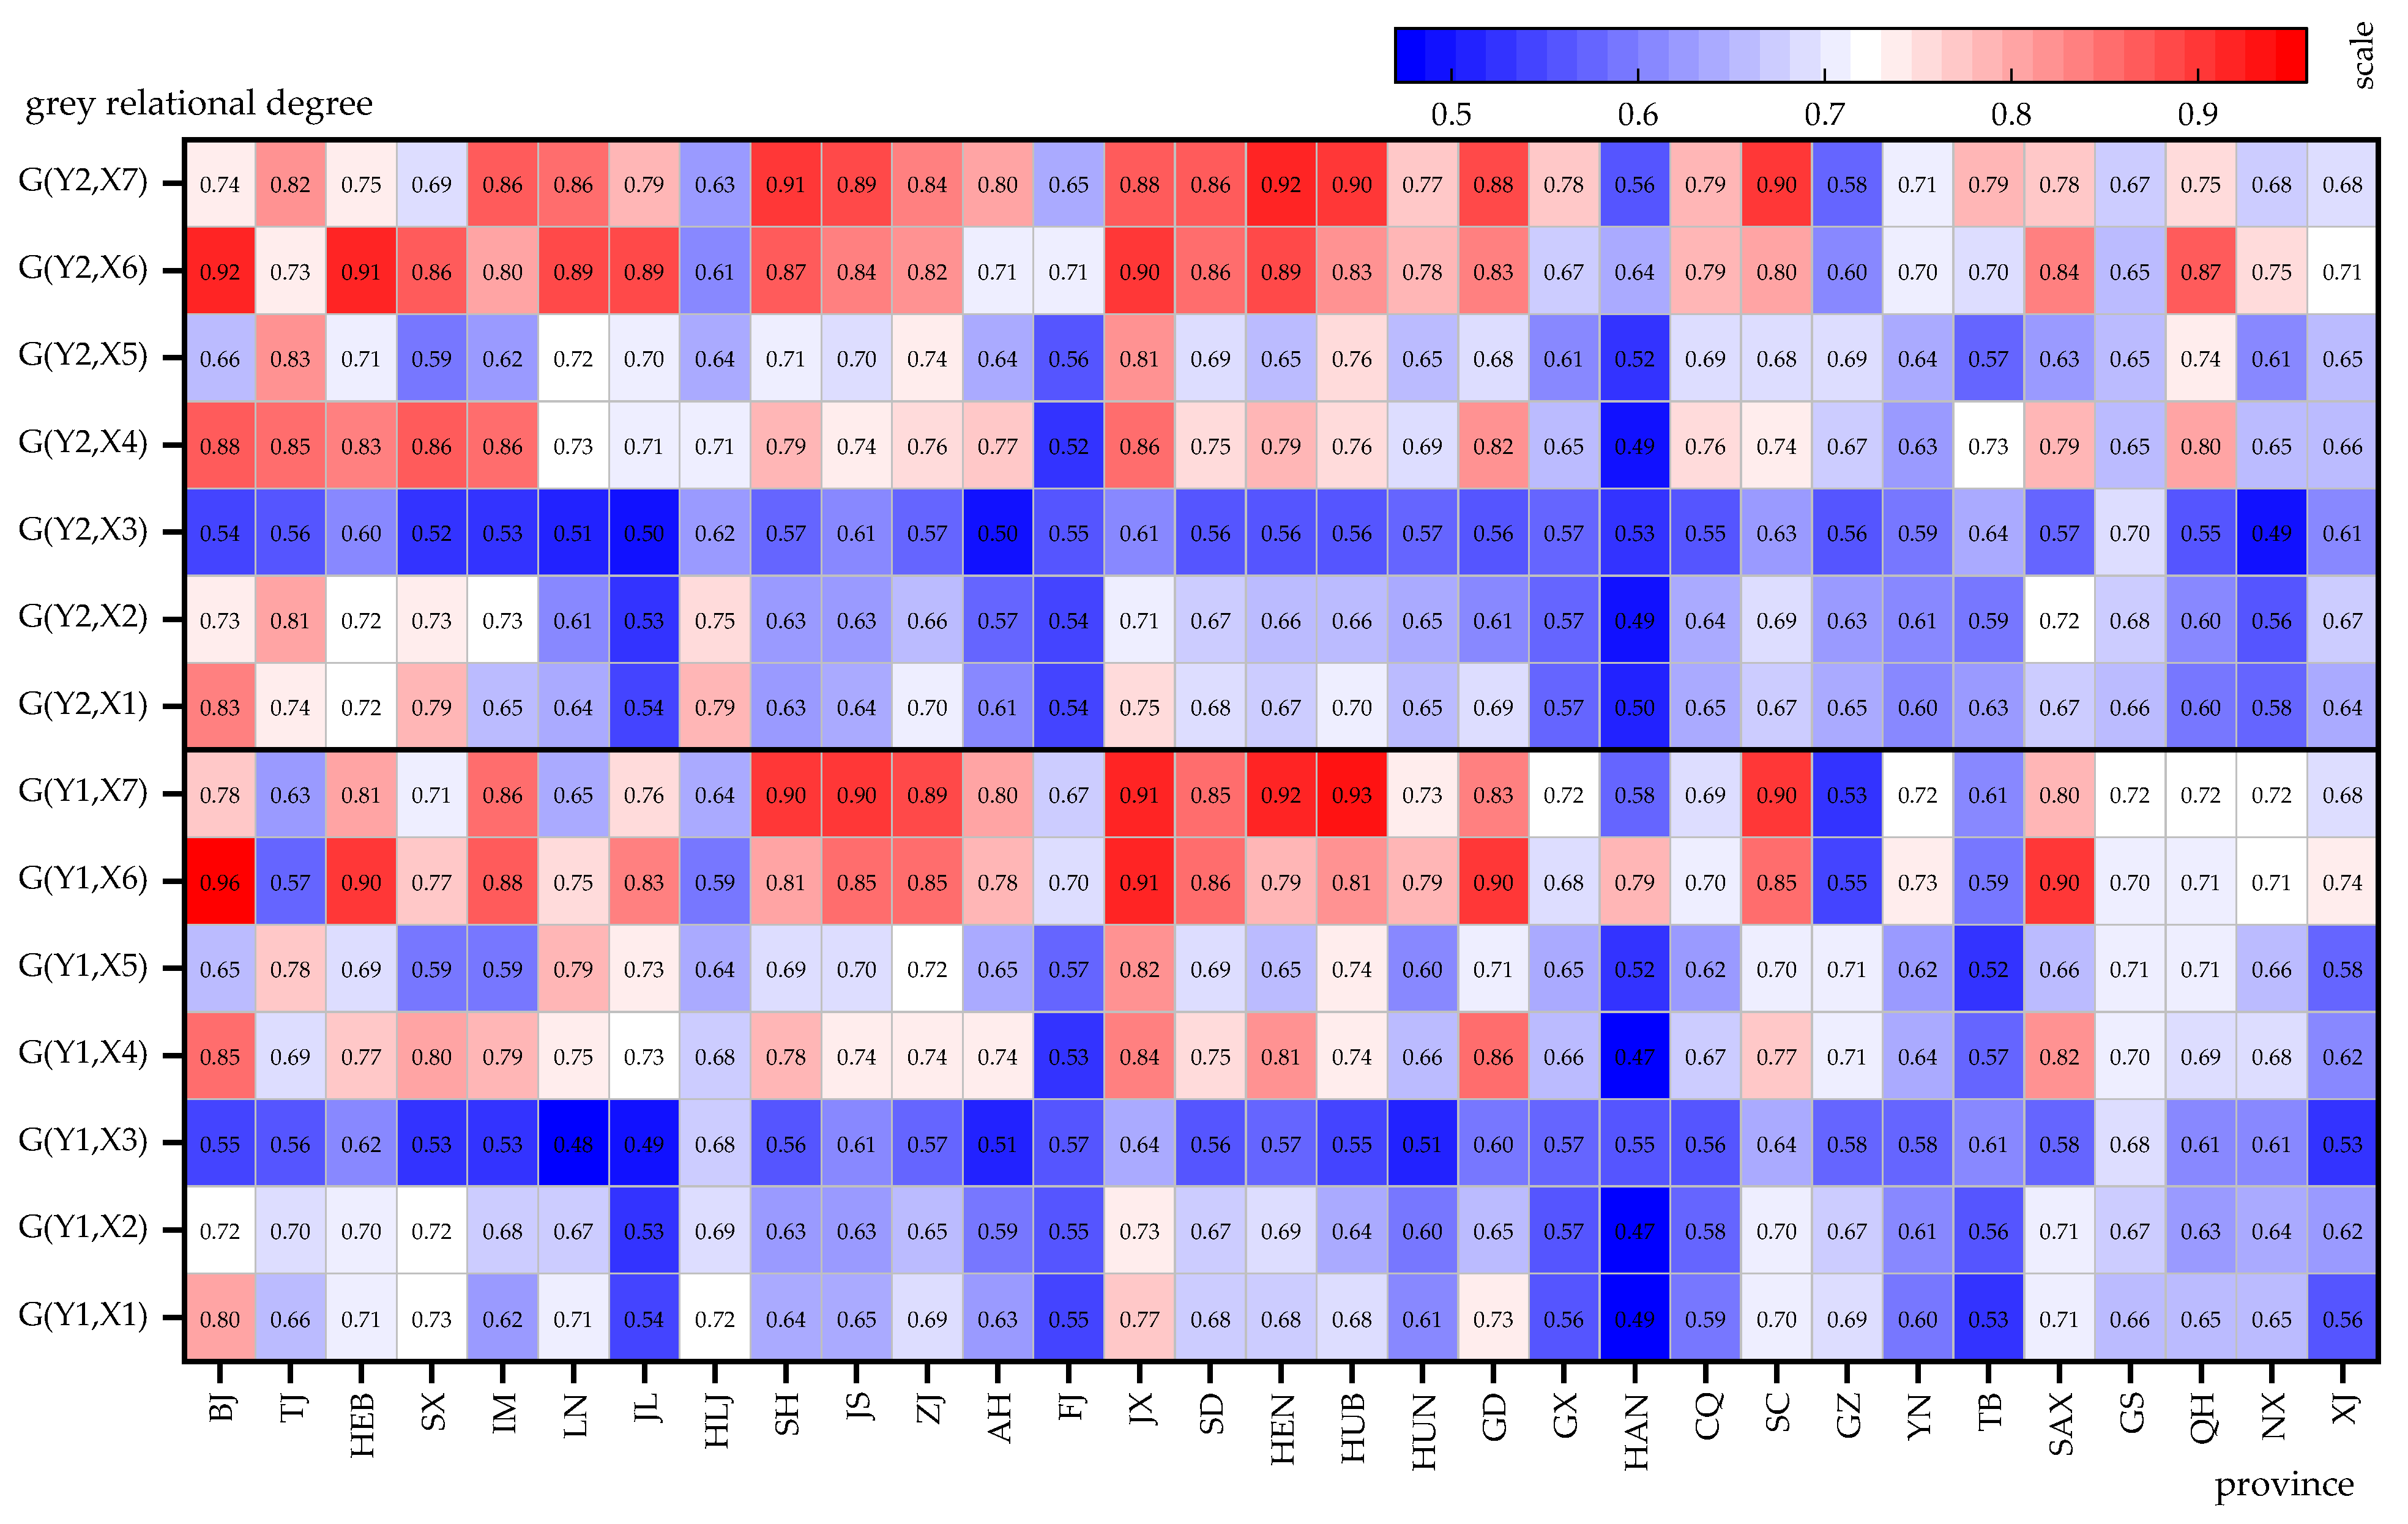
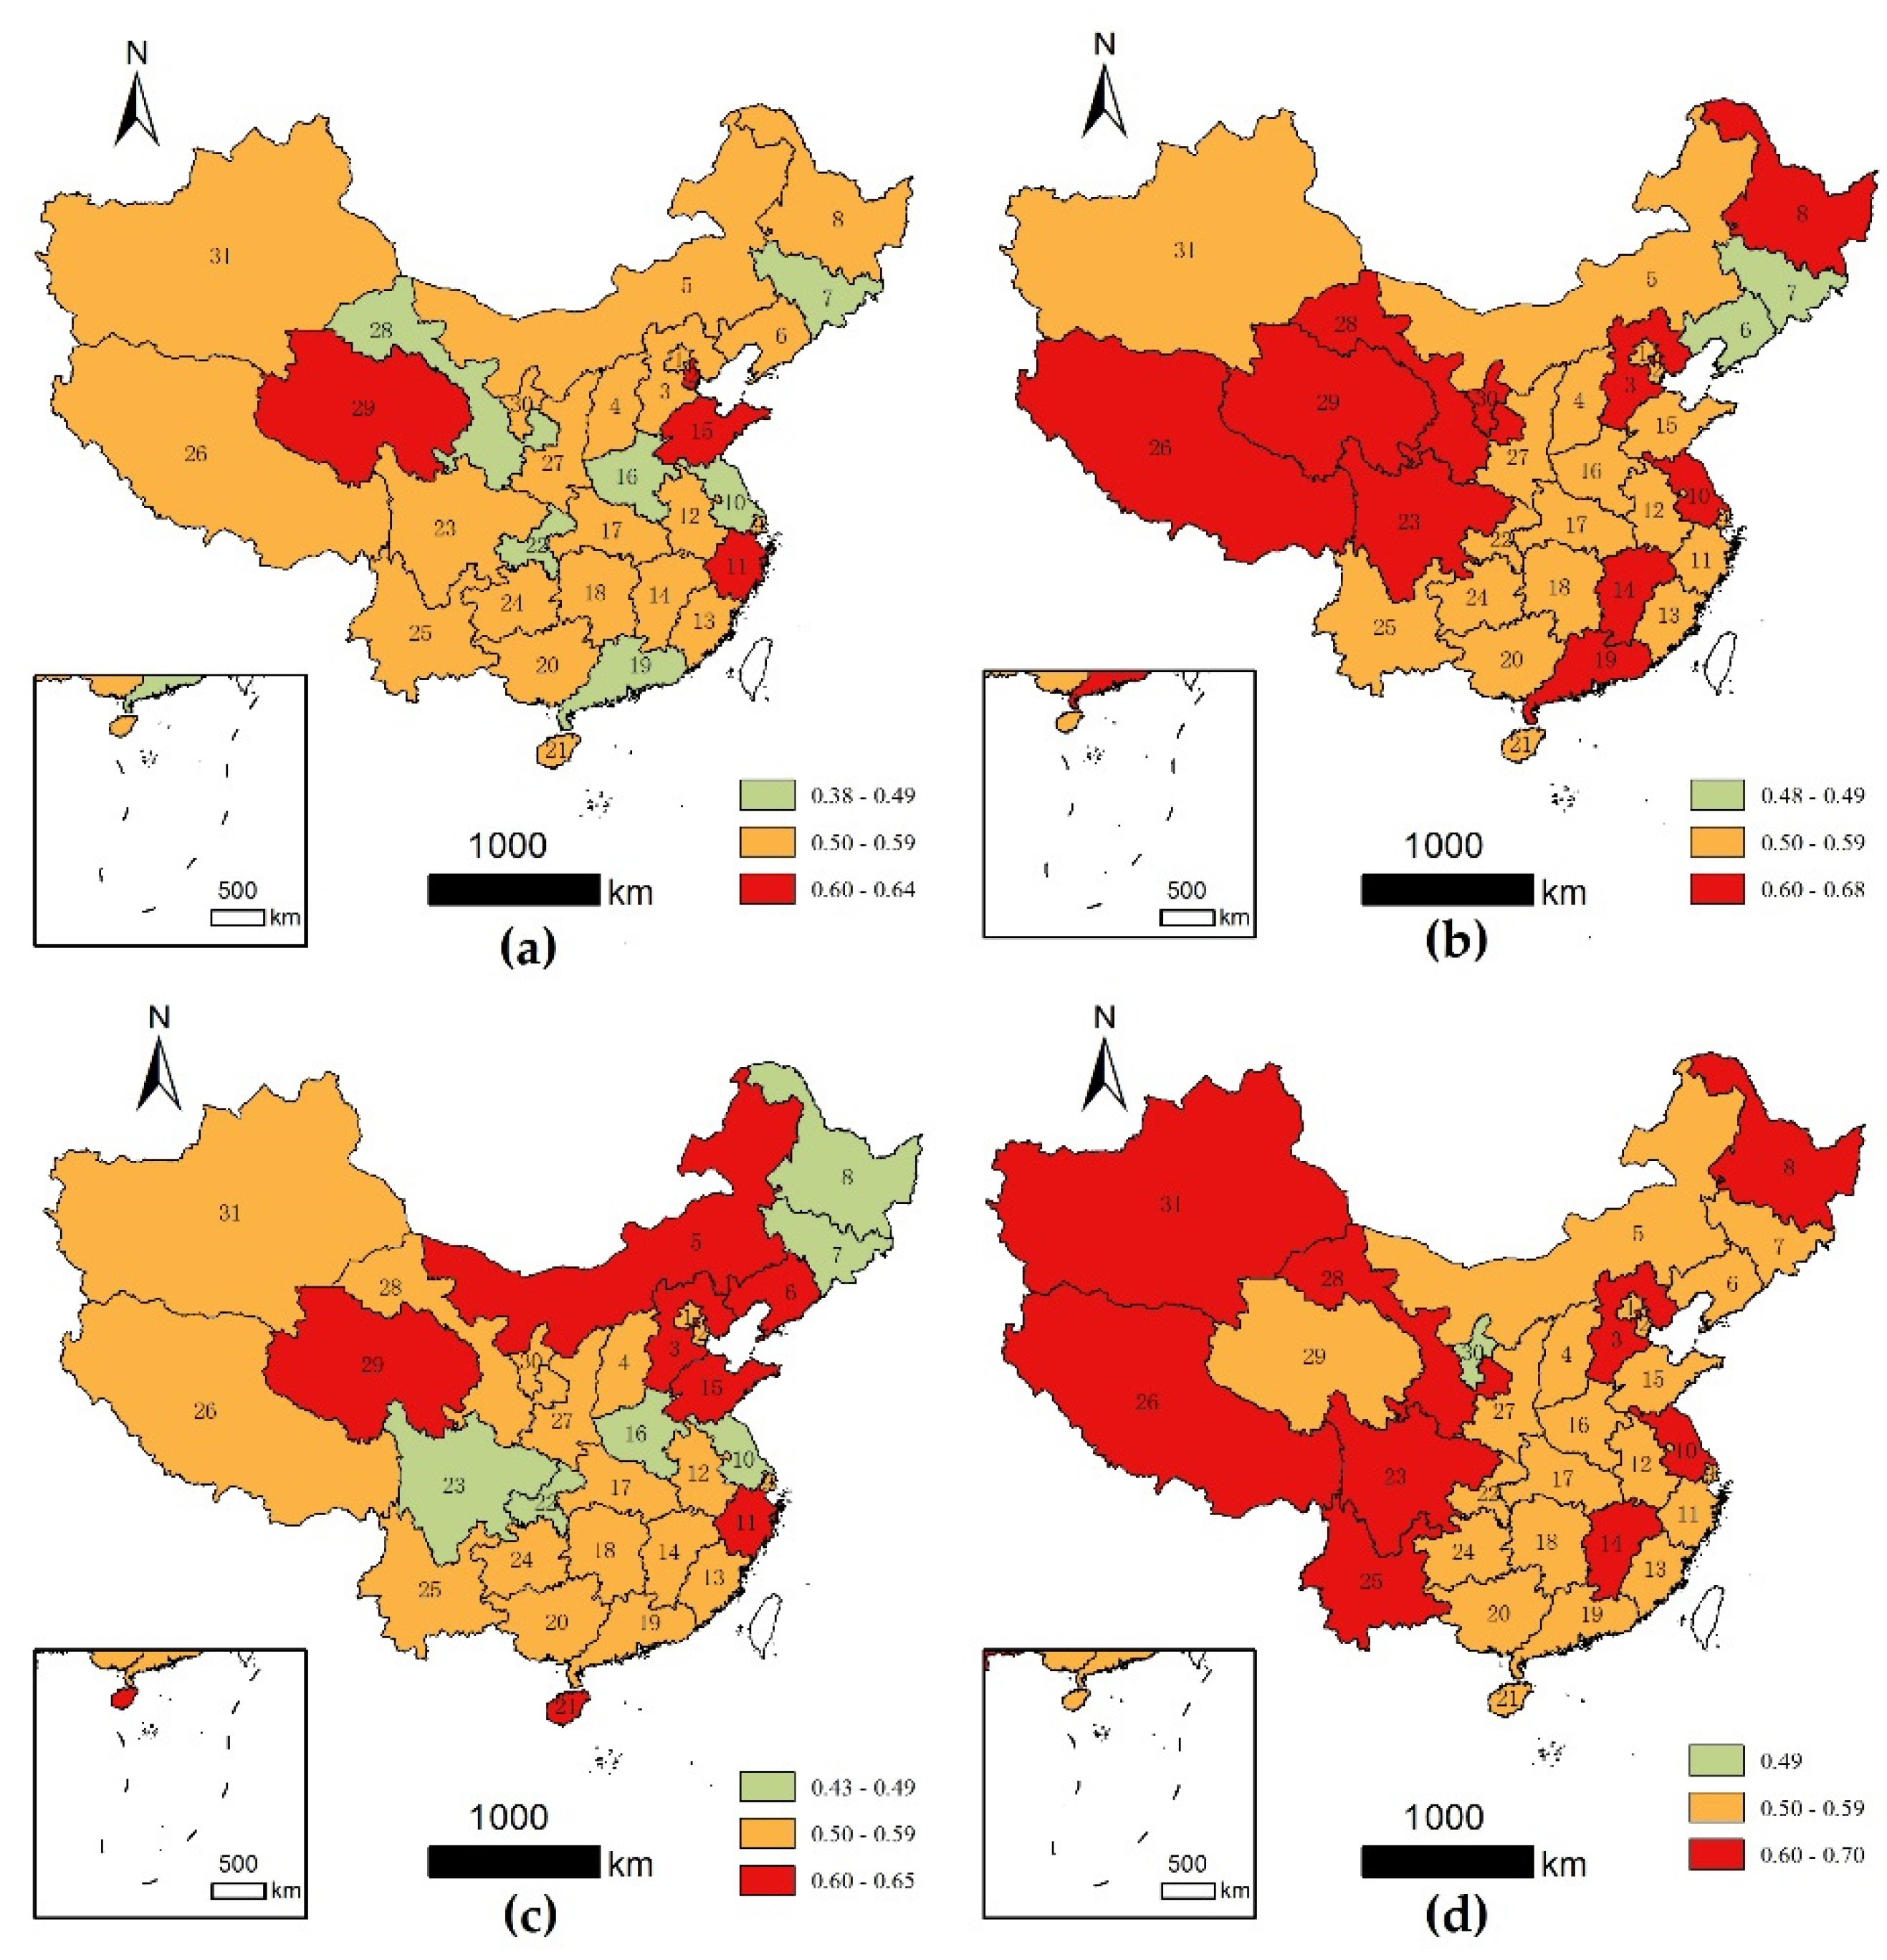
3.2. Grey Relational Degree between the Number of Inbound Tourists and Air Quality

The results of grey relational degree in 31 provinces are shown in Figure 4 and Figure 5. A grey relational degree over 0.5 denotes that a certain relationship exists, and the closer a value to 1, the larger the relational degree; thus, a close relationship exists between observation indicators. Generally, the grey relational degree between indicators is more than 0.5, which indicates that a relationship exists between the number of inbound tourists and the change of ambient quality. Evidently, the grey relational degree from 2009 to 2012 (0.4–0.8) is relatively lower than that from 2013 to 2019 (0.5–0.9). In addition, we noted consistency between the degree of grey relationship between NCT and air quality and between NFT and air quality.
Table 4 shows the grey relational degree order of each air quality indicator to inbound tourists indicating the relative importance degree in the impact, and No. 1 plays a dominant role. It is clear that each province shows a different order, which means the different provinces’ change of inbound tourist arrivals varies by different air quality indicators. NCT and NFT show a certain consistency in some provinces. For instance, between 2009 to 2012 it is high in Shanxi, Liaoning, Jilin, Jiangsu, Zhejiang, Anhui, Henan, Hubei, Guangdong, Guangxi, Chongqing, Sichuan, Guizhou, Yunnan, Shaanxi and Xinjiang, and from 2013 to 2019 in Beijing, Shanxi, Shanghai, Jiangsu, Zhejiang, Fujian, Jiangxi, Sichuan and Xinjiang (denoted by “*” in Table 4). In-depth analysis can be found in Section 3.2 and Section 3.3.

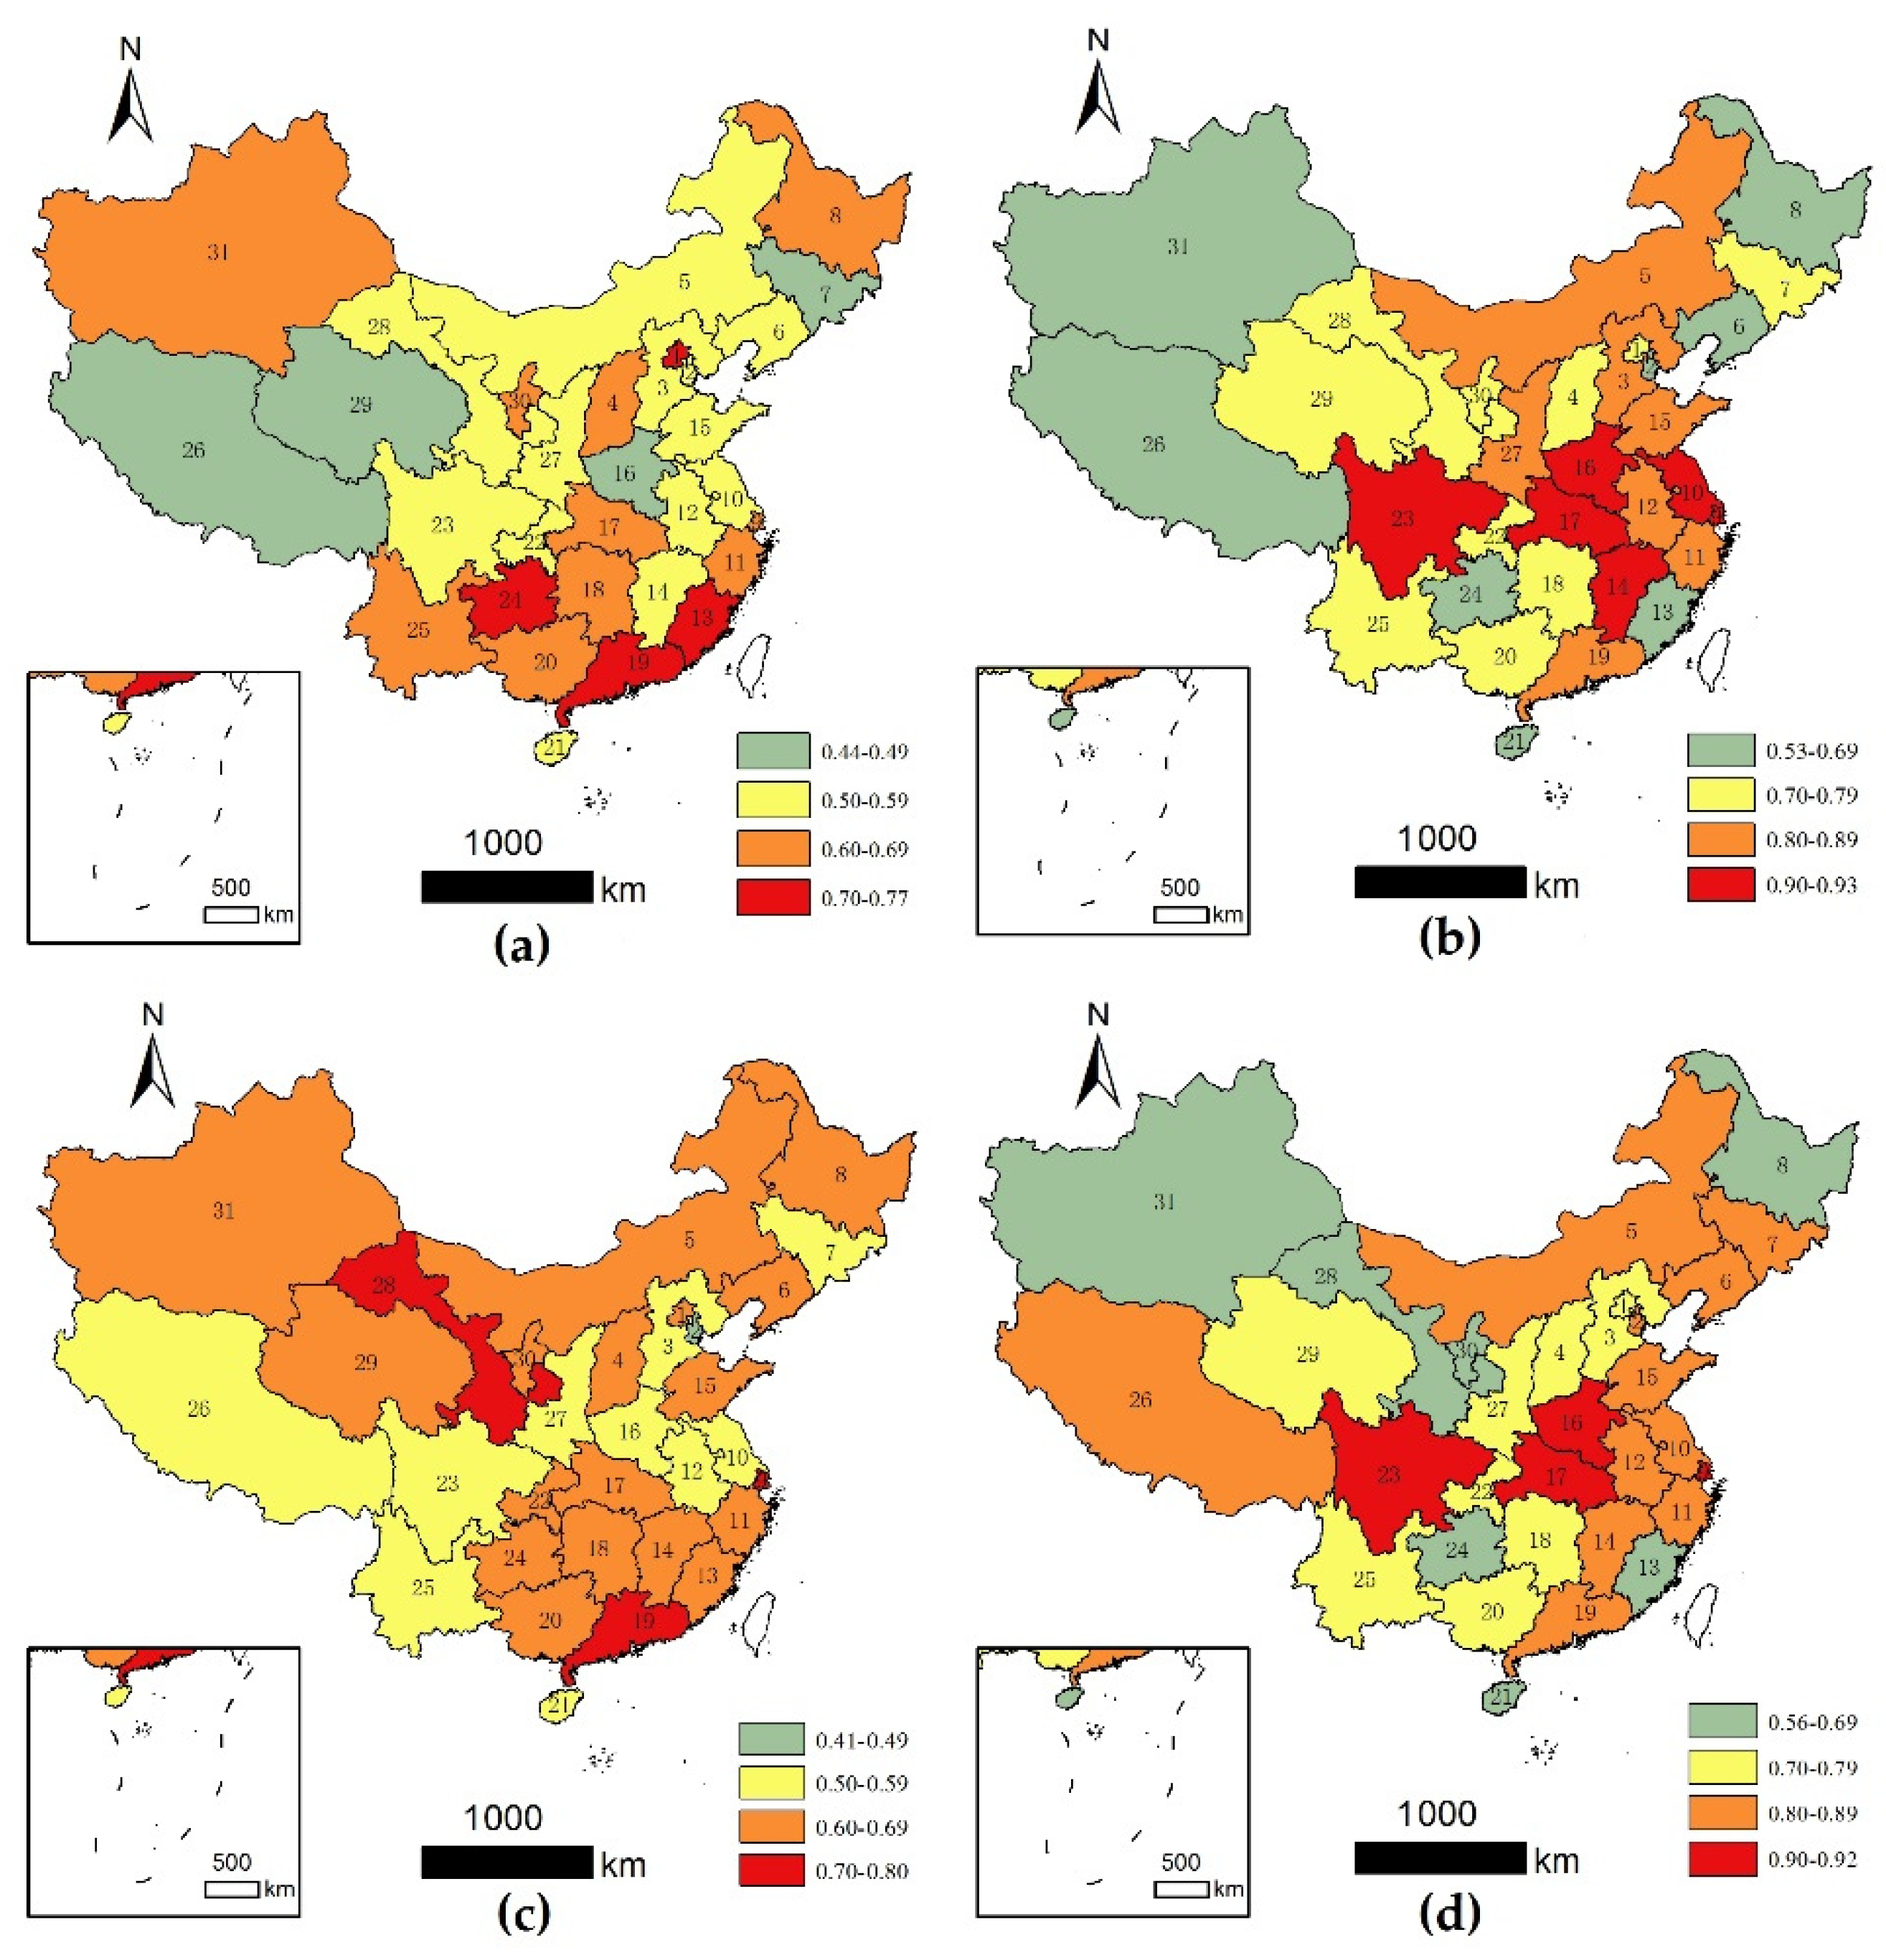
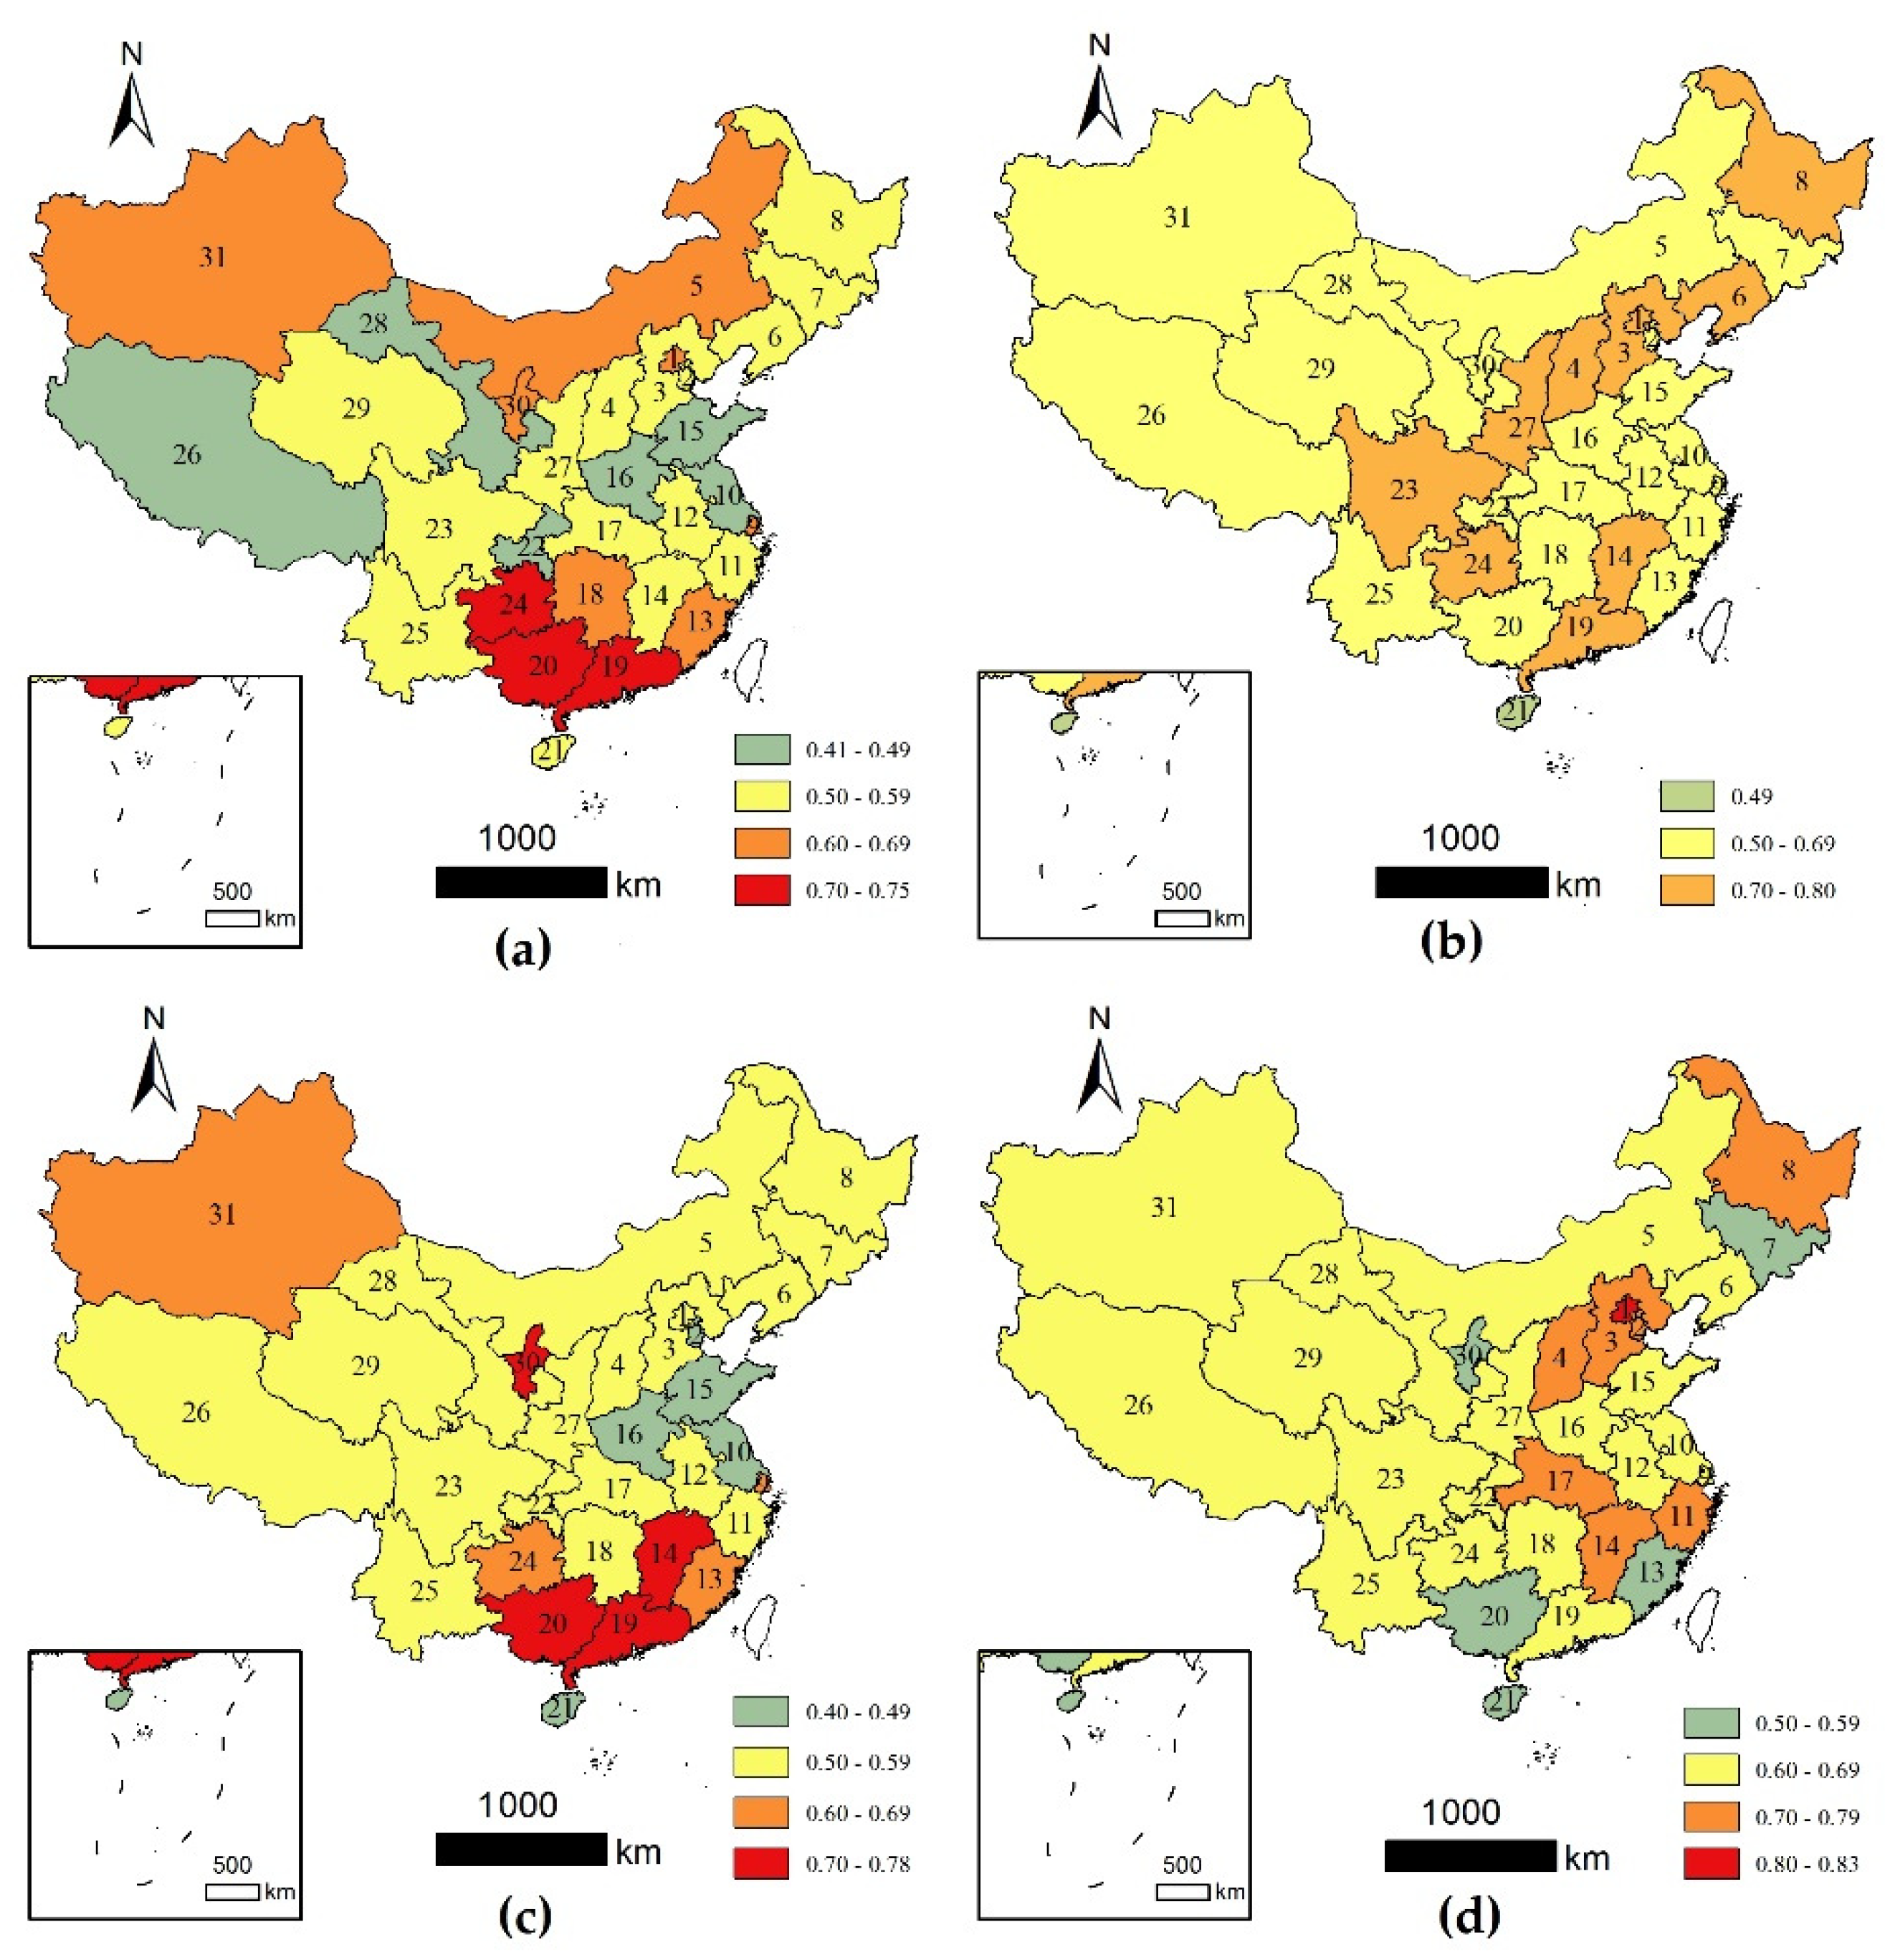
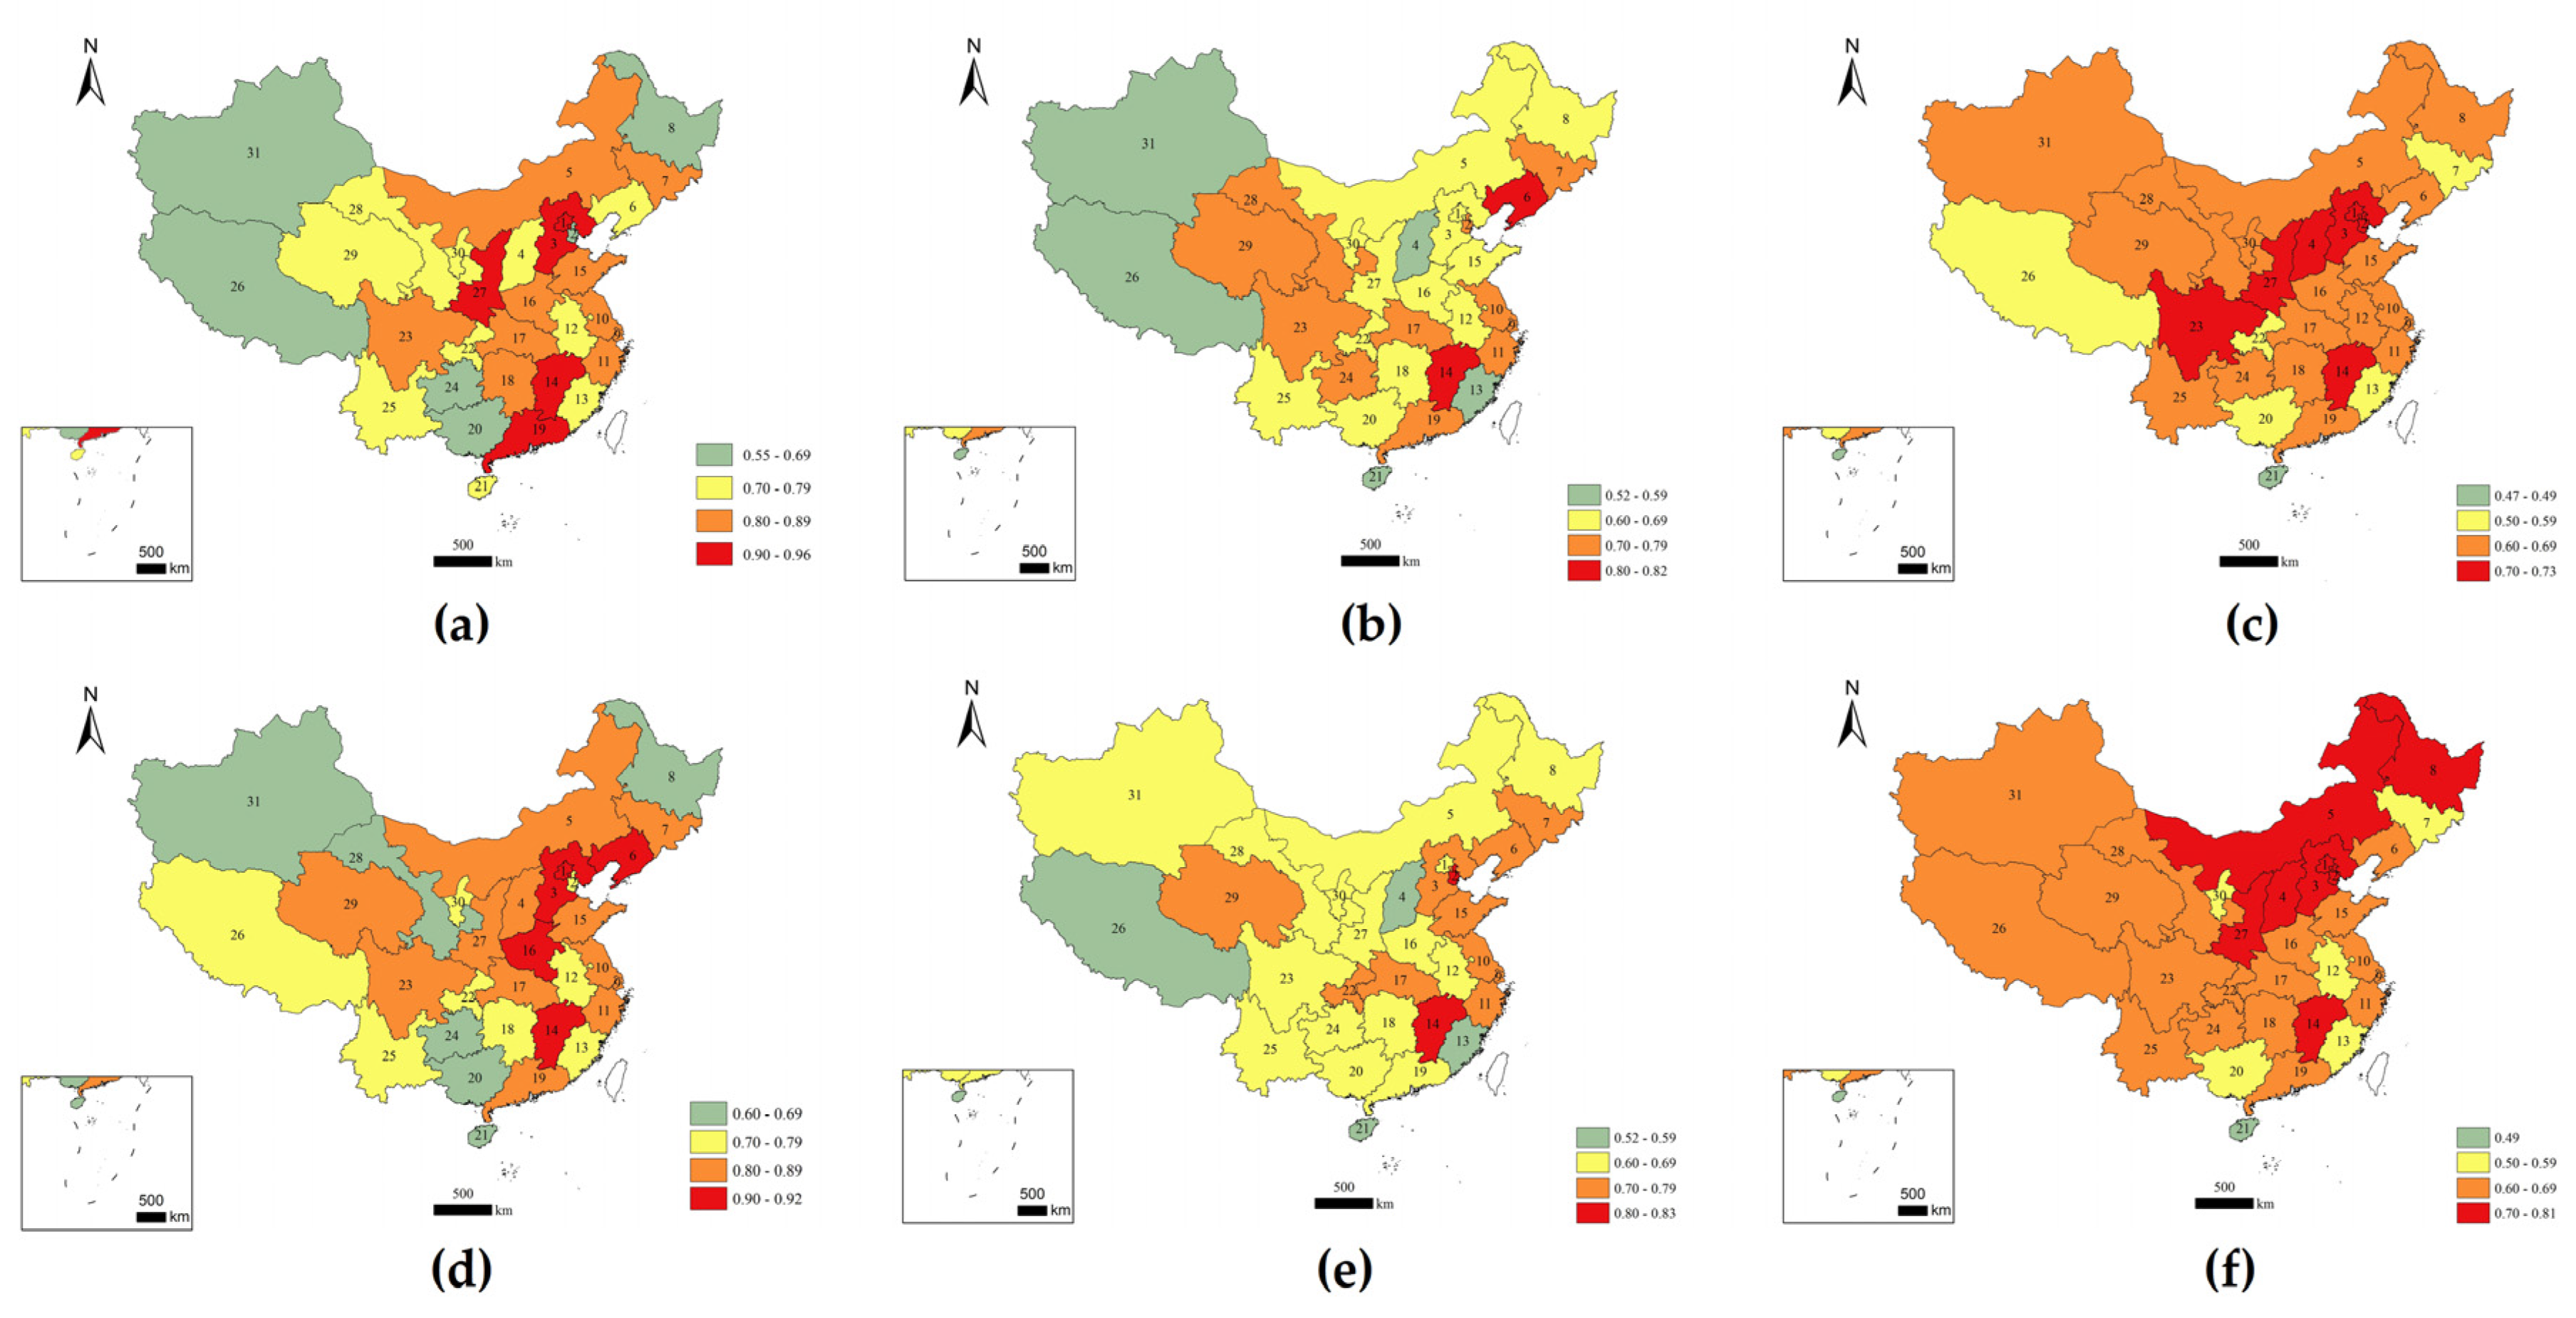
3.3. Regional Differences in the Impact of Ambient Air Quality Indicators on Inbound Tourists

Spatial maps for the grey relational degree between the number of inbound tourists and the ambient air quality indicators are shown in Figure 6, Figure 7, Figure 8, Figure 9 and Figure 10. Generally, the grey relational degree shows a pattern of regional heterogeneity, which is consistent with the findings of Ye [32].

3.3.1. Differences in the Impact of EGR on Inbound Tourism

It is evident that from 2009 to 2012 (Figure 6a,c) that there is smaller and less consistency in the grey relational degree between NCT and EGR and similarly between NFT and EGR than that from 2013 to 2019 (Figure 6b,d), with the exception of Guangdong.
Furthermore, from 2009 to 2012, NCT is significantly affected by EGR in provinces in the south (particularly southwest, southeast) of China and to a lesser extent in the northern provinces such as Beijing, Xinjiang, Ningxia, Shanxi and Heilongjiang, while NFT is significantly affected by EGR in provinces in the central-south, southeast and most provinces in the north of China. From 2013 to 2019, NCT is greatly affected by EGR in the provinces along the Yangtze River Belt, such as Sichuan and Hubei and northern areas such as Inner Mongolia, Shaanxi, Hebei, Henan and Shandong, with high consistency of NFT, except Tibet, where NFT seems more affected.

3.3.2. Differences in the Impact of PM10 on Inbound Tourism

In Figure 7, it is evident that the grey relational degree between NCT and PM10, and between NFT and PM10 from 2013 to 2019, shows less but certain consistency. Moreover, from 2009 to 2012, NCT is greatly affected by PM10 in provinces in the south (particularly in Guizhou, Guangxi and Guangdong) as opposed to northern provinces such as Xinjiang and Inner Mongolia, where NFT also shows consistency. NFT is also affected by PM10 in Tibet, Gansu and Chongqing, while NCT is not. (Figure 7a,c) From 2013 to 2019, NCT is greatly affected by PM10 in provinces in the North China Plain, southwest, and central south of China as opposed to the northwest, meanwhile NFT is affected by PM10 in each province, especially in Beijing–Tianjin–Hebei and middle-lower reaches of the Yangtze River. (Figure 7b,d).

3.3.3. Differences in the Impact of SO2 on Inbound Tourism

According to Figure 8, the grey relational degree between NCT and SO2 as well as between NFT and SO2 from 2009 to 2012 show smaller consistency than that from 2013 to 2019.
From 2009 to 2012, both NCT and NFT are greatly affected by SO2 in Qinghai, Shandong and Fujian, as opposed to Jilin, Chongqing, Henan and Jiangsu. The impact on NCT exhibits a scattered distribution, while it is concentrated on the North and Circum-Bohai-Sea Region of China for the NFT. (Figure 8a,c) Likewise, from 2013 to 2019, both NCT and NFT are greatly affected by SO2 in the provinces in the west and east of China as opposed to those in the central area. Less impact of SO2 is shown on NCT in Jilin and Liaoning and on NFT in Ningxia (Figure 8b,d).

3.3.4. Differences in the Impact of NO2 on Inbound Tourism

In Figure 9, the grey relational degree between NCT and NO2 and between NFT and NO2 shows certain consistency from 2009 to 2019.
For instance, from 2009 to 2012, both NCT and NFT are greatly affected by NO2 in the southeast and central south of China in contrast to Shaanxi and Ningxia (Figure 9a,c). From 2013 to 2019, NCT and NFT are also greatly affected by NO2 in provinces in the north, east, central south of China, while NFT is affected more by NO2 than NCT in the west (Tibet and Qinghai) of China (Figure 9b,d).

3.3.5. Differences in the Impact of O3, CO and PM2.5 on Inbound Tourism

As the air quality evaluation standard has changed since 2013, the data of O3, CO and PM2.5 between 2013 to 2019 are used for comparing the consistency of NCT and NFT, as shown in Figure 10.
Both NCT and NFT are significantly affected by O3, mainly in Hebei, Beijing and Jiangxi. NCT is also significantly affected by O3 in Shaanxi, and Guangdong, as is NFT in Liaoning and Henan. Interestingly, NCT is affected by O3 more than NFT in Guangdong (Figure 10a,d).
In addition, both NCT and NFT are affected by CO, mainly in Jiangxi Qinghai, Hubei and provinces in the eastern coastal regions. NCT is also greatly affected by CO in the central-western regions such as Gansu, Sichuan and Guizhou, as is NFT in Chongqing (Figure 10b,e).
It is also evident that both NCT and NFT are significantly affected by PM2.5 mainly in North China such as Shaanxi, Shanxi and the Beijing–Tianjin–Hebei Region (provinces that mainly use coal) and Jiangxi. Moreover, NCT is significantly affected by PM2.5 in Sichuan, as is NFT in Inner Mongolia and Liaoning. In general, inbound tourists are affected by PM2.5 provinces in the north, southwest, central-south and east of China (Figure 10c,f).
As the different indicators were selected due to the inconsistent air quality evaluation standards before and since 2013, the results in the two periods unavoidably show disparities. In this case, inbound tourists affected by air quality change under AQI indicator evaluation are more sensitive, which is consistent with the findings of a study by Tang [41]. In addition, the air quality indicators selected based on the AQI standards (i.e., from 2013 to 2019) seem to be more scientific and reasonable with specific concentration limit standard.
In the long run, particulate matter such as PM10 and PM2.5 have less impact on the change of inbound tourists, while it had great impact in the short term from 2012 to 2014 when severe smog deterred many potential tourists from entering China. Instead, NO2, CO and O3 have continuing impact on the change of inbound tourists in China due to China’s long-term adherence to extensive development mode, irrational industrial layout and energy structure.
It is also worth mentioning that excessive coal emissions (especially wintertime coal-fired heating in Northern China), and motor vehicle exhaust emissions have become the largest source of air quality pollution in mega and medium-sized cities, resulting in a sharp rise in air pollutant emissions. In 2013, the severity of air pollution in China reached a critical point. A year (or two) later, the deterioration of air quality in China had a negative impact on tourism and the perception of potential inbound tourists, resulting in a significant decrease in inbound tourists.
Subsequently, unprecedented environmental governance reforms in China took place. For instance, a set of comprehensive and stringent policies to reduce air pollution was implemented, including many environmental laws and standards, environmental action plans proposed by the central and local governments and specific and detailed control measures for production and economic activities to prevent and control air pollution [4,5,42,43,44,45,46,47].
By the end of 2012, the 12th Five-Year Plan for Preventing and Controlling Air Pollution in Key Regions was released as China’s first comprehensive air pollution prevention and control plan, marking a gradual shift in China’s air pollution prevention and control from total pollutant control to environmental quality improvement and from primary pollution prevention to both primary and secondary pollution prevention. The plan’s scope involved a total of 19 provinces directly under the Central Government (Beijing–Tianjin–Hebei region and the Yangtze River Delta, the Pearl River Delta, Central Liaoning, Shandong, Wuhan and its surrounding cities, Changsha–Zhuzhou–Xiangtan, Chengdu–Chongqing, the west coast of the Taiwan Strait, Central and Northern Shanxi, Central Shaanxi, Gansu–Ningxia and the Urumqi urban agglomeration). In 2013, the State Council promulgated the stringent Action Plan for Air Pollution Prevention and Control (APAPPC), which for the first time clarified the responsibilities of local governments. In 2014, the government implemented the APAPPC focusing on the megacities and regions with frequent occurrence of smog starting by reducing particulate matter. In March 2017, Report on the Work of the Government renewed the fight against air pollution and to make the skies blue again. In March 2018, construction of an ecological civilization was added to the Constitution, and special laws in the field of ecological environment were formulated and revised. The notion that clear waters and lush mountains are invaluable assets has been established since then. In June 2018, implementation of a three-year action plan to defend the blue skies begun. By 2019, only the Beijing–Tianjin–Hebei region, Yangtze River Delta and Fenhe–Weihe River Plain area were required to curb air pollution, indicating that the key areas scope has been narrowed compared with 2012, and the number of days of heavy air pollution in key cities has fallen by over 50 percent.
Furthermore, the state has carried out coordinated inter-regional prevention and control efforts, and it has made strong moves to tackle three major sources of pollution: industrial production, coal used as fuel, and motor vehicles. In the energy mix restructure, the government upgraded coal-burning power plants and shut down all small coal-fired furnaces in established districts of city-level and above, developed energy conservation, increased the proportion of clean and renewable energy in total energy consumption and promoted clean winter heating in the northern region. It is also worth noting that in vehicle emissions control, promotion of the use of new-energy vehicles; raising the national production standards (National-VI emission standard for now) and improvement of the quality of fuel; removal of all high-emission commercial vehicles registered and reduction of exhaust emissions by diesel trucks and ships are strictly supervised by the government under the new laws. In industrial pollution reduction, the government further addressed the problem at the source, enforced upgrades in heavily polluting sectors to achieve compliance with standards, enforced environmental laws and regulations, conducted inspections and held violators accountable.
With this great series of efforts, the air quality has significantly improved. As a result, the tourism image has been reshaped with blue skies, clear waters and lush mountains, and consequently the number of inbound tourists in China has rebounded.
However, in addition to the air quality impact, globalization cannot be neglected. The global financial crisis in 2008 hindered international tourism [48,49]; thus, we skipped this year in our analysis to diminish the interference of economic impact in this study. In 2009, according to UNWTO data, the tourism industry recorded an 8% decrease and a decrease in foreign tourist arrivals of 4.3% compared to 2008 [50,51]. The large impact of the European economic slump on other destinations is manifested in the European tourism market, which accounts for almost 70% of the global decline [51]. In 2010 the global economy recovered, and this has also been true for international tourism [49,50].
In recent years, collaboration, shared economy, etc., have been new economic patterns that contributed to the development of tourism. The Belt and Road Initiative (BRI) can be taken as an example, which was put forward since 2013 with the vision to build a global community of shared future, financial integration, unimpeded trade, infrastructure connectivity and industrial cooperation with other countries and areas along the lines across in Asia, Europe and Africa [52]. The tourism infrastructure and tourism reception capacity in the 18 provinces linked with the BRI such as Gansu, Qinghai, Ningxia, Heilongjiang, Yunnan and Xinjiang have improved greatly. The economic cooperation and regional network has accelerated the development of border tourism and international tourism [53].
Aside from the environment, economic development, resource endowments and attractiveness, location and distance, accessibility, openness and inclusiveness, security, etc., also have significant impact on tourism. It is also nearly impossible to distinguish the environmental impact from others, which are often highly integrated, such as environmental protection investments and pollution emission tax. Moreover, the air quality itself is a resource endowment of economic development. Nonetheless, in 2017, there were five areas highlighted by the International Year of Sustainable Tourism for Development: (1) inclusive and sustainable economic growth; (2) social inclusion, employment and poverty reduction; (3) energy efficiency, environmental protection and climate change; (4) cultural values, diversity and heritage and (5) mutual understanding, peace and security [50]. To develop sustainable inbound tourism in China, all the above should be keenly taken account.

4. Conclusions

In this study, we analyzed the impact of air quality changes in the 31 provinces in China under the API and AQI air quality evaluation standards during two periods based on the grey relational method. We found that: (1) inbound tourist arrivals are significantly and positively affected by ambient air quality, and the impact from 2013 to 2019 was greater than that from 2009 to 2012; (2) there is regional diversity in inbound tourist arrivals, and the impact of the different air quality indicators varies; (3) inbound tourists showed greater sensitivity to air pollution under the AQI standard; (4) the impact of air quality indicators on the inbound tourist arrivals shows grey relational order, and the concentration of PM2.5, PM10 and SO2 have less impact than NO2, CO and O3 on changes in tourism numbers; (5) consistency in the air quality impact on foreign tourists and compatriot tourists from HK, MO and TW varies by air quality indicators.
Air quality improvement can produce great economic benefits, attract more tourists, and improve public health. Existing and upcoming socioeconomic and ecological impact, tourist demand, industries and host communities should be taken into account, prioritizing environmental protection in economic policies and improving technology to reduce air pollution when conducting tourism planning. While the findings highlight the importance of good air quality for sustainable tourism, tourism and the environment ought to be mutually beneficial. Thus, the mutual interplay deserves further investigation.

Author Contributions

Conceptualization, W.Z., L.L. and Z.L.; methodology, W.Z., L.L. and Z.L.; software, Z.L.; validation, W.Z., L.L.; formal analysis, W.Z., L.L.; resources, Z.L. and Y.Z.; data curation, Z.L.; writing—original draft preparation, W.Z., Z.L.; writing—review and editing, L.L., W.Z., E.Y. and Y.Z.; visualization, Z.L. All authors have read and agreed to the published version of the manuscript.

Funding

This research is funded by the National Social Science Foundation of China (16BGL137) and National Natural Science Foundation of China (42075144, 41875161).

Institutional Review Board Statement

Not applicable.

Informed Consent Statement

Not applicable.

Data Availability Statement

The data resource is publicly available from the China Statistics Yearbook (2010–2020) compiled by the National Bureau of Statistics in the People’s Republic of China, available online: http://www.stats.gov.cn/tjsj/ndsj/ (accessed on 20 July 2021), and other information from the Report of the Work of the Government (2014–2020) issued by the State Council of the People’s Republic of China, available online: http://www.gov.cn/guowuyuan/2020zfgzbg.htm (accessed on 20 July 2021).

Conflicts of Interest

The authors declare no conflict of interest.

Appendix A

Table A1. IAQI (IAPI) and corresponding air pollutants’ concentration limit difference.
IAPI/IAQIAmbient Air Pollutant Concentration Limit
Daily Average (μg/m3)O3 8 h Average (μg/m3)CO Daily Average (mg/m3)
SO2NO2PM10PM2.5
B (1)A (1)BABAABABA
50508040503512010052
1001501208015075200160104
150-475-180-250115-215-14
2008002803501504002656024
3001605654202508008009036
40021007505003501000- (2)12048
50026209406005001200- (2)15060
Note: “(1)”: “B” denotes “before”, and “A” denotes “after” in the figure; “(2)” denotes if the concentration of 8 h average of O3 is over 800 μg/m3, and its IAQI is calculated according to 1 h average concentration; the IAPI’s corresponding pollutant limit is according to Technical requirements for urban ambient air quality daily report and forecast (2008).
Table A2. Ambient air pollutants’ concentration limit differences in China and international standard.
PollutantSampling TimeConcentration LimitUnit
ChinaWHOEUUSA
Grade IGrade IIGrade III
BeforeAfterBeforeAfterBefore
SO210 min 500 μg/m3
average hour150150500500700 350196
average daily505015015025020125
average annual20206060100
NO2average hour120200240 *200240200200188
average daily8080120 *80120
average annual404080 *40804040100
PM10average daily50501501502505050150
average annual4040100701502040
PM2.5average daily 35 75 25 35
average annual 15 35 102512
O3average hour160 *160200 *200200
max 8 h 100 160 100120147
COaverage hour111123 4mg/m3
8 h average 111
average daily44446
Note: “*” denotes the concentration limit revised in the revision of CNAAQS GB3095-1996 in 2000, and the three-tier standard was eliminated in CNAAQS GB3095-2012.

References

  1. Zhang, N.; Ren, R.; Zhang, Q.; Zhang, T. Air pollution and tourism development: An interplay. Ann. Tour. Res. 2020, 85, 103032. [Google Scholar] [CrossRef]
  2. Zhang, Q.; Crooks, R. Asian Development Bank, Toward an Environmentally Sustainable Future: Country Environmental Analysis of the People’s Republic of China. 2012, p. 46. Available online: http://hdl.handle.net/11540/880 (accessed on 20 July 2021).
  3. Hsu, A.; Emerson, J.; Levy, M.; de Sherbinin, A.; Johnson, L.; Malik, O.; Schwartz, J.; Jaiteh, M. The 2014 Environmental Performance Index; Yale Center for Environmental Law and Policy: New Haven, CT, USA, 2014; Available online: https://www.epi.yale.edu (accessed on 20 July 2021).
  4. Feng, L.; Liao, W. Legislation, plans, and policies for prevention and control of air pollution in China: Achievements, challenges, and improvements. J. Clean. Prod. 2016, 112, 1549–1558. [Google Scholar] [CrossRef]
  5. Feng, Y.; Ning, M.; Lei, Y.; Sun, Y.; Liu, W.; Wang, J. Defending blue sky in China: Effectiveness of the “Air Pollution Prevention and Control Action Plan” on air quality improvements from 2013 to 2017. J. Environ. Manag. 2019, 252, 109603. [Google Scholar] [CrossRef] [PubMed]
  6. Sajjad, F.; Noreen, U.; Zaman, K. Climate change and air pollution jointly creating nightmare for tourism industry. Environ. Sci. Pollut. Res. 2014, 21, 12403–12418. [Google Scholar] [CrossRef] [PubMed]
  7. Gao, J.; Zhang, L. Exploring the dynamic links between tourism growth and environmental pollution: New evidence from the Mediterranean countries. Curr. Issues Tour. 2019, 24, 1–17. [Google Scholar]
  8. Dong, D.; Xu, X.; Wong, Y.F. Estimating the Impact of Air Pollution on Inbound Tourism in China: An Analysis Based on Regression Discontinuity Design. Sustainability 2019, 11, 1682. [Google Scholar] [CrossRef] [Green Version]
  9. Zhou, B.; Qu, H.; Du, X.; Yang, B.; Liu, F. Air Quality and Inbound Tourism in China. Tour. Anal. 2018, 23, 159–164. [Google Scholar] [CrossRef]
  10. Xu, X.; Reed, M. Perceived pollution and inbound tourism for Shanghai: A panel VAR approach. Curr. Issues Tour. 2018, 22, 601–614. [Google Scholar] [CrossRef]
  11. Holden, A. The environment-tourism nexus: Influence of market ethics. Ann. Tour. Res. 2009, 36, 373–389. [Google Scholar] [CrossRef]
  12. Pedro, M. Stealth Risks and Catastrophic Risks. J. Travel Tour. Mark. 2008, 23, 15–27. [Google Scholar]
  13. Khan, A.; Bibi, S.; Ardito, L.; Lyu, J.; Hayat, H.; Arif, A.M. Revisiting the Dynamics of Tourism, Economic Growth, and Environmental Pollutants in the Emerging Economies—Sustainable Tourism Policy Implications. Sustainability 2020, 12, 2533. [Google Scholar] [CrossRef] [Green Version]
  14. Poudyal, N.C.; Paudel, B.; Green, G.T. Estimating the Impact of Impaired Visibility on the Demand for Visits to National Parks. Tour. Econ. 2013, 19, 433–452. [Google Scholar] [CrossRef]
  15. Anaman, K.A.; Looi, C.N. Economic Impact of Haze-Related Air Pollution on the Tourism Industry in Brunei Darussalam. Econ. Anal. Policy 2000, 30, 133–143. [Google Scholar] [CrossRef]
  16. Gani, A.; Clemes, M.D. The main determinants effecting international visitor arrivals in New Zealand: Some empirical evidence. Tour. Econ. 2017, 23, 921–940. [Google Scholar] [CrossRef]
  17. Zhang, A.; Zhong, L.; Xu, Y.; Wang, H.; Dang, L. Tourists’ Perception of Haze Pollution and the Potential Impacts on Travel: Reshaping the Features of Tourism Seasonality in Beijing, China. Sustainability 2015, 7, 2397–2414. [Google Scholar] [CrossRef] [Green Version]
  18. Mihalič, T. Environmental management of a tourist destination: A factor of tourism competitiveness. Tour. Manag. 2000, 21, 65–78. [Google Scholar] [CrossRef]
  19. Law, R.; Cheung, C. Air Quality in Hong Kong: A Study of the Perception of International Visitors. J. Sustain. Tour. 2007, 15, 390–401. [Google Scholar] [CrossRef]
  20. Hu, W.; Wall, G. Environmental Management, Environmental Image and the Competitive Tourist Attraction. J. Sustain. Tour. 2005, 13, 617–635. [Google Scholar] [CrossRef]
  21. Zhang, H.; Gu, C.-L.; Gu, L.-W.; Zhang, Y. The evaluation of tourism destination competitiveness by TOPSIS & information entropy—A case in the Yangtze River Delta of China. Tour. Manag. 2011, 32, 443–451. [Google Scholar] [CrossRef]
  22. Zhou, X.; Santana Jiménez, Y.; Pérez Rodríguez, J.V.; Hernández, J.M. Air pollution and tourism demand: A case study of Beijing, China. Int. J. Tour. Res. 2019, 21, 747–757. [Google Scholar] [CrossRef]
  23. Tang, J.; Yuan, X.; Ramos, V.; Sriboonchitta, S. Does air pollution decrease inbound tourist arrivals? The case of Beijing. Asia Pac. J. Tour. Res. 2019, 24, 597–605. [Google Scholar] [CrossRef]
  24. Wang, L.-J.; Chen, M.-H. Nonlinear Impact of Air Quality on Tourist Arrivals: New Proposal and Evidence. J. Travel Res. 2021, 60, 434–445. [Google Scholar] [CrossRef]
  25. Xu, B.; Dong, D. Evaluating the Impact of Air Pollution on China’s Inbound Tourism: A Gravity Model Approach. Sustainability 2020, 12, 1456. [Google Scholar] [CrossRef] [Green Version]
  26. Xu, X.; Dong, D.; Wang, Y.; Wang, S. The Impacts of Different Air Pollutants on Domestic and Inbound Tourism in China. Int. J. Environ. Res. Public Health 2019, 16, 5127. [Google Scholar] [CrossRef] [Green Version]
  27. Liu, J.; Pan, H.; Zheng, S. Tourism Development, Environment and Policies: Differences between Domestic and International Tourists. Sustainability 2019, 11, 1390. [Google Scholar] [CrossRef] [Green Version]
  28. Deng, T.; Li, X.; Ma, M. Evaluating impact of air pollution on China’s inbound tourism industry: A spatial economic approach. Asia Pac. J. Tour. Res. 2017, 22, 771–780. [Google Scholar] [CrossRef]
  29. Becken, S.; Jin, X.; Zhang, C.; Gao, J. Urban air pollution in China: Destination image and risk perceptions. J. Sustain. Tour. 2017, 25, 130–147. [Google Scholar] [CrossRef] [Green Version]
  30. Xu, X.; Reed, M. Perceived pollution and inbound tourism in China. Tour. Manag. Perspect. 2017, 21, 109–112. [Google Scholar] [CrossRef]
  31. Chen, C.-M.; Lin, Y.-L.; Hsu, C.-L. Does air pollution drive away tourists? A case study of the Sun Moon Lake National Scenic Area, Taiwan. Transp. Res. Part D: Transp. Environ. 2017, 53, 398–402. [Google Scholar] [CrossRef]
  32. Ye, L. Study on the Influence of Air Quality on the Development of Inbound Tourism in China. Ph.D. Thesis, Guangxi University, Nanning, China, 2020. [Google Scholar]
  33. He, S.; Zhao, B.; Yu, Z. Development and Comparison of National Ambient Air Quality Standards in China. Environ. Monit. China 2014, 30, 50–55. [Google Scholar]
  34. World Health Organization Regional Office for Europe. Available online: http://www.euro.who.int/air (accessed on 9 September 2021).
  35. European Commission. Available online: http://ec.europa.eu/environment/air/quality/standards.htm (accessed on 9 September 2021).
  36. United States Environmental Protection Agency. Available online: http://www.epa.gov/air/criteria.html (accessed on 9 September 2021).
  37. Tang, Q. DPS Data Processing System Experimental Design, Statistical Analysis and Data Mining, 2nd ed.; Science Press: Beijing, China, 2010; pp. 1076–1083. [Google Scholar]
  38. Tan, X.; Deng, J. Grey Relational Analysis: A new method of multivariate statistical analysis. Stat. Res. 1995, 3, 46–48. [Google Scholar]
  39. Li, X.; Shi, C.; Wang, L.; Li, J. NOx emission measurement and grey relational analysis of energy consumption in inbound tourism. J. Northwest Norm. Univ. 2021, 57, 104–111. [Google Scholar]
  40. Deng, J. Grey System Theory Tutorial; Central China Institute of Technology Press: Wuhan, China, 1990. [Google Scholar]
  41. Tang, G. The Impact of Air Pollution on Tourism Industry. Master’s Thesis, Southwestern University of Finance and Economics, Chengdu, China, 2019. [Google Scholar]
  42. Jin, Y.; Andersson, H.; Zhang, S. Air Pollution Control Policies in China: A Retrospective and Prospects. Int. J. Environ. Res. Public Health 2016, 13, 1219. [Google Scholar] [CrossRef] [PubMed] [Green Version]
  43. Dewan, N.; Wang, Y.-Q.; Zhang, Y.-X.; Zhang, Y.; He, L.-Y.; Huang, X.-F.; Majestic, B.J. Effect of Pollution Controls on Atmospheric PM2.5 Composition during Universiade in Shenzhen, China. Atmosphere 2016, 7, 57. [Google Scholar] [CrossRef] [Green Version]
  44. Yang, W.; Yuan, G.; Han, J. Is China’s air pollution control policy effective? Evidence from Yangtze River Delta cities. J. Clean. Prod. 2019, 220, 110–133. [Google Scholar] [CrossRef]
  45. Zhao, H.; Chen, K.; Liu, Z.; Zhang, Y.; Shao, T.; Zhang, H. Coordinated control of PM2.5 and O3 is urgently needed in China after implementation of the “Air pollution prevention and control action plan”. Chemosphere 2021, 270, 129441. [Google Scholar] [CrossRef] [PubMed]
  46. Gao, H.; Yang, W.; Wang, J.; Zheng, X. Analysis of the Effectiveness of Air Pollution Control Policies Based on Historical Evaluation and Deep Learning Forecast: A Case Study of Chengdu-Chongqing Region in China. Sustainability 2020, 13, 206. [Google Scholar] [CrossRef]
  47. Zhou, L.; Tang, L. Environmental regulation and the growth of the total-factor carbon productivity of China’s industries: Evidence from the implementation of action plan of air pollution prevention and control. J. Environ. Manag. 2021, 296, 113078. [Google Scholar] [CrossRef]
  48. Page, S.; Song, H.; Wu, D.C. Assessing the Impacts of the Global Economic Crisis and Swine Flu on Inbound Tourism Demand in the United Kingdom. J. Travel Res. 2011, 51, 142–153. [Google Scholar] [CrossRef]
  49. Song, H.; Lin, S. Impacts of the Financial and Economic Crisis on Tourism in Asia. J. Travel Res. 2009, 49, 16–30. [Google Scholar] [CrossRef]
  50. UNWTO. Available online: https://www.unwto.org/ (accessed on 9 September 2021).
  51. Podhorodecka, K. Tourism economies and islands’ resilience to the global financial crisis. Isl. Stud. J. 2018, 13, 163–184. [Google Scholar] [CrossRef]
  52. Office of the Leading Group for Promoting the Belt and Road Initiative. The Belt and Road Initiative Progress, Contributions and Prospects 2019, 1st ed.; Foreign Languages Press: Beijing, China, 2019; pp. 8–30. [Google Scholar]
  53. Lai, Z.; Ge, D.; Xia, H.; Yue, Y.; Wang, Z. Coupling coordination between environment, economy and tourism: A case study of China. PLoS ONE 2020, 15, e0228426. [Google Scholar] [CrossRef] [PubMed] [Green Version]
Figure 1. The change of (a) total overseas visitor arrivals composition from 2009 to 2019; (b) TNC and TNF from 2009 to 2019.
Sustainability 13 10972 g001
Figure 2. Year-to-year change rate of: (a) the annual number of overnight visitors in 31 provinces from 2009 to 2019; (b) EGR in 31 provincial capitals from 2009 to 2019. Note: “n + 1/n” denotes the rate of change from year n to year n + 1; the number denotes provinces (Figure 2a) or corresponding capital cities (Figure 2b): 1—Beijing (a,b); 2—Tianjin (a,b); 3—Hebei (a)/Shijiazhuang (b); 4—Shanxi (a)/Taiyuan (b); 5—Inner Mongolia (a)/Hohhot (b); 6—Liaoning (a)/Shenyang (b); 7—Jilin (a)/Changchun (b); 8—Heilongjiang (a)/Harbin (b); 9—Shanghai (a,b); 10—Jiangsu (a)/Nanjing (b); 11—Zhejiang (a)/Hangzhou (b); 12—Anhui (a)/Hefei (b); 13—Fujian (a)/Fuzhou (b); 14—Jiangxi (a)/Nanchang (b); 15—Shandong (a)/Jinan (b); 16—Henan (a)/Zhengzhou (b); 17—Hubei (a)/Wuhan (b); 18—Hunan (a)/Changsha (b); 19—Guangdong (a)/Guangzhou (b); 20—Guangxi (a)/Nanning (b); 21—Hainan (a)/Haikou (b); 22—Chongqing (a,b); 23—Sichuan (a)/Chengdu (b); 24—Guizhou (a)/Guiyang (b); 25—Yunnan (a)/Kunming (b); 26—Tibet (a)/Lhasa (b); 27—Shaanxi (a)/Xi’an (b); 28—Gansu (a)/Lanzhou (b); 29—Qinghai (a)/Xining (b); 30—Ningxia (a)/Yinchuan (b); 31—Xinjiang (a)/Urumqi (b). These areas are denoted by the same numbers in subsequent figures.
Sustainability 13 10972 g002
Figure 3. Annual average of the EGR and annual average of the number of inbound tourists in 31 provinces (capital cities) from 2009 to 2019. Note: “ANT” denotes annual average of the number of inbound tourists, and “AEGR” denotes annual average of EGR.
Sustainability 13 10972 g003
Figure 4. Grey relational degree between inbound tourists and ambient air quality in 31 provinces from 2009 to 2012. Note: HEB* denotes Hebei; SX* denotes Shanxi; HEN* denotes Henan; HUB*denotes Hubei; HUN* denotes Hunan; HAN* denotes Hainan; SAX* denotes Shaanxi. The same abbreviations are used in Figure 5 and Table 4.
Sustainability 13 10972 g004
Figure 5. Grey relational degree between inbound tourists and ambient air quality in 31 provinces from 2013 to 2019.
Sustainability 13 10972 g005
Figure 6. Inter-provincial difference of grey relational degree between EGR in 31 provinces against: (a) NCT from 2009 to 2012; (b) NCT from 2013 to 2019; (c) NFT from 2009 to 2012 and (d) NFT from 2013 to 2019. Note: Hong Kong, Macao and Taiwan were not included as they are referred to in one of the observed objectives. In China, the tourists from Hong Kong, Macao and Taiwan are referred to as inbound tourists.
Sustainability 13 10972 g006
Figure 7. Inter-provincial difference of grey relational degree between Pm10 concentration in 31 provinces against: (a) NCT from 2009 to 2012; (b) NCT from 2013 to 2019; (c) NFT from 2009 to 2012 and (d) NFT from 2013 to 2019.
Sustainability 13 10972 g007
Figure 8. Inter-provincial difference of grey relational degree between SO2 concentration in 31 provinces against: (a) NCT from 2009 to 2012; (b) NCT from 2013 to 2019; (c) NFT from 2009 to 2012 and (d) NFT from 2013 to 2019.
Sustainability 13 10972 g008
Figure 9. inter-provincial difference of grey relational degree between NO2 concentration in 31 provinces against: (a) NCT from 2009 to 2012; (b) NCT from 2013 to 2019; (c) NFT from 2009 to 2012 and (d) NFT from 2013 to 2019.
Sustainability 13 10972 g009
Figure 10. Inter-provincial difference of grey relational degree between: (a) O3 concentration in 31 provinces against NCT from 2013 to 2019; (b) CO concentration in 31 provinces against NCT from 2013 to 2019; (c) PM2.5 concentration in 31 provinces against NCT from 2013 to 2019; (d) O3 concentration in 31 provinces against NFT from 2013 to 2019; (e) CO concentration in 31 provinces against NFT from 2013 to 2019 and (f) PM2.5 concentration in 31 provinces against NFT from 2013 to 2019.
Sustainability 13 10972 g010
Table 1. The corresponding representation of API and AQI.
APIAQIClassificationImpact on Health
IndexGradeIndexGrade
0–50I0–50IExcellentSatisfactory
51–100II51–100IIGoodAcceptable
101–200III101–150IIILight pollutedSusceptible on different levels
201–300IV151–200IVModerately polluted
>300V201–300VHeavily polluted
-->300VISeverely polluted
Table 2. Explanation of inbound tourists and ambient air quality indicators from 2009 to 2019.
Time PeriodIndicatorDescriptionAbbreviation
2009–2012YjY1Number of compatriot tourists from HK, MO and TWNCT
Y2Number of foreign touristsNFT
XiX1Average annual concentration of PM10PM10
X2Average annual concentration of SO2SO2
X3Average annual concentration of NO2NO2
X4Annual excellent and good classification of API standardEGR
2013–2019YjY1Number of compatriot tourists from HK, MO and TWNCT
Y2Number of foreign touristsNFT
XiX1Average annual concentration of PM10PM10
X2Average annual concentration of PM2.5PM2.5
X3Average annual concentration of SO2SO2
X4Average annual concentration of NO2NO2
X5Daily average 95th percentile concentration of COCO
X6Daily maximum 8 h 90th percentile concentration of O3O3
X7Annual excellent and good classification of AQI standardEGR
Table 3. Changes in the number of inbound tourists from 2009 to 2019.
YearOverseas Visitor ArrivalsRate of ChangeOverseas Overnight TouristsRate of Change
200912,647.59−2.73%5087.52−4.10%
201013,376.22+5.76%5566.45+9.41%
201113,542.35+1.24%5758.07+3.44%
201213,240.53−2.23%5772.49+0.25%
201312,907.78−2.51%5568.59−3.53%
201412,849.83−0.45%5562.20−0.11%
201513,382.04+4.14%5688.57+2.27%
201613,844.38+3.45%5926.73+4.19%
201713,948.24+0.75%6073.84+2.48%
201814,119.83+1.23%6289.57+3.55%
201914,530.77+2.91%6572.52+4.50%
Unit: 10,000 person-times.
Table 4. 31 provinces’ air quality indicators Xi’s grey relational order to the number of inbound tourists Yj.
ProvinceXi’s Grey Relational Order to Yj
2009–20122013–2019
Y1Y2Y1Y2
BJX4 > X3 > X1 > X2X3 > X4 > X1 > X2X6 > X4 > X1 > X7 > X2 > X5 > X3 *X6 > X4 > X1 > X7 > X2 > X5 > X3 *
TJX3 > X2 > X4 > X1X2 > X3 > X1 > X4X5 > X2 > X4 > X1 > X7 > X6 > X3X4 > X5 > X7 > X2 > X1 > X6 > X3
HEBX3 > X2 > X4 > X1X2 > X3 > X4 > X1X6 > X7 > X4 > X1 > X2 > X5 > X3X6 > X4 > X7 > X2 > X1 > X5 > X3
SXX3 > X4 > X1 > X2 *X3 > X4 > X1 > X2 *X4 > X6 > X1 > X2 > X7 > X5 > X3 *X4 > X6 > X1 > X2 > X7 > X5 > X3 *
IMX1 > X4 > X3 > X2X4 > X2 > X3 > X1X6 > X7 > X4 > X2 > X1 > X5 > X3X7 > X4 > X6 > X2 > X1 > X5 > X3
LNX2 > X4 > X3 > X1 *X2 > X4 > X3 > X1 *X5 > X6 > X4 > X1 > X2 > X7 > X3X6 > X7 > X4 > X5 > X1 > X2 > X3
JLX1 > X4 > X3 > X2 *X1 > X4 > X3 > X2 *X6 > X7 > X5 > X4 > X1 > X2 > X3X6 > X7 > X4 > X5 > X1 > X2 > X3
HLJX3 > X4 > X1 > X2X4 > X1 > X3 > X2X1 > X2 > X4 > X3 > X5 > X7 > X6X1 > X2 > X4 > X5 > X7 > X3 > X6
SHX4 > X3 > X1 > X2X4 > X1 > X3 > X2X7 > X6 > X4 > X5 > X1 > X2 > X3 *X7 > X6 > X4 > X5 > X1 > X2 > X3 *
JSX3 > X4 > X2 > X1 *X3 > X4 > X2 > X1 *X7 > X6 > X4 > X5 > X1 > X2 > X3 *X7 > X6 > X4 > X5 > X1 > X2 > X3 *
ZJX4 > X3 > X2 > X1 *X4 > X3 > X2 > X1 *X7 > X6 > X4 > X5 > X1 > X2 > X3 *X7 > X6 > X4 > X5 > X1 > X2 > X3 *
AHX2 > X4 > X1 > X3 *X2 > X4 > X1 > X3 *X7 > X6 > X4 > X5 > X1 > X2 > X3X7 > X4 > X6 > X5 > X1 > X2 > X3
FJX4 > X1 > X3 > X2X4 > X3 > X1 > X2X6 > X7 > X5 > X3 > X2 > X1 > X4 *X6 > X7 > X5 > X3 > X2 > X1 > X4 *
JXX1 > X4 > X2 > X3X1 > X4 > X3 > X2X6 > X7 > X4 > X5 > X1 > X2 > X3 *X6 > X7 > X4 > X5 > X1 > X2 > X3 *
SDX3 > X2 > X4 > X1X3 > X4 > X2 > X1X6 > X7 > X4 > X5 > X1 > X2 > X3X7 > X6 > X4 > X5 > X1 > X2 > X3
HENX3 > X4 > X1 > X2 *X3 > X4 > X1 > X2 *X7 > X4 > X6 > X2 > X1 > X5 > X3X7 > X6 > X4 > X1 > X2 > X5 > X3
HUBX4 > X3 > X1 > X2 *X4 > X3 > X1 > X2 *X7 > X6 > X5 > X4 > X1 > X2 > X3X7 > X6 > X4 > X5 > X1 > X2 > X3
HUNX3 > X4 > X1 > X2X3 > X4 > X2 > X1X6 > X7 > X4 > X1 > X5 > X2 > X3X6 > X7 > X4 > X5 > X1 > X2 > X3
GDX4 > X1 > X3 > X2 *X4 > X1 > X3 > X2 *X6 > X4 > X7 > X1 > X5 > X2 > X3X7 > X6 > X4 > X1 > X5 > X2 > X3
GXX1 > X3 > X4 > X2 *X1 > X3 > X4 > X2 *X7 > X6 > X4 > X5 > X3 > X2 > X1X7 > X6 > X4 > X5 > X1 > X3 > X2
HANX3 > X1 > X2 > X4X2 > X4 > X3 > X1X6 > X7 > X3 > X5 > X1 > X2 > X4X6 > X7 > X3 > X5 > X1 > X4 > X2
CQX4 > X1 > X3 > X2 *X4 > X1 > X3 > X2 *X6 > X7 > X4 > X5 > X1 > X2 > X3X7 > X6 > X4 > X5 > X1 > X2 > X3
SCX4 > X1 > X3 > X2 *X4 > X1 > X3 > X2 *X7 > X6 > X4 > X2 > X5 > X1 > X3 *X7 > X6 > X4 > X2 > X5 > X1 > X3 *
GZX3 > X1 > X4 > X2 *X3 > X1 > X4 > X2 *X5 > X4 > X1 > X2 > X3 > X6 > X7X5 > X4 > X1 > X2 > X6 > X7 > X3
YNX4 > X1 > X3 > X2 *X4 > X1 > X3 > X2 *X6 > X7 > X4 > X5 > X2 > X1 > X3X7 > X6 > X5 > X4 > X2 > X1 > X3
TBX2 > X3 > X4 > X1X4 > X2 > X3 > X1X7 > X3 > X6 > X4 > X2 > X1 > X5X7 > X4 > X6 > X3 > X1 > X2 > X5
SAXX4 > X1 > X2 > X3 *X4 > X1 > X2 > X3 *X6 > X4 > X7 > X1 > X2 > X5 > X3X6 > X4 > X7 > X2 > X1 > X5 > X3
GSX4 > X1 > X3 > X2X4 > X3 > X1 > X2X7 > X5 > X6 > X4 > X3 > X2 > X1X3 > X2 > X7 > X1 > X5 > X6 > X4
QHX2 > X3 > X1 > X4X4 > X2 > X3 > X1X7 > X6 > X5 > X4 > X1 > X2 > X3X6 > X4 > X7 > X5 > X2 > X1 > X3
NXX4 > X1 > X2 > X3X1 > X4 > X2 > X3X7 > X6 > X4 > X5 > X1 > X2 > X3X6 > X7 > X4 > X5 > X1 > X2 > X3
XJX4 > X3 > X1 > X2 *X4 > X3 > X1 > X2 *X6 > X7 > X2 > X4 > X5 > X1 > X3 *X6 > X7 > X2 > X4 > X5 > X1 > X3 *
Note: “*” denotes the impact order of air quality indicators on NCT and NFT show a quite high consistency in some provinces.
Publisher’s Note: MDPI stays neutral with regard to jurisdictional claims in published maps and institutional affiliations.

