Article

A Comparative Study on Air Pollution Characteristics in Four Key Cities during 2013 in Guangxi Province, China

1
Institute for Environmental and Climate Research, Jinan University, Guangzhou 510632, China
2
Scientific Research Academy of Guangxi Environmental Protection, Nanning 530022, China
3
College of Earth Science and Engineering, Shandong University of Science and Technology, Qingdao 266590, China
4
Chinese Research Academy of Environmental Sciences, Beijing 100012, China
5
State Key Laboratory of Environmental Criteria and Risk Assessment, Chinese Academy of Environmental Sciences, Beijing 100012, China
6
Guangxi Environmental Monitoring Centre, Nanning 530028, China
*
Author to whom correspondence should be addressed.
Sustainability 2021, 13(4), 1612; https://doi.org/10.3390/su13041612
Submission received: 5 December 2020 / Revised: 19 January 2021 / Accepted: 23 January 2021 / Published: 3 February 2021
(This article belongs to the Special Issue Air Quality: Sustainability of Human Society)

Abstract

:
Based on ambient air quality data of the four key cities (Nanning, Liuzhou, Guilin, and Beihai) in Guangxi, China, along with an analysis of the main emission sources, topographic features, weather conditions, and backward trajectories, the variation of main air pollutants and pollution episodes in the four cities were studied. Results showed that air pollution was most serious in Liuzhou and Guilin, followed by Nanning and Beihai. PM2.5 was the dominant pollutant in each city, followed by O3, PM10, and NO2. Concentrations of SO2 and CO did not exceed their National Ambient Air Quality Standard Grade II limit values. In the cities, the concentrations of PM2.5, PM10, NO2, and SO2 were high during fall and winter and low during spring and summer, while the concentrations of O3 were high during fall and low during the other seasons. Concentrations of CO were low during summer and high during the other seasons in Nanning and Liuzhou, while they were high during spring and winter and low during summer and fall in Guilin and Beihai. In these cities, pollution episodes resulted mainly from stagnant accumulation and showed characteristics of regional pollution. However, pollution levels and durations for each city were different due to differences in main pollution sources, local geography, and weather conditions. The influences of air masses on the four cities were similar. They were mainly influenced by local emission sources in the spring, while during autumn, long-distance transportation from Hunan and Hubei was significant. In winter, air pollution in Nanning and Beihai was mostly affected by local emission sources, and that in Liuzhou and Guilin was mainly affected by long-distance transportation from the south and northeast of Guangxi.

1. Introduction

Located in the southern part of China, the Guangxi region is bordered by Guangdong to the east, Guizhou to the north, Yunnan to west, the Gulf of Beibu and Southeast Asia to the south, and Vietnam to the southwest. Its capital, Nanning, is the permanent host city for the China-ASEAN Expo and the International Folk Song Arts Festival. Liuzhou, Guilin, and Beihai are famous tourist attractions in China and abroad. Liuzhou is an industrial city, and Beihai is the only coastal city in western China. The four cities have domestic and international influences, and their local air quality has attracted extensive attention.
Ambient air pollution is a key issue affecting the atmospheric environment and public health in China and is significantly associated with economic development and energy consumption. China’s ambient air quality standards (NAAQS) are guidelines for environmental management and serve as the basis for air pollution emission control. To adapt to the changing environmental situation, NAAQS was established in 1982 (GB 3095), with amendments in 1996, 2000 (GB3095-1996), and most recently in 2012 (GB3095-2012), which added PM2.5 and tightened the concentration thresholds of PM10 and NO2. Under NAAQS (GB3095-1996), the Air Pollution Index (API) was used to obtain and convey information regarding urban air quality, which was subsequently replaced by the Air Quality Index (AQI) as per GB3095-2012. PM10 and SO2 were regarded as the primary pollutants in API, whereas all five air pollutants (PM2.5, NO2, CO, O3, PM10, and SO2) in AQI were regarded as primary [1]. API and AQI values less than or equal to 50 indicate attainment of the Grade I standard, values falling in the range 50–100, 100–200, 200–300, and larger than 300 are called Grade II, Grade III, Grade IV, and Grade V standards, respectively.
The implementation of NAAQS (GB3095-2012) is a large, complex, and systematic project, which will inevitably be affected by a multitude of factors [2]. A number of previous studies [1,2,3,4,5,6] have assessed the ambient air quality in China’s megacity clusters (Jing-Jin-Ji, Yangzte River Delta, Pearl River Delta) based on the new NAAQS (GB3095-2012). The Chinese government reported that only 3 out of 74 cities met Grade I for air quality in November 2013 [7] and that many cities experience regular episodes of serious smog, with extreme PM2.5 concentrations. PM2.5 concentrations reached as high as 700–900 μg m−3 in Beijing on 12 January 2013 [8], which was far beyond the upper value of 500 μg m−3 indicated in the AQI technical guidelines [9]. The worsening situation has made some cities uninhabitable for human beings [10], with concurrent increases in emergency room visits and hospital admissions due to cardiorespiratory dysfunction [11,12]. While the air quality in Guangxi was good from 2003 to 2012, only a few ambient air quality reports based on the new NAAQS (GB3095-2012) have been published so far, and there appears to be a lack of evaluation in the post-2012 period.
The ambient air quality of 57% (in 2004) to 100% (in 2012) of cities reached Grade II of the NAAQS (GB3095-1996) with API less than 100. Especially in 2012, the ambient air quality in each of the 14 prefecture-level cities in Guangxi reached Grade II of the NAAQS (GB3095-2012) with AQI less than 100, which was the best result over the last decade. In 2013, NAAQS (GB3095-2012) and the Technical Regulation for Ambient Air Quality Assessment (HJ663-2013) were introduced in Nanning, Liuzhou, Guilin, and Beihai. According to results from the new assessment, the number of days with good air quality and with heavy pollution varied; the former decreased significantly, while the percentage of lightly polluted days increased. This result indicates that the ambient air quality may get worse in Guangxi’s key cities if this trend continues. Studies on ambient air quality in the Guangxi region have been carried out in recent years [13,14,15,16,17]; however, those focusing on the analysis of regional areas are fewer, while those investigating air pollution episodes are rare. The worsening of air quality in urban areas is mostly related to local-scale conditions and to the dispersion of air pollutants (regional and long-range) [18], which is worth investigating.
In this study, air pollution characteristics of Nanning, Liuzhou, Guilin, and Beihai were compared and analyzed based on ambient air quality and meteorological data available from the website of the Guangxi Environmental Protection Authority in 2013, when the four cities started to implement new NAAQS (GB3095-2012). The ambient air quality was further analyzed based on the new NAAQS (GB3095-2012) and HJ663-2013, and the factors affecting air pollution were also evaluated. This work has implications for understanding the ambient air pollution characteristics of the key cities in Guangxi and for developing effective air pollution prevention and control measures.

2. Materials and Methods

2.1. Site Description

In 2013, the new NAAQS (GB3095-2012) was implemented in 22 urban ambient air-quality monitoring sites located in four cities, namely Nanning, Liuzhou, Guilin, and Beihai (the numbers of sites in the four cities are 8, 6, 4, and 4, respectively). Among these sites, one background monitoring site was located in each of Nanning, Guilin, and Beihai (see Figure 1). Nanning is located in a flat basin within the Yongjiang valley. The basin is surrounded by mountains on three sides, with the Gaofeng Mountains to the north, Qipogao Crick to the south, and Fenghuang Hill to the west. Pollutants emitted east of Nanning readily accumulate in the valley and are slow to disperse. Liuzhou is also located on flat terrain with mountains to the east, west, and north, and hills within the city. Its dispersion conditions are also poor. Guilin is located in the northeast of Guangxi. As a basin, it is surrounded by the Yuecheng Mountains to the north, the Jiaqiao Mountains to the south, Haiyang Hill to the east, and Taiping Hill to the west. The Hunan-Guangxi railway travels across Guilin. To the north, there is only one narrow valley connecting Hunan through Lingchuan, Xingan, and Quanzhou. To the south, the passage is relatively wide. There is no passage in the east–west direction. Therefore, it looks like a bell-mouth opening to the south. If pollutants are transported from Liuzhou to Guilin, the bell-mouth geography will block the transport to the north and pollutants will accumulate in Guilin. Beihai is low-lying in the north and elevated in the south. There are hills to the northeast and northwest, and tableland and plains to the south. This geography generally leads to favorable pollutant dispersion conditions, but it is vulnerable to external air masses.

2.2. Data Sources

The ambient air-quality monitoring data (hourly and daily mean values) and meteorological data for Nanning, Liuzhou, Guilin, and Beihai during 2013 are from the website (http://sthjt.gxzf.gov.cn/) of the Guangxi Environmental Protection Authority. The air-quality monitoring data included the concentrations of SO2, NO2, PM10, PM2.5, O3, and CO, which were used to calculate the AQI, and the meteorological data contained wind direction, wind speed, relative humidity, air temperature, and precipitation.

2.3. Data Analysis Methods

Based on NAAQS (GB3095-2012) and HJ663-2013, concentrations of the main air pollutants (PM10, PM2.5, SO2, NO2, CO, O3) and pollution levels were assessed for the four cities. Annual average values were used to evaluate PM10 and PM2.5; 24 h average 98th percentile values were used to evaluate SO2 and NO2; 8 h average 90th percentile values were used to evaluate O3; 24 h average 95th percentile values were used to evaluate CO, according to the HJ663-2013. In addition, as per NAAQS, AQI < 50 means ambient air quality is Good; 51 ≤ AQI < 100 means ambient air quality is Moderate; 101 ≤ AQI < 150 means ambient air quality is Lightly Polluted; 151 ≤ AQI < 200 means ambient air quality is Moderately Polluted; 201 ≤ AQI < 300 means ambient air quality is Heavily Polluted; AQI > 300 means ambient air quality is Severely Polluted. The Hybrid Single-Particle Lagrangian Integrated Trajectory (HYSPLIT-4) back trajectory simulation model and meteorological data with 0.5 × 0.5 degree resolution from the Global Data Assimilation System (GDAS) were used to understand the effect of air masses on air pollution processes during different seasons and under different wind directions and speeds. Data for 67 days from three different seasons included winter, spring, and fall (winter: from 9 January 2013 to 31 January 2013; spring: from 2 March 2013 to 13 March 2013; fall: from 1 October 2013 to 31 October 2013) were selected. No air pollution episodes occurred in summer days during the monitored time. Back trajectories at 500 m above the monitoring sites after 48 h (since UTC 0:00) were simulated to study the impacts of local emissions and long-range transport on air quality. The areas that the air masses passed over before reaching the monitoring sites were obtained from the profiles of the trajectories. The speeds of the air masses were calculated based on the length of the trajectories. Remotely sensed firespot information was obtained from the website (https://earthdata.nasa.gov/labs/worldview) of the National Aeronautics and Space Administration, USA.

3. Results and Discussion

3.1. Concentrations of Air Pollutants and Their Variations

In 2013, the annual mean concentration of PM2.5 exceeded the Grade II NAAQS (GB3095-2012) limit value (35 μg m−3) in each of the four cities. The annual mean was highest in Liuzhou (70 μg m−3), followed by Guilin (66 μg m−3), Nanning (57 μg m−3), and Beihai (46 μg m−3). The concentrations of SO2 were highest in Liuzhou, followed by Guilin, Nanning, and Beihai, with 24 h mean 98th percentile values of 80 μg m−3, 77 μg m−3, 52 μg m−3, and 38 μg m−3, respectively. These values, however, were lower than the Grade II NAAQS (GB3095-2012) limit value (150 μg m−3). NO2 concentrations were highest in Nanning, followed by Liuzhou, Guilin, and Beihai, with 24 h average 98th percentile values of 85 μg m−3, 74 μg m−3, 72 μg m−3, and 32 μg m−3, respectively. Except for Liuzhou, NO2 concentrations in the other three cities were lower than the Grade II NAAQS limit value (80 μg m−3). CO concentrations showed a different trend compared to the other pollutants and were highest in Beihai and Guilin, followed by Nanning and Liuzhou, with 24 h average 95th percentile values of 2.1 mg m−3, 2.1 mg m−3, 1.7 mg m−3, and 1.5 mg m−3, respectively. All of these values were lower than the limit values (4 mg m−3) for Grade II in NAAQS (GB3095-2012). O3 concentrations were highest in Liuzhou, followed by Guilin and Beihai, and then Nanning, with 8 h average 90th percentile values of 148 μg m−3, 147 μg m−3, 147 μg m−3, and 124 μg m−3, respectively. Each of these values was lower than the Grade II NAAQS limit value (160 μg m−3). Table 1 shows descriptive statistics for air pollutants in the four cities in 2013.
Figure 2 presents the seasonal variation of pollutants in terms of box plots, including seasonal means, maxima, minima, 75th percentile, 50th percentile, and 25th percentile during spring (March to May), summer (June to August), fall (September to November), and winter (December to February) in each of the cities during 2013.
Variations in seasonal concentrations of the main air pollutants were similar amongst the four cities, except for CO and O3. The concentrations of PM2.5, PM10, SO2, and NO2 were highest during fall and winter, followed by spring, and were at their lowest during summer. These results are similar to previous studies [19,20,21]. Concentrations of CO were highest during spring, fall, and winter in Nanning and Liuzhou and were highest during spring and winter in Guilin and Beihai. For O3, concentrations peaked during fall and winter in each of the cities. This result is similar to those from Pearl River Delta [22], which showed that O3 concentrations were highest during winter, followed by fall, summer, and spring. This may be due to the similar topographical and climatic characteristics of Guangxi and Guangzhou since both are parts of South China. The temperature remains relatively high in October and November in Guangxi, and people usually burn straw in their farmlands during this period. Additionally, the seasonal sugar industry, which is a key industry in Liuzhou and Nanning, begins production in November. Straw and other byproducts are used directly as fuel. The volatile organic compounds from straw burning perhaps lead to photochemical reactions and promote O3 formation. In summertime, due to high cloud layers and the associated reduction in solar radiation influx, the O3 formation process is suppressed, and therefore the concentrations of O3 in this season are lower than those in regions without a rainy season. O3 concentration changes are very different in Jing-Jin-Ji and the Yangtze River Delta [19,20,21,22,23,24], which exhibited the highest levels during summer and the lowest during winter. O3 has a positive correlation with temperature [25], and temperatures in Jing-Jin-Ji and Yangtze River Delta are highest in summer and lowest in winter, leading to suppression of the formation of O3 during the latter season.
The ratio of PM2.5/PM10 at individual locations in the same city exhibited similar seasonal variation characteristics but showed different variation across cities. The average values of the PM2.5/PM10 ratio in Nanning, Liuzhou, Guilin, Beihai were 0.63 (range: 0.52 to 0.88), 0.71 (range: 0.68 to 0.88), 0.76 (range: 0.70 to 0.84), and 0.57 (range: 0.50 to 0.92), respectively, which were higher than those in Beijing (0.55) and Lanzhou (0.52) as per previous studies [16,26], and were similar to those in Guangzhou (0.65) and Chongqing (0.64) [16]. The average values of PM2.5/PM10 ratio in Liuzhou and Guilin were the highest, followed by Nanning, and lowest in Beihai, indicating that PM2.5 was the dominant form of particulate matter in Liuzhou and Guilin.
Figure 3 and Figure 4 present diurnal variations of the main air pollutants during each season (see Figure 3), and on weekdays (Monday to Friday) and weekends (Saturday and Sunday) (see Figure 4), excluding government holidays, in the four cities during 2013.
Figure 3 shows that daily variations in the main air pollutant concentrations varied widely during fall and winter and to a lesser extent during spring and summer. The daily variations were unimodal for O3 and bimodal for PM10, PM2.5, NO2, SO2, and CO.
Daily variations in the concentrations of PM10 and PM2.5 were similar. The first concentration peak appeared between 8:00 and 11:00. At sunrise, anthropogenic activities such as traffic emissions increased because of the morning rush hour, and pollutant emissions from factories also increased. With the increased solar radiation, photochemical reactions intensified and the concentrations of atmospheric particulate matter increased rapidly. Between 11:00 and 16:00, the concentrations of atmospheric particles decreased due to an increase in atmospheric dispersion. After 16:00, solar radiation and atmospheric dispersion decreased. During this time, traffic emissions increased because of the evening rush hour. During the evening, temperatures decreased, creating inversion conditions that accelerated the accumulation of atmospheric particulate matter. Particulate matter concentrations increased significantly after 22:00. The second peak in concentrations occurred between 23:00 and 24:00. The fact that the second peak did not appear during the evening rush hour showed that traffic emissions were not the main driver of particulate matter concentrations; rather, inversion conditions most likely played a much stronger role in increasing particulate matter concentrations than any one source.
Daily variations in the concentrations of SO2 and NO2 were similar to those of PM10 and PM2.5. The only differences were the times when the peak concentrations occurred and the peak values. For SO2 and NO2, the first concentration peak appeared at 8:00, and the second peak appeared at 20:00. For SO2, the morning peak was evident, and the evening peak was weak in Nanning and Liuzhou. Both peaks were clear in Guilin. Concentrations varied slightly, and the second peak was not clear in Beihai. For NO2, the two peaks were clearer in Guilin and Beihai compared with those in Nanning and Liuzhou. Concentrations were at a minimum at noon in each of the cities, which could have been due to the consumption of NO2 during photochemical reactions.
The concentrations of CO were low, and they varied bimodally, similar to NO2 and SO2 concentrations (except during summer in Beihai). The first peak appeared between 6:00 and 8:00, which was earlier than for other pollutants. The second peak occurred between 19:00 and 21:00, consistent with the evening rush hour.
The diurnal variation of O3 was unimodal, with a peak in the afternoon at 13:00–15:00 and lowest concentrations between 6:00 and 8:00, when solar radiation was weak and O3 formation from photochemical reactions was not intense. During the O3 concentration peak period, the concentrations of NO2, SO2, and CO were low, which was because NO2 and CO were precursors for O3 formation and SO2 was oxidized to form SO42−.
A previous study [27] suggested that anthropogenic activities and traffic and industrial emissions were higher during weekdays than during weekends, and concentrations of NOx were higher during weekdays than weekends. From Figure 4, however, it is apparent that concentrations of NO2 were slightly lower during weekdays than during weekends in Beihai and that there were almost no differences in Liuzhou and Guilin. As such, there was no obvious “weekend effect”. The concentrations of PM10 and PM2.5 also showed no obvious “weekend effect” in the four cities. The concentrations of CO in Guilin and those of O3 in Nanning were slightly higher on weekends than on weekdays. Besides these minor differences, there was no obvious “weekend effect”. The “weekend effect” is known to be affected by the factors such as local emissions, meteorological conditions, photochemical reactions, the economic structure, and human activities, and its existence and strength can vary significantly among cities.

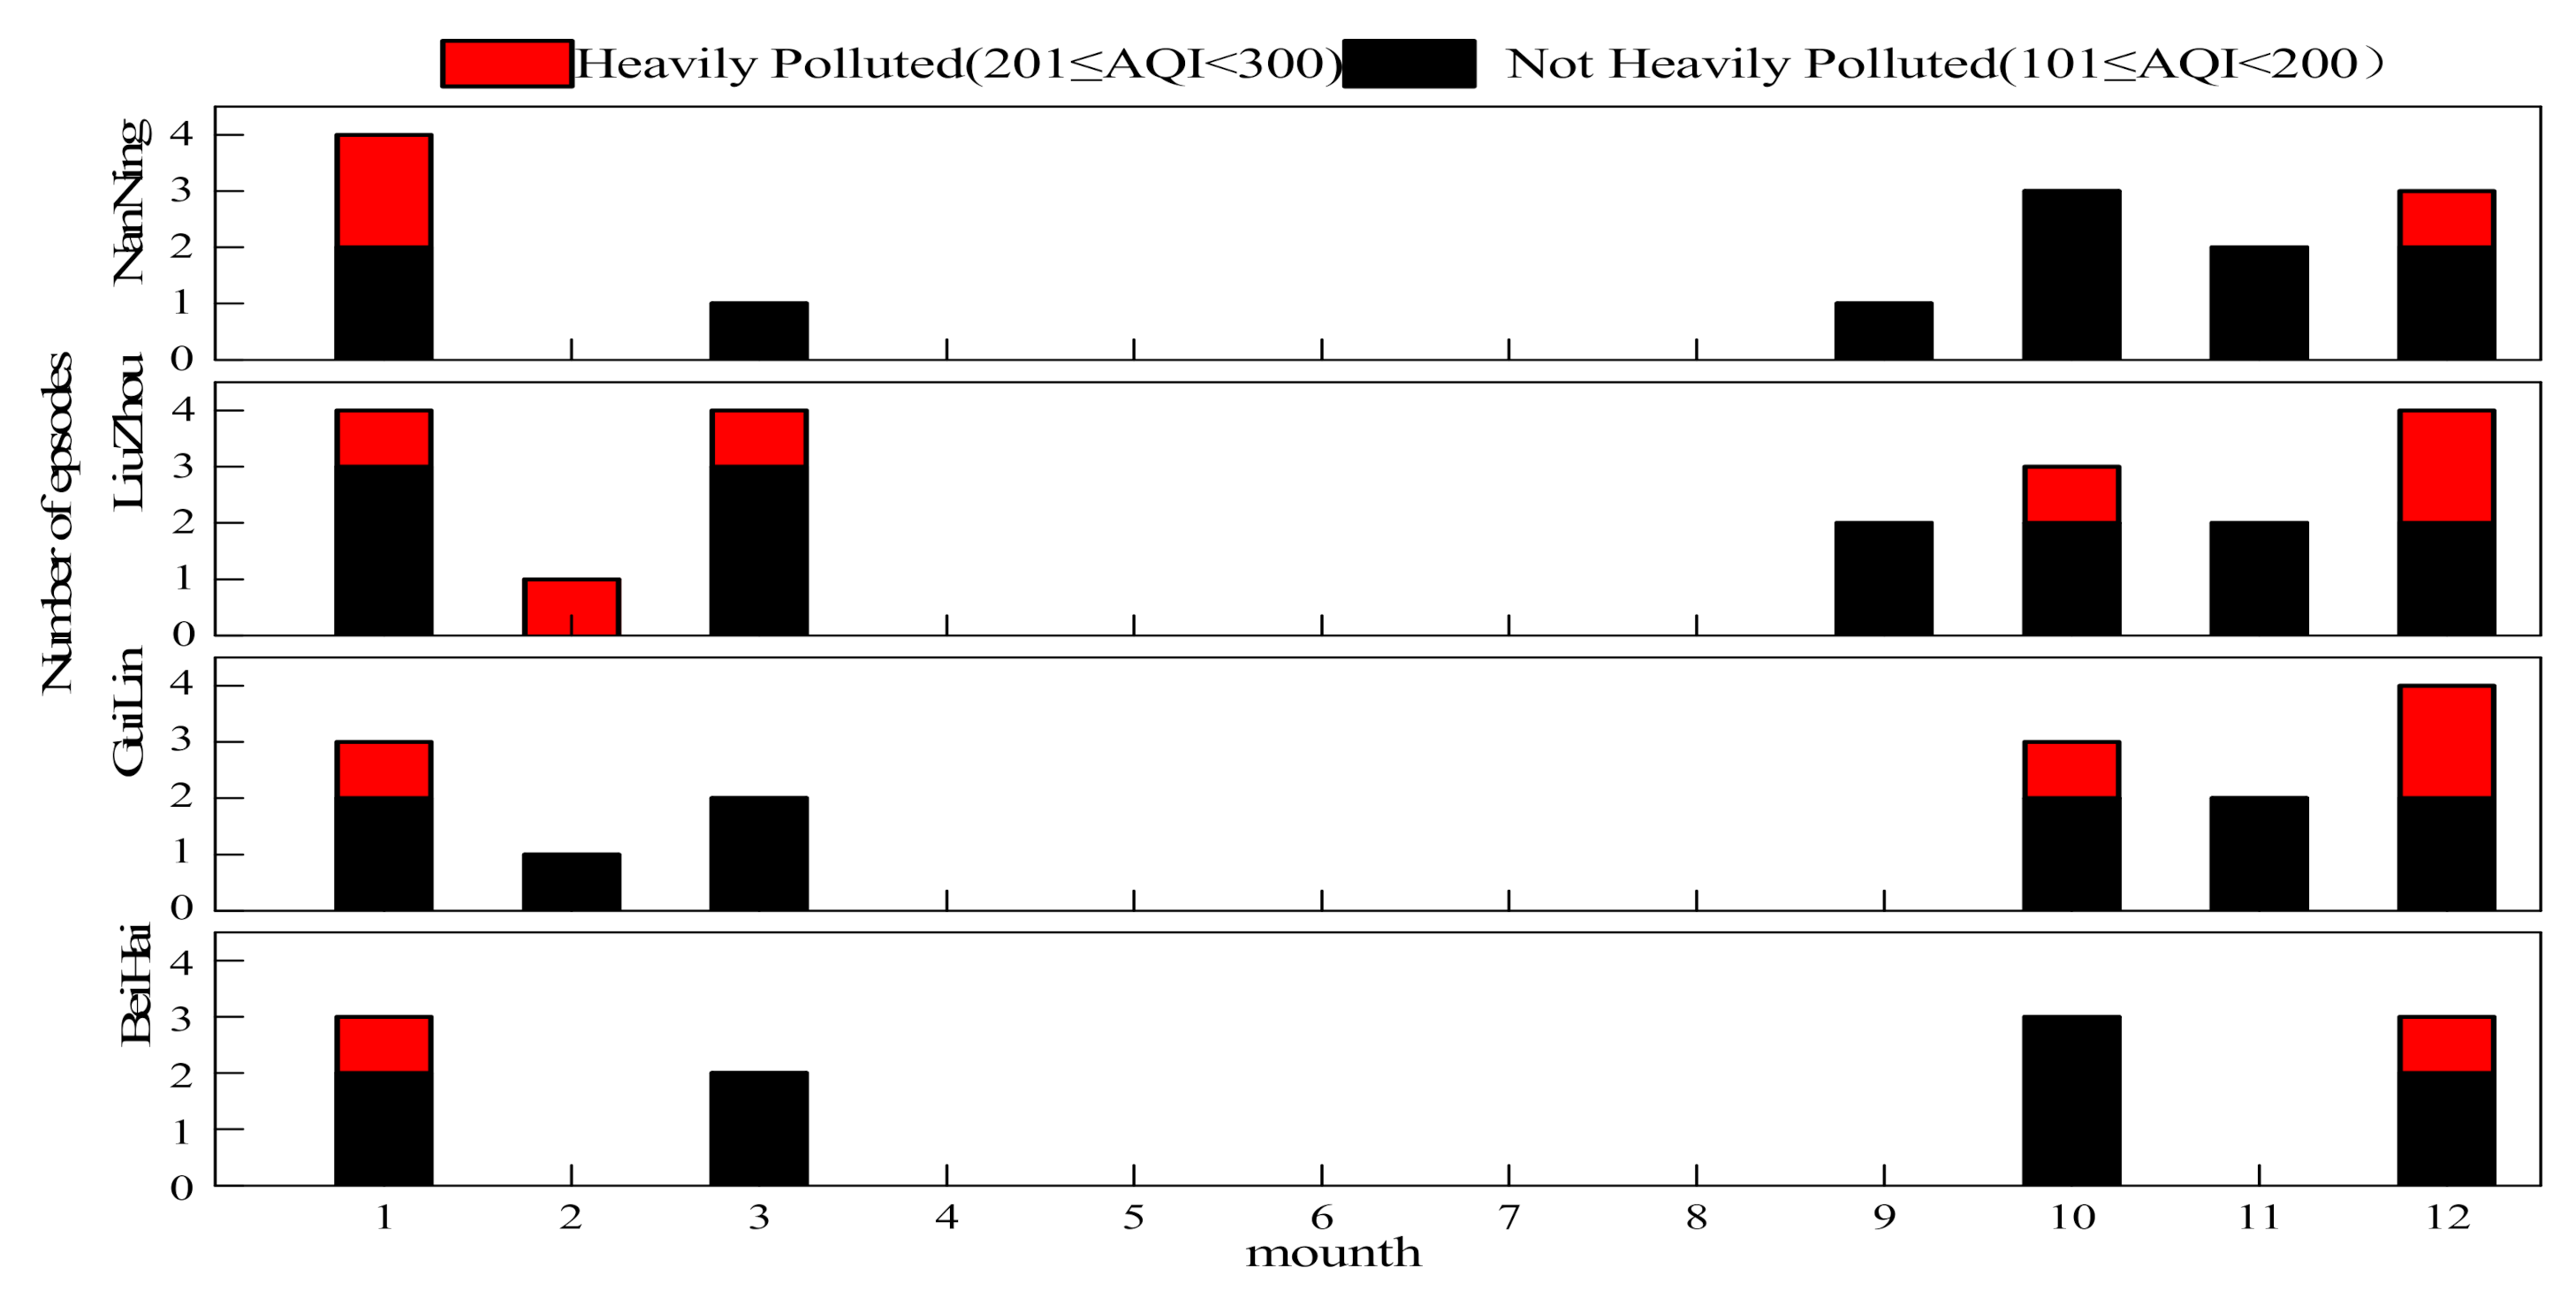
3.2. Special Case Analysis

There were 15, 11, 11, and 9 air pollution episodes (AQI ≥ 101) that occurred during 2013 in Liuzhou, Guilin, Nanning, and Beihai, respectively, and out of these, 7, 4, 3, and 2 events, respectively, were heavy air pollution episodes (201 ≤ AQI < 300). Air pollution episodes occurred in January, February, March, September, October, November, and December, while heavy air pollution episodes occurred in January and December in each of the cities, and in February, March, and October in Liuzhou, and in October in Guilin (see Figure 5). In the four cities, the concentrations of SO2, NO2, PM10, CO, and PM2.5 increased slowly during the pollution episodes, possibly due to stagnant accumulated conditions, which has been described before [28]. The pollution episode durations were similar in January, March, October, and December in the four cities (Table 2).
Non-attainment and primary pollutants were similar during the air pollution episodes in the four cities. The non-attainment pollutants were PM10 and PM2.5, and the primary pollutant was PM2.5 in January, March, and December. O3 became one of the non-attainment and primary pollutants in October and November in each of the cities and was also one of the primary pollutants in December in Beihai. Pollution durations in January, October, and December were longer than those in March in each of the cities. Pollution levels were heaviest in Liuzhou and Guilin, followed by Nanning and then Beihai. From a meteorological standpoint, precipitation was extremely low during the pollution periods in all of the cities. The predominant wind direction was east in Nanning; south, southeast, and southwest in Liuzhou and Guilin; and west, southwest, and northwest in Beihai. Wind speeds were low. The average wind speed during each pollution episode was less than 1.5 m s−1 (0.7 m s−1 to 1.2 m s−1) in Nanning and Liuzhou, while that in Guilin and Beihai was from 0.8 m s−1 to 1.8 m s−1. The mean relative humidity was less than 85%. It ranged from 61% to 82% in Beihai, which was higher than that measured in Nanning, Liuzhou, and Guilin (from 48% to 76%).
The meteorological conditions were not good in Guangxi during the last 10 days of December in 2013. The humidity and wind speeds were low, and there was little rainfall. The conditions were not conducive to the dispersion of pollutants and caused low visibility in Guangxi. Air pollution episodes occurred around 20 December 2013 in the four cities. Heavy pollution appeared in Nanning (from 20 to 31 December 2013), Liuzhou (from 20 to 27 December 2013 ), and Guilin (from 19 to 26 December 2013). Moderate pollution occurred in Beihai (from 21 and 31 December 2013). During the pollution episodes, concentrations of the main air pollutants varied in a similar fashion (Figure 6).
In Nanning, light pollution occurred on 20 December. The pollutant concentrations slowly increased, and heavy pollution formed on 22 December that lasted for 5 days. After this episode, the pollutant concentrations decreased to low levels on 27 December. On 30 December, however, the concentrations of PM10 and PM2.5 increased significantly, and the pollution level changed from light pollution to moderate pollution. Heavy pollution occurred again on 31 December. From a meteorological perspective, the dominant wind directions were southeast and east during the episode. Wind speeds were low, varying from 0.8 to 1.2 m s−1. During 20 and 26 December, the relative humidity was 50–54%. It decreased to 38% on 27 December and down to 30% on 29 December. It then increased to 46% on 30 December and to 54% on 31 December.
The pollution episode in Liuzhou was similar to that in Nanning. Light pollution occurred on 20 December. Pollutant concentrations slowly increased, and heavy pollution formed on 22 December and lasted for 2 days. After this, the pollutant concentrations decreased to low levels on 24 December and air quality became good or moderate on 28 December and lasted 2 days. During 30 and 31 December, however, the concentrations of PM10 and PM2.5 increased significantly and moderate pollution occurred. Visibility showed the opposite trend. From a meteorological perspective, the dominant wind direction was southwesterly during the episode. Wind speeds were low, varying from 0.6 m s−1 to 1.2 m s−1. On 20 and 23 December, the relative humidity ranged from 53 to 54%. It decreased to 38% on 24 December and then to 31% on 27 December.
In Guilin, the air pollution episode occurred 1 day earlier than in Nanning and Liuzhou. Light pollution occurred on 19 December, and pollutant concentrations increased until heavy pollution formed on 21 December, which lasted for 2 days. Pollutant concentrations then decreased to low levels on 24 December, and air quality was good or moderate on 27 December, which lasted for 3 days. During 30 and 31 December, however, the concentrations of PM10 and PM2.5 increased significantly and moderate pollution occurred. Visibility showed the opposite trend. From a meteorological perspective, the dominant wind directions were southeast and south during the episode. The wind speeds were higher than those in Nanning and Liuzhou. Speeds ranged from 1.7 to 2.3 m s−1 between 19 and 21 December and decreased to 1.2–1.6 m s−1 between 22 and 25 December. Wind speeds then increased to 2.6 m s−1 on 26 December, which helped to disperse pollutants and led to good air quality on 27 December. Between 19 and 22 December, the relative humidity ranged from 48 to 57%. It decreased to 44% on 23 December and then to 23% on 29 December. After this, it increased to 44% on 31 December.
Pollution levels were lower in Beihai, and the air pollution episode occurred 1 day later than in other cities. Light pollution occurred on 21 December, and pollutant concentrations slowly increased until heavy pollution formed on 22 December and lasted until 24 December. Pollutant levels then decreased, leading to light pollution episodes between 25 and 31 December. Visibility showed the opposite trend. From a meteorological perspective, the dominant wind direction was westerly, and the relative humidity ranged from 50% to 64% over the period.

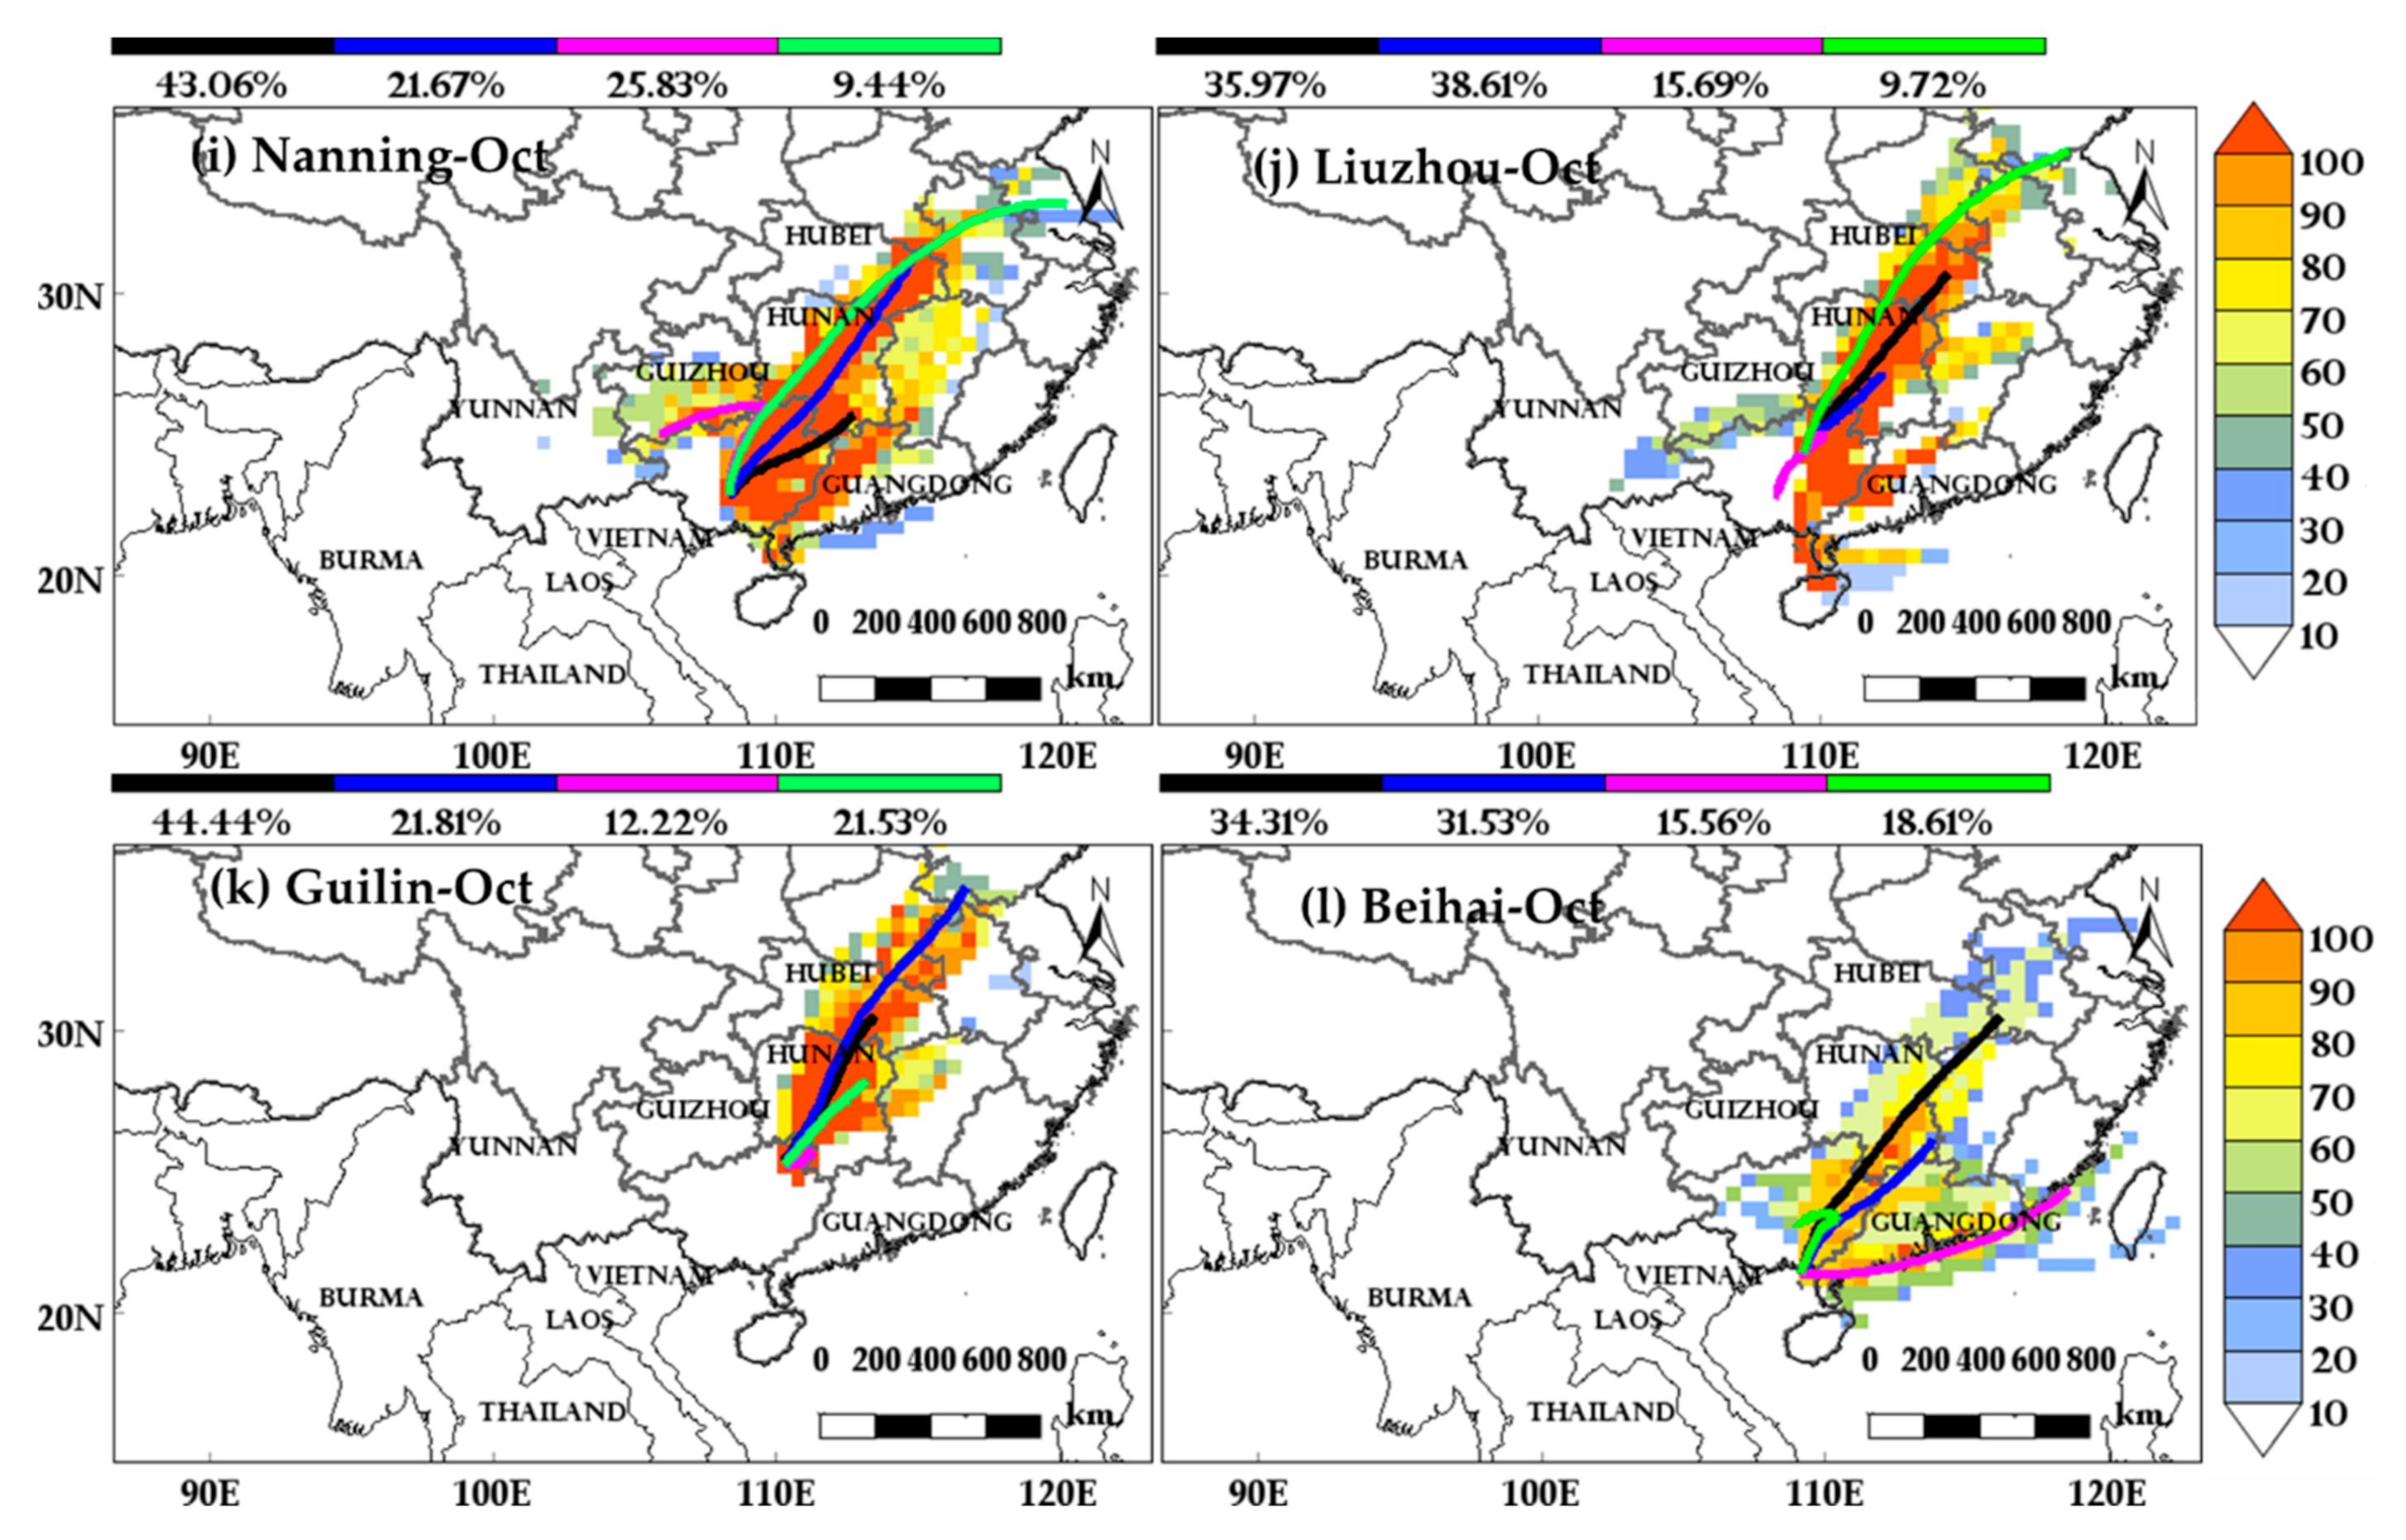
3.3. Analysis of Factors Affecting Air Quality

Although air pollution showed regional variation characteristics in the four cities, the pollution duration and levels were different. Pollution was more serious in Liuzhou and Guilin than in Nanning and Beihai. This could be caused by the differences in pollution diffusion and air mass transport, which were impacted by the pollution emission and weather conditions in each city.
According to the Guangxi Statistical Yearbook 2013 (http://tjj.gxzf.gov.cn/tjsj/tjnj/), Environmental Statistic Data 2013 and Nanning Ambient Air Quality Control Planning Report (http://sthjt.gxzf.gov.cn/), SO2, NO2, and CO are mainly emitted from industrial and vehicular emissions in the four cities. Particulate matter (PM10 and PM2.5) mainly originated from dust and industrial emissions. Volatile organic compounds mainly originated from natural sources and industrial and vehicular emission. In 2013, emissions of SO2, NOx, and dust from industrial emission sources were highest in Liuzhou, followed by Guilin, Nanning, and Beihai. Emissions of particulate matter, SO2, NOx, and CO from vehicles were highest in Liuzhou, followed by Guilin, Nanning, and Beihai. Emissions of particulate matter (PM10 and PM2.5) from dust were highest in Nanning, followed by Liuzhou, Guilin, and Beihai. Pollutant emissions in Beihai were lower than those in the other cities.
Pollution levels are closely related to the prevailing meteorological conditions according to the findings of many previous studies [19,28,29,30,31]. In this study, pollution episodes and clear days, along with precipitation, wind direction, wind speed, and relative humidity on polluted and non-polluted days during the three seasons (spring, fall, and winter) in the four cities were statistically analyzed to display the differences between heavily polluted episodes and normal days/clear days. The results showed that most rainfall was light during spring, fall, and winter. In Nanning, Liuzhou, Guilin, and Beihai, the percentage of rainy days was 23%, 29%, 27%, and 23%, respectively, during pollution periods (AQI ≥ 101), and 44%, 48%, 52%, and 37%, respectively, during non-pollution periods (AQI < 101). The percentage of precipitation during PM2.5 pollution periods was low during spring, fall, and winter, with values of 4%, 16%, 9%, and 7% in Nanning, Liuzhou, Guilin, and Beihai, respectively. This highlights that precipitation had a large effect on PM2.5 pollution. Humidity and wind speeds were lower during pollution periods than during non-pollution periods. Generally, pollutant concentrations peaked when wind speeds and humidity were lowest, and the opposite occurred when wind speeds and humidity were highest. Low wind speeds lead to reduced particulate matter dispersion and this allows particle concentrations to increase substantially. Temperatures are high during summer in Guangxi, and therefore the boundary layer is higher and it is easier for air pollutants to disperse. Therefore, there was less air pollution during summer. Pearson’s correlation raw analysis was carried out to decipher and quantify the possible relationships between different pollutants and meteorological parameters. Pearson correlation analysis between meteorological parameters and the main primary pollutant concentration (PM2.5) showed that there were significant negative correlations (p < 0.01) between wind speed, air pressure, relative humidity, precipitation, visibility, and the concentration of PM2.5 (Table 3).
Table 4 shows that wind directions were mainly southerly or southeasterly during pollution periods in Nanning, Liuzhou, and Guilin, and wind directions showed little change during non-pollution periods, except that the percentages of different wind directions were different. In Guilin, for example, the main wind directions were southerly and southeasterly during pollution and non-pollution periods during spring, fall, and winter. The percentage of southerly winds decreased from 38% to 36%, and the percentage of southerly and southeasterly winds increased from 17% to 36% during spring. During fall, the percentage of southerly winds decreased from 48% to 26% and the percentage of southerly and southeasterly winds slightly decreased from 28% to 26%. During winter, the percentage of southerly winds decreased from 40% to 17%, and the percentage of southerly and southeasterly winds increased from 28% to 45%.
The meteorological conditions in Beihai were different from those of the other three cities. As a coastal city, its wind directions were mainly westerly and southwesterly. Similarly to the other three cities, there was little change in the main wind direction during pollution and non-pollution periods, but the percentages of wind directions were different. This shows that wind direction can have important impacts on air pollutant concentrations.
Figure 7 shows the cluster analysis of trajectories and the analysis of concentration weighted trajectories (CWT) [18] during the three pollution seasons (January in winter, March in spring, and October in autumn) in four cities. Results show that airflows reaching the four cities in the three seasons mainly come from non-local areas (outside Guangxi), with a total frequency of more than 50%, but this does not mean that long-distance transportation is the main factor causing pollution incidents. As shown in Figure 7a–d, the occurrence frequency of air masses reaching the four cities from non-local areas in winter are about 50%, 60%, 50%, and 100%, respectively. Combined with the CWT analysis, it is shown that non-local airflows with higher AQI are the main cause of pollution in Liuzhou (about 50% in Figure 7b) and Guilin (about 60% in Figure 7c), while pollution in Nanning (Figure 7a) and Beihai (Figure 7d) is mainly due to local emissions. In spring (Figure 7e–h), 90% of the airflow in Nanning City comes from non-local areas, but the AQI value of these airflows are low, whereas that of airflows from local areas are higher. The airflows in the Liuzhou and Guilin cluster trajectories are all AQI hotspots (high value more than 100), while those from the non-local areas of Liuzhou and Guilin are as high as 100% and 70%, which indicates that Liuzhou and Guilin are strongly affected by long-distance transportation in spring, mainly from in the northeast (e.g., Hunan and Hubei regions) and the western region of the Pearl River Delta. It can be seen from Figure 7h that the AQI in Beihai is lower than in the other three cities in spring because the airflows come from a relatively clean sea area. In the autumn (Figure 7i–l), the cluster trajectories of the four cities are associated with high AQI, and the airflows mainly come from Hunan and Hubei provinces in the northeast of Guangxi. There is another cluster trajectory in western Guangdong, which is also associated with high AQI. This shows that autumn pollution incidents in the four cities of Guangxi were greatly affected by regions outside Guangxi, which highlights the importance of joint prevention and control.
From satellite-based fires-pot analysis (https://earthdata.nasa.gov/labs/worldview), it is apparent that there were large-scale fire points to the west (Yunnan) and southwest (Thailand, Myanmar, and Vietnam) of Guangxi in January (winter) 2013. In addition to Liuzhou, the other three cities have similar cluster trajectories through Yunnan and Guizhou, and the AQI associated with the trajectories is high. The fire points in March (spring) were located in the southwest of Guangxi, where the airflows have a higher AQI. In October (fall), they were centralized in Guangxi and located to the northeast, and AQIs in the airflows from the northeast were high. In general, air pollution during winter (January) in Nanning and Liuzhou is mainly influenced by local emission sources, while that in Liuzhou and Guilin is mainly influenced by long-distance transportation from the south and northeast of Guangxi. In spring, air pollution in cities is mainly influenced by local straw burning emission in the south of Guangxi. The air pollution in fall is affected by long-distance transportation from the northeast of Guangxi (e.g., Hunan and Hubei province).

4. Conclusions

We used pollutant concentrations to evaluate the air quality in four cities in the Guangxi region during 2013. PM2.5 pollution was the heaviest, followed by O3, PM10, and NO2, while the concentrations of SO2 and CO were lower than the Grade II NAAQS limit values in each of the cities. Pollution was the most serious in Liuzhou and Guilin, followed by Nanning and then Beihai. Concentrations of PM2.5, PM10, NO2, and SO2 were low during summer and high during fall and winter. Concentrations of O3 were high during fall and low during the other seasons in each of the cities. Concentrations of CO were high during spring, fall, and winter, and low during summer in Nanning and Liuzhou, while they were high during spring and winter and low during summer and fall in Guilin and Beihai. Diurnal variations in O3 concentrations were unimodal, with concentrations peaking at noon. Each of the other pollutants had bimodal diurnal variations, with the peaks occurring in the morning and evening. Daily variations in the concentrations of the main pollutants showed no obvious “weekend effect”.
Pollution episodes showed regional characteristics; however, the pollution levels and durations for each city were different because of differences in the main pollution sources, geographies, and weather conditions. During pollution periods, wind speeds, humidity, and precipitation were usually low. The influences of outside air masses were similar in each of the cities. Pollution was mostly constrained by local emission sources in the spring, while that in autumn was mainly affected by long-distance transportation from Hunan and Hubei. In winter, air pollution in Nanning and Beihai was mainly affected by local emission sources, while that in Liuzhou and Guilin were mostly affected by long-distance transportation from the provinces of Guangdong, Hunan, and Hubei.
Recently, achievements have been made in the control of SO2 and NOX emissions in the four cities, and SO2 and NOX pollution is not high in these cities. PM2.5 and PM10 pollution, however, is heavy. We suggest that Guangxi authorities focus on the control of atmospheric particulate matter and its precursors, the control of particulate matter emissions from industrial and vehicular sources and construction sites, and the control of seasonal pollution sources such as the sugar industry and straw burning. Authorities should also focus on reducing the production of O3 precursors. Regional air-quality management and joint prevention measures should be taken to improve regional air quality.
It is suggested that Chinese authorities cooperate with Southeast Asian countries, taking the opportunity of the China-ASEAN Expo to develop regional joint prevention measures during pollution periods. This would improve the ambient air quality in South and Southeast Asia as a whole.

Author Contributions

All authors made great contributions to this study. Conceptualization, Z.-M.C. and Z.-K.J.; methodology, Z.-Y.M.; software, H.-J.L. (Hong-Jiao Li); validation, Z.-K.J., F.M., and B.C.; formal analysis, H.-J.L. (Hui-Jiao Ling); investigation, Z.-K.J.; resources, J.-Y.M.; data curation, B.C.; writing—original draft preparation, J.-Y.M.; writing—review and editing, J.-Y.M.; visualization, J.-Y.M.; supervision, H.-J.L. (Hong-Jiao Li); project administration, H.L.; funding acquisition, H.L. All authors have read and agreed to the published version of the manuscript.

Funding

Analysis of Multiple Causes of Atmospheric Ozone Pollution in Urban Agglomerations of Chengdu Plain and Development of Management, Prevention and Control System (No. 510201201905430).

Data Availability Statement

The ambient air-quality monitoring data (hourly and daily mean values) and me-teorological data for Nanning, Liuzhou, Guilin, and Beihai during 2013 are from the website (http://sthjt.gxzf.gov.cn/) of the Guangxi Environmental Protection Authority. The air-quality monitoring data included the concentrations of SO2, NO2, PM10, PM2.5, O3, and CO, which were used to calculate the AQI, and the meteorological data con-tained wind direction, wind speed, relative humidity, air temperature, and precipitation.

Acknowledgments

The authors appreciate the support from the operation and maintenance teams of the environment observation stations in Nanning, Liuzhou, Guilin, and Beihai. We are also thankful for the data from the quality-control personnel in the Guangxi Environmental Monitoring Center. We also acknowledge the help provided by Kai-Zhang, Zhengzheng-Zhang, Fang-Bi, Qi-Cheng, and Xiaohui-Du from the Chinese Research Academy of Environmental Sciences, finally, many thanks to Sayantan Sarkar for his help with the English language polishing.

Conflicts of Interest

All authors declare that there is no conflict of interest.

References

  1. Chen, W.; Wang, F.; Xiao, G.; Wu, K.; Zhang, S. Air Quality of Beijing and Impacts of the New Ambient Air Quality Standard. Atmosphere 2015, 6, 1243–1258. [Google Scholar] [CrossRef] [Green Version]
  2. Zhao, B.; Su, Y.; He, S.; Zhong, M.; Cui, G. Evolution and comparative assessment of ambient air quality standards in China. J. Integr. Environ. Sci. 2016, 13, 85–102. [Google Scholar] [CrossRef] [Green Version]
  3. Chen, Y.; Bai, Y.; Liu, H.; Alatalo, J.M.; Jiang, B. Temporal variations in ambient air quality indicators in Shanghai municipality, China. Sci. Rep. 2020, 10, 11350. [Google Scholar] [CrossRef] [PubMed]
  4. Jiang, B.; Li, Y.; Yang, W. Evaluation and Treatment Analysis of Air Quality Including Particulate Pollutants: A Case Study of Shandong Province, China. Int. J. Environ. Res. Public Health 2020, 17, 24. [Google Scholar] [CrossRef]
  5. Han, L.; Zhou, W.; Pickett, S.T.; Li, W.; Qian, Y. Multicontaminant air pollution in Chinese cities. Bull. World Health Organ. 2018, 96, 233. [Google Scholar] [CrossRef]
  6. Zhang, Q.; Zheng, Y.; Tong, D.; Shao, M.; Wang, S.; Zhang, Y.; Xu, X.; Wang, J.; He, H.; Liu, W.; et al. Drivers of improved PM2.5 air quality in China from 2013 to 2017. Proc. Natl. Acad. Sci. USA 2019, 116, 24463–24469. [Google Scholar] [CrossRef] [Green Version]
  7. Ministry of Environmental Protection. MEP Releases Air Quality of Key Regions and 74 Cities in November. Available online: http://english.mep.gov.cn/News_service/news_release/201401/t20140106_266046.htm# (accessed on 19 January 2021).
  8. United States Environmental Protection Agency‎. 2009; AQIA Guide to Air Quality and Your Health. Available online: http://www.epa.gov/airnow/aqi_brochure_08-09.pdf (accessed on 1 January 2021).
  9. Beijing’s Air Pollution Episode (January 2013). Available online: http://cleanairinitiative.org/portal/node/11599 (accessed on 1 January 2014).
  10. South China Morning Post. Pollution Makes Beijing almost Uninhabitable for Human Beings. Available online: http://www.scmp.com/news/china/article/1426587/pollution-makes-beijing-almost-uninhabitable-human-beings (accessed on 1 January 2021).
  11. Wong, C.M.; Vichit-Vadakan, N.; Kan, H.; Qian, Z. Public Health and Air Pollution in Asia (PAPA): A multicity study of short-term effects of air pollution on mortality. Environ. Health Perspect. 2008, 116, 1195–1202. [Google Scholar]
  12. Liu, L.; Breitner, S.; Schneider, A.; Cyrys, J.; Brüske, I.; Franck, U.; Schlink, U.; Leitte, A.M.; Herbarth, O.; Wiedensohler, A.; et al. Size-fractioned particulate air pollution and cardiovascular emergency room visits in Beijing, China. Environ. Res. 2013, 121, 52–63. [Google Scholar] [CrossRef]
  13. Huang, L.H. Urban Air Pollution Index and Countermeasures Analysis-A Case from Nanning of Guangxi. J. Guilin Univ. Technol. 2013, 33, 364–370. [Google Scholar]
  14. Zhu, Y.; Hu, H.S.; Zhang, X.Y. Research of pollution levels of the airborne particulate matter (TSP, PM10, PM2.5) in Nanning City. Environ. Pollut. Control 2004, 26, 176–177. [Google Scholar]
  15. Jiang, Y.Y. The Analysis of the Variation Trend of Ambient Air Quality in Cities of Guangxi. J. Guangxi Acad. Sci. 2011, 27, 95–98. [Google Scholar]
  16. Wu, G.P.; Teng, E.J.; Wei, F.S. PM2.5 and PM10 pollution level in the four cities in China. J. China Environ. Sci. 1999, 19, 133–137. [Google Scholar]
  17. Tang, L.L.; He, L.; Chen, J.B.; Guo, K.X.; Xiao, Q.; Wei, J.J. Analysis on Spatial temporal Characteristics of Particulate Pullutant and Meteorological Condition during a Serious Air Pollution in Nanning. J. Guangxi Acad. Sci. 2012, 28, 302–305. [Google Scholar]
  18. Bodor, Z.; Bodor, K.; Keresztesi, Á.; Szép, R. Major air pollutants seasonal variation analysis and long-range transport of PM10 in an urban environment with specific climate condition in Transylvania (Romania). Environ. Sci. Pollut. Res. 2020, 27, 38181–38199. [Google Scholar] [CrossRef]
  19. An, J.L.; Wang, Y.S.; Li, X.; Sun, Y.; Shen, S.H. Analysis of relationship between CO and wind-speed in Beijing. Ecol. Environ. 2008, 17, 53–157. [Google Scholar]
  20. Xu, P.; Hao, Q.J.; Ji, D.S.; Zhuang, J.K.; Liu, Z.R.; Hu, P.; Wang, Y.S.; Jiang, C.S. Observation of Atmospheric Pollutants in the Urban Area of Beibei District, Chongqing. Enviromental Sci. 2014, 35, 821–829. [Google Scholar]
  21. Liu, J.; Zhang, X.L.; Xu, X.F.; Xu, H.J. Comparison Analysis of Variation Characteristics of SO2, NOx, O3 and PM2.5 Between Rural and Urban Areas, Beijing. Enviromental Sci. 2009, 29, 1060–1065. [Google Scholar]
  22. Wang, X.M.; Han, Z.W.; Lei, X.E. Study on Ozone Concentration Change of Guangzhou District. Acta Sci. Nat. Univ. Sunyatseni 2003, 42, 106–109. [Google Scholar]
  23. Shao, P.; Wang, L.L.; An, J.L.; Zhou, Y.L.; Wang, Y.S. Observation and Analysis of Air Pollution in Zhangjiakou, Hebei. Enviromental Sci. 2012, 33, 2539–2545. [Google Scholar]
  24. Huang, L.M.; Wang, G.H.; Wang, H.; Gao, S.X.; Wang, L.S. Pollution level of the airborne particulate matter (PM10, PM2.5) in Nanjing City. China Environ. Sci. 2002, 22, 334–337. [Google Scholar]
  25. Zhang, H.; Wang, Y.; Hu, J.; Ying, Q.; Hu, X.-M. Relationships between meteorological parameters and criteria air pollutants in three megacities in China. Environ. Res. 2015, 140, 242–254. [Google Scholar] [CrossRef] [PubMed]
  26. Yang, F.M.; He, K.B.; Ma, Y.L.; Zhang, Q.; Yu, X.C. Variation characteristics of PM2.5 concentration and its relationship with PM10 and TSP in Beijing. China Environ. Sci. 2002, 22, 506–510. [Google Scholar]
  27. Guo, T.; Ma, Y.L.; He, K.B. Study on spatial distributions of PM2.5/PM10 in regional atomospheric environment. Chin. J. Environ. Eng. 2009, 3, 147–150. [Google Scholar]
  28. Li, L.J.; Wang, Y.; Li, J.X.; Xin, L.Z.; Jin, J. The analysis of heavy air pollution in Beijing during 2000~2010. China Environ. Sci. 2012, 32, 23–30. [Google Scholar]
  29. Fang, G.C.; Chang, S.C. Atmospheric particulate (PM10 and PM2.5) mass concentration and seasonal variation study in the Taiwan area during 2000~2008. Atmos. Res. 2010, 98, 368–377. [Google Scholar] [CrossRef]
  30. Chen, M.L.; Mao, I.F.; Lin, I.K. The PM2.5 and PM10 particulates in urban areas of Taiwan. Sci. Total Environ. 1999, 22, 227–235. [Google Scholar] [CrossRef]
  31. He, K.B. Atmospheric Particulate Matter and Regional Compound Pollution; Science Press: Beijing, China, 2011. [Google Scholar]
Figure 1. Monitoring sites in the four cities. Red dots indicate background stations far away from human activity; blue dots indicate urban stations.
Sustainability 13 01612 g001
Figure 2. Seasonal variation of air pollutants in the four cities. Note: sp, su, au, wi, represent spring, summer, autumn, winter, respectively.
Sustainability 13 01612 g002aSustainability 13 01612 g002b
Figure 3. Diurnal cycles of air pollutants during each season in the four cities.
Sustainability 13 01612 g003
Figure 4. Diurnal cycles of air pollutants during weekdays (Monday to Friday) and weekends (Saturday and Sunday) in the four cities.
Sustainability 13 01612 g004
Figure 5. Monthly variations of air pollution episodes in the four cities.
Sustainability 13 01612 g005
Figure 6. Main pollutant concentrations and meteorological parameters during pollution episodes.
Sustainability 13 01612 g006
Figure 7. Back trajectories analysis in different seasons (ad) are for winter during January, (eh) are for spring during March, and (il) are for fall during October) of the four cities. Weighted Average Air Quality Index (AQI) values are shown on the color map; the color lines on the map represent cluster-mean trajectories obtained for different seasons (spring, fall, and winter) in the four cities.
Sustainability 13 01612 g007aSustainability 13 01612 g007b
Table 1. Concentrations of air pollutants in the four cities in 2013 (the units for SO2, NO2, PM10, O3-8 h, PM2.5 are μg m−3; the unit for CO is mg m−3).
CityValuesSO2NO2PM10COO3-8 hPM2.5
Std (Grade II)604070416035
Nanningaverage19389017956
max63932783176195
min6141411112
Liuzhouaverage34328919869
max112842792262245
min712180815
Guilinaverage27318318766
max98892623210184
min31091010
Beihaiaverage17135419242
max49421664224272
min63141225
Table 2. Characteristics of pollution episodes in the four cities.
CityDurationNAPPPPollution ProcessAWS
(m s−1)
MRH
(%)
LWD
Nanning1.10–1.16PM2.5, PM10PM2.5Heavily Polluted0.971E
1.22–1.29PM2.5, PM10PM2.5Heavily Polluted1.067E
3.4–3.8PM2.5, PM10PM2.5Moderately Polluted1.155E
10.3–10.6PM2.5, PM10, O3PM2.5, O3Moderately Polluted1.253E
10.10–10.17PM2.5, PM10, O3PM2.5, O3Moderately polluted1.355E
10.25–10.31PM2.5, PM10, O3PM2.5, O3Moderately polluted1.150E
11.31–12.13PM2.5, PM10PM2.5Moderately Polluted1.056E
12.20–12.31PM2.5, PM10, NO2PM2.5Heavily Polluted1.048ESE
Liuzhou1.9–1.16PM2.5, PM10PM2.5Heavily Polluted0.775WSS
1.18–1.21PM2.5, PM10PM2.5Moderately Polluted0.667S/ESS/WSS
1.23–1.30PM2.5, PM10PM2.5Heavily Polluted0.769WSS
2.24–2.26PM2.5, PM10PM2.5Heavily Polluted0.582S/ESS/WSS
3.4–3.11PM2.5, PM10PM2.5Heavily Polluted0.756ES
3.14–3.16PM2.5, PM10PM2.5Moderately Polluted0.867ESS
3.19–3.21PM2.5, PM10PM2.5Moderately Polluted0.770ESS
10.3–10.18PM2.5, PM10, O3PM2.5, O3Moderately Polluted1.156ESS
10.23–11.1PM2.5, PM10, O3PM2.5, O3Heavily Polluted0.865ESS
12.2–12.14PM2.5, PM10PM2.5Heavily Polluted0.859S/WS
12.20–12.27PM2.5, PM10PM2.5Heavily Polluted1.048WS
Guilin1.9–1.20PM2.5, PM10PM2.5Moderately Polluted1.167S
1.23–1.30PM2.5, PM10PM2.5Heavily Polluted0.965WSS
2.24–2.26PM2.5PM2.5Moderately Polluted0.781WSS
3.5–3.12PM2.5, PM10PM2.5Moderately Polluted0.956ESS
3.14–3.17PM2.5, PM10PM2.5Moderately Polluted1.276S/ESS/WSS
10.3–10.15PM2.5, PM10, O3PM2.5, O3Moderately Polluted1.747S
10.20–10.31PM2.5, PM10, O3PM2.5, O3Heavily Polluted1.458WSS
12.5–12.14PM2.5, PM10PM2.5Heavily Polluted1.254S
12.19–12.26PM2.5, PM10PM2.5Heavily Polluted1.846ESS
Beihai1.19.1.20PM2.5PM2.5Moderately Polluted1.679WSW
1.23–1.30PM2.5PM2.5Heavily Polluted1.782W/WNW
3.5–3.12PM2.5, PM10PM2.5Moderately Polluted1.275WS
3.14–3.17PM2.5, PM10PM2.5Moderately Polluted1.978W
10.3–10.7PM2.5PM2.5Moderately Polluted1.761WSW
10.16–10.18PM2.5PM2.5Moderately Polluted0.877WNW
10.23–10.28PM2.5, O3PM2.5, O3Moderately Polluted1.761WSW
12.4–12.13PM2.5, O3PM2.5, O3Heavily polluted0.977W
12.21–12.31PM2.5, O3PM2.5, O3Moderately Polluted0.861W
Note: NAP, PP, AWS, MRH, LWD represent Non-attainment pollutants, Primary pollutants, Average wind speed, Mean relative humidity, and Leading wind direction, respectively.
Table 3. Pearson correlations between meteorological parameters and the main primary pollutant (PM2.5) during the three typical pollution seasons.
CityWSWDTPRHPRCPV
Nanning−0.418 **0.264 **−0.434 **0.095−0.344 **−0.178 **−0.657 **
Liuzhou−0.317 **0.086−0.298 **0.144 **−0.215 **−0.189 **−0.582 **
Guilin−0.232 **0.062−0.339 *0.470 **−0.296 **−0.225 **−0.638 **
Beihai−0.312 **0.087−0.2920.43 **−0.205 **−0.187 **−0.584 **
Note: * means the correlation is significant at the 0.05 level; ** means the correlation is significant at the 0.01 level. WS, wind speed; WD, wind direction; T, temperature; P, precipitation RH, relative humidity; PRCP, precipitation and V, visibility, respectively.
Table 4. Main wind direction frequency statistics during spring, fall, and winter in the four cities.
CityAir Quality
Status
Season
SpringFallWinter
NanningPollution DaysSE (40%), S (30%)SSE (34%)SSW (30%), SSE (30%)
Non-Pollution DaysESE (45%), SE (34%)SE (12%), SSE (12%), S (12%)ESE (31%)
LiuzhouPollution DaysSSE (36%), S (36%), SE (30%)SSE (24%), S (24%)S (20%), SSE (18%)
Non-Pollution DaysSSE (28%)W (26%), SSE (24%)W (24%), SSE (17%)
GuilinPollution DaysS (38%), SSE (17%)S (48%), SSE (28%)S (40%), SSE (28%)
Non-Pollution DaysS (36%), SSE (36%)S (26%), SSE (24%)S (17%), SSE (45%)
BeihaiPollution DaysSW (31%)WSW (35%), W (29%)W (57%)
Non-Pollution DaysW (19%), WSW (16%)SWS (31%), S (24%)WSW (38%), W (27%)
Publisher’s Note: MDPI stays neutral with regard to jurisdictional claims in published maps and institutional affiliations.

