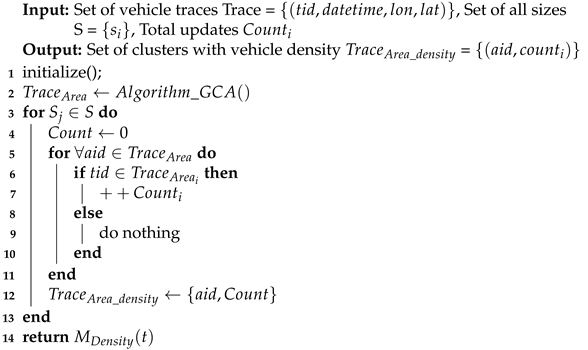
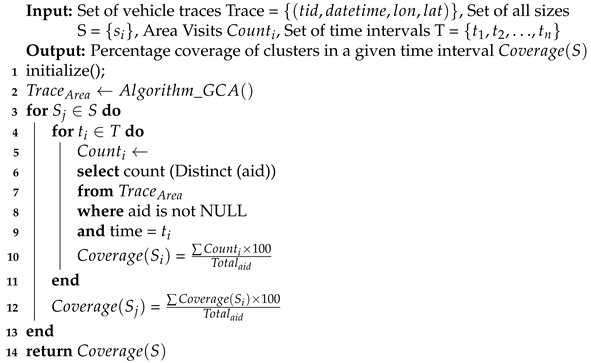
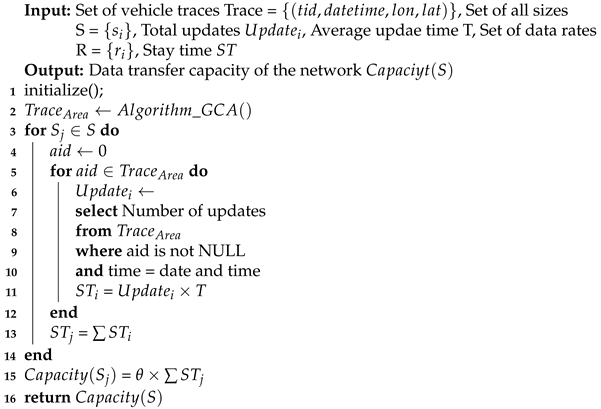
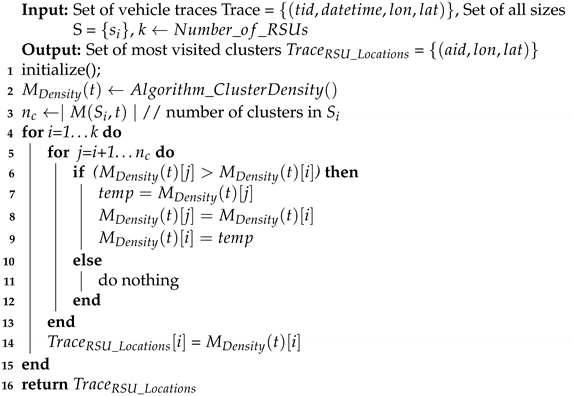
We use taxi trajectories data to calculate the coverage and capacity of on-board sensor networks in smart cities to calculate the stay time of vehicle in each grid, find the coverage, and data dissemination capabilities of the vehicular sensor network. For this purpose, we implement the vehicle big data traces in SQL Server to calculate the number of contacts between different smart sensors, roadside units and vehicles in different scale grids. We apply our proposed clustering algorithm to divide vehicle data into different clusters, and execute SQL queries in different scenarios of D2D communication and various wireless technologies to calculate various results that are helpful for smart city design and analysis. The most important part of the taxi fleet is the taxicabs that can reach each street at the exact destination/origin of the riders and can provide more excellent coverage. In this regard, we have selected four subsets of 400 random taxis from Beijing city having an average update time of 30 s. We evaluate the vehicle capacity, Cluster coverage, cluster density and performance of our proposed vehicular network for data collection. We here briefly describe the data set, locations with high potential for data transmission, coverage, and capacity of the proposed network.
4.2. Area Selection for Analysis
We selected an area of 25 × 25 km
having longitude between
E to
E and latitude between
N to
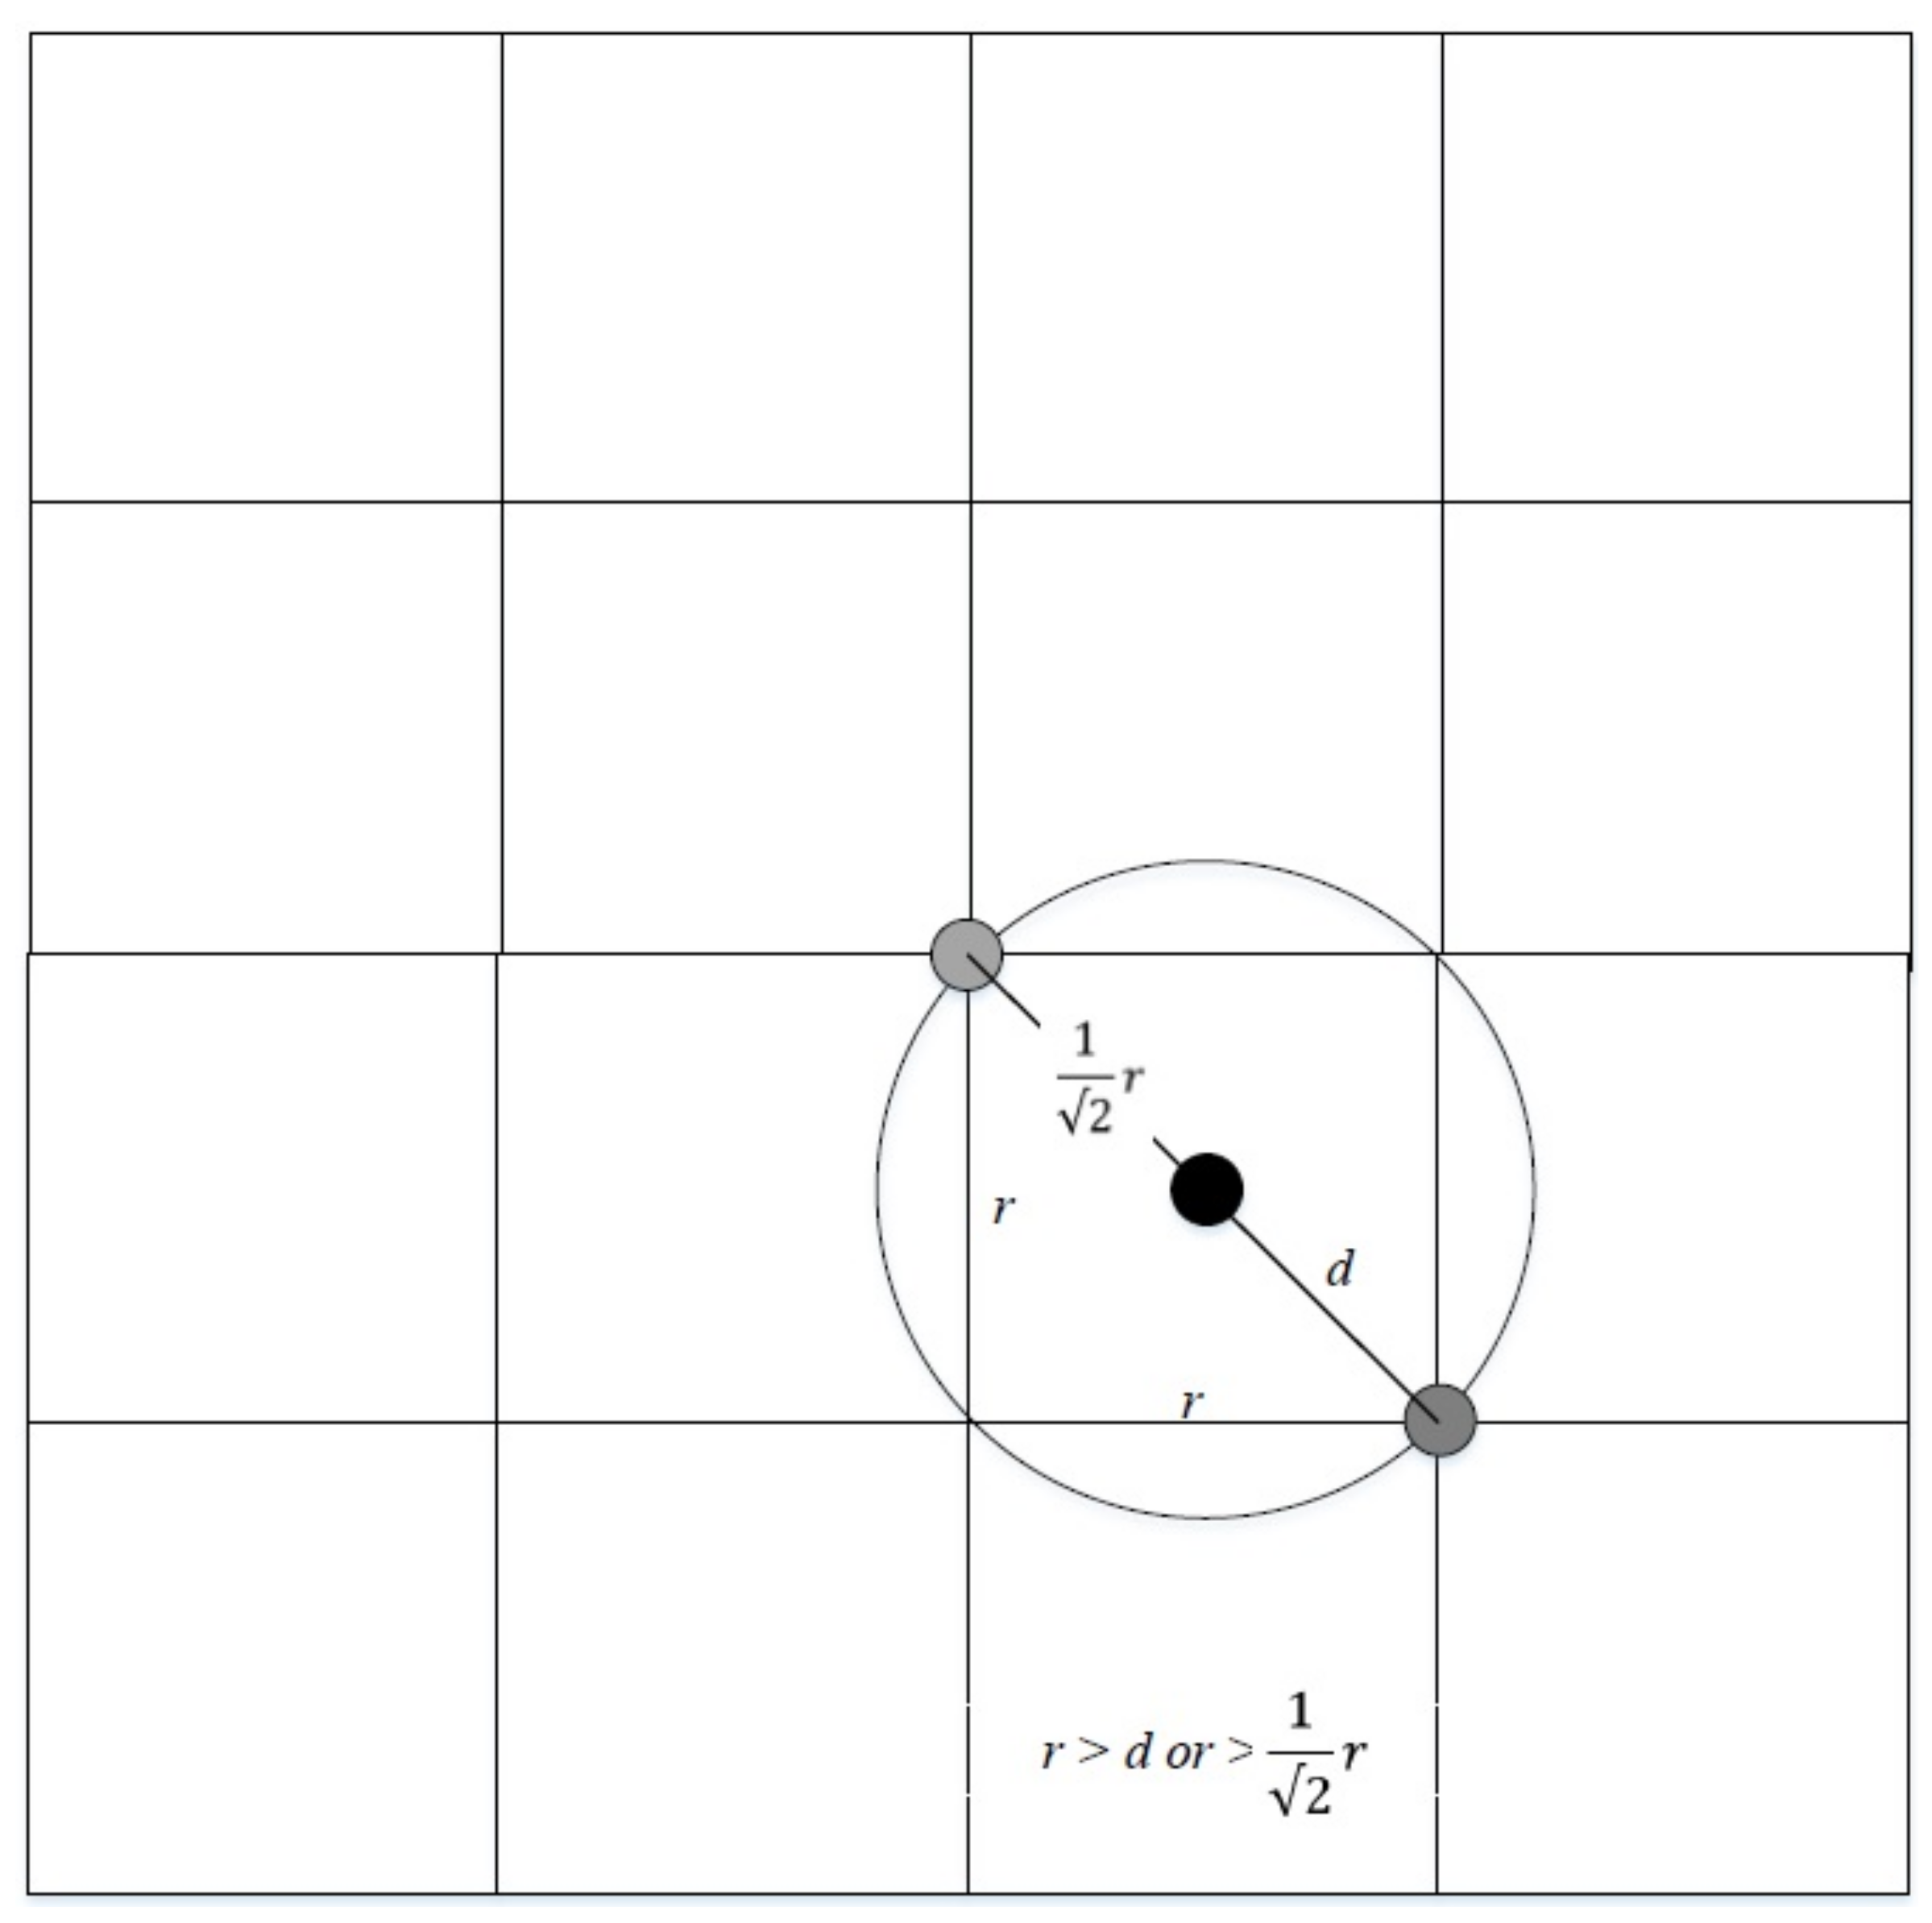
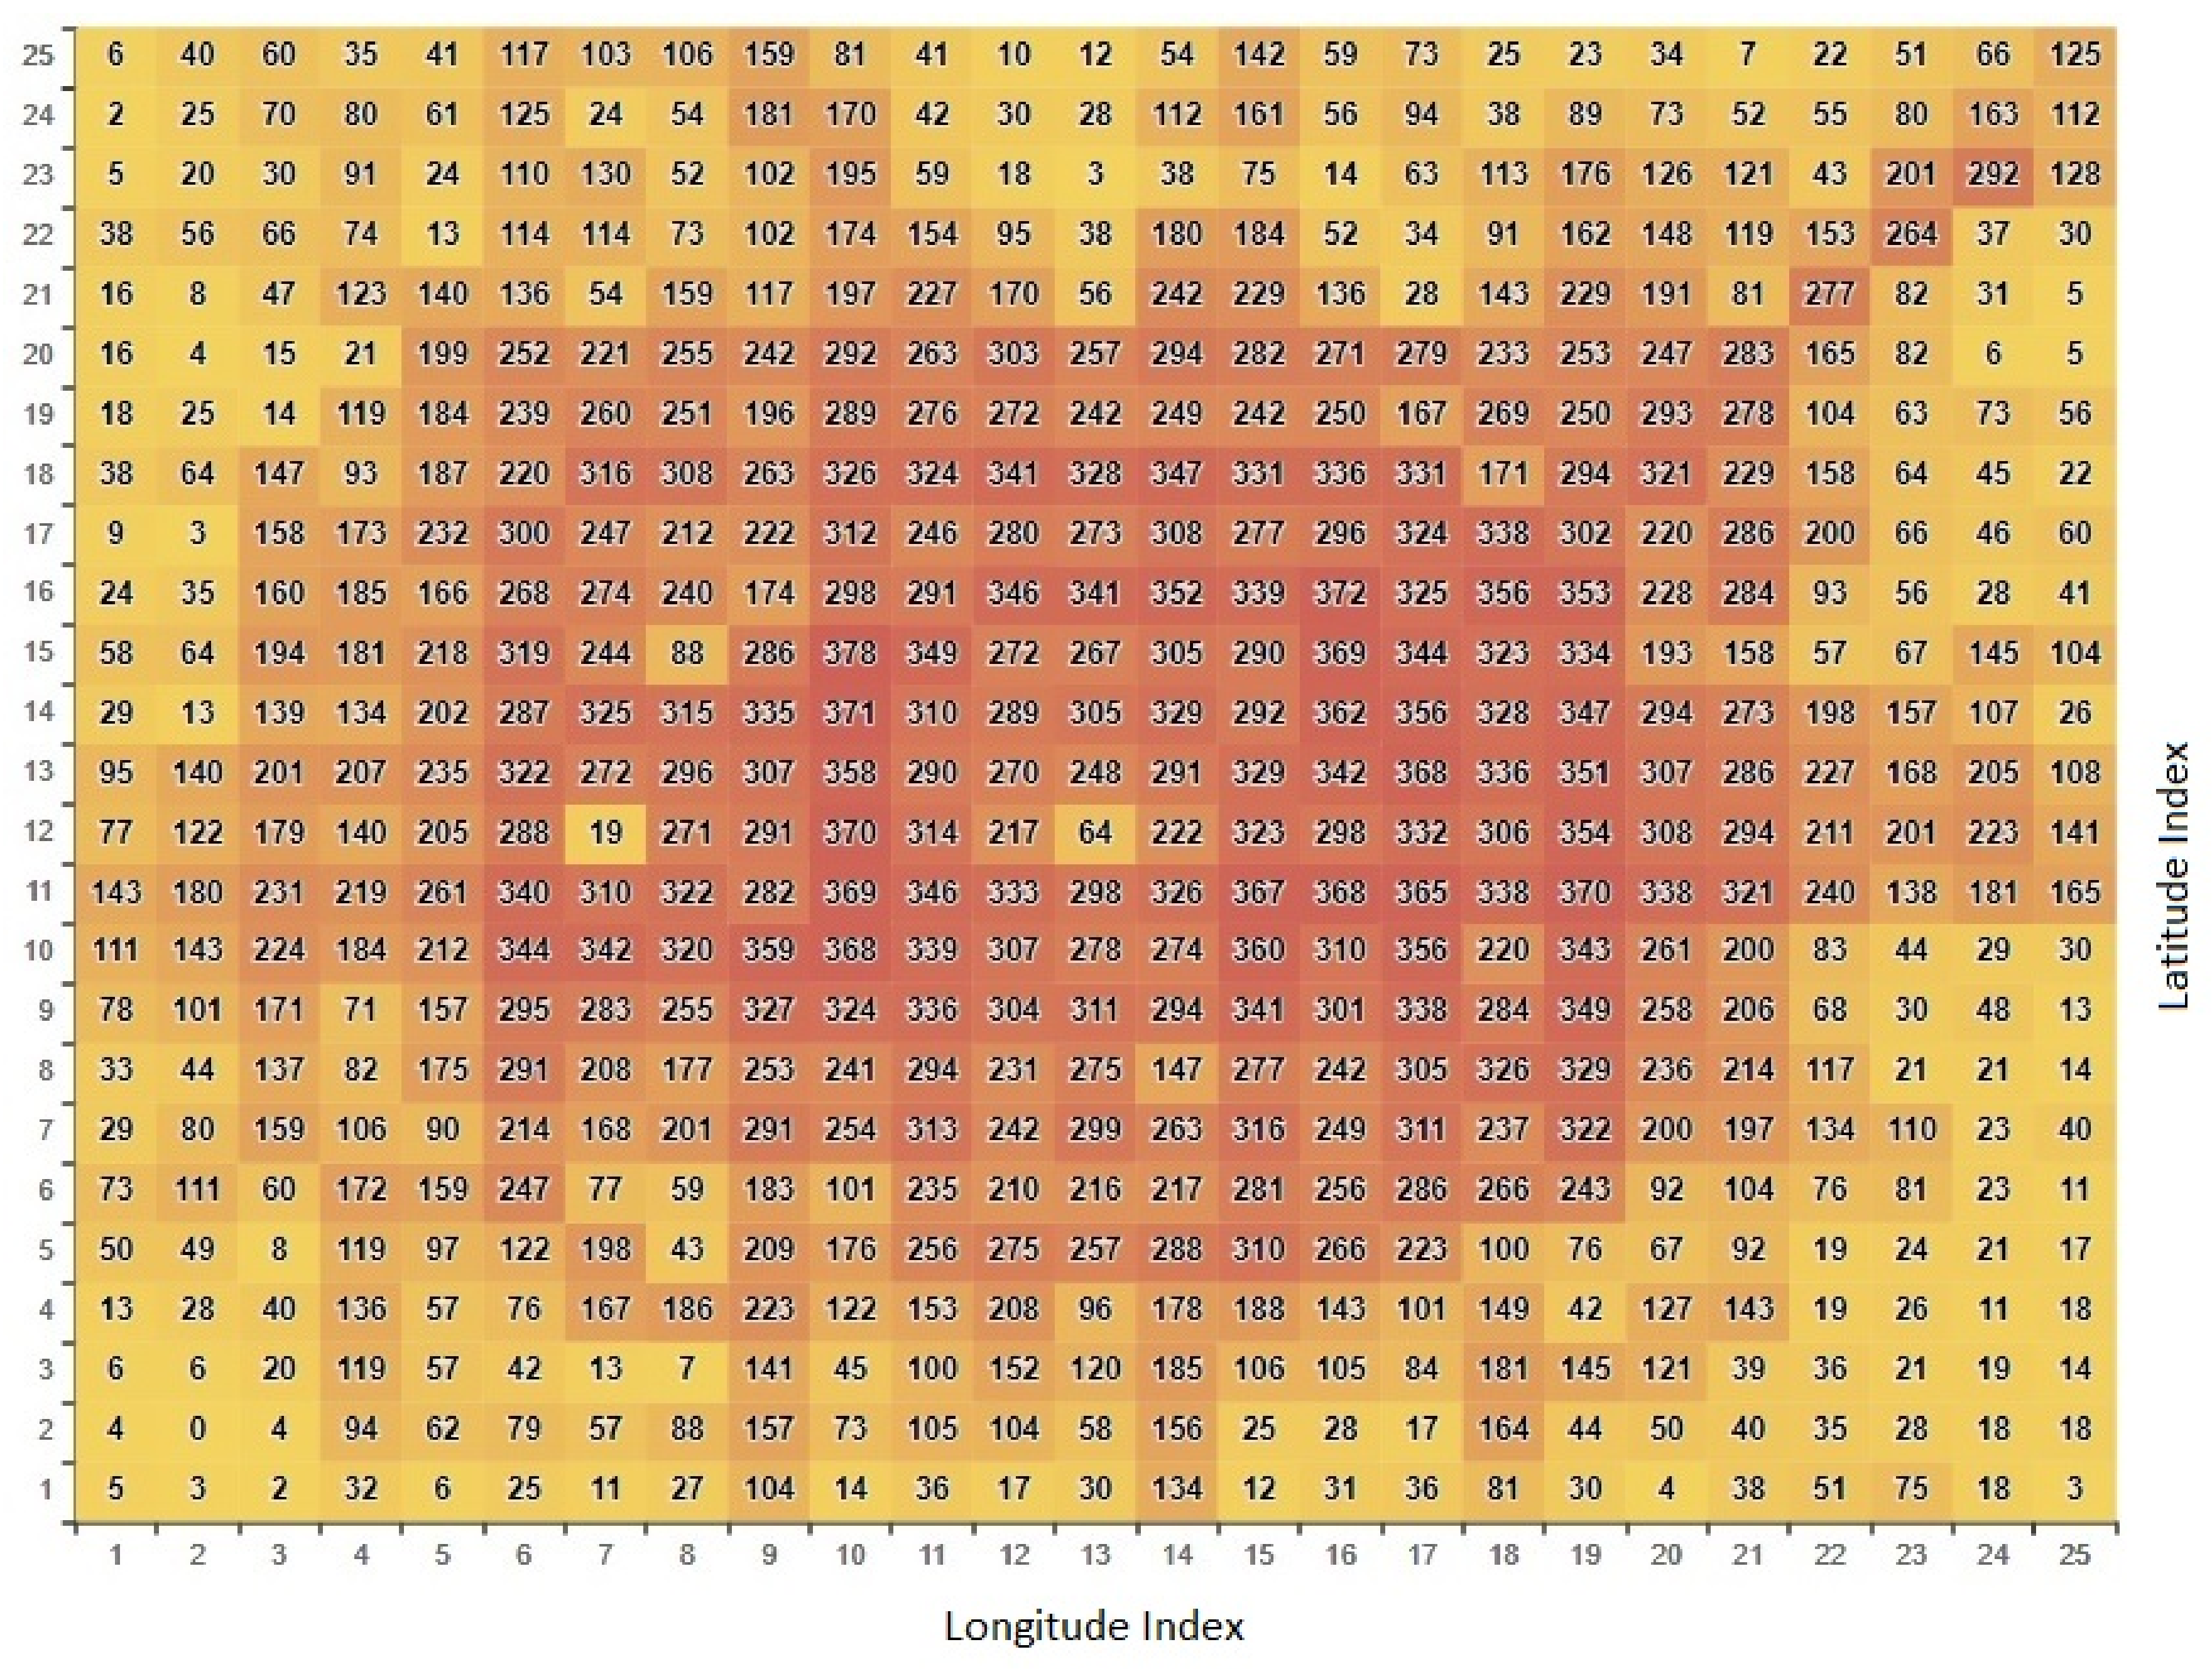
N to evaluate the network performance, coverage, and capacity. The initial step of our methodology is to apply the grid clustering algorithm on taxi traces to make a graph having every vertex as a geographic area of the selected city called a grid. Every vertex has a weight that is equivalent to the total number of taxicabs reported inside that grid. After the creation of grids, the whole area is separated into equivalent measured quadrants. Finally, the GPS locations of each taxi are stored in the database, along with their quadrants (grids) as shown in
Figure 4. A grid is a small region of the city bound by a square with a side length
r demarcated by GPS locations of taxis. If
n is the total number of GPS points, then during the association phase, our algorithm has
complexity. This complexity condensed to
at higher levels, where
m is the total number of grids in the target region. Additionally, this is the basic advantage of the grid clustering algorithm because it has less complexity, i.e.,
.
It is crucial to choose the grid size judicially. The grid size should be neither too big nor too small, which influences the performance of our proposed work directly for evaluation of radio ranges of chosen wireless technologies. We analyze the coverage and dynamics of the proposed network by using the four random subsets of 100, 200, 300, and 400 taxi cabs from the data set of Beijing Taxi traces by considering the wireless range of different wireless technologies as shown in
Table 2.
4.4. Network Area Coverage
We evaluate the percentage of grid coverage of 1000 m
by using a set of 400 random vehicles for a given interval.
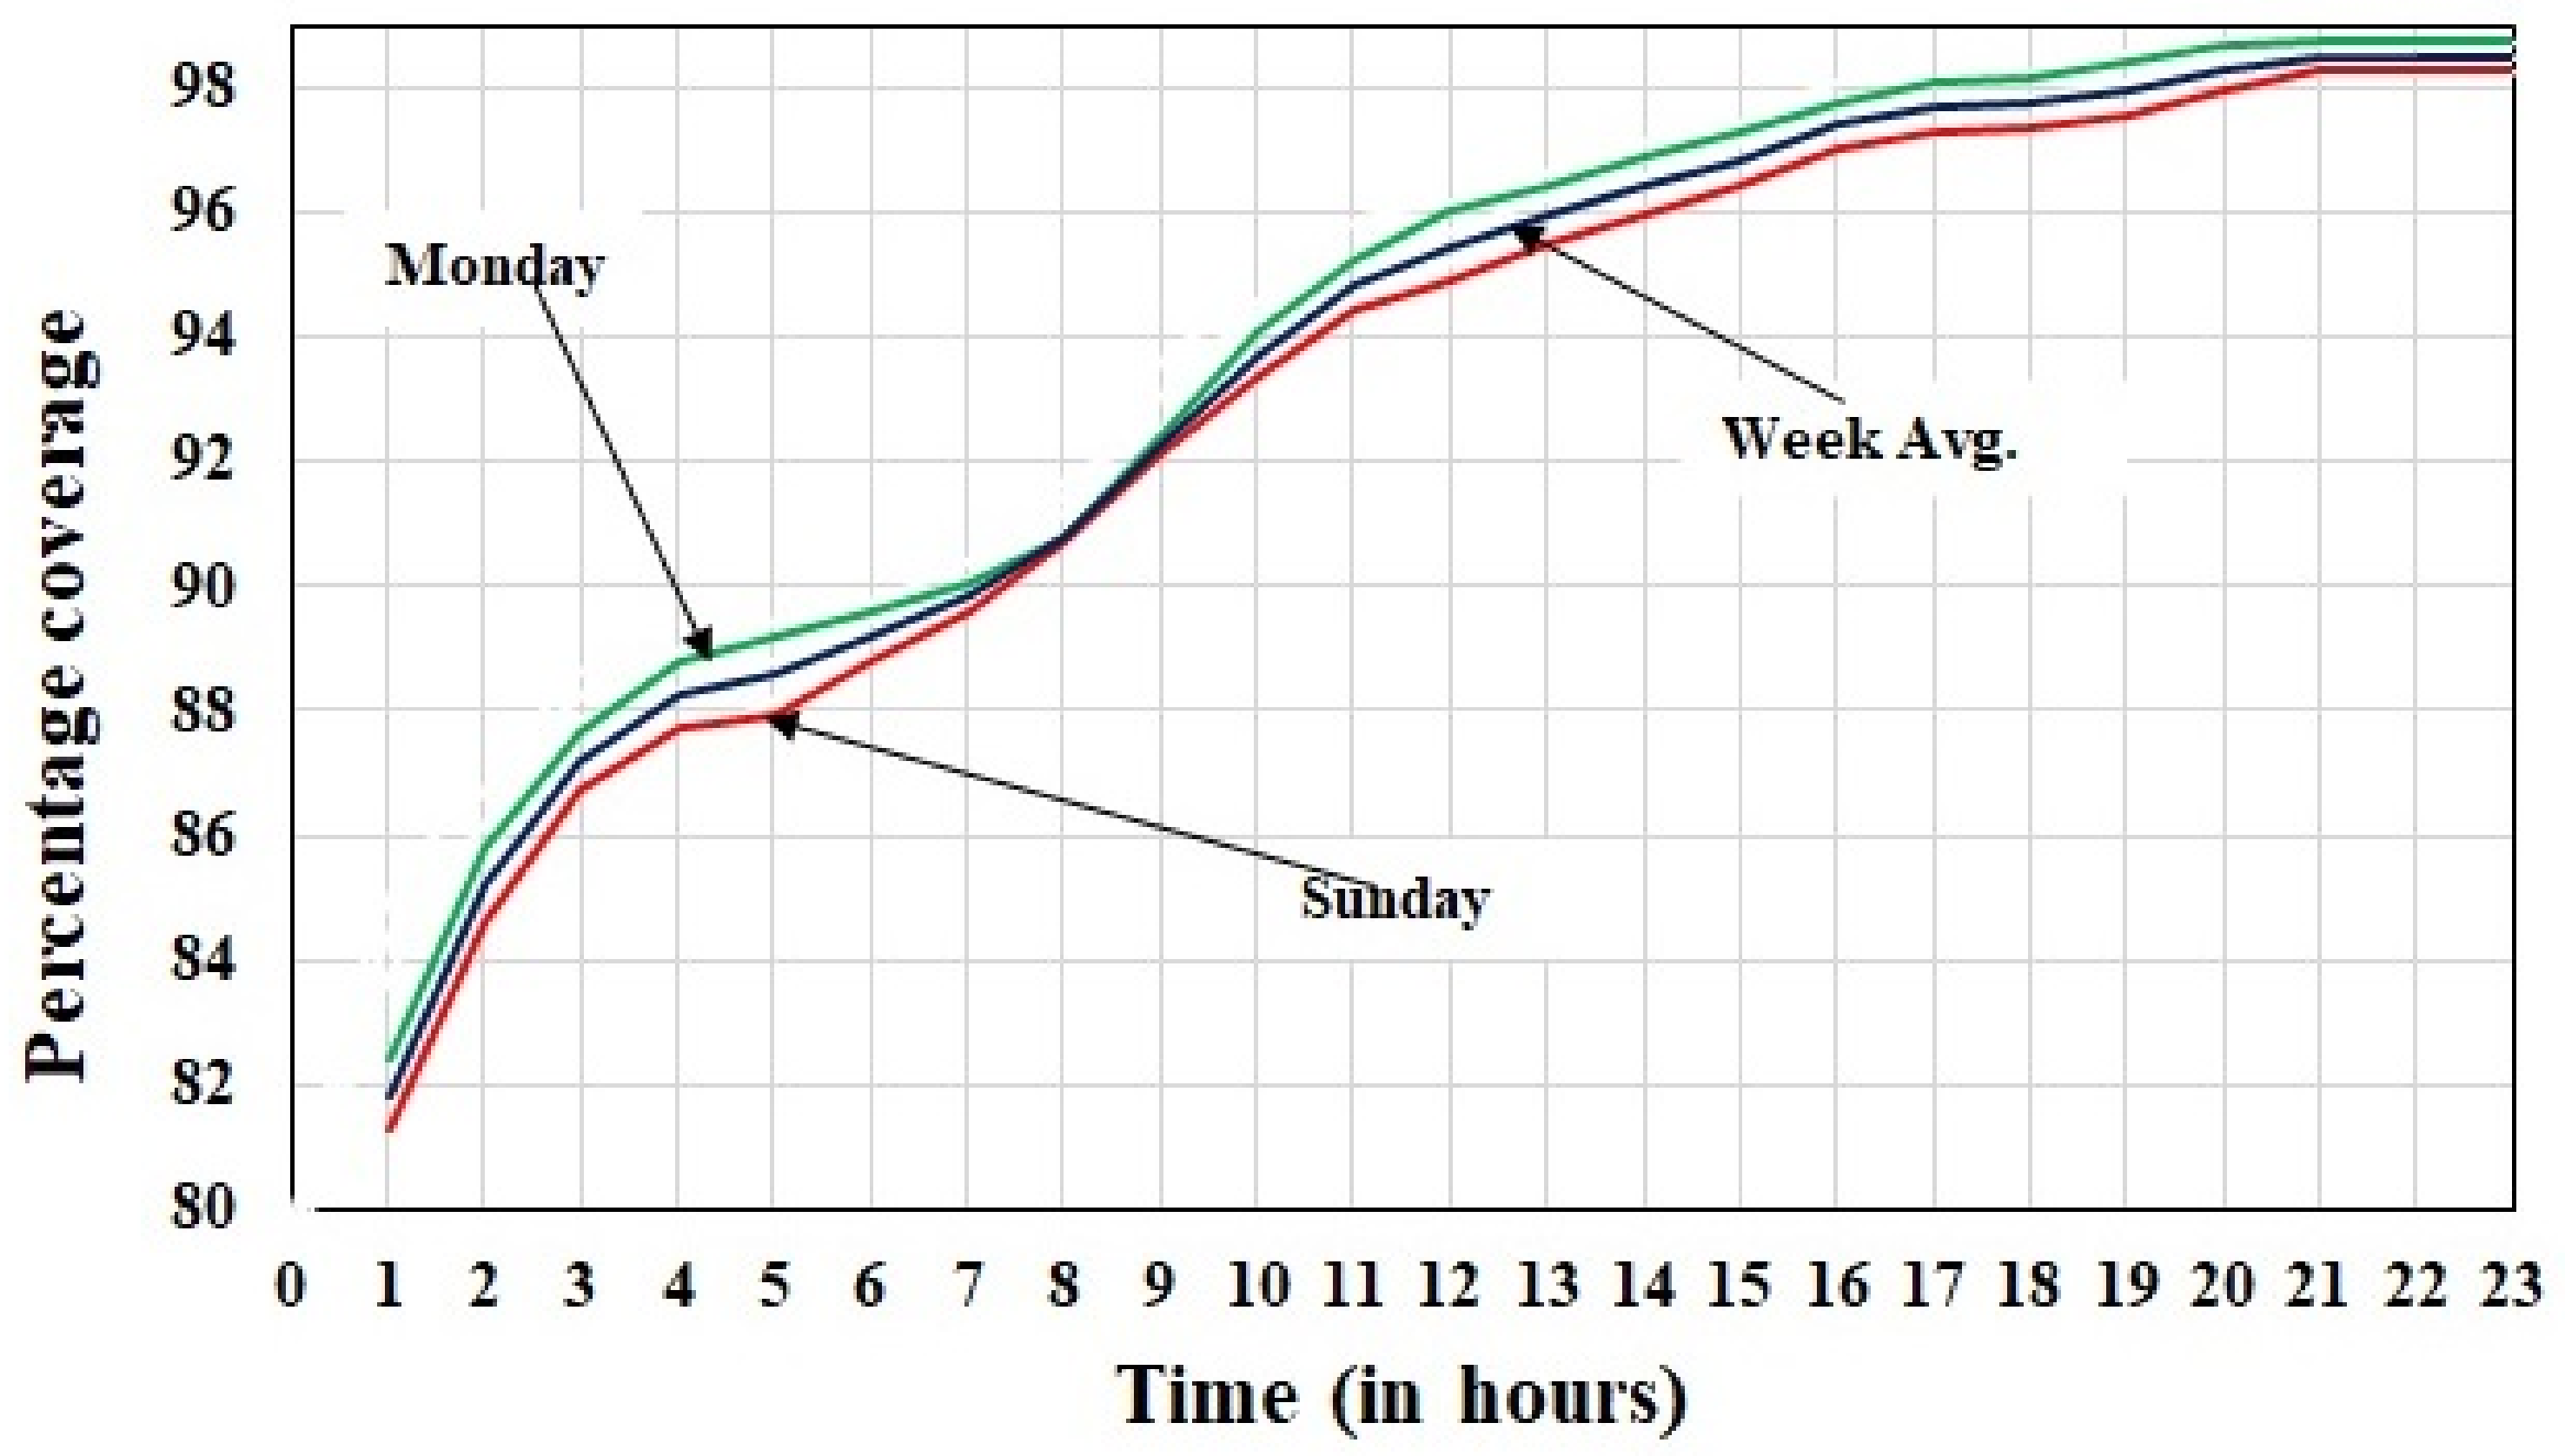
Figure 5 compares the grid coverage percentage of a working day, a weekend day, and the weekly average. In all three cases, there is a big coverage of the area, which has area coverage around 95% after a half-day. Some of the grids can never be visited, e.g., the grid with ID 27. So, the coverage can never be 100% under this given case.
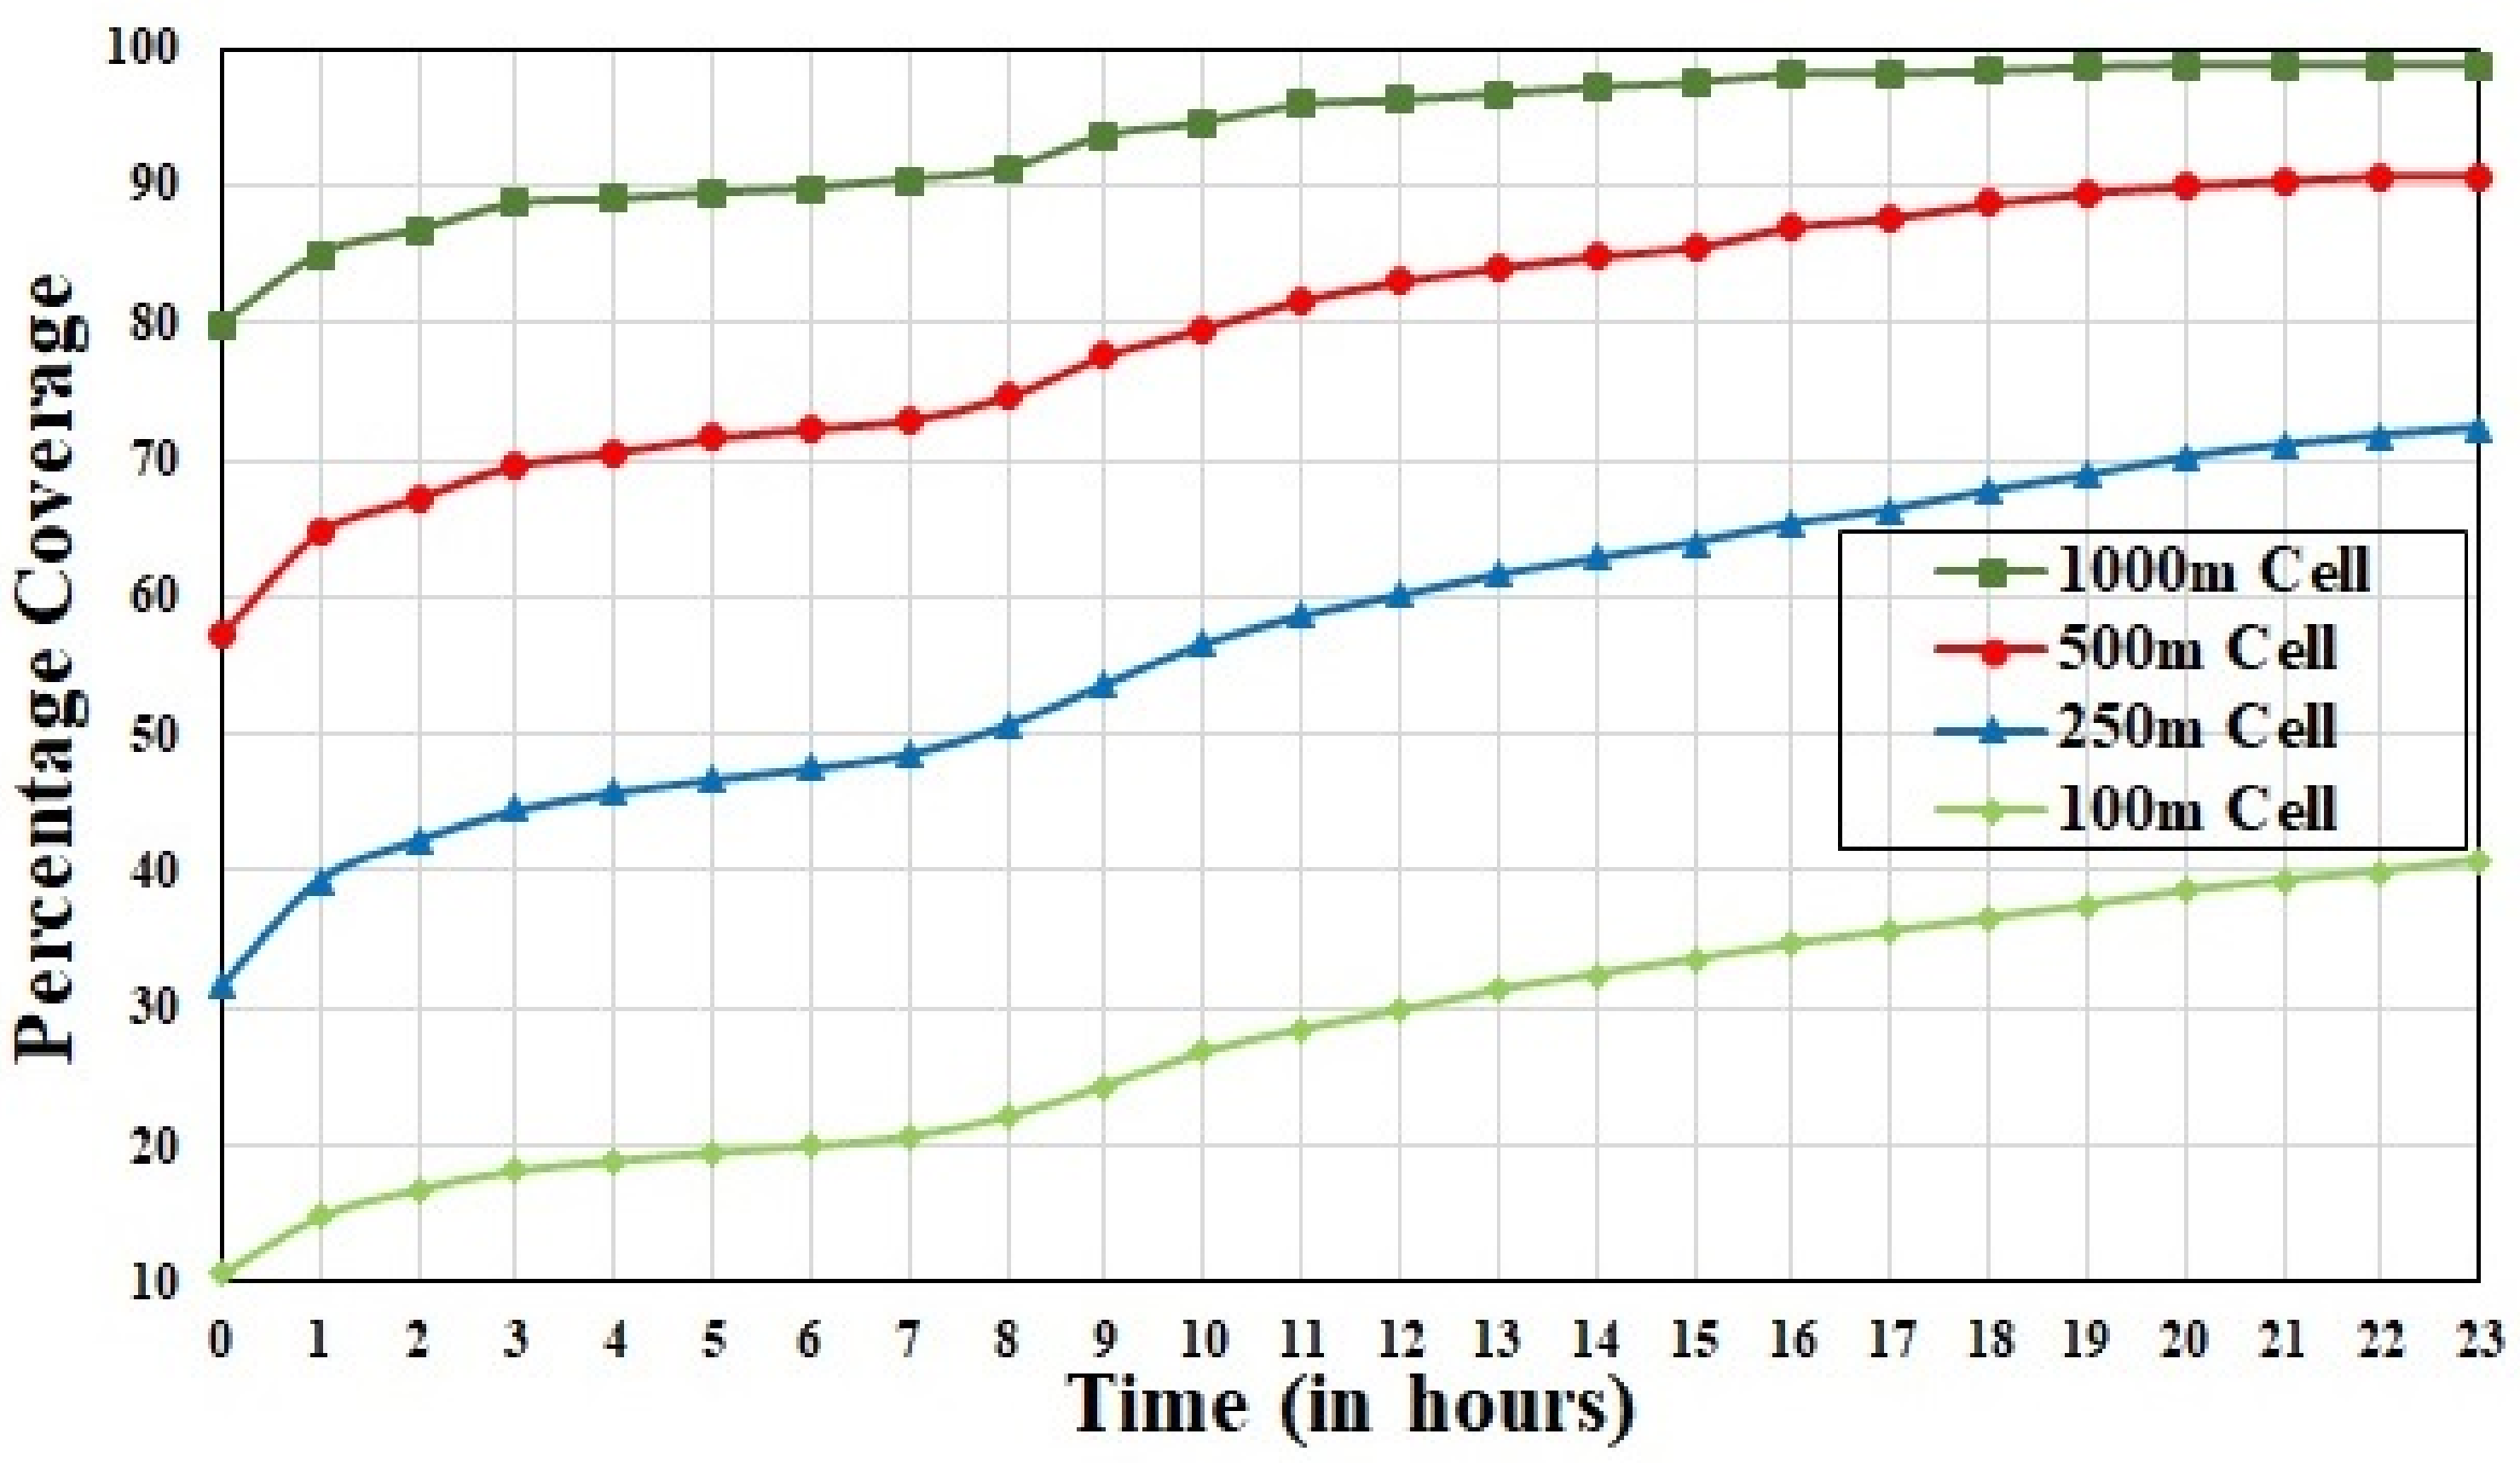
Figure 6 shows the area coverage by the displacement of 400 random taxi cabs of the given data set in 24 h. In this experiment, we investigate the coverage for different grid sizes that varies from 100 m
to 1 km
. In the case of 1 km
grid size, the coverage of the area varies from 80% to 98.5%. Almost 1.5% of the grids can never be visited by these cabs. By geographical inspection of the selected area, it is observed that these grids are in the regions where taxi cabs and vehicle movement is not allowed, e.g., old cemeteries, big private areas, public gardens, train stations, rivers, hotels, etc. As shown in
Figure 6, the coverage of the area reduces when we reduce the size of the grids from 500 m
to 250 m
and 100 m
. The smallest grid size division is 100 m
, which gives the smaller coverage that varies from 10% to 30% in 24 h. The average road area in Beijing city is 26% [
52]. In this division, we noticed that only those grids are covered that are on the road or near the coverage of the road. All the smaller grids that are away from the road can never send their data directly to the vehicles because they are not in the wireless range of the vehicles having the technology of 100 m
wireless range. However, these areas can also be covered if we use the clustering approach of wireless sensor networks. All the sensors away from the road will then route their accumulated data to their cluster heads periodically. These cluster heads are installed in those grids, which are in the coverage of some road.
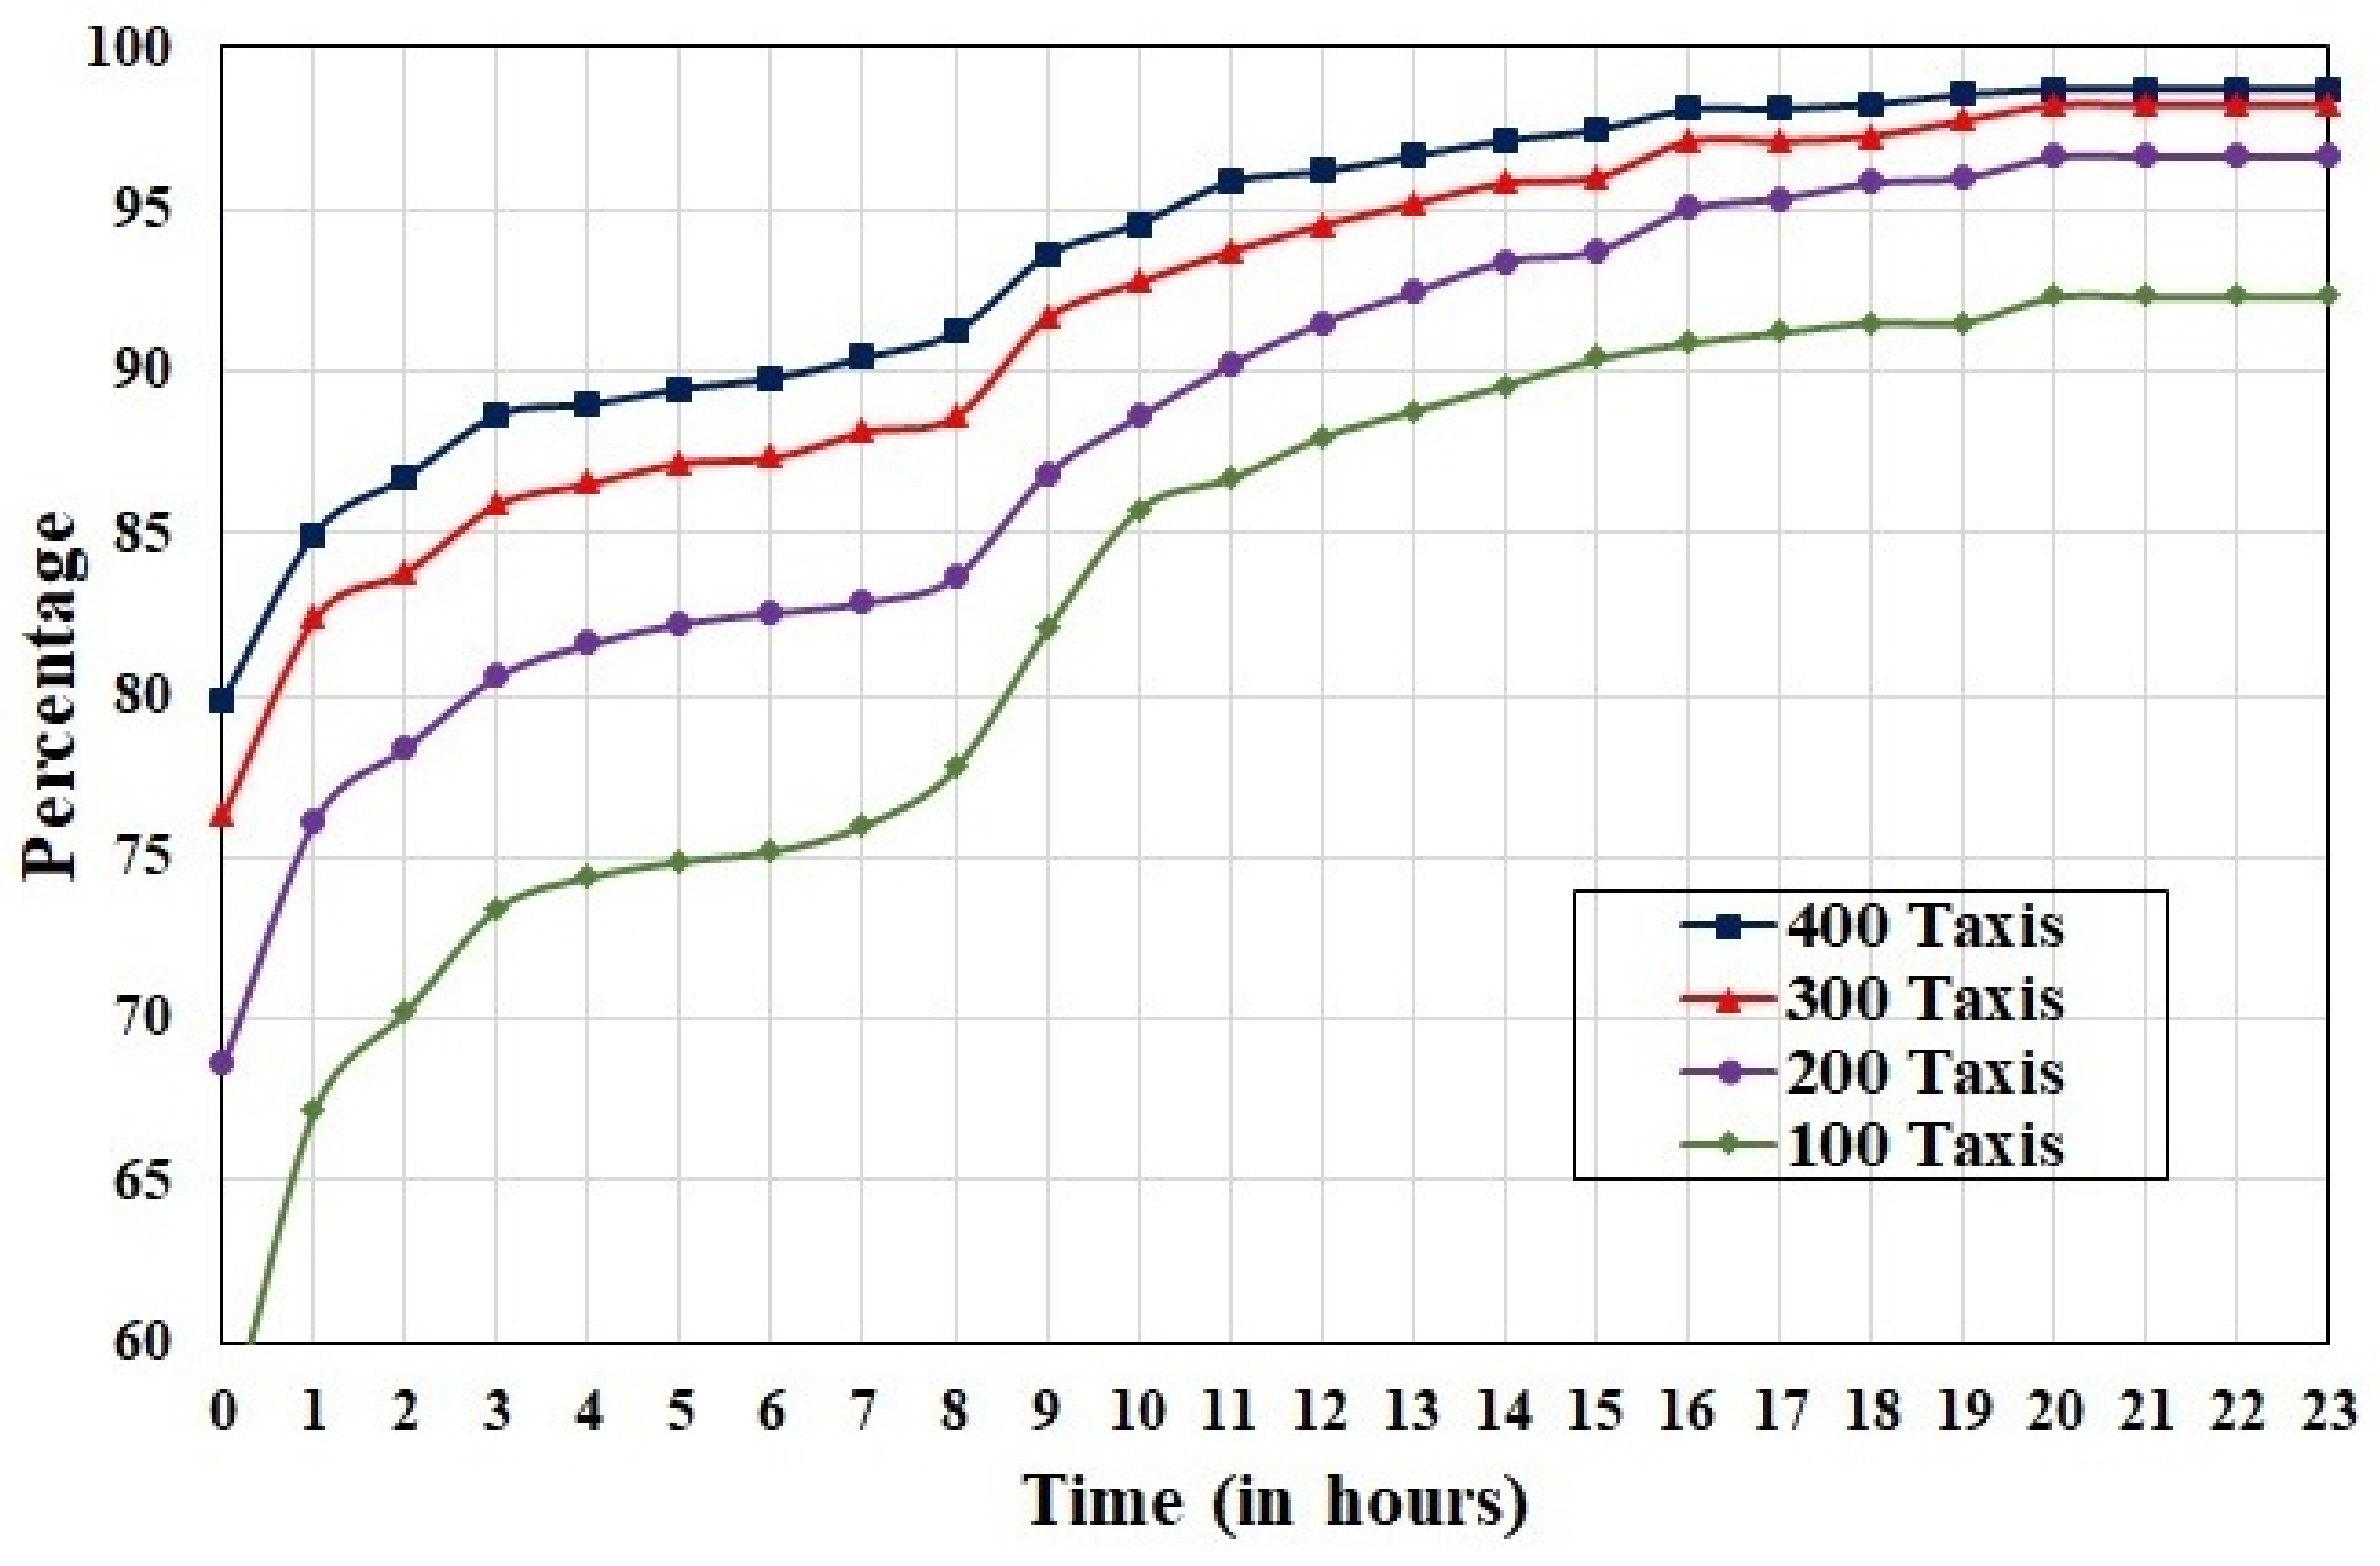
Figure 7 shows the coverage of the given area with a different number of taxi cab sets in 24 h on 4 February 2008. This experiment shows that when we increase the number of vehicles, the coverage also goes on increasing. The subset of 100 taxicabs gives coverage from 60% to 92% of the given area, whereas the bigger set having 400 random cabs give higher coverage from 80% to 98.5% of the given area. We would like to mention that the focus of our investigation was an urban region of
km
area. However, this situation may not necessarily apply in hardly populated regions or rural areas. In this connection, we think that the locations where more taxicabs move, frequently compared to locations where more information is produced/consumed, and at those locations, the data dissemination is usually progressively critical. This reflection is true likewise if we consider the different regions of the same city. Furthermore, on the off chance that we consider for example uncommon occasions like domestic carnivals or open exhibitions, we observe that a more noteworthy number of taxis in that area compares to an extended need of data communications among “things”, for instance, to report the load levels of trash cans that they are full more quickly. The outcome is that mobile nodes (cabs) arrangements could likewise give a sort of automatic solution to bring greater capacity where and whenever it is required.
4.5. Network Capacity
We assume that each grid has multiple sensors to measure the data transfer capacity of the network. These sensors can communicate directly with the vehicle inside the grid. Every vehicle can store and forward the data collected by these sensors by making a wireless secession with them inside each grid. Vehicles gathered data from these sensors when they encountered them during their routine travel. Finally, they upload to some cloud through some wireless access point called roadside unit (RSU), in a grid. We can measure the capacity of that grid in terms of data transmission by estimating the duration vehicles remain in the radio range of a grid and the delay associated with data transmission over the proposed vehicular network.
The estimates of this analysis can be matched with the requirements of different applications that can be supported by the proposed vehicular network. For example, the amount of data generated from the smart sensors by knowing the requirements of different smart city data applications, and the delay-tolerant intervals, which is helpful to decide the radio technology that can support. Data transmission capacity is a key component to measure the application requirements of a smart city that can be supported by the proposed vehicular communication. For this purpose, we can associate the total time a taxicab remains in the wireless range of the grid with the time to travel between source and destination grids. For that purpose, we need the number of updates recorded by each vehicle in each grid and the total time a vehicle remains inside each grid.
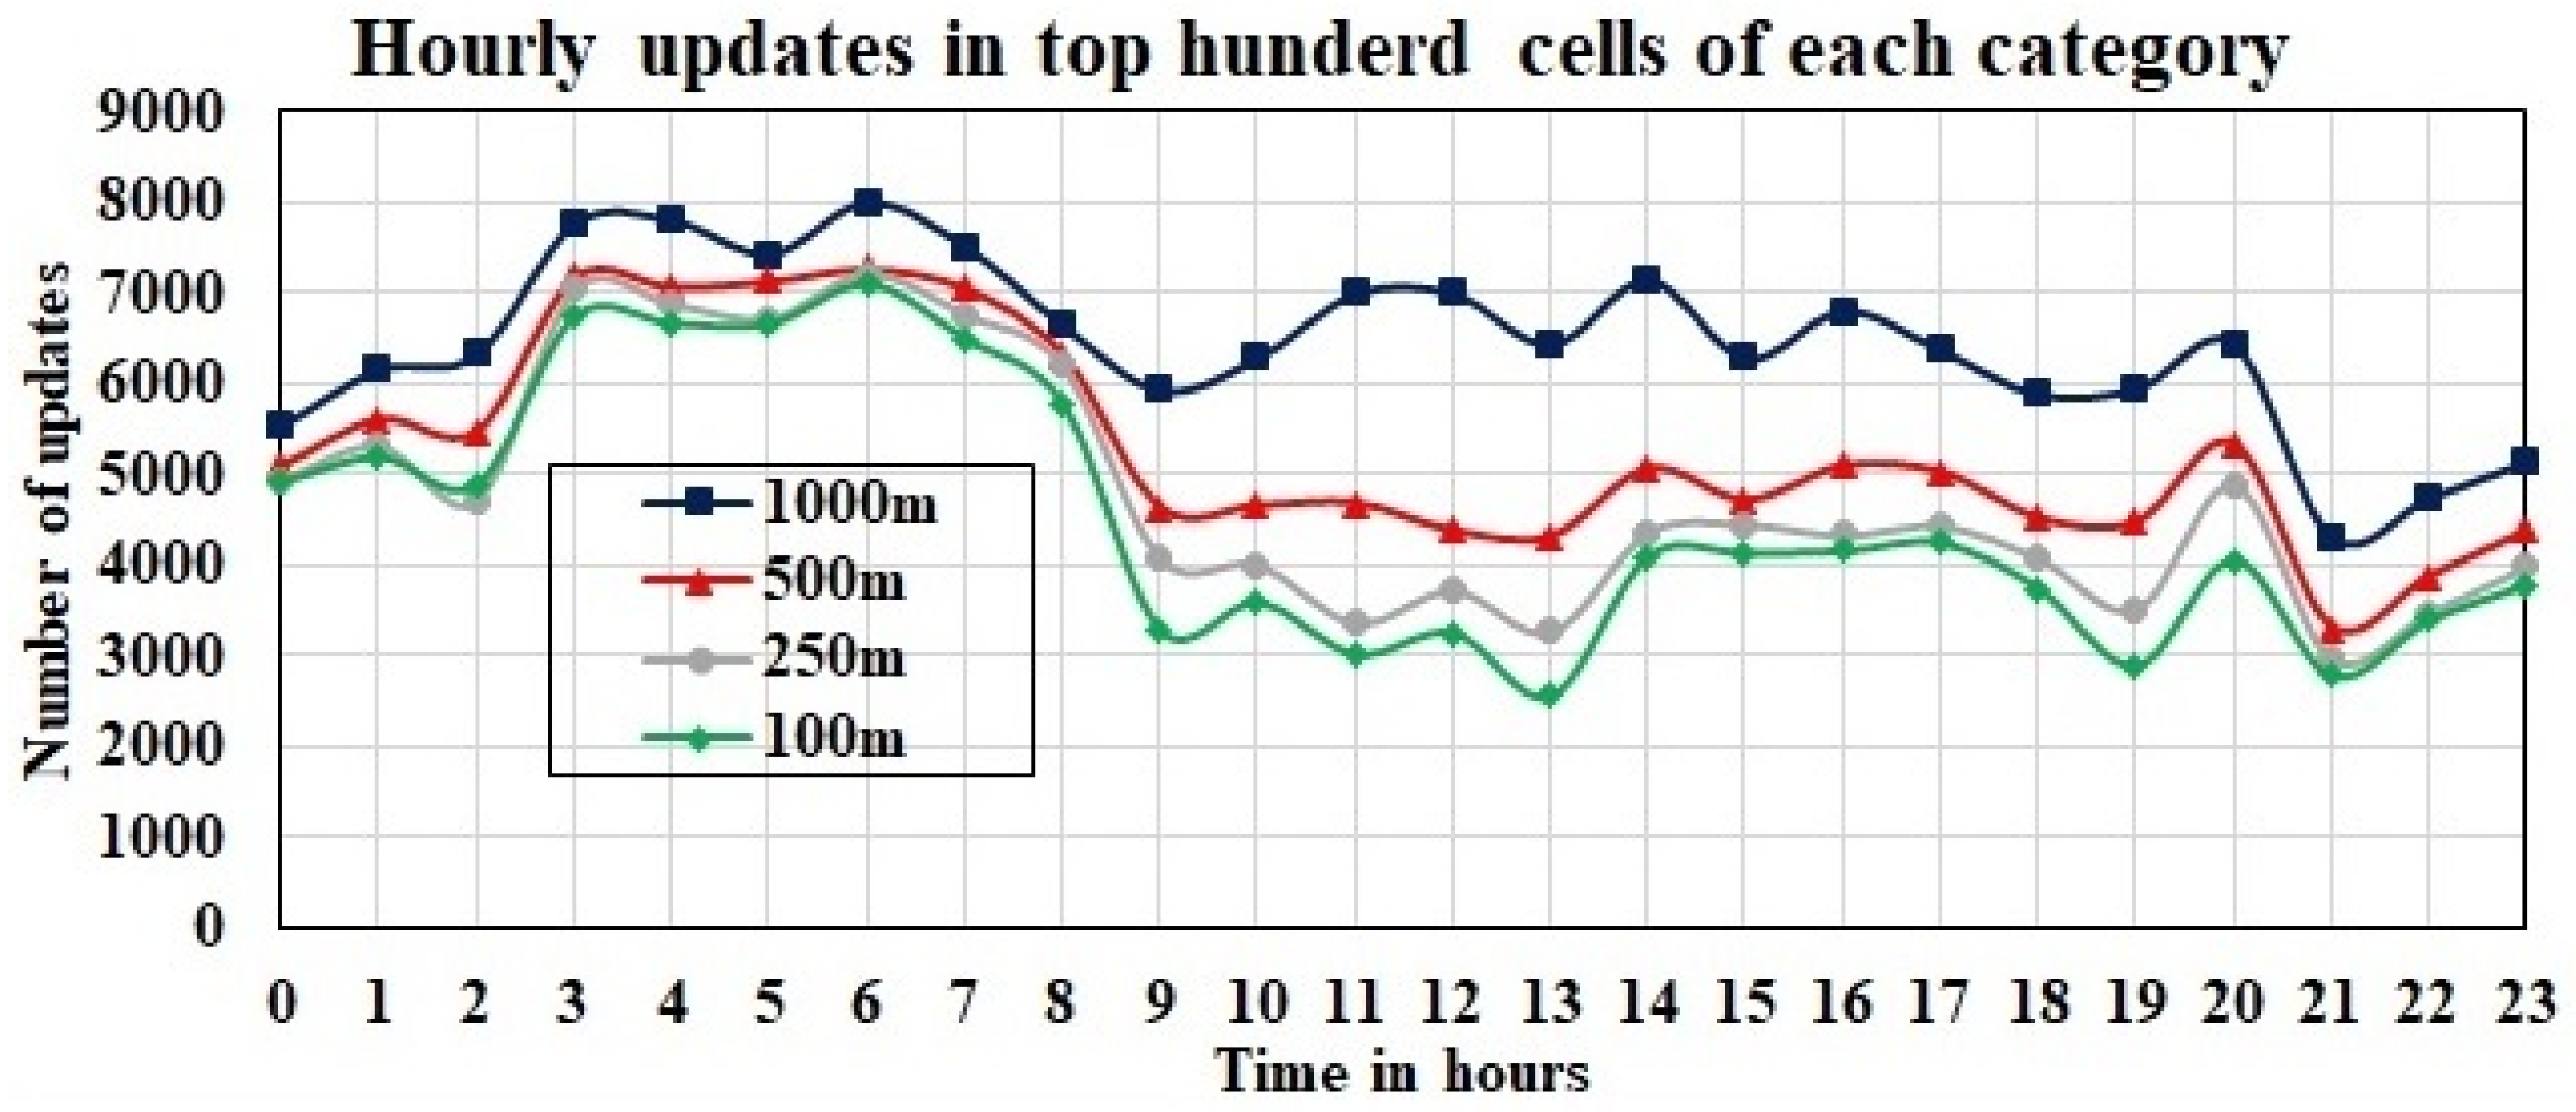
We got the location updates of taxis in each grid after the formation of grids by our grid clustering algorithm over the time intervals of 24 h. When we increase the radio range of technology, we get a higher number of vehicle contacts inside the grid. In our analysis, the biggest cluster obtained has 12,260 updates by taxicabs in a day with a grid size of 1000 m. When we decrease the grid size, we get a smaller number of updates. The grid size of 500 m receives 9483 and that of 250 m receives 9415, and the grid size of 100 m receives 9248 updates, respectively.
Figure 8 represents the total time in seconds that all vehicles remain inside a grid in the time interval of 24 h. This sum compares the absolute time that these taxicabs can use to offload information to the vehicular network in 24 h. Each group of vertical bars relates to a different radio range varying from 100 m
to 1000 m
. A rectangular cluster is created by all taxicabs that update their position inside a grid. In this manner, if a taxicab remains in a cluster for a longer time, it implies that it appears more than once in this grid. Since these clusters are formulated by the number of updates reported by taxicabs, so there is an immediate connection to staying time. Moreover, there is an association with the number of taxicabs inside a grid because when a taxicab has a limited number of updates each day, a grid cluster receives more updates from the most active area of the city.
We can employ the multiplying factor to calculate the aggregated data volume that can be collected in an interval of 24 h, the data rate related to each radio technology, and that all taxicabs remain in the wireless coverage area of the grid cluster introduced in
Figure 8. However, it is crucial to determine this multiplying factor accurately because there are many other variables involved to be considered for actual calculations. We can find a few reflections on the throughput of data communication in vehicular networks as follows. In [
53], authors define the data rates of IEEE 802.11p at 9, 18, 36, 48, 54 Mbps by using different modulation techniques with a wireless range up to 1000 m
outdoor and frequency band of 20 MHz bandwidth. In [
54], authors calculated the data rates of IEEE 802.11n 600 Mbps with frequency range 20 MHz to 40 MHz at modulation MIMO-OFDM where wireless ranges are up to 250 m outdoor. In [
55], authors define the data rate of IEEE 802.11ay up to 100 Gbps. In [
5], authors define the data rate as 20 Gbps in an outdoor wireless range of 100 m
with frequency band 8000 MHz at OFDM modulation. In IEEE 802.16, WiMax provides mobile and fixed internet access. It can provide data rates up to 1 Gbps with a frequency band of 2 GHz and 11 GHz [
56]. This brief survey on literature shows that there is a great capability of data transfer among vehicles and fixed infrastructures. Each of these studies uses different conditions and equipment, which create outcomes in a distinctive test-bed. It is difficult to fix the multiplying factor for throughput of data in the vehicle-to-infrastructure case because of different conditions and equipment. Hence, supported by the literature, we select IEEE 802.11p for 1000 m
cluster for smart devices to the vehicle and the vehicle to the RSUs, IEEE 802.16 for the 500 m
cluster, IEEE 802.11n for 250 m
cluster, and IEEE 802.11ay for 100 m
cluster. In this case, the multiplying factors are, 54 Mbps for IEEE 802.11p, 1Gbps for IEEE 802.16, 600 Mbps for IEEE 802.11n and 20 Gbps for IEEE 802.11ay, as seen in [
5,
53,
54,
55,
56].
We have shown the selected sell sizes and supporting technologies with their multiplying factors in
Table 3. We can get the potential of the proposed network against each selected set of vehicles by applying the multiplying factor with the total stay time of vehicles in the corresponding grids. For example, in a grid size of 1000 m
and throughput of 54 Mbps, IEEE 802.11p can reach up to 0.133 PB in case of a bigger set of taxicabs. As the size of the grid grows, the number of updates by vehicles in that grid also grows, which implies the greater stay time in that grid as shown in
Figure 8. On the other hand, the table shows that the throughput of selected technologies increases in the case of smaller grid sizes, where taxicabs have less stay time. For example, the capacity with IEEE 802.16 reaches up to 2.463 PB. However, it is the most expensive technology because it requires a huge infrastructure to implement. IEEE 802.11n provides 1.477 PB capacity with 250 m
grid size. IEEE 802.11ay can reach up to 13.733 PB at the smallest grid size of 100 m
and with the smallest set of taxicabs. Our results show that the capacity of the network does not merely depend upon the vehicles’ stay time in a cluster, but the selected communication technology does matter as well.
4.7. Data Offloading a Service Scenario
We suggest a new software update for smart devices that may be available by the service providers at some given time. We can evaluate the data offloading performance of our proposed network when the service provider can forward these updates to smart devices. One of the cases is, the service provider will send this data directly to devices. For this purpose, each device should have a sim card to connect it with the cellular network or it should be directly attached to the internet. This case requires a high cost for infrastructure deployment. In our proposed solutions, the service provider will forward this update to the CC server. From the CC server, data will be forwarded to smart devices by using our proposed network.
We consider the following two cases for the evaluation of our proposed network. First, smart vehicles can directly receive this software update from the CC server through the internet since they are connected to the internet. The CC server selects a set of vehicles and forwards this update to those vehicles. After getting this data, vehicles start the diffusion process and transmit this data to smart devices whenever they are in their wireless range. In this diffusion process, vehicles should be helpful as they use their resources in terms of internet connection if this is not impact their trajectory.
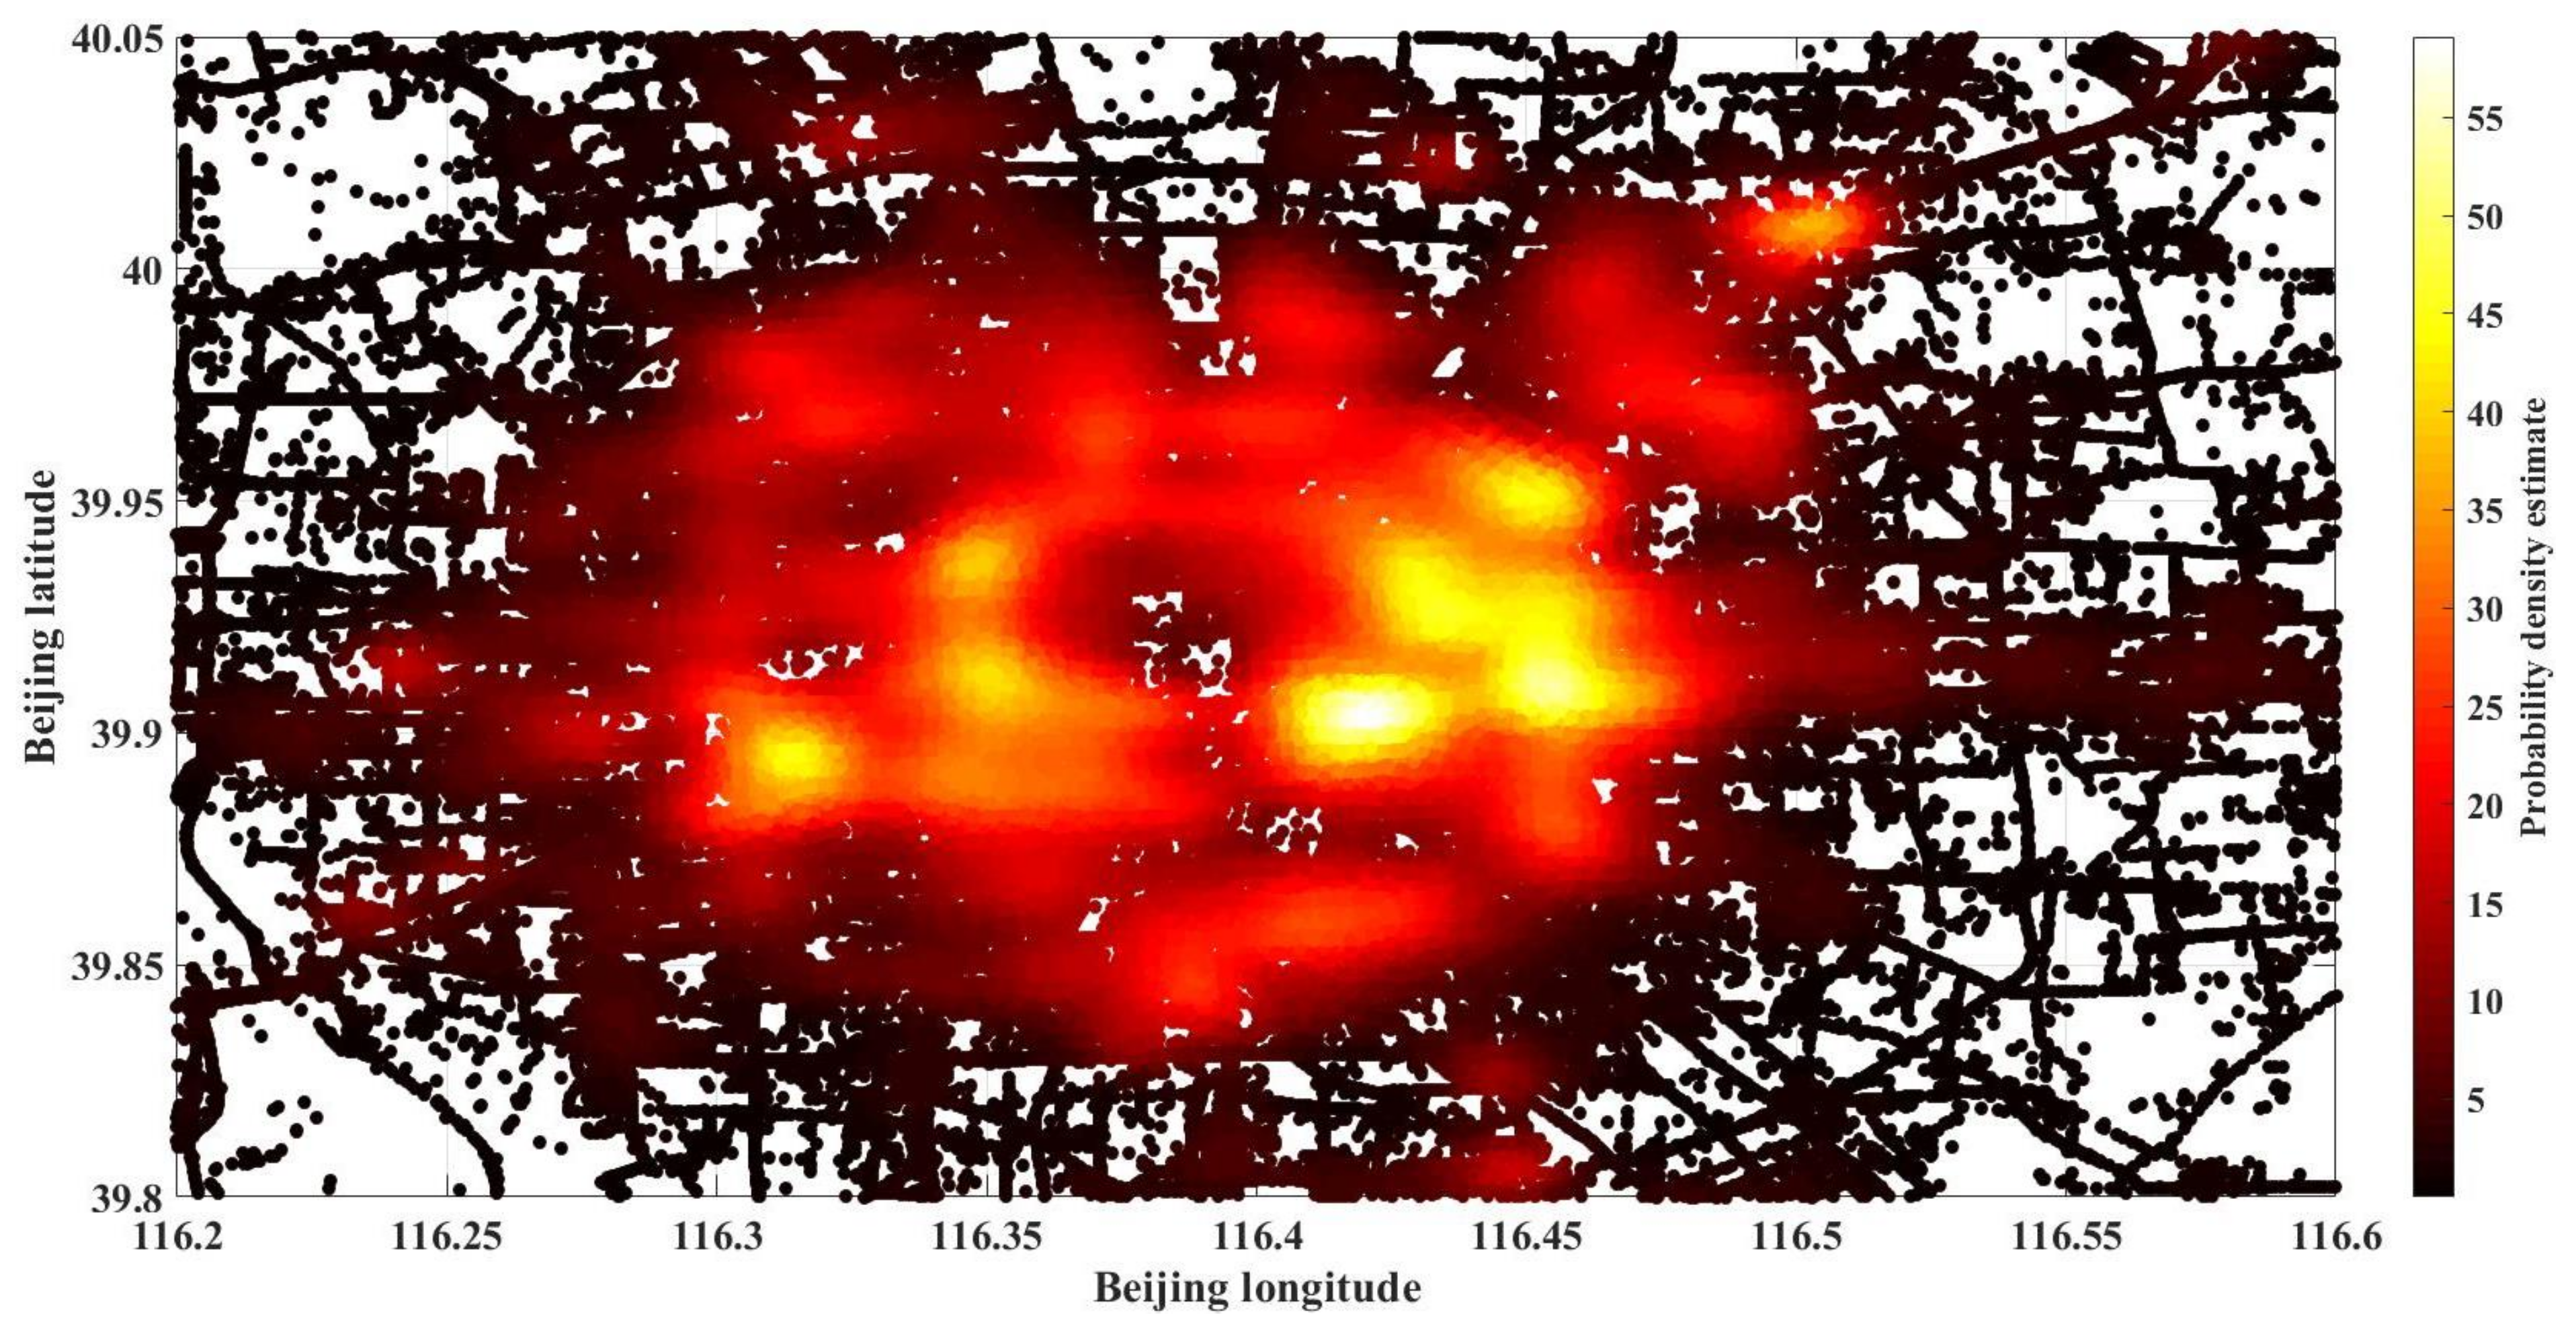
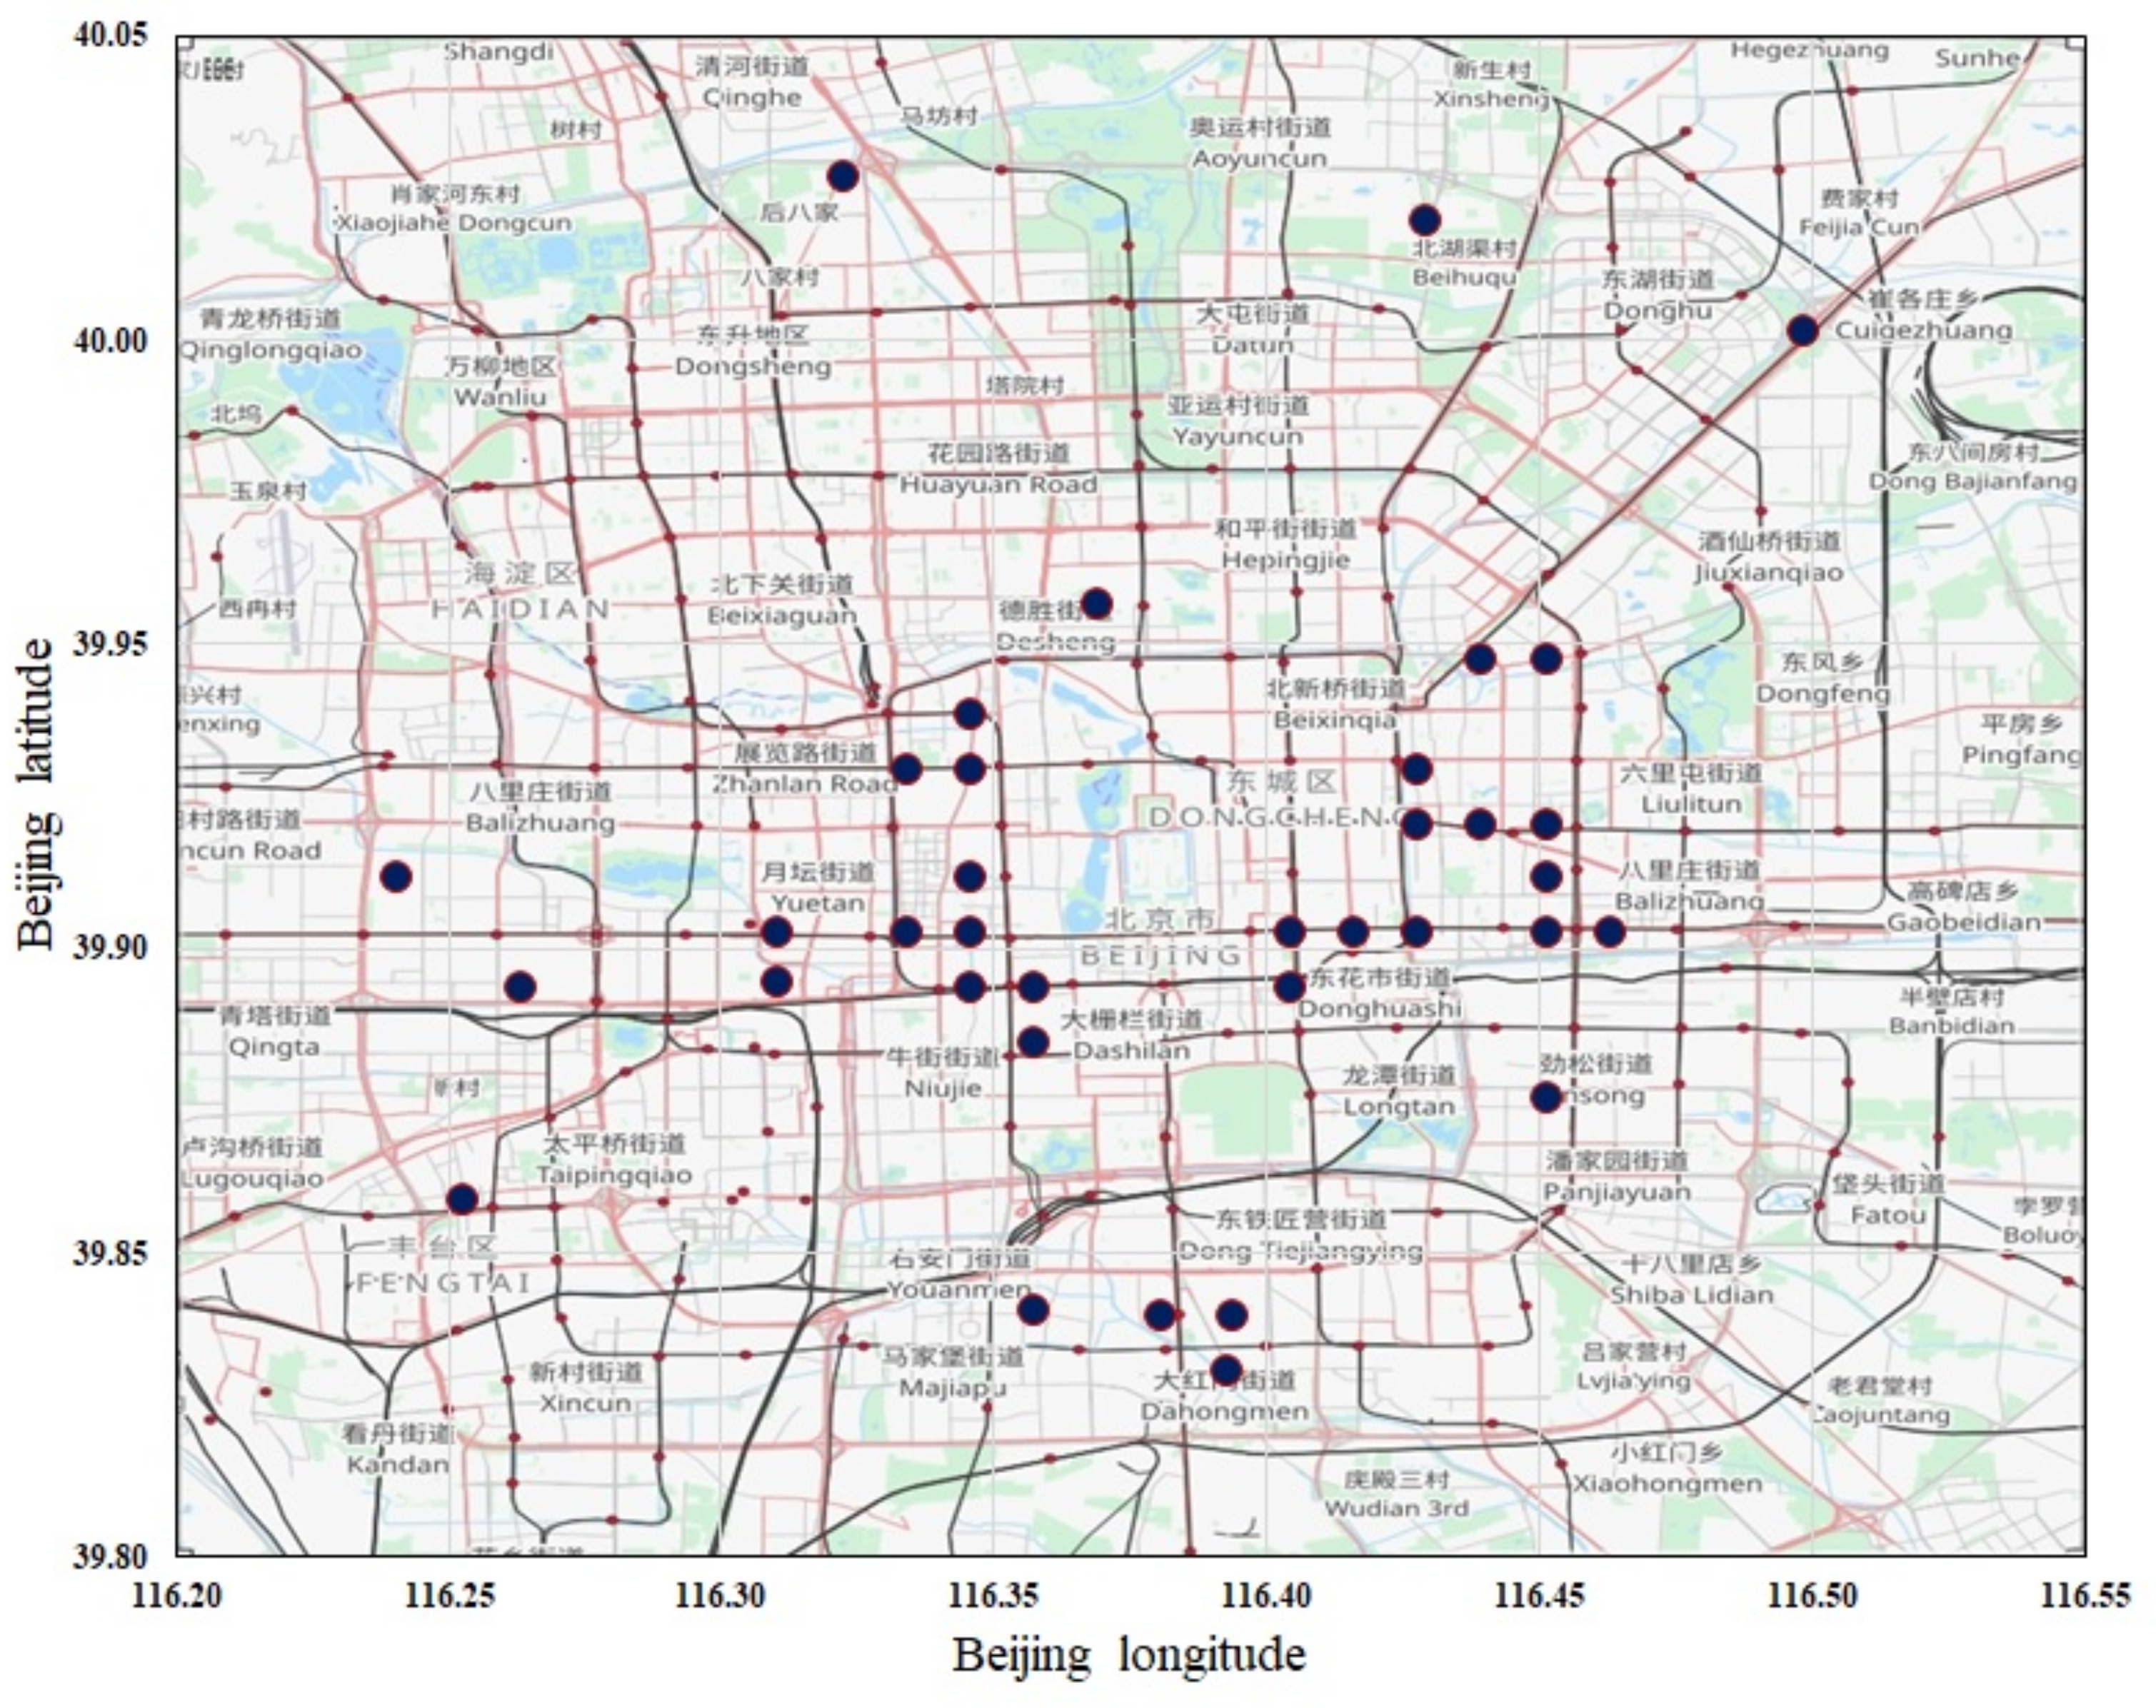
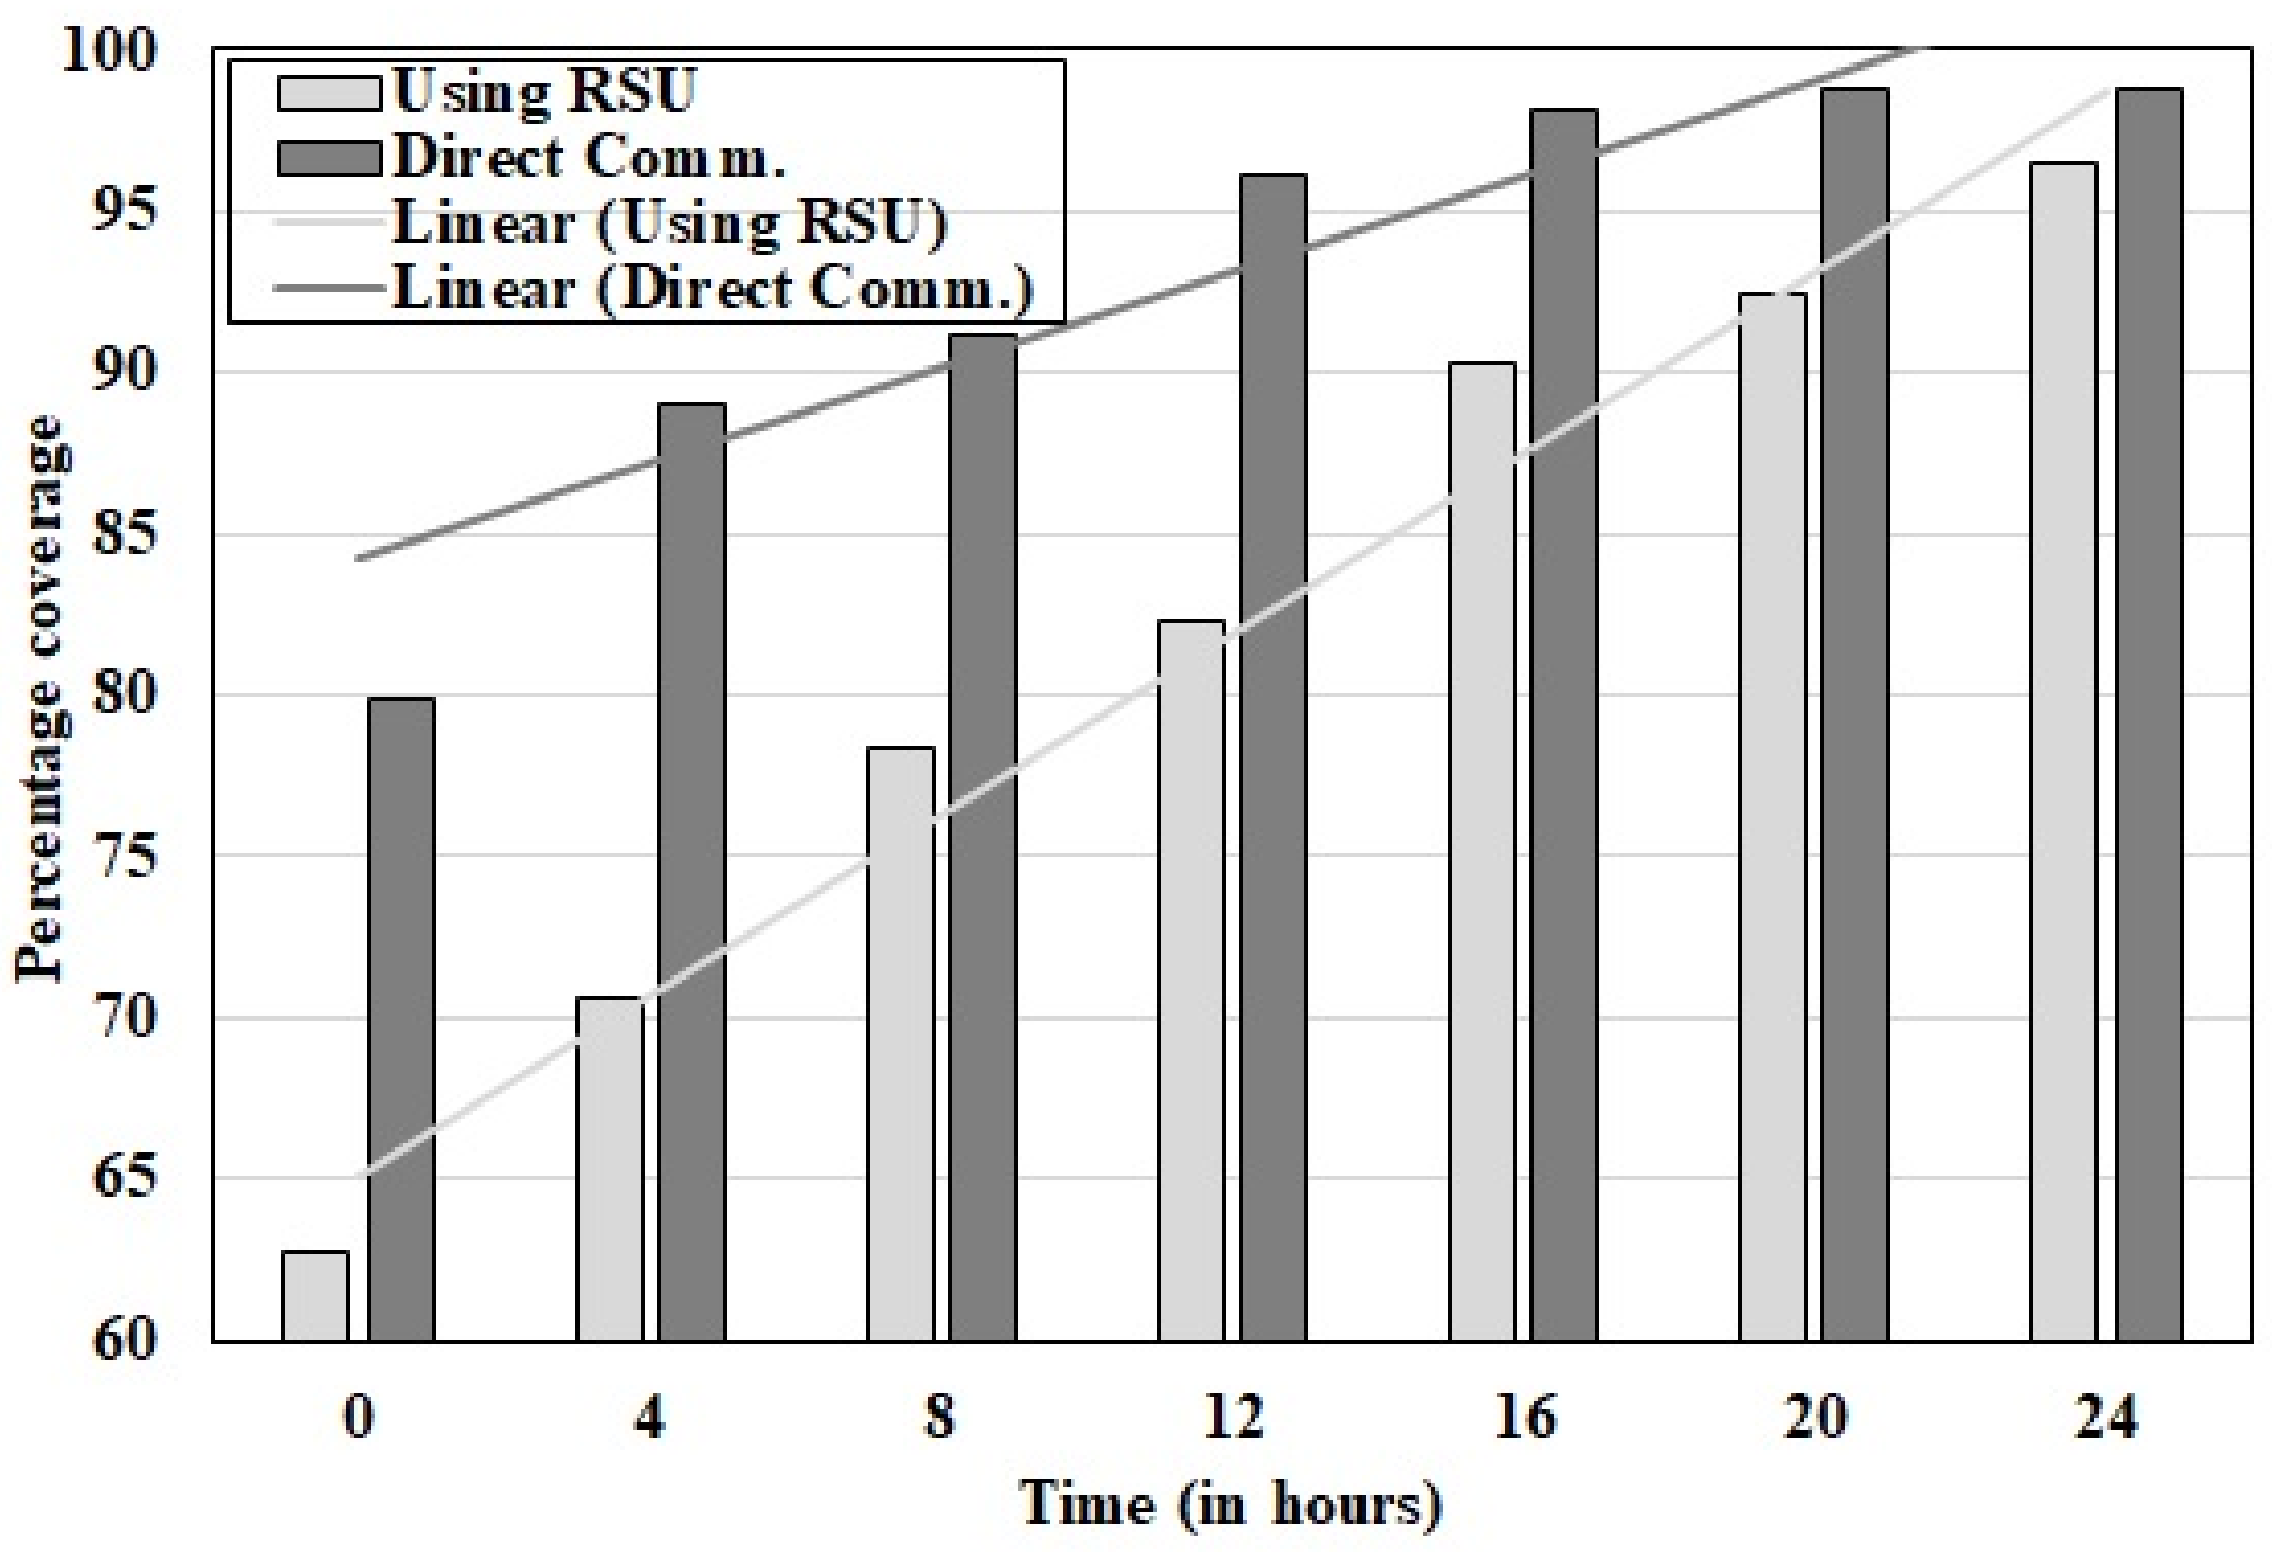
On the other hand, whenever the CC server receives the software update, it will forward this data to RSUs. Now, vehicles will pick the data whenever they are in the wireless range of these RSUs and start the diffusion process. After collecting data from RSUs, the vehicles transfer data to smart devices whenever they are in their wireless range. In this case, we apply the greedy Algorithm 5 on Beijing city traces to identify the most popular location of the selected area as shown in
Figure 11. The cluster size for this evaluation is considered equal to 1000 m
and the number of taxi-cabs as 400. We consider the case of 1000 m
grids and identify 36 locations. We assumed that RSUs are installed at these locations and are directly connected to the CC server by the internet. In this case, there is no need to share the internet connections of smart vehicles. This process will be slow compared to direct communication because a vehicle will first visit in any of RSU installed grid clusters, then it will start the diffusion process.
We do not consider any particular propagation model and pairing delay in both of the cases because our proposed network is independent of any wireless technology.
Figure 12 shows the delay is higher than when there is direct communication. As the delay-tolerant interval increases, the coverage in both cases increases, which is around 98% in direct communication and 96% otherwise when we use the RSUs. When we have a higher delay-tolerant interval, then the latter case under RSUs provides good coverage and saves the cost of internet connections to smart vehicles.

