Abstract
Voluntary approaches to improving sustainability in agriculture can contribute significantly to reduce the sector’s negative environmental impacts and provide a foundation for sustainable land use and farmers’ incomes. We investigate what motivates farmers to implement comprehensive sustainability management on their farms. For this purpose, we use a structural equation model (SEM) to evaluate the individual factors influencing the decision-making process within the technology acceptance model (TAM). Our empirical data from 363 farmers fit the theoretical model very well. The model confirms a positive influence of expected economic rewards and subjective norms on the perceived usefulness of such an innovation. However, ease of use is most important, as it is related directly to the stated intention to use a standard. In addition, the data indicate a high, significant, and direct effect of prior knowledge of on-farm sustainability management on stated intent to use a standard. These findings can serve as a starting point to improve not only existing sustainability management systems, but also emerging farm management information systems (FMISs), or agri-environmental schemes with the aim to make their use more attractive. However, further research is needed to verify the results by means of practical applications.
1. Introduction
The Representative Concentration Pathway (RPC) scenarios RCP 4.5 and RCP 8.5 estimate climate warming of 1.5 to 4.0 °C over the next 80 years [1], and agriculture contributes substantially to global greenhouse gas (GHG) emissions [2]. Consequently, farmers face an epochal challenge in the early 2020s to transform their agriculture into an efficient, resilient, and more sustainable food production and land use system [3,4]. In Europe, societal interest in the sustainability of farming processes and consumer demand for sustainable food is growing [5,6,7,8]. Recent European policy decisions, such as the emphasis on sustainability in the European Union (EU) Common Agricultural Policy (CAP) proposal for 2021–2027, confirm these developments [9]. Strategies to achieve greater sustainability in agricultural production processes range from focusing on organic farming [10,11], offering more efficient agri-environmental management schemes [12,13], and fostering smart farming technologies [14,15] and digital agriculture [16,17] to improving farm management [18,19,20] or implementing systematic farm sustainability management [21,22]. The latter can be achieved by means of “sustainability standards” that implement process documentation, reference values, and certifications to guarantee sustainable production to buyers, wholesalers, producers, and consumers [23]. The implementation of the above-mentioned policy measures is voluntary for farmers and often supported by state funding. Therefore, the individual decisions of farmers play an important role in the success of these measures and in the development of support activities aimed at increasing acceptance. A comprehensive understanding of the factors influencing farmers’ decision-making is therefore crucial for the design of effective policies. In addition to well-known socioeconomic factors such as farm size and farmers’ age or educational level [24], psychological aspects [25,26,27,28] and the design of the respective measure or innovation are increasingly the focus of behavioral economic studies [29,30,31]. Innovation adoption literature linked to farmers’ behavior increasingly considers subjective norms [28], self-efficacy [32], and risk attitudes [33] additionally to cognitive skills [25] in farmers’ decision-making processes.
In this article, we aim to contribute to a better understanding of farmers’ perceptions and attitudes towards the use of a sustainability standard. For this purpose, we investigate the impact of farmers’ expectations, e.g., in terms of economic reward or prior knowledge, on their stated intention to adopt such a standard. We also investigate the role of the so-called perceived ease of use of this form of innovation. We apply the explanatory approach of the technology acceptance model (TAM), which we use in a structural equation model (SEM) to examine our data. We utilize Hannus’ data set [34] from a survey of 598 German farmers who participated in an online survey on a generic sustainability standard for the whole farm covering all three pillars of sustainability. In their article, “Acceptance of sustainability standards by farmers—empirical evidence from Germany”, Hannus et al. [35] explain the preferences stated in a discrete choice experiment included in the survey, using the constructs “attitude”, “knowledge”, and “awareness”. They found no impact of attitude and awareness on the stated decision. This is in contrast to the literature and motivated us to investigate further the interplay of the various underlying motivations for adopting such a complex and impactful management tool. In the present study, we investigate the intentions to use an agricultural sustainability standard amongst German farmers. In particular, we focus on the underlying psychological factors such as expected personal and social rewards, the role of previous knowledge, and perceived ease of use.
The literature provides various concepts for assessing sustainability and improving farming processes. We follow Allen et al.’s [36] definition of sustainable agriculture: for improving long-term sustainability, the total impacts of the farming system (environmental, social, and economic impacts) need to be assessed at the whole-farm level. Thus, the underlying measurement and assessment system determines sustainability management at the farm level. In the last decade, various approaches to assessing and improving sustainability were described in the literature, e.g., by Bockstaller et al. [37], Lebacq et al. [38], Thiollet-Scholtus and Bockstaller [39], Louwagie et al. [40], and Pacchini et al. [22]. European measurement and assessment tools, developed over time, differ considerably in terms of system objectives, assessment accuracy, and sustainability requirements [21,37,41]. Nevertheless, voluntary sustainability management systems or standards evolved from some of the original scientific assessment approaches. In Germany, the best known are the Criteria System for Sustainable Agriculture (KSNL) from the federal state of Thuringia, the Sustainable Agriculture Certificate of the German Agricultural Society (DLG), and the Swiss Response-Inducing Sustainability Evaluation (RISE). None of them has yet gained greater acceptance amongst farmers in Europe. This recently led to a further development of the RISE system into the Sustainability Monitoring and Assessment Routine (SMART) [42,43]. These farm- and process-focused standards must be distinguished from standards for processors and retailers. Most consumer-oriented standards only consider individual farm types or single products.
The DLG Sustainable Agriculture Certificate served as a blueprint for the survey data used in the present study. This standard uses a set of 22 indicators to assess ecological, economical, and social issues of an agricultural enterprise in order to represent the desired balance between agricultural value creation and a company’s environmental and social impact. In contrast to broadly recognized environmental management approaches, such as ISO 14001 or the EU Eco-Management and Audit Scheme (EMAS), the DLG Certificate is not primarily aimed at the continuous improvement process. The standard initially focuses on an entry-level evaluation of the farms’ overall sustainability in the three named pillars. An assessment basis is provided for the farms by specifying guideline values that go beyond the legal requirements. Thus, the standard provides the basis for not only continuous improvement but also benchmarking between companies. It aims at field crop production and includes, for example, humus inventories and nitrogen balances for the farm. The farmers’ survey data were collected in cooperation with the standard owner (DLG). Since several DLG members did not even know “their own” sustainability standard, the survey referred to a universally valid, comprehensive standard for agricultural sustainability that takes into account and continuously improves all three pillars of agricultural sustainability.
The following three research questions summarize the objectives of the present study: (1) What factors have an impact on farmers’ intention to use a sustainability standard? (2) What are the most important impact factors? (3) What implications do the results have for the further development and promotion of sustainability standards? Consequently, our study aims at identifying reasons for the low uptake and identifies measures for future improvements in standard design and its promotion.
This paper is organized as follows: Section 2 presents the theoretical foundations of the TAM, provides background information on the hypotheses, and illustrates the theoretical model that is tested in our further analysis. Section 3 gives an overview of the applied methodology. It introduces the process of structural equation modeling and gives an overview of data collection, the questionnaire, and the resulting farmer sample. Empirical results of the survey, the measurement model, and the full SEM results are presented in Section 4. In Section 5, we conclude with a discussion of the meaning of results for the intention to adopt this form of innovation, followed by an outlook on further research and implications for policy.
2. Theoretical Background and Conceptual Framework
In the following, we first give an overview of the theoretical framework from the literature (Section 2.1). Section 2.2 presents the underlying hypotheses and illustrates the resulting adoption model, which was tested with the farmers’ online survey data.
2.1. Technology Acceptance Model
The applied conceptual framework for mapping farmers’ decision-making processes regarding their intention to adopt a sustainability standard is based on the technology acceptance model (TAM). The TAM was first developed by Davis [44] and has in the course of time become an established method for explaining adoption behavior, particularly in the context of technology innovations [45,46]. TAM draws on the theory of reasoned action (TRA) [47] and the theory of planned behavior (TPB) [48], both psychological approaches often considered in studies of farmer decision behavior [49,50,51]. According to Fishbein and Ajzen the “intention to perform behavior X” depends on two factors: the “attitude towards behavior X” and the “subjective norm concerning behavior X” [47] (p. 16). They define the subjective norm (SN) as follows: “The subjective norm is the person’s perception that most people who are important to him think he should or should not perform the behavior in question” [47] (p. 302). Theory of Planned Behavior considers the constructs “attitude” and “perceived behavioral control” in addition to the “subjective norm” to explain a revealed behavioral phenomenon. Davis [44,52] applied this concept in the context of technology adoption and introduced two further constructs to explain the “behavioral intention” (INT) to use a technology. These are the “perceived usefulness” (PU) and the “perceived ease of use” (PEU) of an innovation or technology. From the initial TAM (which did not include SN), additional models TAM2 and TAM3 have been derived and studied over time [53,54]. In 2000, Venkatesh and Davis [53] proposed and tested the first extended TAM version (TAM2) statistically with data from four longitudinal studies. They identified and included in addition to social influence (in the form of SN) some cognitive instrumental processes amongst the factors explaining the perceived usefulness. Thus, the extended model not only encompasses the technology acceptance perspective, but also allows the inclusion of some characteristics of an innovation itself (e.g., job relevance, output quality, and result demonstrability). Further, TAM2 considers former “experience” and “voluntariness”.
The approach is widely used to analyze and better understand farmers’ adoption behavior. Schaak and Mußhoff [30] investigated the “adoption of grazing practices in German dairy farming” using a model build upon the TAM framework. They found that the PU and PEU have a significant influence on the adoption of grazing practices. Furthermore, the production situation on the individual farm and the SN of the farmers towards grazing has an impact on the adoption behavior. Schulze et al. [55] used the TAM to gain insights on organic certification in agriculture. Their participating farmers were “not convinced” by the certification systems’ cost–benefit relationship and found the bureaucratic burden of organic certification too high, which decreased its acceptance. Decision problems regarding the German third-party certification system QS were studied by Jahn and Spiller [56] using TAM. This study also revealed influencing factors that had an impact on intention to use or adoption via the PU or PEU. Luhmann et al. [57] present a first sector-specific study on the motivation to participate in sustainability standards. In their empirical study, they distinguish intrinsic and extrinsic factors to specify user motivation, identifying three groups of farmers that differ in their PU, general perception, attitude, and intention to use a sustainability standard. They link these factors to the TAM model to derive cause and effect. In the study of Naspetti et al. [58], only SN can be associated with PU and INT. Further examples for the use of TAM as a theoretical framework are provided by Rezaei et al. [29], Aubert et al. [59], Caffaro et al. [31], and Bagheri et al. [60].
2.2. Hypotheses and Model Development
Table 1 gives an overview of the hypotheses that we test in our adapted technology acceptance model. In addition to the verbalized hypothesis, the table indicates the “path” that shows the direction of the assumed impact from one (latent) variable to another.
We derived our hypotheses based on former studies using TAM to explain adoption behavior and on publications from various fields of innovation adoption amongst farmers, which also use alternative models. Even if Borges et al. [61] found contradicting proof for the role and impact of economic motives on innovation adaption in the literature, we decided to include this aspect in our model. Several related studies, e.g., those of Pineiro et al. [62], Trujillo-Barrera et al. [63], and Hannus et al. [35], indicate that “economic rewards” (ER), which are expected to result from the use of a standard, positively motivate farmers for adopting this kind of innovation. Following the findings of Hannus et al. [64], we distinguish the expected “economic rewards—due to process optimizations” (ER I) from expected “economic rewards—based on an improved financial farm situation” (ER II). Both we expect to positively affect the perceived usefulness of a sustainability standard. This would also be in the line with the publications of Coteur et al. and de Olde et al. [21,65] on the nature of sustainability assessment tools.
In addition to “subjective norm” (SN), which is recently again in the focus of several adoption studies [30,58,66], we include “personal rewards” (PR) a farmer can receive from the implementation of a sustainability standard. Both are expected to affect the PU of a sustainability standard positively. Personal rewards had been described by Howley [27] and investigated by Trujillo-Barrera et al. [63]. Even if the study of Trujillo-Barrera et al. could not confirm that personal rewards had an effect on farmers’ decision to invest in sustainable stables, we decided to test if they might be linked to SN and affect PU in the case of less cost-intensive management innovations. Sustainability standards are not widespread; thus, only few farmers may have former experience. In addition, studies, e.g., those of Hannus et al. [35], Canavari et al. [66], and Läpple and Kelly [28], confirm a reasonable impact of previous knowledge on the intention to adopt an innovation such as a sustainability standard, smart farming technology, and organic farming, respectively. Based on these findings, we use the factor “knowledge” instead of “experience”, which TAM2 suggests. We assume that previous knowledge positively affects the perceived usefulness of a sustainability standard and directly affects the “intention to use” (INT) a sustainability standard.

Table 1.
Hypotheses and paths.
Table 1.
Hypotheses and paths.
| Hypothesis | Definition | Path | References |
|---|---|---|---|
| H1 | Expected economic rewards—due to process optimizations (ER I)—positively affect the perceived usefulness (PU) of a sustainability standard. | ER I → PU | [21,35,57,62,63,67] |
| H2 | Expected economic rewards—based on an improved financial farm situation (ER II)—positively affect the perceived usefulness of a sustainability standard. | ER II →PU | [21,57,62,63,64,65,67] |
| H3 | The personal rewards (PR) positively affect the perceived usefulness of a sustainability standard. | PR → PU | [27,57,67] |
| H4 | The subjective norm (SN) positively affects the perceived usefulness of a sustainability standard. | SN → PU | [30,58,66,67] |
| H5 | The subjective norm (SN) positively affects the personal rewards that are expected of a sustainability standard. | SN → PR | [63] |
| H6 | Knowledge (KNOW) positively affects the perceived usefulness of a sustainability standard. | KNOW → PU | [28,35,66,67] |
| H7 | Knowledge positively affects the intention to use (INT) a sustainability standard. | KNOW → INT | [28,35,66,67] |
| H8 | The perceived usefulness (PU) positively and directly affects the intention to use a sustainability standard. | PU → INT | [29,30,60,66,68] |
| H9 | The perceived ease of use (PEU) positively affects the perceived usefulness of a sustainability standard. | PEU → PU | [30] |
| H10 | The perceived ease of use (PEU) positively and directly affects the intention to use a sustainability standard. | PEU → INT | [29,30,55,57] |
| H11 | Risk perception (RP) negatively affects the perceived usefulness of a sustainability standard. | RP → PU | [27,63] |
| H12 | Risk tolerance (RT) positively affects the intention to use a sustainability standard. | RT → INT | [33,54,63] |
Further, we include the “perceived usefulness” (PU) and the “perceived ease of use” (PEU) as key elements of the TAM. Several studies confirmed an important and positive impact on the innovation adoption [29,30,60,66,68]. We expect that the PU positively affects the intention to use a sustainability standard and that the PEU positively affects the PU and has a direct impact on INT. In addition, we investigate the role of risk perception and risk attitude following the results of Trujillo-Barrera et al. [63]. We assume that the “risk perception” (RP) of the innovation “sustainability standard” reflects, to some extent, the anchoring beliefs Venkatesh and Bala [54] identified and affects the perceived usefulness of this innovation negatively. Further, we assume that “risk tolerance” (RT) might have a direct positive effect on the stated behavioral intention (INT). In our adapted decision model, PU, PEU, and INT constitute the central elements analogous to the original TAM approach (see Figure 1). Furthermore, as in TAM2, we include the subjective norm and economic rewards—representative for a characteristic of the innovation itself—and additionally consider personal rewards. In accordance with TAM3, we include two factors that are associated with risk.
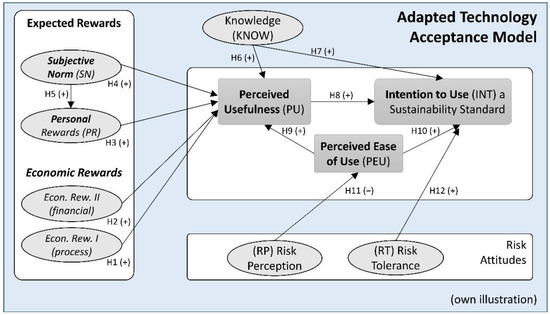
Figure 1.
Theoretical framework based on Venkatesh and Davis [53] and Venkatesh and Bala [54].
3. Methodology
Section 3.1 first introduces the methodological approach used, namely structural equation modeling. Section 3.2 provides a brief overview of the survey and the data collection and a description of the used questionnaire, followed by a description of the resulting farmer sample in Section 3.3.
3.1. Structural Equation Modeling
Structural equation modeling is a technique or framework for multivariate data analysis. It often combines factor analysis measuring latent constructs with multiple items in the so-called “measurement model” and multiple regressions in the so-called “structural model” to estimate a series of interrelated dependence relationships [69]. Within the framework of SEM, a distinction is made between observed variables and latent variables. These are key features of the method. Latent variables allow integrating hypothetical constructs in the model to “reflect a continuum that is not directly observable” [69] (p. 13). In this process, factors are formed from a series of indicator variables creating new latent variables. In the further model, interrelationships can also be integrated between individual latent variables, whereby these are measured reflectively or formatively [69,70,71]. However, the design of a structural equation model and its depiction in form of a path model should always be led by the theory and verify theoretically expected assumptions. SEM has gained importance in the modeling of categorical observed variables and in the integration of non-normally distributed variables [72,73].
We follow the recommended procedure for structural equation modeling. First, an initial exploratory analysis (EFA) provides information on the quality and suitability of the observed variables for the formation of latent constructs; a subsequent confirmatory factor analysis (CFA) enables the assessment of the intended latent constructs on the basis of their common variance or covariance. Finally, theory-based full structural models represent more complex relationships and dependencies that can be used to test hypotheses [70]. The main limitations of this approach are that SEMs require large samples to provide reliable results. In addition, the evaluation of SEM should not overemphasize significance tests in the results, but rather focus on the evaluation of the model as a whole [69].
3.2. Data Collection and Questionnaire
We based the standard described in the survey on the German Farmers’ Society’s comprehensive sustainability management standard. Hence, the association supported the data collection in both a pretest and the main study. The association invited selected members and nonmembers via email to participate in the surveys. The initial online questionnaire was pretested in April 2017 by collecting answers from 100 participants. After a preliminary evaluation of the responses, the online questionnaire was improved and data collection started in July 2017. The survey closed four weeks later. We collected data of 598 German farmers, of which 474 responded to the item questions described below.
The questionnaire began with introductory information on the aims and structure of the entire study [see 34]. The first section of the survey comprised questions on farmers’ former involvement with the topic, attitudes, perceptions, and expectations towards sustainability standards. This was followed by a discrete choice experiment (DCE) (for the evaluation of the experiment see [35]). The survey concluded with questions on innovation behavior and on risk perception, risk tolerance, and risk aversion. Additionally, information on the farm structure (e.g., farm size, type, participation in agri-environmental schemes) and socioeconomic aspects of the farmers such as gender, age, education, and marital status was collected. The questions for the factor measurement followed the example of Trujillo-Barrera et al. [63] and were adapted to the new context. This resulted in 10 questions on economic rewards (er_1 to er_10), 6 item-questions on subjective norm (sn_1 to sn_6), and 6 item-questions on personal rewards (pr_1 to pr_6), whereas 3 questions on personal rewards with regard to one’s own ecological conscience were added (pr_4 to pr_6). Further, four questions capturing experiences and previous knowledge of sustainability standards (know_1 to know _4) were included. Farmers also had to indicate their intention to use a sustainability standard on their farm under certain premises (int_1 to int_5). Finally, four questions investigated farmers’ risk perception regarding the introduction of a sustainability standard (rp_1 to rp_4), and four questions asked about their risk tolerance in general (rt_1 to rt_4). Thirty-nine questions were used for item measurement. All of these questions used a 7-point Likert scale to measure the extent of agreement, with seven levels ranging from “absolute rejection” (category −3) of the statement to “high agreement” (category +3). Hannus [34] provides the original questionnaire in German and English language.
3.3. Sample Description
The internal consistency of responses to the questions used to measure constructs in SEM is very important. Gummer et al. [74] state in their analysis of instructed response items (IRIs) that “excluding respondents who failed an IRI did not significantly alter the results of substantive models” but could reduce measurement error. Therefore, we assessed consistency within responses using a pair of contrasting questions as attention control questions [75]. The first question was “I can imagine using a sustainability standard on my farm”; the opposing question was “A sustainability standard is absolutely not an issue for my farm!” In both cases, agreement with the statements was determined, with selectable responses ranging from absolute disagreement (−3) with the statement to high agreement (+3), based on a continuous distribution. We set the cut-off for inconsistent responses or incorrect responses at an absolute sum value of the two responses of 4 or more. We cleaned the data set by excluding participants from the analysis who failed the attention test and had apparently answered inconsistently [74]. Furthermore, responses from organic farmers and farmers in conversion were excluded. This resulted in 363 data sets on which the analyses in this study are based.
The data collection was performed among farmers from the entire federal territory of Germany with a largely representative distribution over the entire country (cf. [35]). The average size of the utilized agricultural area (UAA) of the sample farms is more than 3 times that of the average German farm. The share of arable farms in the sample is 36%, followed by granivore farms with a share of 22% and mixed farms with 20%. Forage farms form the smallest group with 18%. This does not reflect the average distribution of farm types in Germany. Most German farms are forage farms (41%), followed by arable farms (30%) and mixed farms (13%). Thus, granivore farms that fatten poultry or pigs are significantly overrepresented in our study. Even though the sample is made up of 51% association members and 49% nonmembers, this shift in the farm type composition, as well as the high average UAA, is because the survey was conducted together with the German Farmers’ Society. The association represents the modern, future-oriented, and larger farms up to the ”industrial farming” type farms. However, we find more than 50% of farms in the sample participating in the AES with different amounts of UAA under contract. Fulltime farmers, younger than the German average, characterize the sample additionally. Most of the participants live with a partner and about 40% already have a successor. In addition, we have a relatively high proportion of participants with higher education. Table 2 shows the characteristics of the resulting sample.
Table 2.
Descriptive sample statistics.
Therefore, the results of our analysis are not representative of the German average farmer or farm. However, they show the decision-making structures of larger farms that are capable of growth in the future. In Germany, 15% of the largest farms cultivate around 62% of the UAA of the country [78]. Consequently, our results can help to better target the design of sustainability standards to the needs of this group of farmers and thus achieve implementation on a large agricultural area. This can help to improve sustainability standards and thus increase the acceptance of such offers in the future.
4. Results
This section is organized as follows: Section 4.1 illustrates the empirical results to the item questions. The subsequent Section 4.2 describes the measurement model resulting from an initial exploratory factor analysis (EFA) and the results of the performed confirmatory factor analysis (CFA). This sets the starting point for further data analysis using a structural equation modeling approach. Section 4.3 presents the results of the path model.
4.1. Empirical Results
Figure 2 shows the 39 individual statements in the eight topic areas and the mean values of the respective answers. Table A1 in Appendix A also gives an overview of the number of observations, mean values, and standard deviations of all item questions. On average, the participating farmers do not expect any significant improvements in technical performance, efficiency gains, and increases in productivity or reductions in production costs from the introduction of a sustainability standard. Regarding the economic rewards deriving from the process optimizations, some of them expect even higher labor input. In contrast, improvements in financial performance, selling prices, higher return on investment (ROI), and higher profits are expected on average.
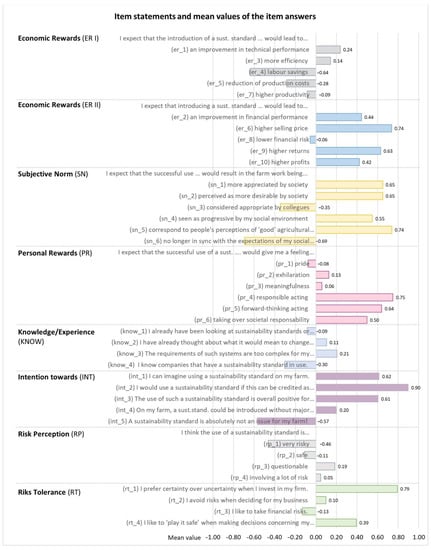
Figure 2.
Mean values of the singular questions (source: own illustration).
Many participants state that the use of a sustainability standard on their farm would result in the farm work being “more appreciated and perceived as more desirable by society, seen as progressive in their social environment, and correspondent to people’s perception of ‘good’ agricultural enterprises”. However, the majority believe that with the introduction of a sustainability standard, their farming would “no longer be in sync with the expectations of their social environment”. For the first three questions, regarding personal rewards (on individual positive feelings such as pride, exhilaration, and meaningfulness) there is no clear trend. The mean values for the questions on perceived sustainability in action, on the other hand, are clearly in the positive range. The results reveal that only few participating farmers “had already been looking at sustainability standards before and even fewer know companies that have a sustainability standard in use”. Nevertheless, the general intentions towards the adoption of a sustainability standard are positive for all of the questions; even the control question reflects this attitude. On average, the participants do not perceive the use of a sustainability standard as particularly risky, a little uncertain, or questionable. Risk tolerance in the participating farmer sample is rather low. Most farmers prefer certainty when they invest in the farm. Only some are likely to take on financial risks or do not avoid risky decisions in general.
4.2. Construct Measurement and Validation
The first part of data analysis evaluates the quality of the variables—described in the previous section—to provide reliable and valid latent constructs. We started the analysis with an exploratory factor analysis evaluating the 39 item-questions. For all the statistical analyses, we used the program STATA 15, in particular STATA’s sem package and the SEM Builder. We applied a maximum likelihood factor analysis as our variables were non-normal distributed. The analysis with eight factors and an oblique “oblimin” rotation delivered the best results from our large set of independent variables and resulted in a Kaiser–Meyer–Olkin (KMO) measure of sampling adequacy of 0.912. In the EFA, we could confirm the expected eight factors: economic rewards by process optimization (ERI), economic rewards by financial improvements (ERII), subjective norm (SN), personal rewards (PR), knowledge with sustainability standards (KNOW), intention towards sustainability standards (INT), risk perception (RP), and risk tolerance (RT). In a second step, we checked whether the variables met the two criteria in the EFA: (1) to load more on their own construct than on any other and (2) to show a factor loading of 0.6 or higher [70,79]. The indicators that did not match these criteria were dropped before the next step, the confirmatory factor analysis [80].
CFA is a special form of a structural equation model [81]. The CFA assumes that an underlying set of latent constructs can be explained by observed variables (items). Further, it is possible with the CFA to test whether any omitted paths or correlations between the items or the errors should be included in the model. Table 3 displays the resulting CFA coefficients (factor loadings) with standard errors and significance levels, as well as the coefficients of determination (R-squared), which report “the fraction of variance explained by each indicator” [82] (p. 197). For example, the variable er_9 expected “higher returns” explains 87.6% of the variance of the latent factor “economic rewards/financial situation (ERII)”, and the variable know_1 (statement for the variable know_1: “I already have been looking at sustainability standards or systematic sustainability assessment for agricultural companies”) explains 80.8% of the variance of the latent factor “knowledge on sustainability standards (KNOW)”.
Table 3.
Standardized loadings and reliabilities of the initial factor model.
The maximum likelihood (ML) CFA estimation confirmed all assumed latent constructs. We assessed the goodness of fit (GOF) with the recommended standards by Hu and Bentler [83] and Bagozzi and Yi [84]. The CFA resulted in a root mean square error of approximation (RMSEA) of 0.060 (C.I. 90%: 0.053–0.066), a standardized root mean square residual (SRMSR) of 0.037, a comparative fit index (CFI) of 0.946, and a Tucker–Lewis index (TLI) of 0.936. Further, we performed a Satorra–Bentler adjusted ML-estimation as we used ordered categorical data and not all variables were quasinormally distributed [85]. The Satorra–Bentler adjusted quality criteria are root mean square error of approximation (RMSEA_SB) of 0.049, adjusted comparative fit index (CFI_SB) of 0.956, and Tucker–Lewis Index (TLI_SB) of 0.948. A good model fit is indicated by the following GOF indices: RMSEA ≤ 0.060, SRMSR ≤ 0.08, CFI ≥ 0.95, and TLI ≥ 0.95 [83]. The measurement reliability is indicated by Raykov’s factor reliability coefficient (which is comparable to Cronbach’s α) and should be ≥0.7 [82]. The Raykov coefficients of all eight latent factors are significantly above the recommended value. Further, we tested the average variance extracted (AVE) regarding discriminant validity and convergent validity, without discovering any problems. All latent factors’ AVE is above 0.60.
4.3. Structural Model
The CFA model delivers sufficient model quality for further use of the latent constructs, although a certain amount of variance seems not yet to be sufficiently explained. Therefore, we use these preliminary findings as a starting point for the hypothesis testing within the more complex longitudinal SEM following our modified TAM. We use the latent variables indicated in Table 3 for the reflective measurement of the accordingly named latent variables in our model.
The structural equation modeling process aims on the one hand to build a model fitting as well as possible to the data, and on the other hand, to find a model that reflects the theoretically expected reality as well as possible. We started with a higher-order latent measurement model according to the modified TAM presented in Section 2.2. In this model, the latent variables ERI, ERII, SN, and PR are reflective measurements of the focal construct perceived usefulness (PU). We included an additional formative measurement that captures the perceived ease of use (PEU) to represent the theoretical model. PEU has an impact on the perceived usefulness and partially explains the intention to use a sustainability standard (INT). INT serves as a dependent latent variable and is captured as a reflective measurement. It is directly impacted by the latent constructs PU, PEU, knowledge (KNOW), and risk tolerance (RT), with KNOW and RT measured reflective. The latent construct risk perception (RP) and the two variables int_4 and know_3 are used to capture farmers’ PEU. These two single variables had been initially excluded after the EFA because their variance does not correlate to that of the other variables. For constructing formative measures, such variables might be reincluded in an SEM if it seems reasonable from the theoretical deduction [71]. In our model, KNOW, RP, and RT are the only exogenous constructs; all others are endogenous as displayed in Figure 3. This model we estimated with a Satorra–Bentler adjusted maximum likelihood estimation in STATA.
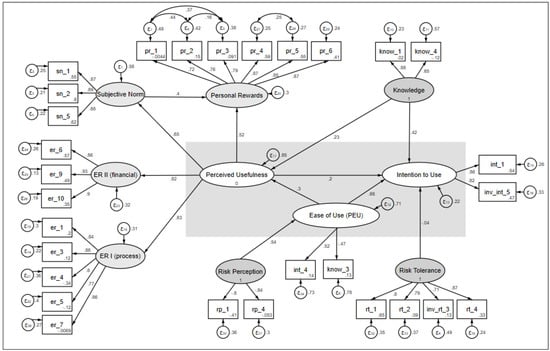
Figure 3.
Structural equation model with normalized coefficients (Own model results made with STATA 15).
The path diagram in Figure 3 shows the results of the model estimation. The estimation of the GOF indicators results in an RMSEA of 0.053 (C.I. 90%: 0.047–0.060), with the CFI of 0.948, TLI of 0.941, SRMR of 0.066, and an overall coefficient of determination (CD) of 0.996. The Satorra–Bentler adjusted fit statistics delivered the following results (good model fit is indicated by RMSEA ≤ 0.060, SRMSR ≤ 0.08, CFI ≥ 0.95, and TLI ≥ 0.95):
- RMSEA_SB of 0.044;
- CFI_SB of 0.957;
- TLI_SB of 0.952.
The three exogenous latent variables (KNOW, RT, and RP) have an average variance extracted (AVE) above 0.60. Thus, there are no problems regarding discriminant validity and convergent validity [82,83,84]. The factors KNOW and RT have Raykov coefficients significantly above the recommended value of 0.7. The coefficient for the latent construct RP is 0.69, which is very close to the recommended threshold and thus can be considered still sufficient. Following the literature, we assume a very good fit of our model [70,81,86].
4.4. Evaluation of the Structural Model
The structural model confirms most of the hypothesized relations, as Table 4 shows. The table displays the single path loadings, their level of significance, the respective standard errors, and the underlying hypotheses. The coefficients of determination (R-squared) [82] indicate to what extent the variance of the tested endogenous variables is explained by the input variables. This means, e.g., that for the latent (endogenous) construct INT, the variables PEU, PU, KNOW, and RT explain 77% of the total variance, with RT not being significant. For both endogenous constructs ER I and ER II, which reflect expected economic rewards, we find high significant loadings and a high R2 and thus can confirm H1 and H2. Compared to all other loadings and coefficients of determination, the single impact of the economic rewards on the PU is substantial. Further, the model confirms that higher stated personal rewards (PR) positively affect the PU (H3), as does the subjective norm (SN) (H4). However, PR is positively influenced by the perceived SN (H5) and thus has both a direct and an indirect influence on PU.
Table 4.
Structural model results.
As assumed, previous knowledge (KNOW) has a significant positive impact on both PU (H6) and INT (H7). The influence of KNOW on INT, compared to the influence of PU, has a high factor loading (0.427). Hypothesis 8, the positive effect of PU on INT, can also be confirmed, but with less coefficient loading (0.195). The perceived ease of use (PEU) shows high significant loadings on both the intention to use a sustainability standard (INT) and the PU, confirming the assumptions of our adapted TAM (H9 and H10). In the line with the assumptions under H11, our structural model displays that PEU, reflected by the variables int_4 and exp_3, is negatively affected by RP. Finally, the model does not confirm the positive effect of risk tolerance (RT) on INT (H12).
5. Discussion and Conclusions
We examined German farmers’ intention to use a sustainability standard with an adjusted TAM using an SEM approach on previously collected data. Our results are based on a sample of larger-than-average German farms with younger farm managers. Thus, the sample represents the “forward-looking” share of farms in Germany. We therefore expect that the results are partially valid for smaller forward-looking farms. Nevertheless, there is a sample bias due to the data adjustment carried out and due to the basic nonparticipation of smaller farms. Given that most of our results are in line with the European literature [28,31,58,63,66], we assume that the results might not only be relevant for Germany. They may also be valid for other European or in particular Central European countries. In other cultural contexts, the weightings and effects of the individual influencing factors may be quite different. Our data model confirmed at a sufficient level of significance virtually all of the expected hypotheses of the developed theoretical model. The only exception is the effect of risk tolerance on the intention to adopt a sustainability standard. Here, no significant influence of risk tolerance on the intention to use a standard could be shown.
Three aspects of our results are of particular interest: (1) First, our data confirmed the latent construct ER, as identified by Trujillo-Barrera et al. [63]. Even so, we had to separate the variables on expected economic rewards in two groups to integrate the latest findings on the effects and possible advantages of sustainability standards and sustainability assessment tools [21,87]. One group (ER I) describes economic rewards driven by process improvements, and the other group (ER II) describes economic rewards driven by higher gains. We expected differences in the charges of the two constructs, but both achieved about the same level. This is a remarkable result, as it confirms the evaluation of Hannus et al. [35], which indicates the influence of process improvement on the stated intention to use for the first time in the context of sustainability standards. Coteur et al. [21] describe the goal of farm development as a property of sustainability assessment tools (SAT) or sustainability standards. Process improvements also contribute to this goal. However, they also contribute to the lack of wider acceptance of existing systems, as the different goals of improvement or certification are not tangible or visible to users [21].
(2) Second, Bagozzi discusses some shortcomings of the TAM approach in explaining adoption decisions [88]. According to him, action desires, individual reactions, social identity, and collective intention play a role in the adoption processes. These aspects are considered by the TAM only partially. In contrast, Garforth [50] used TRA and TPB to explain why decisions on the farm level do not always follow the assumption of economic rationality. He concluded that a “complex set of core values” [50] (p. 66) contributes in the social context to this revealed phenomenon. Gocsik et al. [49] considered “personal norms” in their theoretical framework to explain farmers’ animal welfare decisions. This is in the line with the results of Trujillo-Barrera et al. [63], but instead of the personal norms, they captured “personal rewards” that result from the respective behavior. In our study, we summarized six item-questions into one latent factor for “personal rewards” (PR), although the first three variables address rather personal emotions and the variables 4 to 6 address sustainable and responsible actions. At the same time, we use SN to capture society’s perceived expectations of the participating farmers (sn_1, sn_2, and sn_5), but not the perceived perceptions on the behalf of the peer group (in this case, the other farmers captured, e.g., in sn_3 or sn_6). This is a limitation of our study. It might be possible to obtain an even more accurate picture of the underlying psychological construct in decision-making by separating and quantifying the influencing factors. Possibly, if we could have considered the mentioned factors separately with more variables available, they would have been consistent in their direction of action with those of the tested constructs, but they might have differed in some key areas. In general, SEM can only provide as good and detailed insights as the variables collected and the objectives set in advance allow. Regarding the applied method, it should be mentioned further that the performed Satorra–Bentler adjusted maximum likelihood (ML) SEM estimation tends, according to Xia and Yang [89], to overestimate the model fit for the common fit indices (RMSEA, CFI, TLI) when analyzing categorical variables, even for the adjusted estimates.
(3) Third, previous knowledge and perceived ease of use result in a higher impact on the acceptance than the latent expected rewards or social norms. For German policymakers, this can mean that they should focus either on demonstration farms using a sustainability standard and farmer networks [67] or on providing access to existing databases, which might be used for assessment. Process optimization or financial rewards have considerable impact but do not seem to be exclusively crucial for fostering the intention to use sustainability standards [35,67].
We conclude that the intention to accept a sustainability standard on the producer side of a sustainable food value chain could be increased, at least amongst the younger generation of German farmers with larger farms. Our results confirm the findings from the literature [27,57,58,63] regarding the perception of society as well as of farmers’ own social environment. Both have a relevant influence on the decision-making process. However, further economic benefits and better communication of process improvements could also help [67]. Perceived ease of use still seems to be one of the most important aspects having an impact on the intention to adopt a standard. This implies that a greater impact from promotional measures can be expected. In particular, an easily accessible basis for sustainability assessment, e.g., using data from the EU’s Integrated Administration and Control System (IACS), could provide a solution. Better farmer knowledge of comprehensive sustainability standards could also increase the likelihood of a farmer adopting a standard. In the development of policy instruments within the EU’s CAP, member states have to focus on the one hand on a standard design that is simple to access and on the other hand on concepts and goals for the standards or tools that are easy to communicate. Future research must focus on practical and relevant solutions. These need to be improved in application together with farmers and must be discussed with a broad peer group.
Author Contributions
V.H. conceptualized the complete study, including methodology, data curation, formal analysis, and writing—original draft preparation and editing. J.S. supervised the whole working process. He contributed to the writing and editing. All authors have read and agreed to the published version of the manuscript.
Funding
This research was funded by a scholarship grant of the State Conference of Women and Equal Opportunities Representatives at Bavarian Universities (LaKoF Bayern) Germany: 2015–2017. The APC was funded by the Technical University of Munich (TUM) in the framework of the Open Access Publishing Program: 2021.
Institutional Review Board Statement
Ethical review and approval were not necessary for this study due to an invitation-based, anonymous and voluntary participation. Furthermore, no personal data was collected that could be traced back to individual participants. The addresses used for sending the invitations are known only to the cooperation partner. The raw data collected is only available to the scientists.
Informed Consent Statement
Informed consent was obtained from all subjects involved in the study.
Data Availability Statement
The data set presented in this study is available at https://doi.org/10.1016/j.dib.2020.106250 (accessed on 22 September 2021) [34]. This open access data article provides further information on the data collection, questionnaire, and former analysis.
Acknowledgments
We thank the German Agricultural Society (DLG) for the support of the online survey.
Conflicts of Interest
The authors declare no conflict of interest. The funders had no role in the design of the study; in the collection, analyses, or interpretation of data; in the writing of the manuscript; or in the decision to publish the results.
Appendix A
Table A1.
Overview of the results of the single item-questions.
Table A1.
Overview of the results of the single item-questions.
| Topic 1 and Question | Variable | Response Item/Answer Category | Obs. | Mean | SD * |
| Economic Rewards/ Process Optimization I expect that the use of a sustainability standard on my farm would lead to: | er_1 | an improvement in technical performance | 359 | 0.237 | 1.518 |
| er_3 | more efficiency | 359 | 0.142 | 1.535 | |
| er_4 | labor savings | 358 | −0.637 | 1.659 | |
| er_5 | lower costs | 359 | −0.284 | 1.630 | |
| er_7 | higher productivity | 358 | −0.086 | 1.499 | |
| Economic Rewards/ Financial Situation I expect that the use of a sustainability standard on my farm would lead to: | er_2 | an improvement in financial performance | 360 | 0.444 | 1.591 |
| er_6 | higher selling price | 358 | 0.737 | 1.511 | |
| er_8 | lower financial risk | 358 | −0.056 | 1.513 | |
| er_9 | higher returns | 355 | 0.631 | 1.521 | |
| er_10 | higher profits | 358 | 0.422 | 1.575 | |
| Subjective Norm I expect that with the use of a sustainability standard, my farm work would: | sn_1 | be more appreciated by society | 358 | 0.651 | 1.443 |
| sn_2 | be perceived as more desirable by society | 357 | 0.650 | 1.431 | |
| sn_3 | be perceived as more proper by society | 359 | −0.345 | 1.250 | |
| sn_4 | be considered progressive by my social environment | 356 | 0.539 | 1.370 | |
| sn_5 | better match people’s ideas of ‘good’ agricultural enterprises | 356 | 0.739 | 1.429 | |
| sn_6 | no longer correspond to the ideas of my social environment | 359 | −0.694 | 1.226 | |
| Personal Rewards I expect that successful use of a sustainability standard would lead to me having feelings of: | pr_1 | pride | 354 | −0.076 | 1.532 |
| pr_2 | exhilaration | 357 | 0.126 | 1.541 | |
| pr_3 | meaningfulness | 356 | 0.059 | 1.455 | |
| pr_4 | responsible acting | 358 | 0.749 | 1.470 | |
| pr_5 | forward thinking acting | 358 | 0.640 | 1.465 | |
| pr_6 | taking over societal responsibility | 358 | 0.497 | 1.528 | |
| Knowledge on sustainability standards | know_1 | I already have been looking at sustainability standards or systematic sust. assessment for agricultural companies. | 352 | −0.085 | 1.872 |
| know _2 | I have already thought about what it would mean to change to organic farming. | 353 | 0.105 | 2.047 | |
| know _3 | The requirements of such systems are too complex for my farming. | 347 | 0.205 | 1.402 | |
| know_4 | I know companies that have a sustainability standard in use. | 349 | −0.304 | 1.946 | |
| Intention towards sustainability standards | int_1 | I can imagine using a sustainability standard on my farm. | 361 | 0.615 | 1.360 |
| int_2 | I would use a sustainability standard if this can be credited as a greening measure. | 358 | 0.899 | 1.469 | |
| int_3 | The use of such a sustainability standard is overall positive for a company. | 356 | 0.607 | 1.383 | |
| int_4 | On my farm, a sustainability standard could be introduced without major operational changes, even with limits above the legal requirements. | 351 | 0.202 | 1.431 | |
| int_5 | A sustainability standard is absolutely not an issue for my farm! | 358 | −0.570 | 1.487 | |
| Risk Perception From a financial perspective, I consider the use of a sustainability standard as: | rp_1 | very risky | 356 | −0.463 | 1.281 |
| rp_2 | safe | 356 | −0.112 | 1.145 | |
| rp_3 | questionable | 356 | 0.185 | 1.418 | |
| rp_4 | involving a lot of risk | 356 | −0.048 | 1.292 | |
| Risk Tolerance | rt_1 | I prefer certainty over uncertainty when I invest in my firm. | 360 | 0.792 | 1.205 |
| rt_2 | I avoid risks when deciding for my business | 361 | 0.097 | 1.320 | |
| rt_3 | I like to take financial risks. | 361 | −0.133 | 1.424 | |
| rt_4 | I like to ‘play it safe’ when I invest in my firm. | 358 | 0.394 | 1.247 |
* SD = standard deviation. 1 The topic area of the intended factor variable, which should be formed from the individual variables, is specified in bold type.
References
- IPCC. Global Warming of 1.5 C: An IPCC Special Report on the Impacts of Global Warming of 1.5 C above Pre-Industrial Levels and Related Global Greenhouse Gas. Emission Pathways, in the Context of Strengthening the Global Response to the Threat of Climate Change, Sustainable Development, and efforts to Eradicate Poverty; IPCC: Geneva, Switzerland, 2018; Available online: https://www.ipcc.ch/sr15/ (accessed on 21 September 2021).
- IPCC. Climate Change and Land: An IPCC Special Report on Climate Change, Desertification, Land Degradation, Sustainable Land Management, Food Security, and Greenhouse Gas Fluxes in Terrestrial Ecosystems; IPCC: Geneva, Switzerland, 2019; Available online: https://www.ipcc.ch/site/assets/uploads/sites/4/2021/07/210714-IPCCJ7230-SRCCL-Complete-BOOK-HRES.pdf (accessed on 21 September 2021).
- FAO. Natural Capital Impacts in Agriculture: Supporting Better Business Decision-Making; FAO: Rome, Italy, 2015; Available online: http://www.fao.org/nr/sustainability/natural-capital (accessed on 21 September 2021).
- Alexander, P.; Rabin, S.; Anthoni, P.; Henry, R.; Pugh, T.A.M.; Rounsevell, M.D.A.; Arneth, A. Adaptation of global land use and management intensity to changes in climate and atmospheric carbon dioxide. Glob. Chang. Biol. 2018, 24, 2791–2809. [Google Scholar] [CrossRef] [PubMed] [Green Version]
- Illichmann, R.; Abdulai, A. Analysis of consumer preferences and willingness to pay for organic foodproducts in germany. In Wie viel Markt und wie viel Regulierung braucht eine nachhaltige Agrarentwicklung? Proceedings of the 53. GEWISOLA Annual Conference, Berlin, Germany, 25–27 September 2013; Kirschke, D., Abdulai, A., Eds.; Landwirtschaftsverlag: Münster, Germany, 2014; pp. 199–207. ISBN 9783784353494. [Google Scholar]
- Profeta, A.; Hamm, U. Consumers’ expectations and willingness-to-pay for local animal products produced with local feed. Int. J. Food Sci. Technol. 2019, 54, 651–659. [Google Scholar] [CrossRef]
- Su, J.Y.; Canavari, M. Delphi study on country-of-origin labelling for processed foods. Agric. Econ. 2018, 6, 1–20. [Google Scholar] [CrossRef]
- TransFair. TransFair in Bewegung: Jahres- und Wirkungsbericht 2018; TransFair: Bern, Switzerland, 2019; Available online: https://www.fairtrade-deutschland.de/fileadmin/DE/mediathek/pdf/fairtrade_transfair_jahresbericht_2018.pdf (accessed on 2 November 2019).
- European Commission. Proposal for a Regulation of the European Parliament and of the Council Establishing Rules on Support for Strategic Plans to Draw up by Member States Under the Common Agricultural Policy (CAP Strategic Plans): EC. 2018/0216 (COD)), Brussels. 2018. Available online: https://eur-lex.europa.eu/resource.html?uri=cellar:aa85fa9a-65a0-11e8-ab9c-01aa75ed71a1.0003.02/DOC_1&format=PDF (accessed on 21 September 2021).
- Muller, A.; Schader, C.; El-Hage Scialabba, N.; Brüggemann, J.; Isensee, A.; Erb, K.-H.; Smith, P.; Klocke, P.; Leiber, F.; Stolze, M.; et al. Strategies for feeding the world more sustainably with organic agriculture. Nat. Commun. 2017, 8, 1–13. [Google Scholar] [CrossRef] [PubMed] [Green Version]
- German Federal Ministry of Food and Agriculture. Organic Farming in Germany. Available online: https://www.bmel.de/SharedDocs/Downloads/EN/Publications/Organic-Farming-in-Germany.pdf (accessed on 20 September 2021).
- European Commission. List of Potential Agricultural Practices that Eco-Schemes Could Support; European Commission: Brussels, Belgium, 2021; Available online: https://ec.europa.eu/info/sites/default/files/food-farming-fisheries/key_policies/documents/factsheet-agri-practices-under-ecoscheme_en.pdf (accessed on 20 September 2021).
- Zimmermann, A.; Britz, W. European farms’ participation in agri-environmental measures. Land Use Policy 2016, 50, 214–228. [Google Scholar] [CrossRef] [Green Version]
- Walter, A.; Finger, R.; Huber, R.; Buchmann, N. Smart farming is key to developing sustainable agriculture. Proc. Natl. Acad. Sci. USA 2017, 114, 6148–6150. [Google Scholar] [CrossRef] [PubMed] [Green Version]
- Balafoutis, A.; Beck, B.; Fountas, S.; Vangeyte, J.; Wal, T.; Soto, I.; Gómez-Barbero, M.; Barnes, A.; Eory, V. Precision Agriculture Technologies Positively Contributing to GHG Emissions Mitigation, Farm Productivity and Economics. Sustainability 2017, 9, 1339. [Google Scholar] [CrossRef] [Green Version]
- Basso, B.; Antle, J. Digital agriculture to design sustainable agricultural systems. Nat. Sustain. 2020, 3, 254–256. [Google Scholar] [CrossRef]
- Northrup, D.L.; Basso, B.; Wang, M.Q.; Morgan, C.L.S.; Benfey, P.N. Novel technologies for emission reduction complement conservation agriculture to achieve negative emissions from row-crop production. Proc. Natl. Acad. Sci. USA 2021, 118. [Google Scholar] [CrossRef]
- Fountas, S.; Carli, G.; Sørensen, C.G.; Tsiropoulos, Z.; Cavalaris, C.; Vatsanidou, A.; Liakos, B.; Canavari, M.; Wiebensohn, J.; Tisserye, B. Farm management information systems: Current situation and future perspectives. Comput. Electron. Agric. 2015, 115, 40–50. [Google Scholar] [CrossRef] [Green Version]
- Munz, J.; Gindele, N.; Doluschitz, R. Exploring the characteristics and utilisation of Farm Management Information Systems (FMIS) in Germany. Comput. Electron. Agric. 2020, 170, 105246. [Google Scholar] [CrossRef]
- Rose, D.C.; Sutherland, W.J.; Barnes, A.P.; Borthwick, F.; Ffoulkes, C.; Hall, C.; Moorby, J.M.; Nicholas-Davies, P.; Twining, S.; Dicks, L.V. Integrated farm management for sustainable agriculture: Lessons for knowledge exchange and policy. Land Use Policy 2019, 81, 834–842. [Google Scholar] [CrossRef]
- Coteur, I.; Wustenberghs, H.; Debruyne, L.; Lauwers, L.; Marchand, F. How do current sustainability assessment tools support farmers’ strategic decision making? Ecol. Indic. 2020, 114, 106298. [Google Scholar] [CrossRef]
- Pacchini, M.L.; Bulgheroni, C.; Borreani, G.; Tabacco, E.; Banterle, A.; Bertoni, D.; Rossi, G.; Parolo, G.; Origgi, R.; de Paola, C. A diagnostic system to assess sustainability at a farm level: The SOSTARE model. Agric. Syst. 2015, 133, 35–53. [Google Scholar] [CrossRef]
- WTO. The WTO Agreements Series: Technical Barriers to Trade; WTO: Geneva, Switzerland, 2014; Available online: https://www.wto.org/english/res_e/publications_e/tbttotrade_e.pdf (accessed on 13 August 2019).
- Läpple, D.; Renwick, A.; Thorne, F. Measuring and understanding the drivers of agricultural innovation: Evidence from Ireland. Food Policy 2015, 51, 1–8. [Google Scholar] [CrossRef]
- Dessart, F.J.; Barreiro-Hurlé, J.; van Bavel, R. Behavioural factors affecting the adoption of sustainable farming practices: A policy-oriented review. Eur. Rev. Agric. Econ. 2019, 46, 417–471. [Google Scholar] [CrossRef] [Green Version]
- Hunecke, C.; Engler, A.; Jara-Rojas, R.; Poortvliet, P.M. Understanding the role of social capital in adoption decisions: An application to irrigation technology. Agric. Syst. 2017, 153, 221–231. [Google Scholar] [CrossRef]
- Howley, P. The Happy Farmer: The Effect of Nonpecuniary Benefits on Behavior. Am. J. Agric. Econ. 2015, 97, 1072–1086. [Google Scholar] [CrossRef]
- Läpple, D.; Kelley, H. Understanding the uptake of organic farming: Accounting for heterogeneities among Irish farmers. Ecol. Econ. 2013, 88, 11–19. [Google Scholar] [CrossRef]
- Rezaei, R.; Safa, L.; Ganjkhanloo, M.M. Understanding farmers’ ecological conservation behavior regarding the use of integrated pest management- an application of the technology acceptance model. Glob. Ecol. Conserv. 2020, 22, e00941. [Google Scholar] [CrossRef]
- Schaak, H.; Mußhoff, O. Understanding the adoption of grazing practices in German dairy farming. Agric. Syst. 2018, 165, 230–239. [Google Scholar] [CrossRef]
- Caffaro, F.; Micheletti Cremasco, M.; Roccato, M.; Cavallo, E. Drivers of farmers’ intention to adopt technological innovations in Italy: The role of information sources, perceived usefulness, and perceived ease of use. J. Rural Stud. 2020, 76, 264–271. [Google Scholar] [CrossRef]
- Kreft, C.; Huber, R.; Wuepper, D.; Finger, R. The role of non-cognitive skills in farmers’ adoption of climate change mitigation measures. Ecol. Econ. 2021, 189, 107169. [Google Scholar] [CrossRef]
- Mohan, S. Risk aversion and certification: Evidence from the Nepali tea fields. World Dev. 2020, 129, 104903. [Google Scholar] [CrossRef]
- Hannus, V. Data on farmers’ perception and acceptance of sustainability standards. Data Brief. 2020, 32, 106250. [Google Scholar] [CrossRef]
- Hannus, V.; Venus, T.J.; Sauer, J. Acceptance of sustainability standards by farmers—Empirical evidence from Germany. J. Environ. Manag. 2020, 267, 110617. [Google Scholar] [CrossRef]
- Allen, P.; van Dusen, D.; Lundy, J.; Gliessman, S. Expanding the Definition of Sustainable Agriculture. Sustainability in the Balance: Issues in Sustainable Agriculture; University of California: Santa Cruz, CA, USA, 1991. [Google Scholar]
- Bockstaller, C.; Guichard, L.; Keichinger, O.; Girardin, P.; Galan, M.-B.; Gaillard, G. Comparison of methods to assess the sustainability of agricultural systems. A review. Agron. Sustain. Dev. 2009, 29, 223–235. [Google Scholar] [CrossRef] [Green Version]
- Lebacq, T.; Baret, P.V.; Stilmant, D. Sustainability indicators for livestock farming. A review. Agron. Sustain. Dev. 2013, 33, 311–327. [Google Scholar] [CrossRef]
- Thiollet-Scholtus, M.; Bockstaller, C. Using indicators to assess the environmental impacts of wine growing activity: The INDIGO® method. Eur. J. Agron. 2015, 62, 13–25. [Google Scholar] [CrossRef]
- Louwagie, G.; Northey, G.; Finn, J.A.; Purvis, G. Development of indicators for assessment of the environmental impact of livestock farming in Ireland using the Agri-environmental Footprint Index. Ecol. Indic. 2012, 18, 149–162. [Google Scholar] [CrossRef]
- Schader, C.; Meier, M.S.; Grenz, J.; Stolze, M. The trade-off between scope and precision in sustainability assessments of food systems. In Symposiumpapers, Proceedings of the 10th European IFSA Symposium, Aarhus, Denmark, 1–4 July 2012; International Farming Systems Association (IFSA): Vienna, Austria, 2012; Available online: https://orgprints.org/id/eprint/21181/1/Schader-etal-2012-ifsa-trade-off-final.pdf (accessed on 27 September 2021).
- Sustainable Food Systems GmbH. Sustainability Monitoring and Assessment Routing (SMART). Available online: https://www.sustainable-food-systems.com/en/smart/ (accessed on 11 July 2020).
- Schader, C.; Curran, M.; Heidenreich, A.; Landert, J.; Blockeel, J.; Baumgart, L.; Ssebunya, B.; Moakes, S.; Marton, S.; Lazzarini, G.; et al. Accounting for uncertainty in multi-criteria sustainability assessments at the farm level: Improving the robustness of the SMART-Farm Tool. Ecol. Indic. 2019, 106, 105503. [Google Scholar] [CrossRef]
- Davis, F.D. A Technology Acceptance Model. for Empirically Testing New End-User Information Systems: Theory and Results. Ph.D. Thesis, Massachusetts Institute of Technology, Cambridge, MA, USA, 1985. [Google Scholar]
- Davis, F.D. Perceived Usefulness, Perceived Ease of Use, and User Acceptance of Information Technology. MIS Q. 1989, 13, 319–340. [Google Scholar] [CrossRef] [Green Version]
- Marangunić, N.; Granić, A. Technology acceptance model: A literature review from 1986 to 2013. Univ. Access Inf. Soc. 2015, 14, 81–95. [Google Scholar] [CrossRef]
- Fishbein, M.; Ajzen, I. Belief, Attitude, Intention, and Behavior: An. Introduction to Theory and Research; Addison-Wesley: Reading, MA, USA, 1975. [Google Scholar]
- Ajzen, I. The Theory of Planned Behavior. Organ. Behav. Hum. Decis. Process. 1991, 50, 179–211. [Google Scholar] [CrossRef]
- Gocsik, È.; Saatkamp, H.W.; de Lauwere, C.C.; Oude Lansink, A.G.J.M. A Conceptual Approach for a Quantitative Economic Analysis of Farmers’ Decision-Making Regarding Animal Welfare. J. Agric. Environ. Ethics 2014, 27, 287–308. [Google Scholar] [CrossRef]
- Garforth, C. Motivating Farmers: Insights from Social Psychology. In Proceedings of the 2010 NMC Annual Meeting, Albuquerque, NM, USA, 31 January–3 February 2010. [Google Scholar]
- Sutherland, L.-A. Environmental grants and regulations in strategic farm business decision-making: A case study of attitudinal behaviour in Scotland. Land Use Policy 2010, 27, 415–423. [Google Scholar] [CrossRef]
- Davis, F.D.; Bagozzi, R.P.; Warshaw, P.R. User acceptance of computer technology: A comparison of two theoretical models. Manag. Sci. 1989, 35, 982–1003. [Google Scholar] [CrossRef] [Green Version]
- Venkatesh, V.; Davis, F.D. A Theoretical Extension of the Technology Acceptance Model: Four Longitudinal Field Studies. Manag. Sci. 2000, 46, 186–204. [Google Scholar] [CrossRef] [Green Version]
- Venkatesh, V.; Bala, H. Technology Acceptance Model 3 and a Research Agenda on Interventions. Decis. Sci. 2008, 39, 273–315. [Google Scholar] [CrossRef] [Green Version]
- Schulze, H.; Jahn, G.; Spiller, A. Institutional Change and Acceptance of Quality Assurance: The Case of Organic Farming in Germany; International European Forum on Innovation and System Dynamics in Food Networks: Igls, Austria, 2007. [Google Scholar]
- Jahn, G.; Spiller, A. Acceptance of a processor-driven quality management system by dairy farmers: A structural equation model. In Proceedings of the 92nd EAAE Seminar on Quality Management and Quality Assurance in Food Chains, Göttingen, Germany, 2–4 March 2005. [Google Scholar]
- Luhmann, H.; Schaper, C.; Theuvsen, L. Future-Oriented Dairy Farmers’ Willingness to Participate in a Sustainability Standard: Evidence from an Empirical Study in Germany. Int. J. Food Syst. Dyn. 2016, 7, 243–257. [Google Scholar] [CrossRef]
- Naspetti, S.; Mandolesi, S.; Buysse, J.; Latvala, T.; Nicholas, P.; Padel, S.; van Loo, E.; Zanoli, R. Determinants of the Acceptance of Sustainable Production Strategies among Dairy Farmers: Development and Testing of a Modified Technology Acceptance Model. Sustainability 2017, 9, 1805. [Google Scholar] [CrossRef] [Green Version]
- Aubert, B.A.; Schroeder, A.; Grimaudo, J. IT as enabler of sustainable farming: An empirical analysis of farmers’ adoption decision of precision agriculture technology. Decis. Support. Syst. 2012, 54, 510–520. [Google Scholar] [CrossRef] [Green Version]
- Bagheri, A.; Bondori, A.; Allahyari, M.S.; Surujlal, J. Use of biologic inputs among cereal farmers: Application of technology acceptance model. Environ. Dev. Sustain. 2021, 23, 5165–5181. [Google Scholar] [CrossRef]
- Borges, J.A.R.; Oude Lansink, A.G.J.M.; Emvalomatis Grigorios. Adoption of Innovation in agriculture: A critical review of economic and psychological models. Int. J. Innov. Sustain. Dev. 2019, 13, 36–56. [Google Scholar] [CrossRef]
- Piñeiro, V.; Arias, J.; Dürr, J.; Elverdin, P.; Ibáñez, A.M.; Kinengyere, A.; Opazo, C.M.; Owoo, N.; Page, J.R.; Prager, S.D.; et al. A scoping review on incentives for adoption of sustainable agricultural practices and their outcomes. Nat. Sustain. 2020, 3, 809–820. [Google Scholar] [CrossRef]
- Trujillo-Barrera, A.; Pennings, J.M.E.; Hofenk, D. Understanding producers’ motives for adopting sustainable practices: The role of expected rewards, risk perception and risk tolerance. Eur. Rev. Agric. Econ. 2016, 43, 359–382. [Google Scholar] [CrossRef] [Green Version]
- Hannus, V.; Sauer, J. It is not only about money—German farmers’ preferences regarding voluntary standards for farm sustainability management. Land Use Policy 2021, 108, 105582. [Google Scholar] [CrossRef]
- de Olde, E.M.; Bokkers, E.A.; de Boer, I.J. The Choice of the Sustainability Assessment Tool Matters: Differences in Thematic Scope and Assessment Results. Ecol. Econ. 2017, 136, 77–85. [Google Scholar] [CrossRef]
- Canavari, M.; Medici, M.; Wongprawmas, R.; Xhakollari, V.; Russo, S. A Path Model of the Intention to Adopt Variable Rate Irrigation in Northeast Italy. Sustainability 2021, 13, 1879. [Google Scholar] [CrossRef]
- Karipidis, P.; Karypidou, S. Factors that Impact Farmers’ Organic Conversion Decisions. Sustainability 2021, 13, 4715. [Google Scholar] [CrossRef]
- Rota, C.; Nasuelli, P.A.; Spadoni, C.; Valmori, I.; Zanasi, C. Factors Affecting the Sustainable Use of ICTs for Agriculture at the Farm: The Case of Image Line Network Community. Sustainable Agriculture through ICT Innovation. In Proceedings of the EFITA-WCCA-CIGR Conference 2013, Turin, Italy, 24–27 June 2013. [Google Scholar]
- Kline, R.B. (Ed.) Principles and Practice of Structural Equation Modeling, 4th ed.; The Guilford Press: New York, NY, USA; London, UK, 2016; ISBN 978-1-4625-2334-4. [Google Scholar]
- MacKenzie, S.B.; Podsakoff, P.M.; Podsakoff, N.P. Construct measurement and validation procedures in MIS and behavioral research: Integrating new and existing techniques. MIS Q. 2011, 35, 293–334. [Google Scholar] [CrossRef]
- Bollen, K.A. Structural Equations with Latent Variables; Wiley: New York, NY, USA, 1989; ISBN 9780471011712. [Google Scholar]
- Tomarken, A.J.; Waller, N.G. Structural equation modeling: Strengths, limitations, and misconceptions. Annu. Rev. Clin. Psychol. 2005, 1, 31–65. [Google Scholar] [CrossRef] [PubMed] [Green Version]
- Hair, J.F. A primer on Partial Least Squares Structural Equation Modeling (PLS-SEM); Sage Publications, Inc.: Los Angeles, CA, USA, 2014; ISBN 978-1-4522-1744-4. [Google Scholar]
- Gummer, T.; Roßmann, J.; Silber, H. Using Instructed Response Items as Attention Checks in Web Surveys: Properties and Implementation. Sociol. Methods Res. 2021, 50, 238–264. [Google Scholar] [CrossRef]
- Weijters, B.; Baumgartner, H. Misresponse to Reversed and Negated Items in Surveys: A Review. J. Mark. Res. 2012, 49, 737–747. [Google Scholar] [CrossRef] [Green Version]
- Destatis. Agrarstrukturerhebung 2016—Betriebswirtschaftliche Ausrichtung und Standardoutput: Fachserie 3 Reihe 2.1.4; Destatis: Wiesbaden, Germany, 2016. Available online: https://www.destatis.de/DE/Themen/Branchen-Unternehmen/Landwirtschaft-Forstwirtschaft-Fischerei/Landwirtschaftliche-Betriebe/Publikationen/Downloads-Landwirtschaftliche-Betriebe/betriebswirtschaftliche-ausrichtung-standardoutput-2030214169005.xlsx?__blob=publicationFile (accessed on 8 November 2016).
- Destatis. Agrarstrukturerhebung 2016—Arbeitskräfte und Berufsausbildung der Betriebsleiter/Geschäftsführer: Fachserie 3 Reihe 2.1.8; Destatis: Wiesbaden, Germany, 2016. Available online: https://www.destatis.de/DE/Themen/Branchen-Unternehmen/Landwirtschaft-Forstwirtschaft-Fischerei/Landwirtschaftliche-Betriebe/Publikationen/Downloads-Landwirtschaftliche-Betriebe/arbeitskraefte-2030218169005.xlsx?__blob=publicationFile (accessed on 8 November 2016).
- Destatis. Bodennutzung der Betriebe (Landwirtschaftlich genutzte Flächen): Fachserie 3 Reihe 3.1.2; Destatis: Wiesbaden, Germany, 2019. Available online: https://www.destatis.de/DE/Themen/Branchen-Unternehmen/Landwirtschaft-Forstwirtschaft-Fischerei/Publikationen/Bodennutzung/landwirtschaftliche-nutzflaeche-2030312197004.pdf (accessed on 13 July 2020).
- Bagozzi, R.P.; Yi, Y. On the evaluation of structural equation models. J. Acad. Mark. Sci. 1988, 16, 74–94. [Google Scholar] [CrossRef]
- Marsh, H.W.; Morin, A.J.S.; Parker, P.D.; Kaur, G. Exploratory structural equation modeling: An integration of the best features of exploratory and confirmatory factor analysis. Annu. Rev. Clin. Psychol. 2014, 10, 85–110. [Google Scholar] [CrossRef] [Green Version]
- Bagozzi, R.P.; Yi, Y. Specification, evaluation, and interpretation of structural equation models. J. Acad. Mark. Sci. 2012, 40, 8–34. [Google Scholar] [CrossRef]
- StataCorp LP. STATA Structural Equation Modeling: Reference Manual; Release 17; StataCorp LP: College Station, TX, USA, 2021; Available online: https://www.stata.com/manuals/sem.pdf (accessed on 2 March 2017).
- Hu, L.; Bentler, P.M. Cutoff criteria for fit indexes in covariance structure analysis: Conventional criteria versus new alternatives. Struct. Equ. Model. 1999, 6, 1–55. [Google Scholar] [CrossRef]
- Bagozzi, R.P. Structural Equation Models in Experimental Research. J. Acad. Mark. Sci. 1977, 14, 209–226. [Google Scholar]
- Satorra, A.; Bentler, P.M. Corrections to test statistics and standard errors in covariance structure analysis. In Latent Variables Analysis: Applications for Developmental Research; Eye von, A., Clogg, C.C., Eds.; Sage Publications, Inc.: Los Angeles, CA, USA, 1994; pp. 399–419. [Google Scholar]
- Bollen, K.A. Evaluating Effect, Composite, and Causal Indicators in Structural Equation Models. MIS Q. 2011, 35, 359–372. [Google Scholar] [CrossRef]
- Hannus, V. Optimal Design of Agricultural Sustainability Standards: Insights from a Delphi Study in Germany. In Proceedings of the 161st EAAE Seminar on System Dynamics and Innovation in Food Networks, 11th International European Forum (Igls-Forum), Igls, Austria, 13–17 February 2017. [Google Scholar] [CrossRef]
- Bagozzi, R.P. The legacy of the technology acceptance model and a proposal for a paradigm shift. J. Assoc. Inf. Syst. 2007, 8, 244–254. [Google Scholar] [CrossRef]
- Xia, Y.; Yang, Y. RMSEA, CFI, and TLI in structural equation modeling with ordered categorical data: The story they tell depends on the estimation methods. Behav. Res. Methods 2019, 51, 409–428. [Google Scholar] [CrossRef] [PubMed]
Publisher’s Note: MDPI stays neutral with regard to jurisdictional claims in published maps and institutional affiliations. |
© 2021 by the authors. Licensee MDPI, Basel, Switzerland. This article is an open access article distributed under the terms and conditions of the Creative Commons Attribution (CC BY) license (https://creativecommons.org/licenses/by/4.0/).