1. Introduction
Modern enterprises have continually searched for solutions aimed at increasing their efficiency in each area of their economic activities, especially in the field of production. However, a holistic and systemic approach in running a business, “broadening” the manufacturer’s responsibility for both the quality of processes and resulting products has started to become obvious. Enterprises have become obliged to assume responsibility for their product throughout its life cycle (from the concept stage to the utilization stage), for the environment and for society. They also need to follow the rules of sustainable development [
1].
Modern organizations are departing from the traditional management model and heading towards the idea of sustainable development. Sustainable development was defined as “development that meets the needs of the present without compromising the ability of future generations to meet their own needs” [
2].
Increased awareness of the destructive effects of human economic activity on the environment led to the emergence of another important idea: corporate social responsibility (CSR). Corporate social responsibility is defined as the organization’s responsibility for the impacts of its decisions and activities on society and the environment. The ISO 26,000 [
3] standard divides the thematic scope of CSR into 7 main areas. The most important of them, in the context of the proposed method, are work practices related to employees’ safety and comfort in the workplace and the area of the environment, synonymous with the protection of the natural environment, prevention and mitigation of the effects of damage by initiating and engaging in pro-environmental activities.
The essence of both strategies lies in the belief that the chances of a specific economic entity for survival and development will be possible when its goals are harmonized with the requirements of its stakeholders, the natural environment and the surrounding community.
It should be emphasized that the corporate social responsibility strategy is completely voluntary, as opposed to the concept of sustainable development, which is enshrined in the fundamental rights of most countries in the world.
The concept of sustainable development is subject to gradation. It may be of a global, regional (e.g., European Union), national, local (municipal), ormicro-scale (single organization) scope.
Organizations can meet legally required sustainable development goals in various ways. Nowadays, it is popular to use actions that have been tried and tested by other entities; the so-called good practices.
Dictionary definitions describe practice as action performed by someone regularly and consciously, bringing added value in the form of experience. On the other hand, good practices are seen as actions constituting an example of behaviour in a specific field, inspiration for other entities to implement similar solutions and adapted to a given area of application or simply as the best way to do something. Due to their diversity, they are the subject of the classification presented [
4]. Searched-for and analyzed good practices are “benchmarks”, i.e., a norm or a reference point for improvement activities implemented by a given organization.
When discussing the topic of sustainable development, corporate social responsibility and the application of good practices, one should consider the concept of enterprise management, which combines all these elements. Enterprises have long been striving for excellence in their operations, or at least for a continuous growth of their efficiency and effectiveness. The current rapidly changing and highly competitive market exerts considerable pressure on companies to adopt sustainable practices to balance economic, environmental and social performance [
5].
The Lean Green management concept, widely used in business practice, combines standard methodologies of eliminating waste (economic aspect) and unconventional “green” practices (environmental aspect), providing services and products expected by customers and produced in an environmentally friendly manner [
6].
Sustainable development and corporate social responsibility strategies “additionally” need to satisfy social and employment issues, including human rights, employment rights, anti-corruption measures, and the area of practices related to work and the environment. As already mentioned, the area of practices related to work concerns employees’ safety and comfort in the workplace. The area of the environment, in turn, is synonymous with the protection of the natural environment, prevention and mitigation of the effects of damage by initiating and engaging in pro-environmental activities.
An approach in enterprise management which is the quintessence of the organization’s aspiration to operate in the spirit of sustainable development and CSR is Human Lean Green (HLG). HLG is a modified version of the Lean Green concept, proposed and extended by the authors to include social and work-related issues [
7,
8]. The term HLG, although relatively new, is a development of the Lean Green approach used at the beginning of the 21st century.
While conducting any activities in the company, one should measure their efficiency. When introducing good practices in the organization in the area of Lean, Green and the third highlighted area—hereafter referred to as Human—one needs to determine the relevant key performance indicators (KPIs), the measurements of which will indicate whether a given action has the desired impact on the area in which it was applied. They should reflect the company’s strategy and goals, as well as identify and meet stakeholders’ needs.
In line with the HLG approach, the enterprise aims to improve efficiency in three areas: manufacturing (services) through elimination of waste in processes (Lean), impact on the natural environment (Green) and quality of the workplace (Human).
The review of the existing solutions in the Lean Green area (cf. chapter Literature Review) shows a lack of methods in the scope, allowing us to identify the state of the organization in a comprehensive approach, covering three main areas of the organization’s sustainable development (cost-effectiveness, greenness, humanization of work). Therefore, there is a need to develop a method and prepare tool that will allow on the one hand to analyze the organization in each of the previously indicated areas, and on the other hand, will give an opportunity to develop a plan for the implementation of the necessary solutions and directions of the organization’s development.
Therefore, the question arises as to how to assess the enterprise which declares itself to implement the HLG strategy in terms of its preparation and progress made. The use of some form of audit arises here as something natural.
In order for an audit to give the enterprise added value, it must be carried out according to a programme that is consistent with the enterprise’s goals and strategic plans. The audit plan should contain questions linking the audited area’s issues with the company’s strategic goals.
The singling-out of the Human Lean Green approach became the basis for developing a programme for auditing enterprises’ activities in three distinguished areas. The programme supports data collection and allows us to assess the organization’s condition in a comprehensive perspective, covering all three areas of sustainable development.
The concept of an audit proposed in this paper, i.e., the identification of three areas of the company’s activity in one study, is relatively new and described in detail in [
7,
9]. The authors revealed a gap consisting in the possibility of reducing operating costs by limiting the negative impact on the environment and limiting the consumption of resources by increasing the efficiency of processes (elimination of waste) and improving the working environment (correct organization of work in terms of ergonomics and OHS).
The assessment of the company’s sustainable development is carried out by measuring indicators obtained from the analysis of answers to questions concerning the use of good practices in the controlled organization [
7]. In this way, answers related to the application of good practices obtained during the survey became the basis for a qualitative method of assessing enterprises’ sustainable development (manufacturing and service), implemented in the form of an audit. The set of audit questions is a reference to best practices in the areas of Human, Lean and Green. Thus, the Human Lean Green method mentioned in the title constitutes an operationalized concept of sustainable development and assumes the simultaneous implementation of all well-balanced corporate economic, environmental and social goals.
The audit itself consists of several stages spread over a long period: data collection, inaugural meeting with employees and management of the audited company, auditor’s visits, meetings with decision makers and process owners to agree on answers to questions contained in the tool. Such an approach allows to perform a reliable review of the current situation of the organization in three specified perspectives. In addition, it allows us to review awareness, acquired competences, knowledge and motivation, determination and readiness to undertake improvement activities in the organization. The results of the audit are the basis for identifying, together with the client, key areas of development—priority actions with the recommendation to implement tools, workshops, solutions aimed at achieving the organization’s goals, together with assigning responsibilities and deadlines.
The development of the method was preceded by a review and analysis of the literature in the scope of methods of assessing the sustainable development of enterprises managed according to the Lean-Green concept.
2. Literature Review
The emergence of hybrid management concepts, an example of which is Lean Green, is a result of the emphasis placed on the need to implement the company’s various goals and related measures, and tools and practices in parallel. The main goal so far, which has been to achieve “leanness” in the form of effective processes in the organization, is not enough. Globally, an increased emphasis is being placed on corporate social responsibility, the integral elements of which are the natural environment and the human work environment (e.g., human-work, human-machine, human-software interfaces) [
10]. The literature provides evidence of the synergistic interaction of the combined practices of different management concepts to improve enterprise performance. Based on a case study, Galeazzo et al. [
11] demonstrated how Lean and Green practice sets work together and provide synergies in improving operational and environmental performance. Dües et al. [
6] argue that Lean is a catalyst for the implementation of Green in manufacturing companies, and that Green may help in return to maintain best practices in Lean [
6,
12]. Hallam and Contreras [
13] showed that the improvement of processes according to the Lean concept also indirectly prevents the excessive exploitation of the natural environment.
Verrier et al. [
14] found that linking the organization’s performance with sustainable development is a platform for adding social (human) and environmental (green) dimensions to lean activities. The study by Azlina et al. [
15] established a framework model for Green Lean human resources management practices in the context of quality management. The main goal of the proposed system is to focus on achieving the full development of human resources oriented on their motivation and creativity to be part of a green and lean organization.
It should be emphasized that the process of combining concepts into hybrid solutions is not free from methodological and organizational difficulties. A comprehensive review of the literature on the lean and green area was conducted by Garza-Reyes [
16], where six main research streams that comprise both conceptual and empirical research on lean and green are identified. One of the directions of the conducted research is the proposal of assessment methods or indicators.
In the literature, one can find numerous examples of measuring lean and green issues together. Thanki and Thakkar [
17] propose a special kind of diagram, called a value-value load diagram, that presents lean (operational) and green (environmental) performance of the production system. They developed a set of measures indicating the overall performance of the system, with the eco-leanness index. Thanki et al. [
18] investigate the impact of selected lean and green practices on performance benefits using the AHP method in Indian SMEs. They also evaluate the influence of lean and green paradigms on the overall performance of SMEs and propose a set of lean and green practices to surmount market challenges faced by SMEs. Sagnak and Kazancoglu [
19] discuss the limitations of the lean green approach and integrate the Six Sigma approach in order to overcome these limitations. They use MSA and Gage Control to measure the variations of the process in order to reduce the negative environmental impact of companies’ products or services. Kaswan and Rathi [
20] identify and model Green Lean Six Sigma (GLS) enablers using Interpretive Structural Modelling (ISM) to identify interactions between enablers. They also use the Impact Matrix Cross-Reference Multiplication Applied to a Classification (MICMAC) analysis to classify these enablers for better understanding. Folinas et al. [
21] present using Value Stream Mapping to determine waste in terms of measuring the non-value-added time of production and logistics processes, as well as water and energy used across organizational boundaries. The identified largest sources of waste are presented on the first Value Stream Map, called Current Stream Map (CSM). Based on the systematic analysis of current state, identification of processes with main environmental, health, and safety opportunities was conducted; their results are shown on the second Value Stream Map, called Future Stream Map (FSM). This approach is illustrated by a case study of the supply chain and the production process of animal food products in Greece. Cabral et al. [
22] select key performance indicators (KPIs) and best lean and green practices together with agile and resilient in supply chain management. The selection was conducted by integrated LARG analytic network process (ANP) model to support decision-making in choosing the most appropriate practices and KPIs to be implemented by companies in the supply chain. Duarte and Cruz-Machado [
23] examine 12 business models for contribution to modelling a lean and green approach for an organization and its supply chain. They selected key criteria of the lean green assessment using the lean and green criterion score. In another paper, these authors use the balanced scorecard (BS) to evaluate lean and green performance in the supply chain [
24].
Some of the research includes human aspects to lean approach. Pakdil and Leonard [
25] developed the lean assessment tool (LAT) to assess lean implementation. The LAT measures leanness using both quantitative and qualitative values and human aspects (in context of human resources) are used either as one of the eight quantitative performance dimensions or one of the five qualitative performance dimensions. Two methods of LAT analysis are considered: fuzzy sets and radar charts. Almomani et al. [
26] propose an integrated model of lean assessment and analytical hierarchy process (AHP) for a dynamic road map of lean implementation, where human is represented as one of the seven lean perspectives. The AHP method operates on lean assessment for proposed route execution.
Some of the authors consider human as part of lean; many researchers consider lean and green together, but there is no consideration of human, lean and green. In the authors’ opinion, there is a need to consider lean and green in connection with human.
The review of the available methods indicates that there is no solution to identify simultaneously the organization’s condition covering all of the mentioned areas. To provide such a tool enabling efficiency assessment in these areas, a concept and a prototype of the Human Lean Green auditing tool have been developed. The instrument involves main indicators of the organization efficiency in the areas mentioned above: working environment, process improvement and natural environment.
3. Materials and Methods
3.1. Human Lean Green Audit
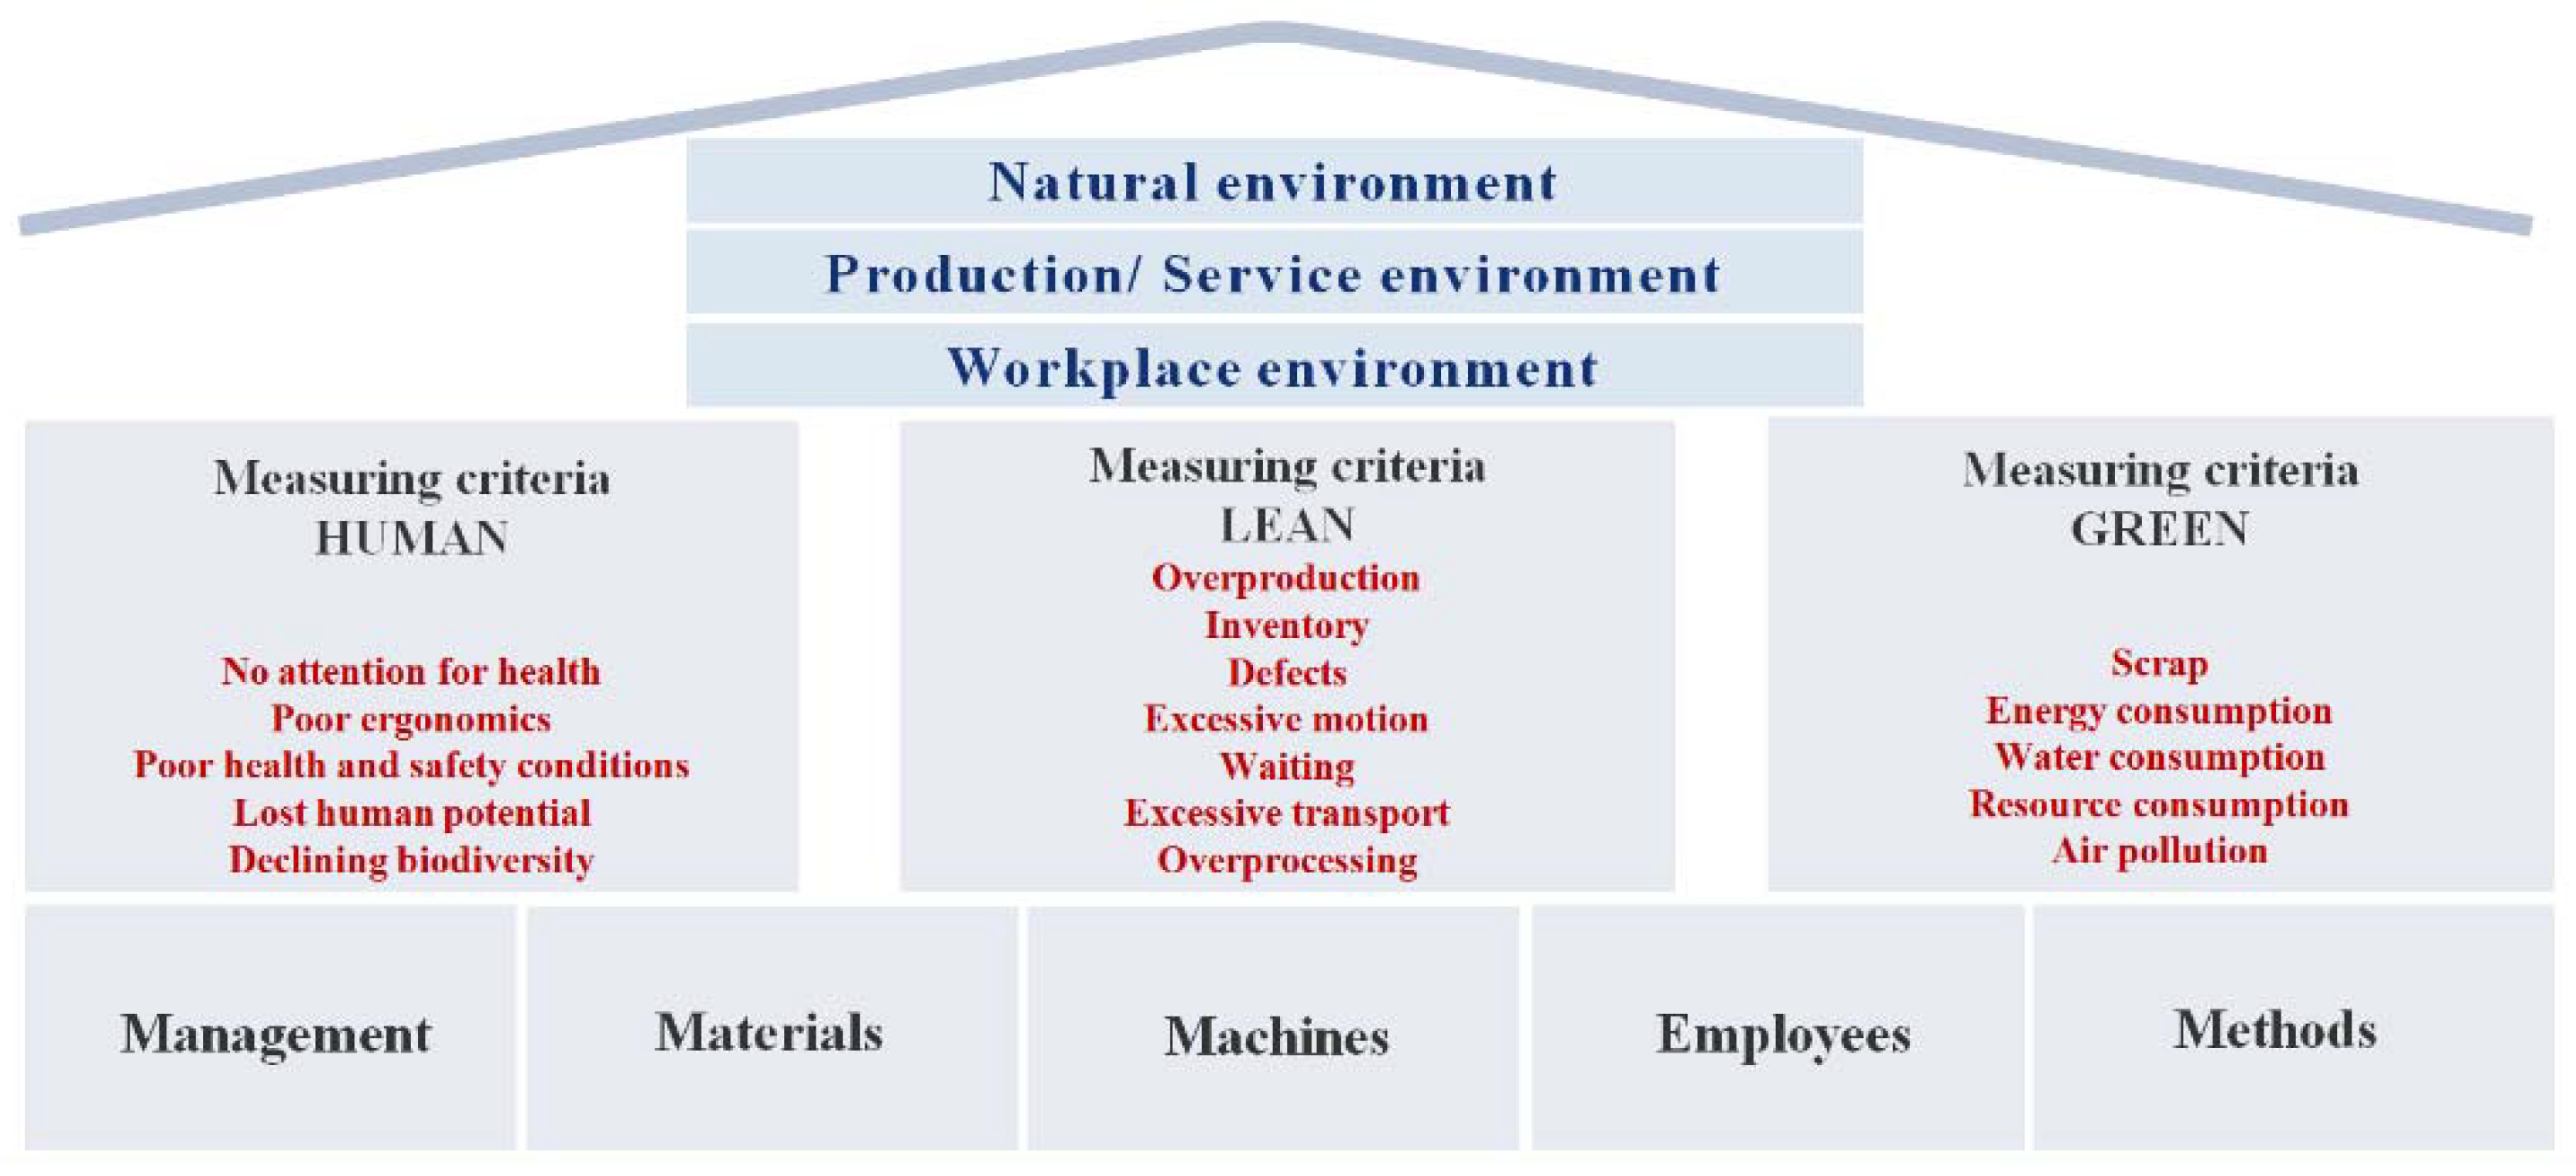
In the process of developing the preliminary model of Human Lean Green into the general HLG concept as an instrument enabling the organization’s sustainable development aimed at boosting its effectiveness, it was necessary to establish more effective measurement criteria.
Five elements were adopted as necessary for the proper functioning of the organization:
Management,
Materials,
Machines,
Employees,
Methods. The measurement criteria in process effectiveness were based on the waste classification in the production processes and service-based processes proposed by Masaaki Imai [
27]:
Overproduction,
Stock,
Waiting time,
Unnecessary transportation,
Unnecessary movement,
Deficiencies and amendments,
Losses in the process. Natural environment measurement criteria were based on the following elements:
Energy,
Materials,
Water,
Air,
Waste. Working environment measurement criteria were defined as:
Poor ergonomics,
Lack of care for health,
Bad Health & Safety,
Biodiversity,
Lost potential. On the basis of the criteria presented above, the Human Lean Green Model of the Organization’s Effectiveness was built (
Figure 1).
The audit questions in particular areas were constructed as a matrix at the point of intersection of the organization’s surrounding elements: Management, Materials, Machines, Employees, Methods, and measurement criteria from three perspectives. The questions are based on best practices employed in modern organizations and developed during the professional practice of the concept’s authors.
In order to design and implement an audit tool to measure sustainable development in manufacturing and service enterprises, a catalogue of good practices was developed by Starzyńska and Bryke [
8]. The compiled catalogue of best practices presents an operation analyzed concept of sustainable development and assumes the simultaneous implementation of all well-balanced corporate economic, environmental and social goals. The catalogue contains collections of best practices in three areas—Human, Lean and Green.
The Human Lean Green Audit consists of 85 questions, divided into three
audit areas (Human, Lean and Green) and five
perspectives (Management, Materials, Machines, Employees, Methods). That way each audit question belongs to one audit area and one perspective. In the audit, two types of companies are defined: manufacturing and service. The audit questions for the Human and Green areas are the same for both types of companies; the sets of audit questions for the Lean area are different for both types of companies. The audit questions are presented in
Table A1,
Table A2,
Table A3 and
Table A4 in
Appendix A.
The answers to the audit questions are qualitative and are chosen from a finite set of possible answers (“yes”, “partially at a significant level”, “partially at a moderate level”, “partially at an insignificant level”, “no”, “no data”). Based on the answers, indicators are calculated. In order to calculate the indicators, the answers (qualitative values) are transformed into quantitative values. The way of transforming the answers into quantitative values are presented in
Table 1.
Based on the quantitative values, the assessment indicators are calculated. There are three main assessment indicators: an averaged indicator of good practices for the HUMAN area (1), an averaged indicator of good practices for the Lean area (2) and an averaged indicator of good practices for the Green area (3).
where:
—answer for question
i in Human area (quantitative values according to
Table 1);
—answer for question
i in Lean area (quantitative values according to
Table 1);
—answer for question
i in Green area (quantitative values according to
Table 1);
—number of questions in Human area minus number of “No data” answers in Human area;
—number of audit questions in Lean area minus number of “No data” answers in Lean area;
—number of audit questions in Green area minus number of “No data” answers in Green area.
The same assessment indicators are defined within each of five perspectives in each audit area:
where:
—averaged indicator of good practices for the area and perspective, area ∈ {Human, Lean, Green}, perspective ∈ {Management, Materials, Machines, Employees, Methods};
—answer for question
i in the
area and
perspective,
area ∈ {
Human,
Lean,
Green},
perspective ∈ {
Management,
Materials,
Machines,
Employees,
Methods} (quantitative values according to
Table 1);
—number of audit questions in the area and perspective, area ∈ {Human, Lean, Green}, perspective ∈ {Management, Materials, Machines, Employees, Methods} minus number of “No data” answers in the area and perspective.
As stems from Equations (1)–(4), the questions with “No data” answers are not taken into account while calculating the assessment indicators. A number of “No data” answers are used for the audit credibility assessment. If the number of “No data” answers needed for the calculations of any of the defined indicators is greater than 20% (lack of data limit), the audit is considered to be untrustworthy. The indicators calculated with lack of data limit exceeded are indicated while presenting the audit results (marked with the label “lack of data limit exceeded”). Nevertheless, the construction of the indicators guarantees obtaining values from the range 0% to 100% even when lack of data limit is exceeded. The method also assumes the attendance of an auditor that supports the company during the audit. There is also a possibility to determine a goal for each of the indicators. The value of the goal is defined during the audit as the agreement between the company and the auditor.
The proper application of the method was preceded by validation. Two forms of validation were conducted: expert validation and statistical validation.
The expert validation was performed in the form of interviews with practitioners, which resulted in changes in the content of the questions included in the method. The validation was carried out using a questionnaire assessing individual questions included in the method. The method of assessing a given question is presented in
Table 2.
The validation was carried out with the participation of experts experienced in the field of auditing management systems. Some of the experts are connected with organizations that represent the highest standards in improving implemented management systems in industries such as: medical, automotive, aviation, military, mechanical engineering and industrial building. In order to obtain a broader view of the validated method, the interviews were also conducted among experienced researchers from a technical university who acted as auditors. The researchers possess extensive knowledge of management systems and experience in the implementation of integrated management systems and improvement in many organizations with diverse conditions and standards.
As a result of the performed validation, 46% of the questions were identified as requiring no changes in their content or requiring only editing corrections, 45% of the questions were identified as requiring moderate changes in their content, and 9% of the questions were identified as requiring profound changes in their content. A need to modify the original 4-point response scale was also indicated. Adequately to the experts’ comments, changes were introduced in the audit questions and responses along with an appropriate correction of the way of measuring indicators. The method was recognized by the experts as modern, comprehensive and applicable both in manufacturing and service enterprises. All the experts confirmed that the proposed method is valuable from the point of view of the possibility of developing and improving their organizations.
Statistical validation was conducted by checking the internal consistency of the audit tool using Cronbach’s alpha. For the cross-checking of the coherence of answers, some questions—although they are structured differently and relate to different elements of enterprise assessment (management, materials, machines, employees, methods)—concern the same issue. Therefore, answers to them should be coherent. To check the internal consistency of the audit tool, two groups of questions from the Lean area were adopted: question 7 vs. question14 (pair 1) and question 21 vs. question 28 (pair 2). Test examining the Cronbach’s alpha coefficient on a sample of 20 enterprises yielded the following results: 0.8262 for pair 1 and 0.8877 for pair 2. In both cases, the value of the Cronbach’s alpha coefficient is significantly higher than 0.6. Therefore, it can be assumed that the reliability of the scale of questions is high.
3.2. Assumptions for the Human Lean Green Audit Tool
In order to conduct the audit presented above, the dedicated software was developed, called the audit tool. The following basic assumptions were formulated for the audit tool:
while working with the tool, the client should be able to immediately observe and see the effects of work
at the end of the audit, the possibility of making an immediate diagnosis in the assumed areas and generating an initial report
the possibility of generating an action plan for the organization to indicate the areas and measures that need to be taken to achieve the goals
exclusion option—the tool offers the possibility of examining the organization depending on its specific characteristics in three areas (i.e., production processes, service processes, mixed processes); at the same time, excluding any of the processes is not visible to the client (e.g., in generated reports)
the tool interface should be simple and user-friendly, visually attractive and intuitive
modern and innovative design
predefining the database—individual data, numbers and facts will be embedded in the tool as a reference point for the results of the analysis
the tool, based on the developed algorithms, aims to compare the obtained results with a reference point and present an immediate image of points/areas with the potential for development
working with the tool should be considered as being useful for audit purposes; it is supposed to help the consultant and the organization to verify the current situation of the enterprise under the conditions of an audit.
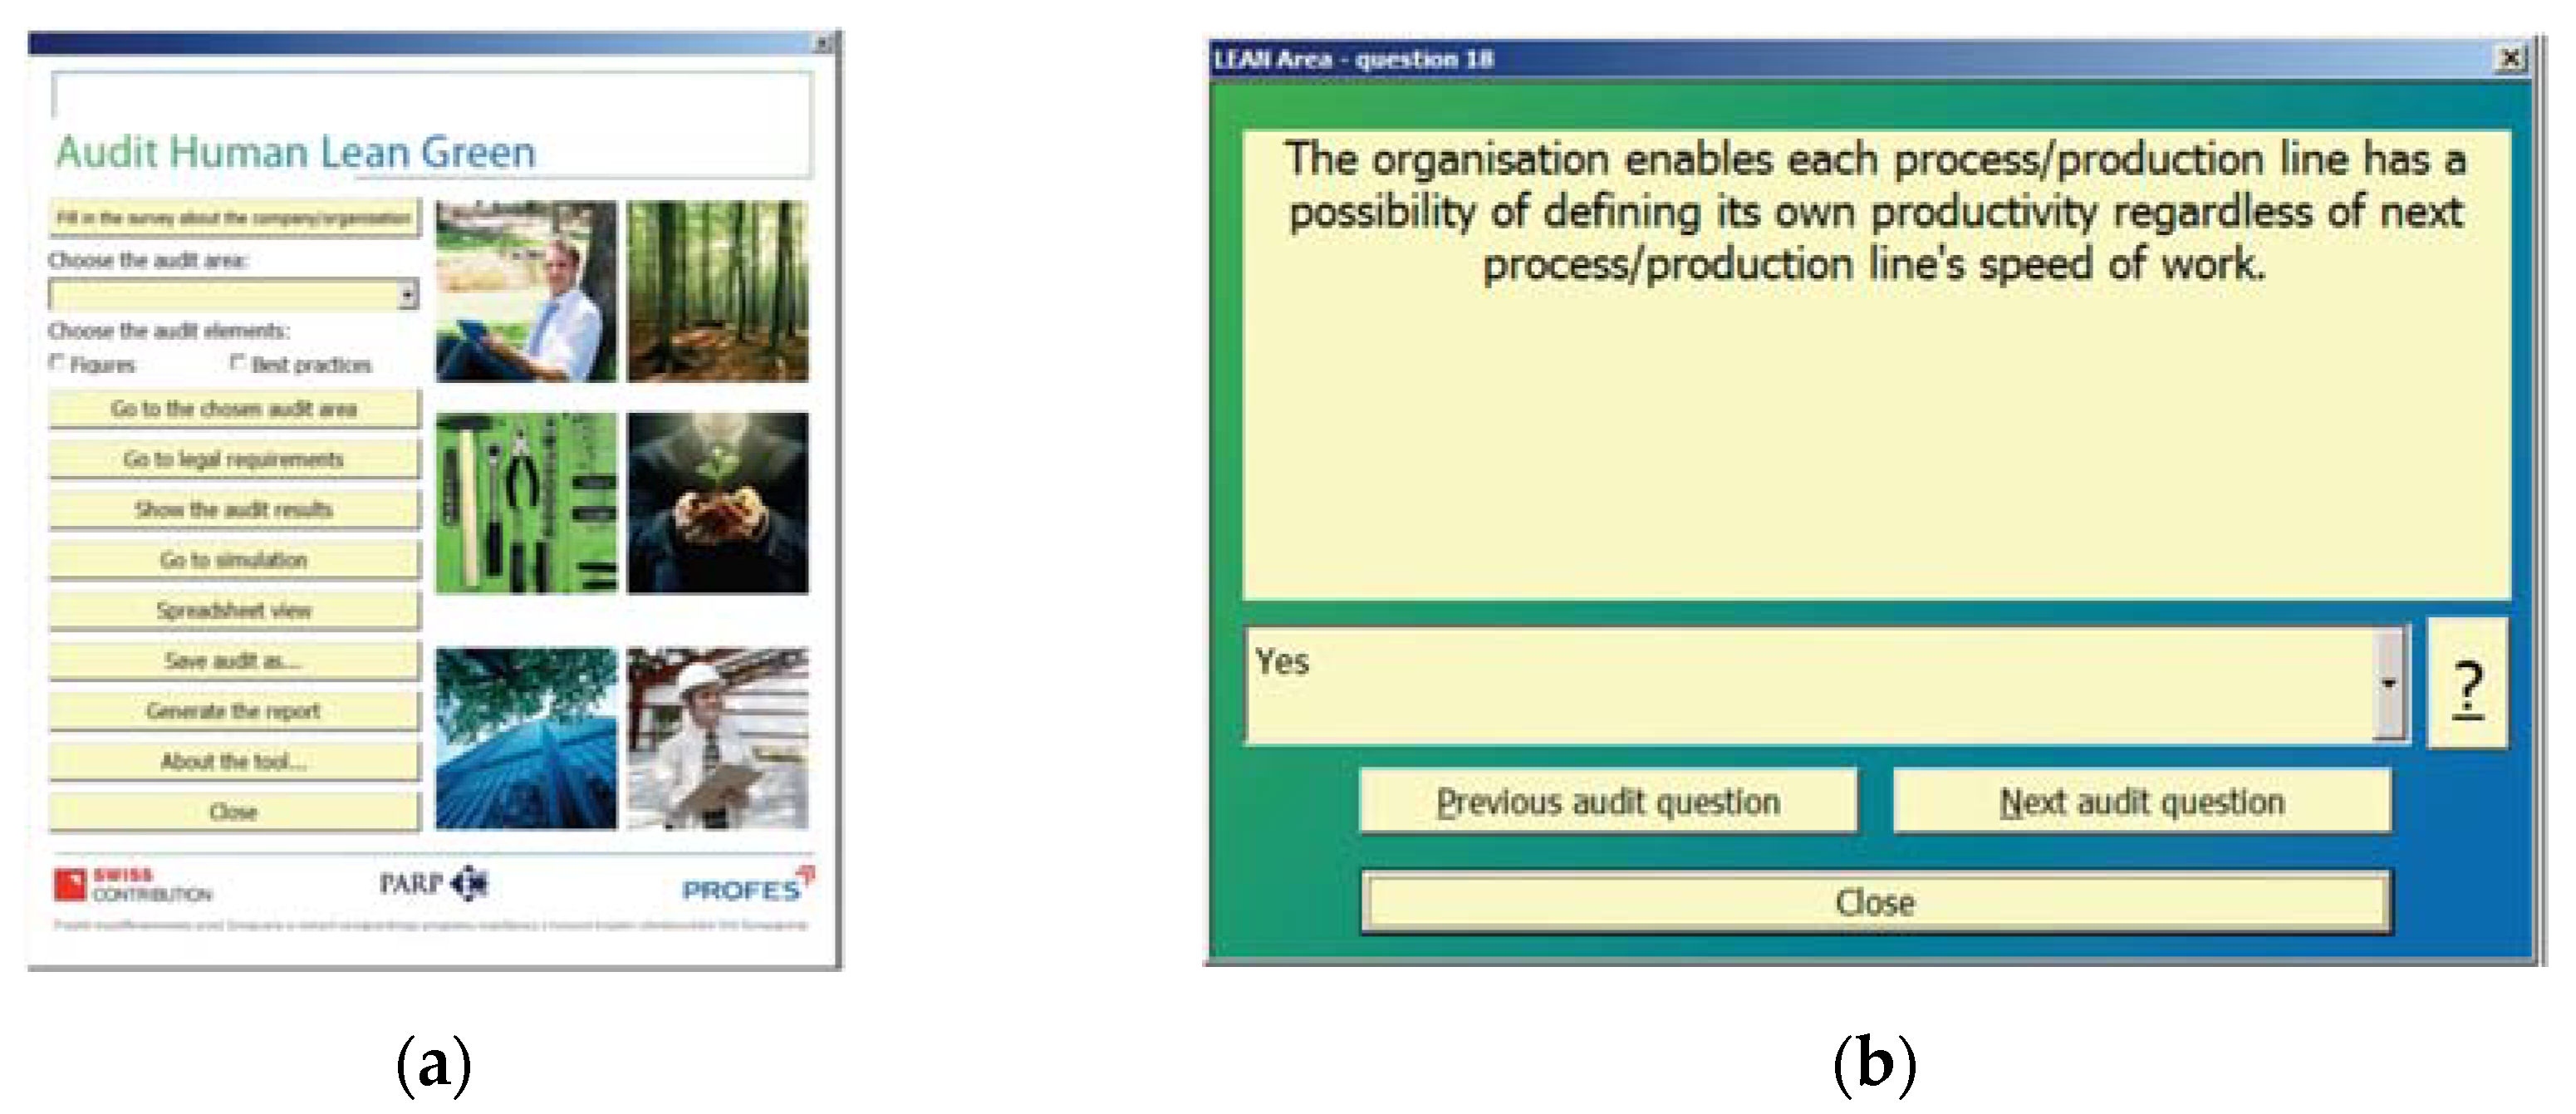
The audit tool was implemented in Microsoft Excel
® (
Figure 2). The software is flexible—it enables the implementation of various audit schemes. This flexibility was achieved by the implementation of audit schemes using spreadsheet mechanisms, such as names (for parameters definition) and formulas (for measures calculations).
4. Results
The developed method, based on the Human Lean Green audit, was used by the authors to carry out a study of the degree of sustainability at the Company X (Due to confidentiality reasons, the name of the audited company will not be revealed). The Company X is a small-sized service enterprise (up to 49 employees) offering consulting services in the field of business operation and management (PKD (Polish Activity Classification) [
28]: 70.22.Z). The firm is one of the largest consulting and training companies on the Polish market and has been working for Polish enterprises and institutions for decades. The experience gained over the years allows Company X to provide consulting services that meet the highest quality standards. It specializes in the areas of improvement and organization management, sales management, human resource management and the development of personal skills. The solutions implemented by Company X are a combination of hard management elements, such as process improvement, standardization of activities, elimination of waste in accordance with the Kaizen methodology, implementation of solutions based on modern information and communication technologies, with soft areas: practical skills, motivation and commitment of employees, which the firm achieves mainly through training and workshops. Consulting for companies understood in this way provides comprehensive support and is a guarantee of durability and effectiveness of implementations. For many years, the company has maintained the ISO 9001 Quality Management System and had the Green Office Certificate, which distinguishes organizations that want to constantly improve, take up new initiatives to protect the environment and strengthen their pro-environmental image. In light of the above information, the Company X is a good case study for the exemplification of the method.
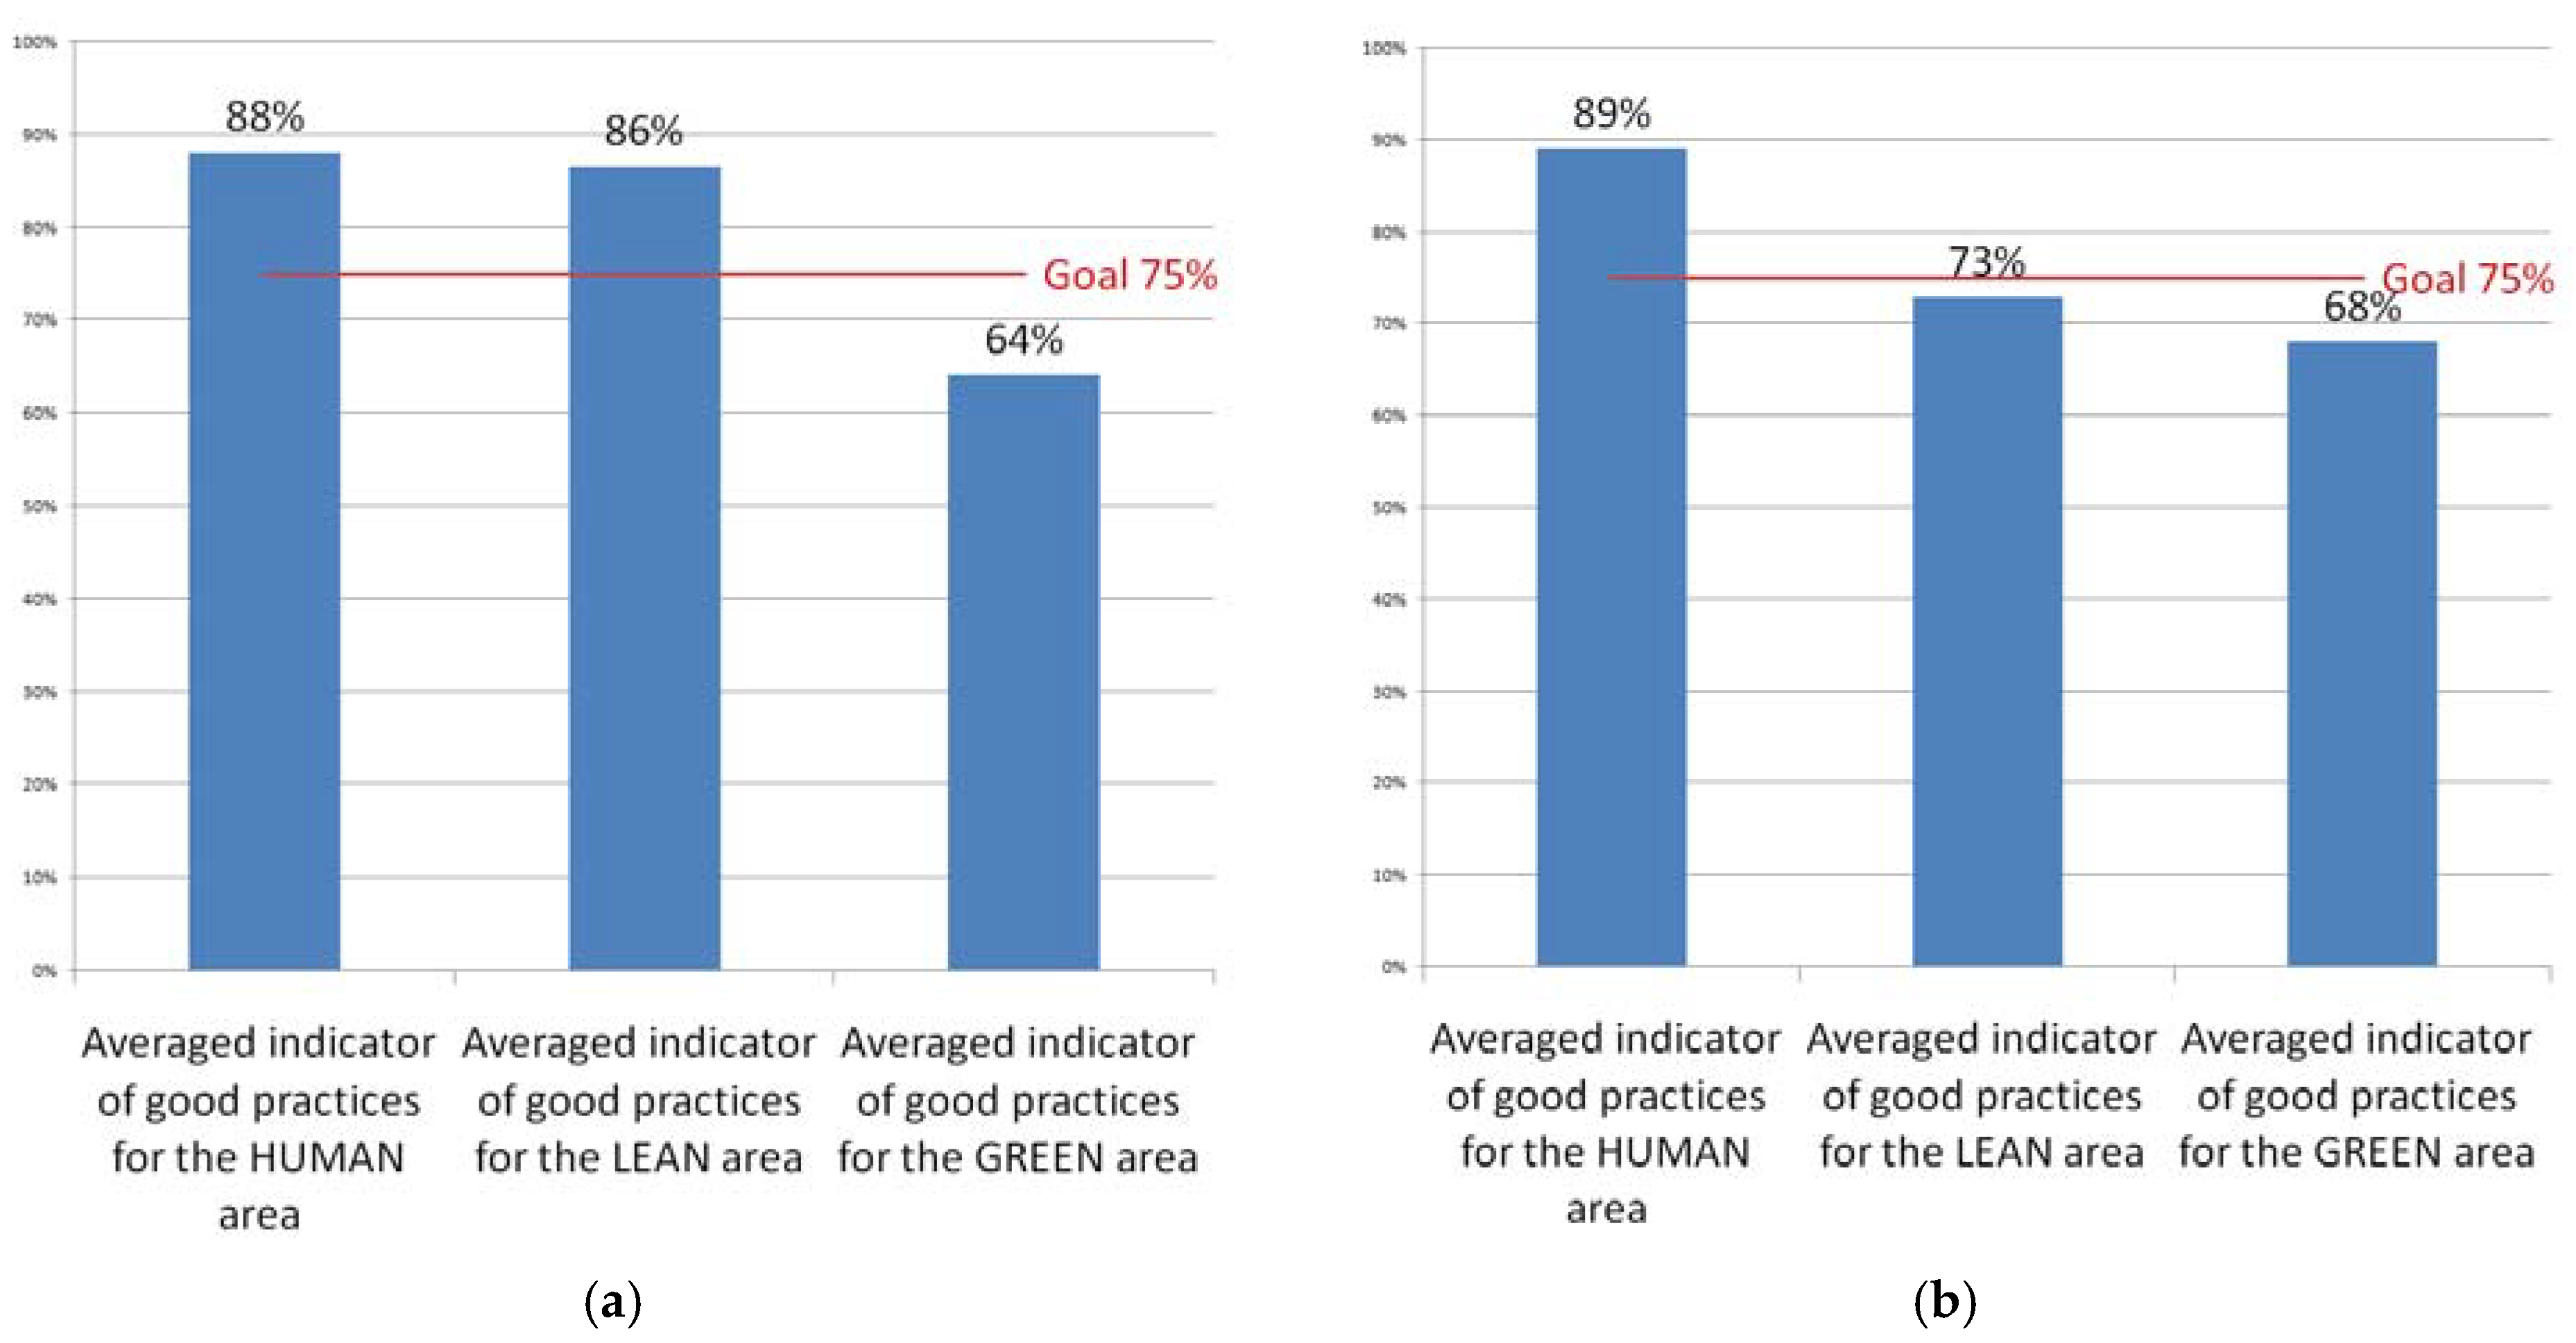
The method was exemplified 3 years apart, in 2018, and repeated in 2021. Two Human Lean Green audits were carried out in the company, a preliminary audit in 2018 and a checking audit 2021. The numerical results, specifying the averaged indicators of good practices in the areas of Human, Lean and Green, expressed as a percentage, were summarized in
Table 3, and presented in the form of graphs in
Figure 3. The results indicate a deterioration in the application of good practices in the Lean area.
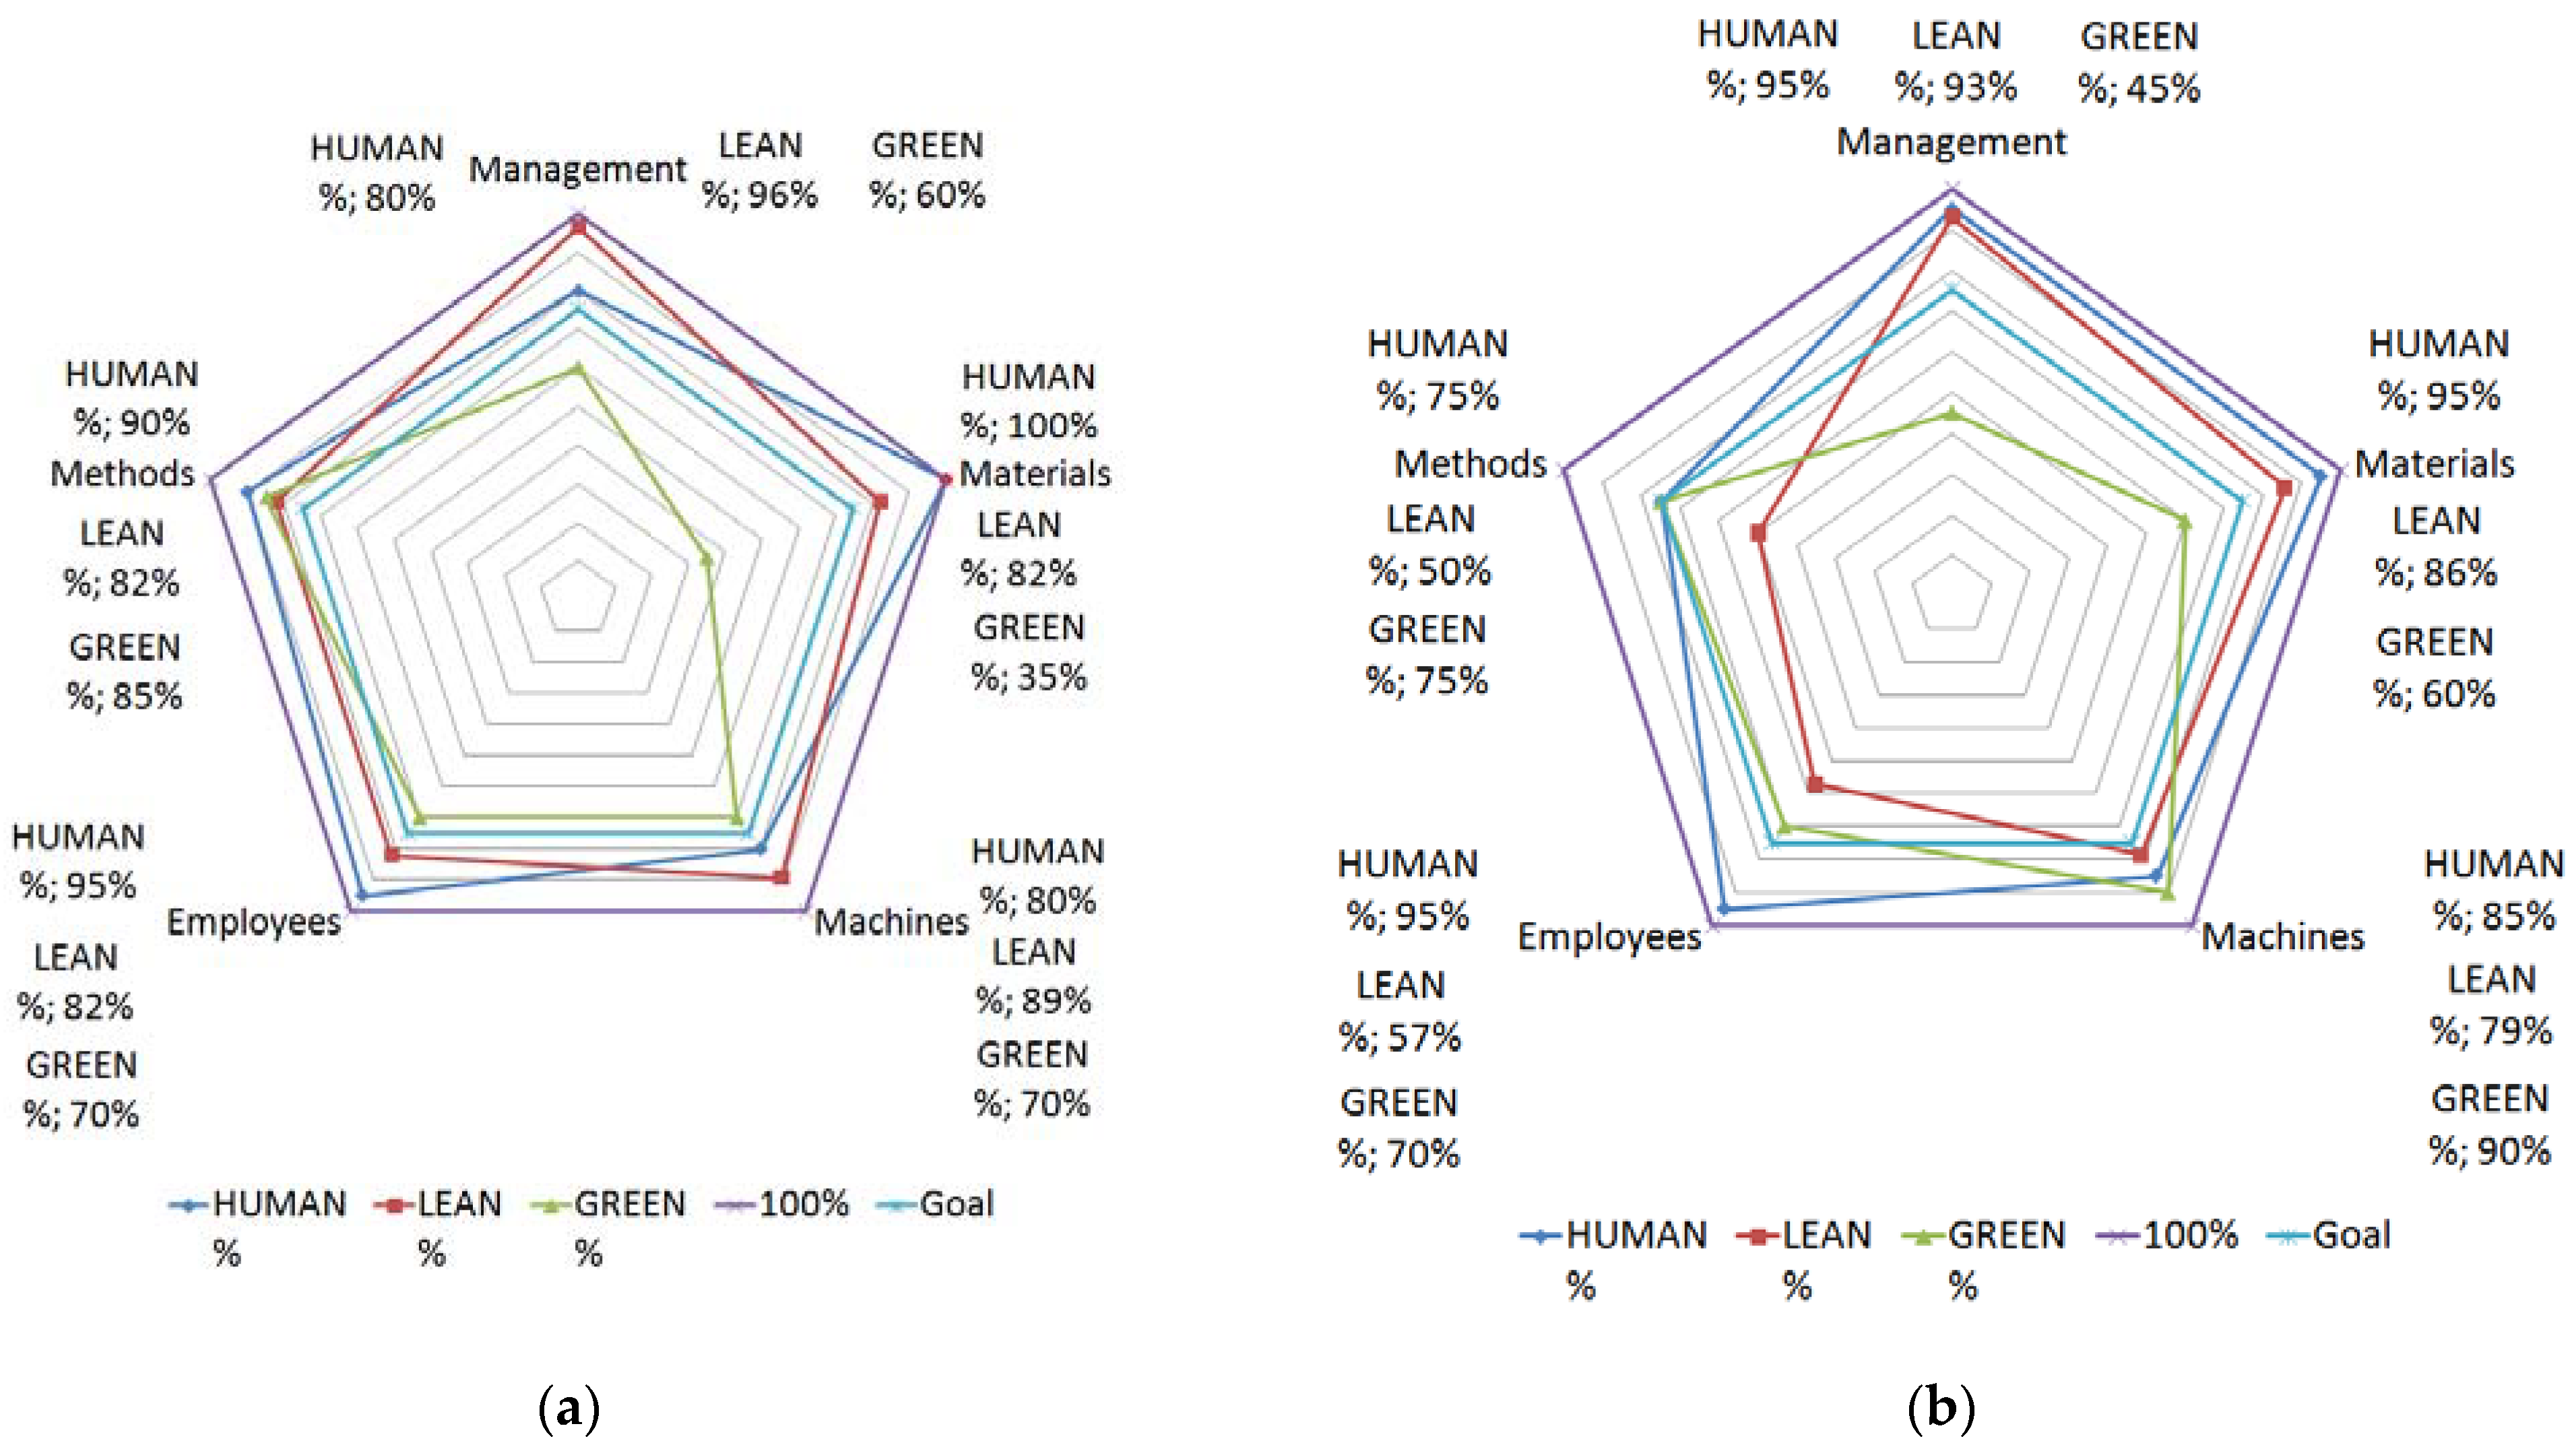
When analyzing the values on the basis of only averaged indicators of good practices, it is not possible to determine the reason for the indicator’s change over the analyzed years, but only the direction of its change. In order to deepen the analysis of the results, it was necessary to examine the dependence of the average audit result on the elements of the Company X company assessment (management, materials, machines, employees and methods). This made it possible to obtain more detailed information than the average audit result showing the cumulative result of the degree of growth sustainability in the areas of Human, Lean and Green. Performing a more detailed analysis, from which one can derive improvement actions aimed at specific, defined areas of the company’s operation (management, materials, machines, employees and methods) is beneficial from the point of view of management analysis.
Figure 4 presents a collective chart of averaged indicators of good practices in the perspective of the Company X assessment elements for the Human, Lean and Green areas for 2018 and 2021.
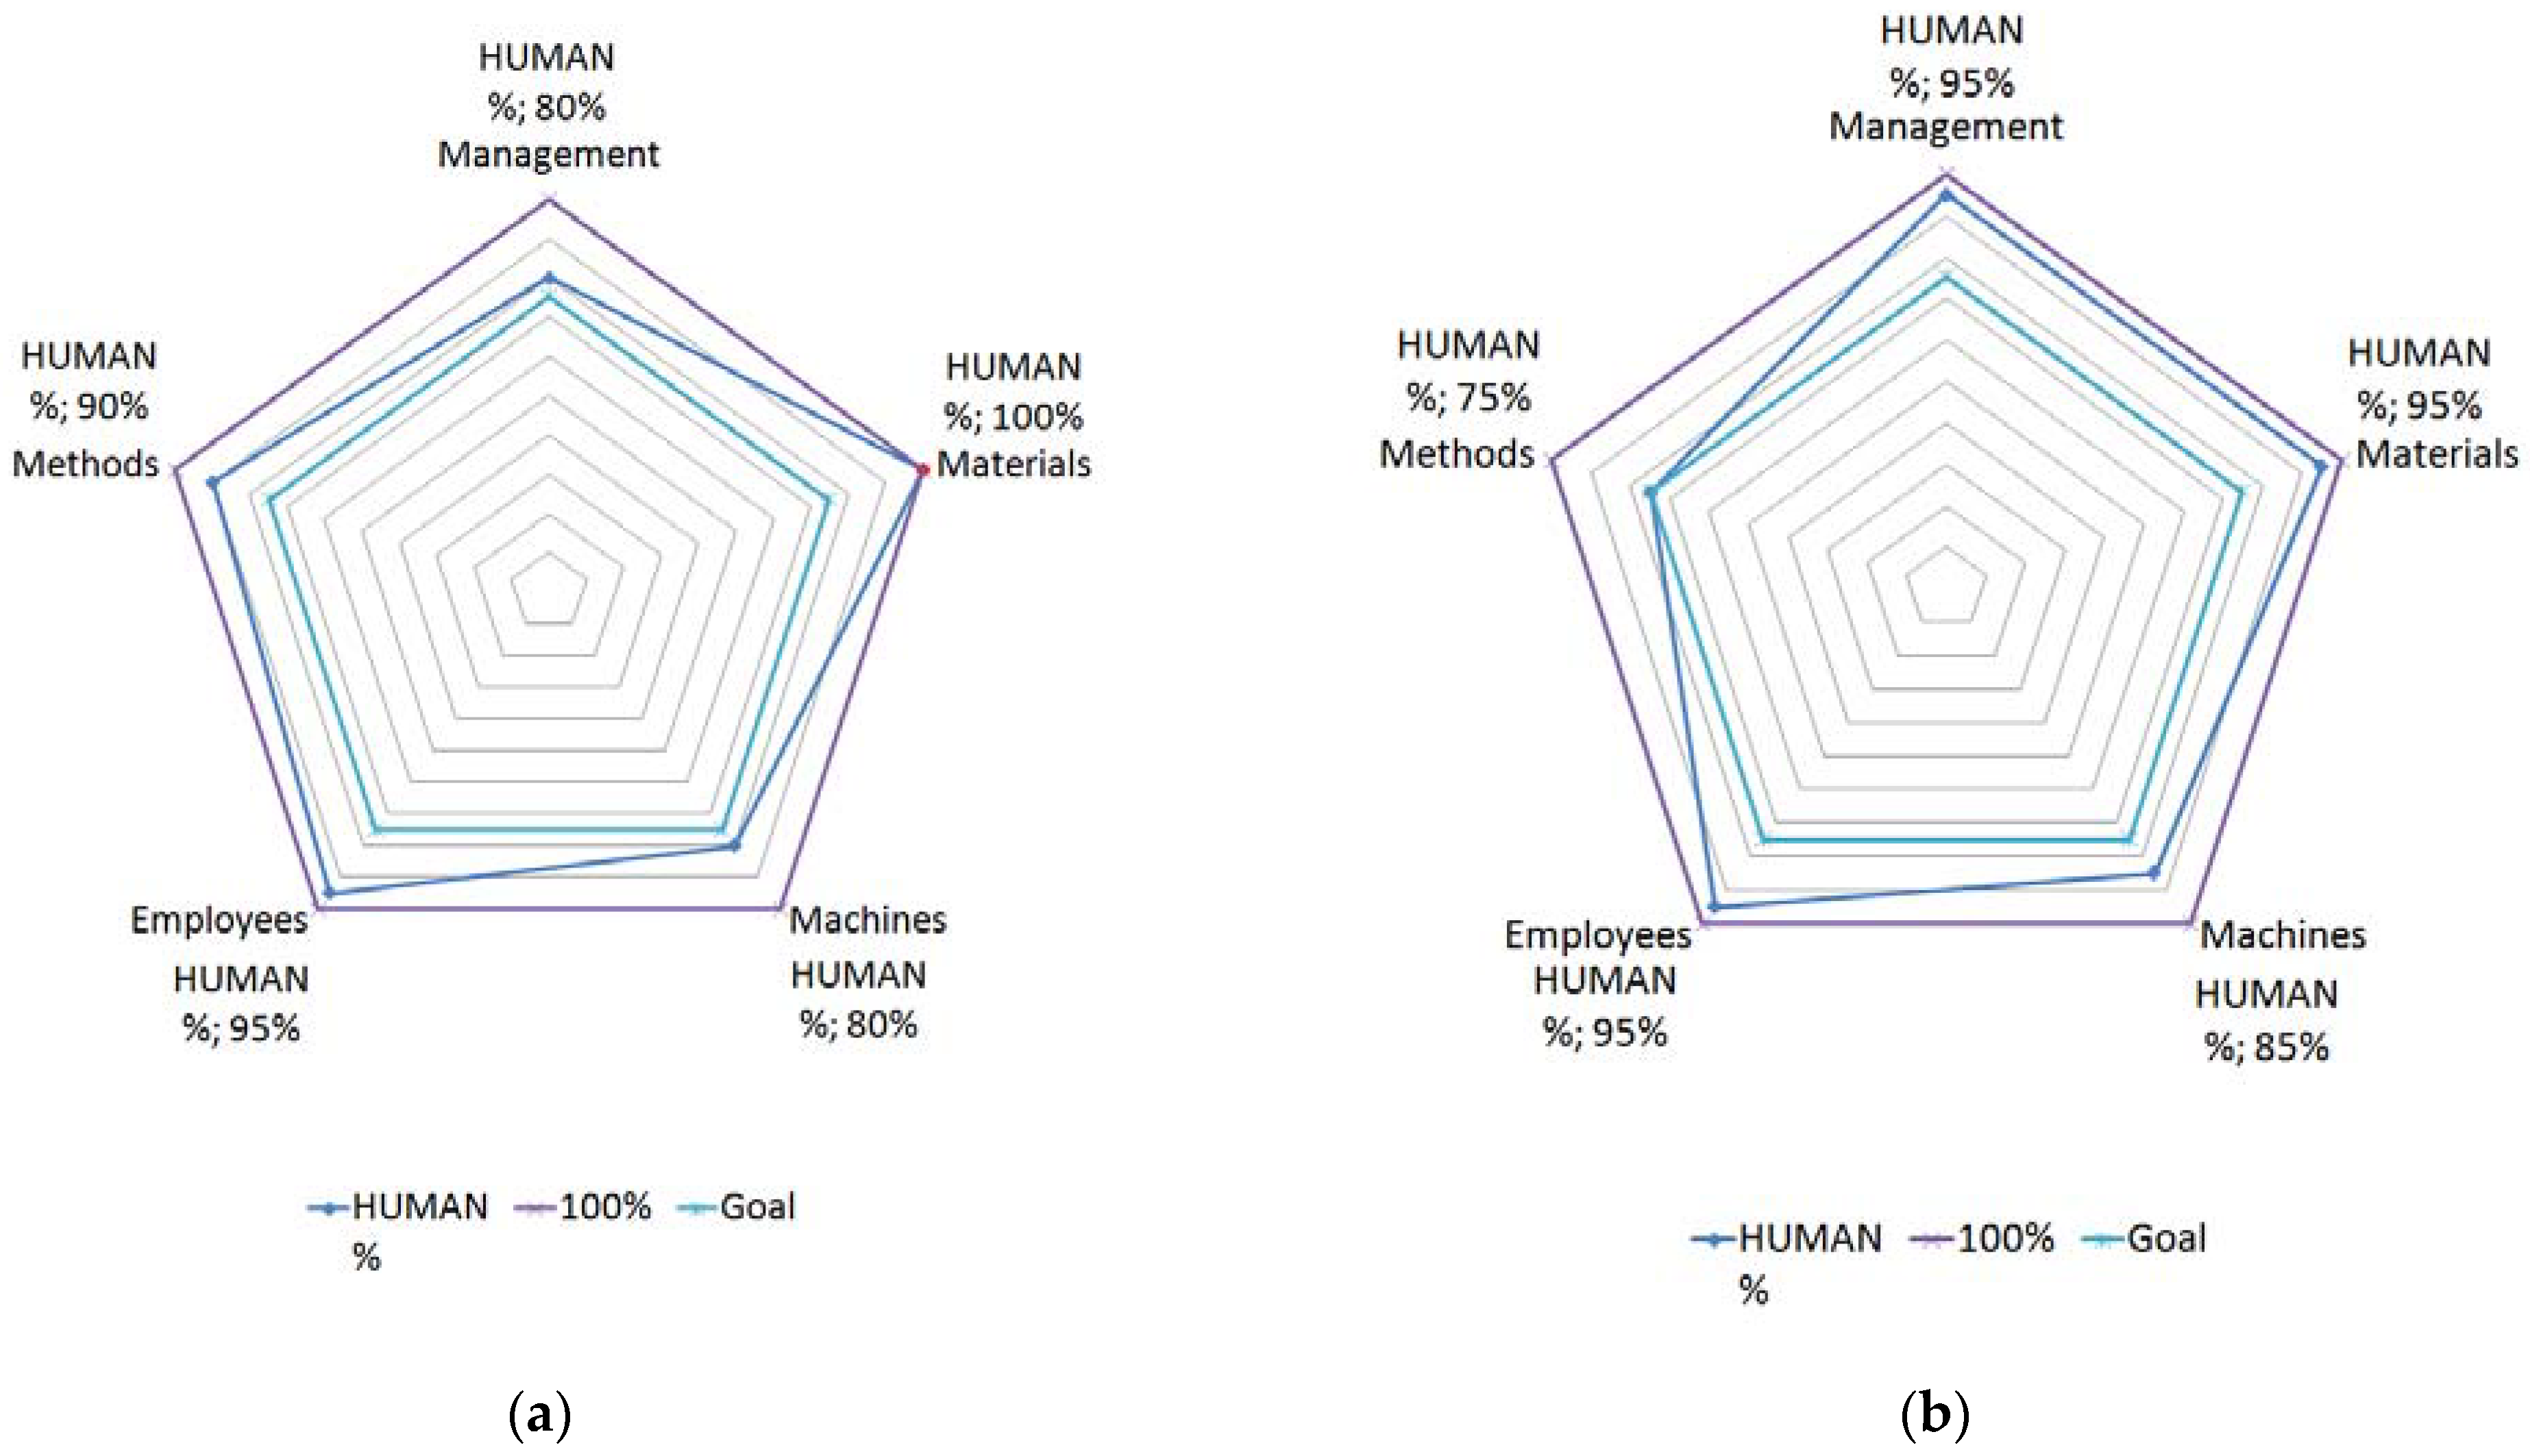
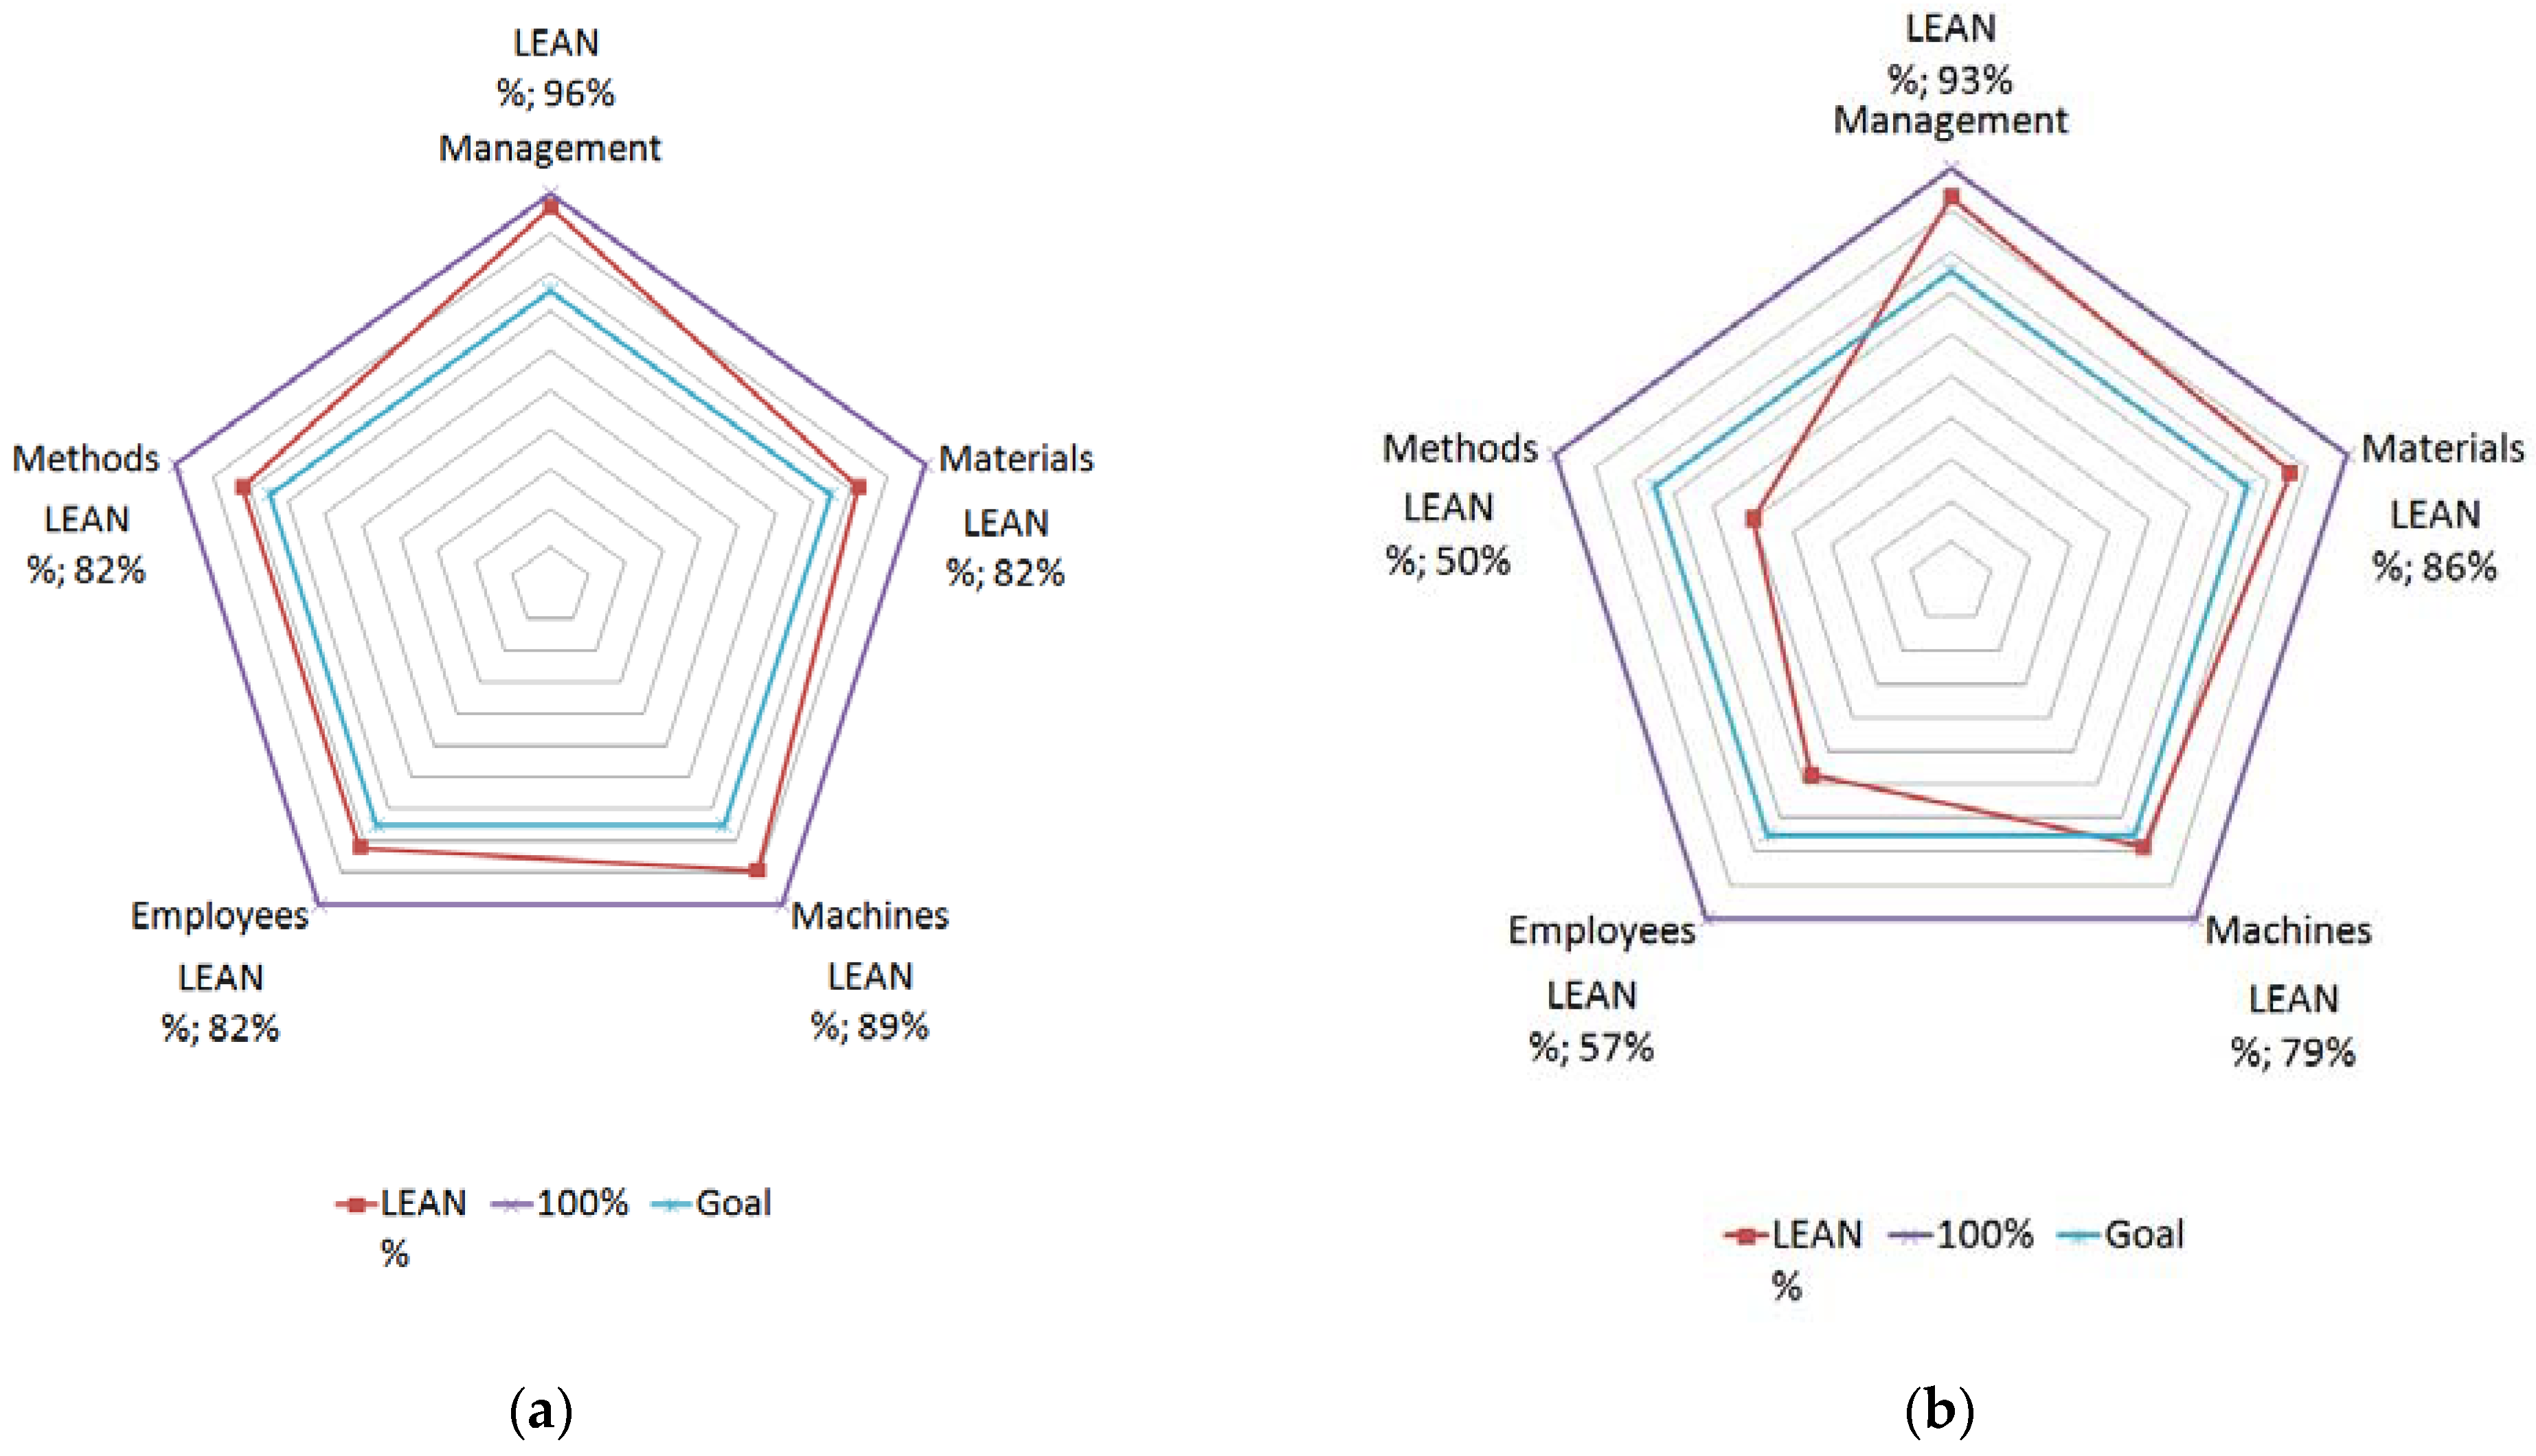
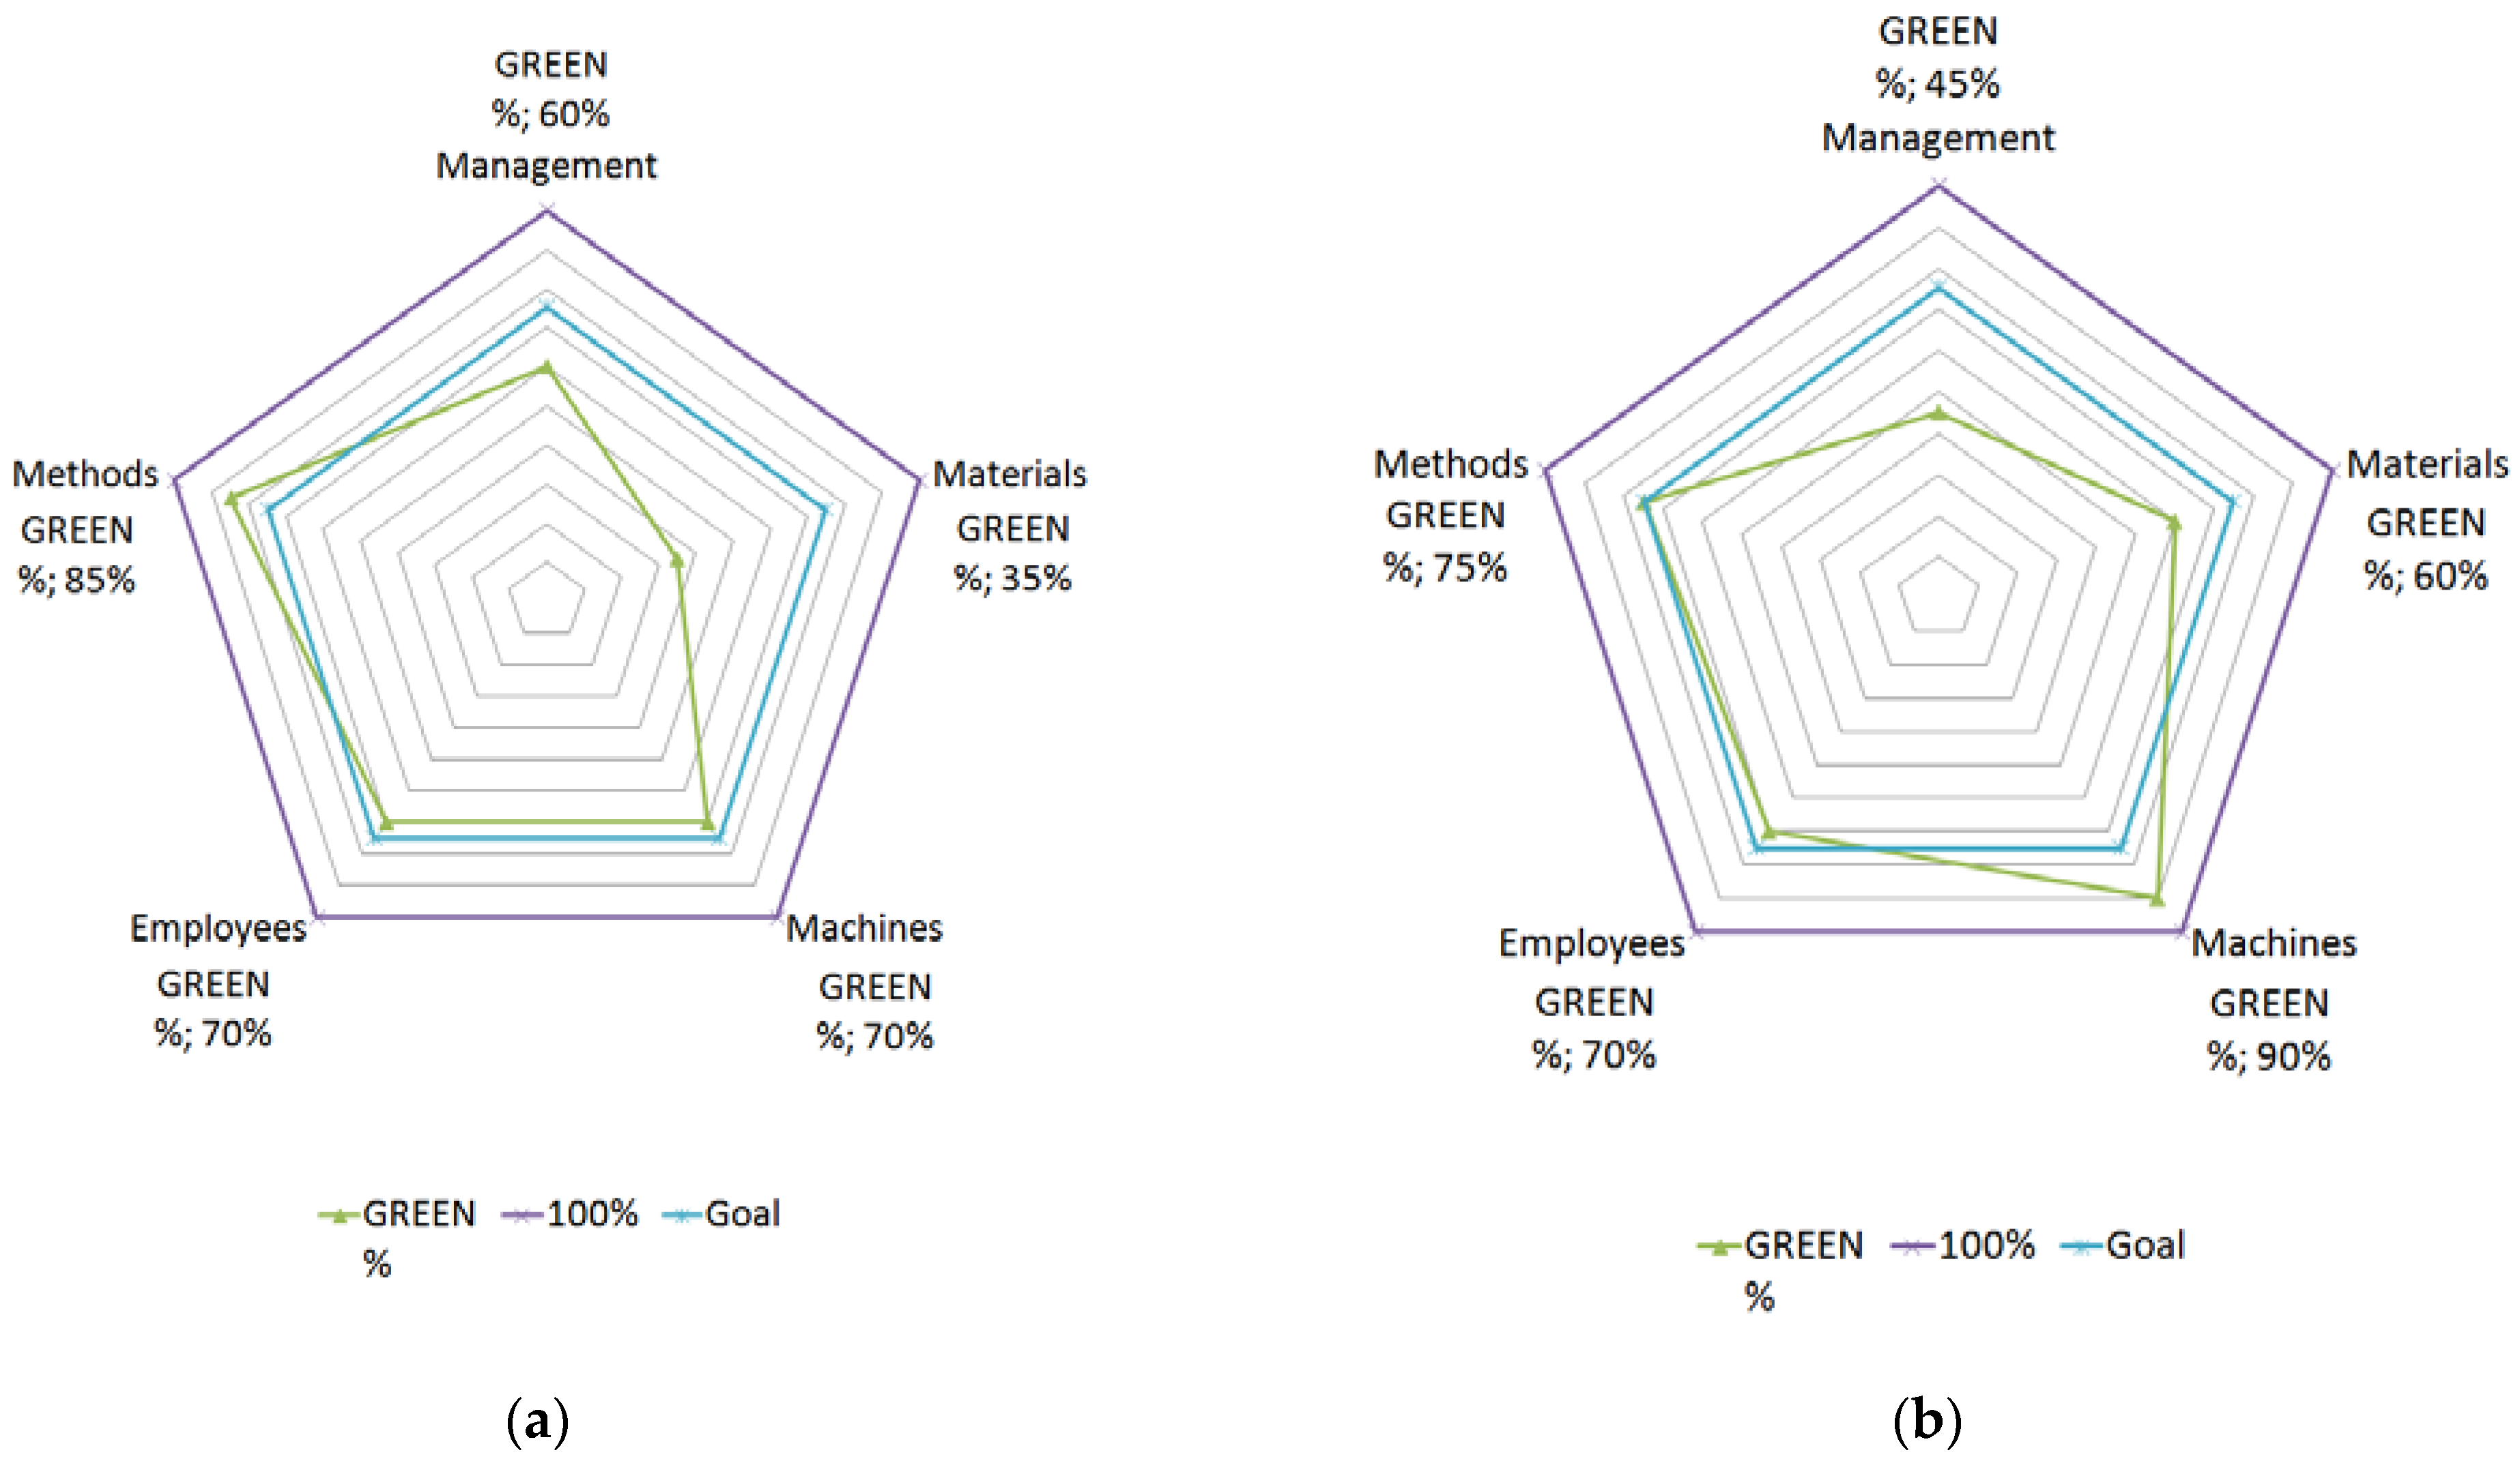
Figure 5,
Figure 6 and
Figure 7 present charts of the averaged indicators of good practices in the perspective of the assessment elements for each area separately in the analyzed years. They allow for a thorough analysis of the areas of the company’s operation in the context of the established goal (in the case of Company X, the goal was set at 75% for all areas and in both analyzed periods) and the mutual relationship between the areas of management, materials, machines, employees and methods.
Table 4 presents the averaged indicators of good practices in a numerical form expressed as a percentage.
In the case of Company X, over the last three years, the comparison of the values in subsequent audits shows a large decrease in the indicator of good practices in the Lean area and a slight increase in the indicator in the Green area. The indicator for the Human area has remained unchanged. From the perspective of the averaged, cumulative indicator of good practices, the result means that the number of good practices in the Lean area at Company X has decreased over the last three years. In order to identify areas in which the application of best practices has deteriorated, it is necessary to analyze the five elements of company assessment. In the
Figure 6, the decrease in value in the area of employees and methods is visually clearly reflected. The decrease, although much smaller, is also visible in the area of management and machines. Knowing the deficit area, it is possible to pay more attention to it and undertake comprehensive corrective measures in this specific area towards restoring the application of good practices. By deepening the analysis to the next level, i.e., starting from the most deficit area (Lean), through the most deficit elements of the Company X company assessment (employees and methods), one can go down to the level of describing a specific good practice and precisely indicate which practices contributed to the low assessment. In this particular case, in the employees element, the result was influenced by the lower-rated practices concerning the following: compliance with standards related to communication and information transfer, knowledge of the organization’s goals and the manner of their implementation, sharing one’s knowledge and experience, striving to minimize stock in their work positions and throughout the entire organization, knowledge of applicable standards regarding the introduction of a new employee and their application, and knowledge and application of procedures and work standards binding in the organization. In the case of methods, the result was influenced by the lower-rated practices concerning: the functioning of standards, procedures and tools supporting the achievement of goals, the knowledge management system in the organization and its systematic updating, and control of the process of purchasing office materials, consumables, food and other materials necessary for the proper functioning of the organization using the kanban system.
This study is dedicated to show a method of assessing the sustainable development of the organization and the functioning mechanism of the Human Lean Green Audit in the context of continuous self-improvement of the organization and awareness of acting in a sustainable manner. It is worth mentioning, however, that over the last three years, Company X has experienced considerable staff changes and restoring the functioning of good practices will require time that must be given to new employees to be fully acquainted with their duties. Another reason was difficult market situations resulting from the COVID-19 pandemic.
The analysis of good practice indicators at Company X, in the context of sustainable development in the areas of Human, Lean and Green, also shows a need to pay attention to the areas of Lean and Green. Both of these areas, in the light of the audit in 2021, indicate a deficit in the application of good practices in relation to the number of good practices in the area of Human and give the company’s management a stimulus to apply corrective measures, especially since they do not achieve the assumed goal (75%). In 2018, the Human and Lean areas were much more balanced, and both exceeded the assumed goal (
Figure 5a).
5. Discussion
The main purpose of internal auditing is to assess the extent to which the management system complies with the relevant standard. On the one hand, audits carried out by external organizations (external bodies), as well as internal auditors, are a condition for obtaining or having a certified management system. On the other hand, these activities are perceived as time-consuming and equated with bureaucratic procedures. As shown by Hawkes and Adams [
29] and Beckmerhagen et al. [
30], the mere control of compliance with the standards is not the right direction in the context of creating added value in the organization.
The development of the Human Lean Green Audit responds to a business request formulated in [
31] to make internal auditing have more added value and be business-oriented. The audit was designed in relation to the company’s operational activity. The audit questions were formulated in line with best practices applied in modern organisations within areas compatible with three major pillars of sustainable development. In this way it is consistent with the enterprise’s goals resulting from the implementation of the sustainable development strategy.
The postulate of balance between checking compliance with standards and looking for added value is also put forward by Power and Terziovski [
32]. Alic and Rusjan [
33] emphasize, in turn, that internal auditors focus excessively on the implementation of the audit programme itself, thus neglecting the issue of examining the company’s effectiveness. Within the Human Lean Green Audit, the assessment of the company’s sustainable development is carried out by measuring the indicators obtained from the analysis of answers to questions concerning the use of good practices in all highlighted areas.
It should also be a challenge to ensure internal audits as potential sources of possible improvements in the enterprise. As noted by Mironeasa and Codina [
34], Lenning and Gremyr [
31] and Elliott et al. [
35], the management of audited companies expects that the conducted audit will provide them with both diagnostic data in terms of the effectiveness of the processes carried out, and at the same time information for taking improvement actions. The developed audit tool, along with the possibility of generating a report, also meets these demands. Namely, as a result of activities undertaken by companies to achieve the goals of sustainable development and compliance with the principles of CSR, it was necessary to develop a method of reporting this activity.
The most popular, currently used standard is the GRI system, initiated by the Global Reporting Initiative [
36]. While GRI is global (it sets universal scope and reporting ratios for GRI that can be used by all organizations), HLG audit is local and dedicated to production and service companies. Therefore, the study is carried out on a micro-scale, i.e., at the level of the organization, or actually the processes implemented in it. Stakeholders of the HLG audit results are the management and employees of the audited company; in the case of GRI reports, the recipients are primarily external stakeholders [
36]. All questions included in the Human Lean Green Audit tool and post-audit recommendations are based on the proven experiences of other entities. In this way, the risk of failure in the search by organizations for effective actions leading to meeting the requirements set for them is reduced.
The HLG Audit, based on the consensus assessment together with the action plan, generated as the final step of the audit in the form of report, can serve as a guideline for managers open to changes and new trends to achieve the status of an effective, socially responsible organization applying sustainable development principles. The best practices indicated in the report are based on the best global standards and should be viewed as target benchmarking.
The conducted audit report provides the organization with a comprehensive picture of the current situation, recommendations of tools, workshops and solutions intended to support the organization which are necessary to achieve the expected results. The report also includes suggestions for best practices that are key to the organization’s sustainable development. They involve bullet points related to the elimination of waste in processes and boosting effectiveness, proposed actions reducing the negative impact on the natural environment, as well as activities supporting ergonomics, OHS and waste elimination, especially based on the best 5S practices in the working environment. The audit diagnosis implementation enables an increase in the organisation’s competitiveness and also helps to identify threats and opportunities used as grounds for development.
In order to maintain and improve the achieved results, it is advisable to carry out subsequent HLG audit iterations. The compared results will facilitate the monitoring of progress or regress from three perspectives. An additional advantage of aggregating results is, in addition to reflecting the trend of the organization, the possibility of positioning it against others.
6. Conclusions
The worldwide policy and the need to take into account the principles of sustainable development in the functioning of enterprises requires the application of appropriate methods which take heed of these principles. The review of the functioning solutions indicates the existence of a methodological gap in the tools allowing to identify the state of an organization in a comprehensive manner, covering three main areas of an organization’s sustainable development.
The article presents a method of assessing the sustainable development of enterprises implemented in the form of an audit and dedicated to manufacturing and service companies. The assessment of a company’s sustainable development is carried out by measuring indicators obtained from the analysis of answers to questions concerning the use of good practices in manufacturing and/or service processes. The study is conducted in three areas: process improvement (Lean), environmental impact (Green) and quality and safety of the workplace (Human). The key elements of the presented method are: distinguishing the area connected with the condition of staff at the working place (Human), laying emphasis on good practices and orientation on the assessment of manufacturing and services companies.
The application of the method in practice allows to identify the most important areas of improvement and provides an enterprise’s management with an opportunity to define priority actions along with the recommended best practices and tools. The report generates an action plan to eliminate waste and increase efficiency within processes, steps to reduce negative impact on the environment, increase the ergonomics of the workplace, raise OHS standards and eliminate waste based on the best practices in the workplace.
Analyzing a significant number of companies on the market would provide an opportunity to create a database collecting the degree of implementation of good business practices in enterprises in the context of sustainable development. As a consequence, it would be possible to define a benchmark on the market, both at a very general level of Human, Lean, Green, and at a more detailed level in the context of enterprise assessment elements (management, materials, machines, employees and methods). Having a benchmark would, in turn, provide enterprises with an opportunity to compare themselves with the best in the world and set realistic goals for their organizations, and more broadly, to set and analyze market trends. These are the potential research implications of the method.
The presented method also has some limitations. The usage of the presented method requires collecting a broad scope of information from various areas of a company’s activity which is connected with the potential involvement of domain experts within it. Although the method can be applied on a one-off basis, its usefulness reveals in periodical applications. The trends in the way of achieving sustainability in a company are possible to be identified only when the method is applied systematically. It is advisable to use the method with the support of an external auditor who will conduct an audit, aiding a company’s staff during it and giving post-audit recommendations.
The limitations of the presented method determine directions for future research. The method will be further developed toward including the integration aspect of the assessment. Future research directions will rely on the identification of potential interconnections among audit areas and shared audited criteria in order to include potential integrated elements in the improved version of the method. In this way the Human Lean Green method will allow for more advanced tracking of the sustainable development of companies.


