Abstract
This study analyses the relationships between the technologies of Industry 4.0, continuous improvement, and the business results. To carry out this study, 109 questionnaires to companies of different sectors were collected, but an indispensable condition to take into account was the fact that these companies develop themselves their logistics management. The analysis of the results obtained through the Partial Least Squares (PLS) methodology argues that there is a positive relationship between 4.0 Industry and continuous improvement processes, as well as between continuous improvement processes and organizational results, although it cannot be concluded that a direct relationship between 4.0 Industry and organizational results exists, which means that there are other variables, such as continuous improvement, mediating between them. With this work, there is already an accredited reference of the relationship, which has been verified to exist, between the Industry 4.0, the continuous improvement, and the business results.
1. Introduction
One of the basic supports of Taiichi Ohno’s methodology was continuous improvement, as a tool to obtain better business results. The 5S technology developed from these technologies, advances on this idea, which is later included in Concurrent Engineering and Lean 6S methodologies. The current Industry 4.0, as an evolutionary result in terms of production systems, includes these technologies, applying them to new technologies such as Enterprise Resource Planning, Artificial Intelligence, Cloud Computing, or Big Data. In this way, according to the structure of this article, the sixth S of 6S Lean may be Cybersecurity. In this work, a tour of the 4.0 Industry advanced technologies is made from the approach not only of sustainability but also of the search for improvement and better organizational results.
The aim of the paper is to analyze the relationships between the current technologies of Industry 4.0, continuous improvement, and the business results to verify if the first one is influencing the other two. This subject is important because sometimes researchers advance in technological development, focusing on it, forgetting that what really matters is people.
2. Literature Review
The fourth Industrial Revolution or Industry 4.0 has brought a large number of technologies with it. Such a situation makes the dynamics of organizations change and it is necessary to implement some of them for management, because this process can be an important generator of competitive advantages, which can be achieved through any of the three generic strategies: low costs, differentiation, or focus [1].
Before describing the most relevant Industry 4.0 technologies, the concept of Industry 4.0 is defined as “a new organization and control model of the value chain through the product life cycle and throughout the manufacturing systems. Supported and made possible by information technologies” [2] (p. 3).
2.1. New Technologies of Industry 4.0 in Logistics Management
In this section, the definitions of different authors on the concept of some of the Industry 4.0 technologies that are generating important changes in the logistics management of companies are cited. Among the technologies analyzed, the following are presented: Resource Planning Systems (ERP), Supply Chain Management (SCM), Artificial Intelligence, Cloud Computing, Cybersecurity, Autonomous Cars, Drones, Big Data, Data Analysis and Mining of Data, Collaborative Robots, and 3D Simulation.
2.1.1. Resource Planning Systems
Enterprise Resource Planning (ERP) are solutions based on application software modules that help to manage the important parts of the business, such as: sales, production, materials management, maintenance, and recently it is observed how they include, within their standard, the latest technologies; Internet, workflow, document management, among others [3].
Likewise, Quispe-Otocama describe ERP as [4]:
A computerized management administration system that makes it easier and more precise to evaluate, control, and manage a company. Currently, an ERP is a necessity, even more so when the volume of information increases more and more, and decisions are made based on information [4] (p. 7).
Regarding this topic, Riascos-Erazo affirms that ERPs in Industry 4.0 have continued to evolve [5]. Currently, they are known as EERRP or extended ERP, where processes such as self-management, electronic commerce, business intelligence, among others, are integrated into the technology. Moreover, this technology is today combined with Cloud Computing, that is why some ERPs are called “ERP in the cloud”.
The implantation of this type of systems brings remarkable advantages. According to Coloma Bedón and Cadena Piedrahita [6], the main advantages of ERPs are:
- Single entry of information to the system.
- Use of forces.
- It allows customization.
- It is based on a reliable structure.
- It provides functionality to interact with other modules.
- It provides the tools for complex queries.
- It provides proven implementation methodologies and theory of change.
2.1.2. Supply Chain Management (SCM)
Named as Supply Chain Management, Silva defines SCM as the “Management of materials and information flows within and between facilities, such as suppliers, manufacturing and assembly plants and distribution centers” [7] (p. 52).
As indicated by Mesa and Carreño [8], SCM is also defined as the network of organizations involved in upward and downward flows to manufacture products or provide services that meet customer needs, through an integrated, synchronized, and coordinated supply chain to achieve continuous improvement in: reduction of inventory needs, cost savings, and reduced response times.
Figure 1 illustrates the flow of information and the relationship between the different processes that make up the supply chain in a company that, among its processes, has immersed logistics management.
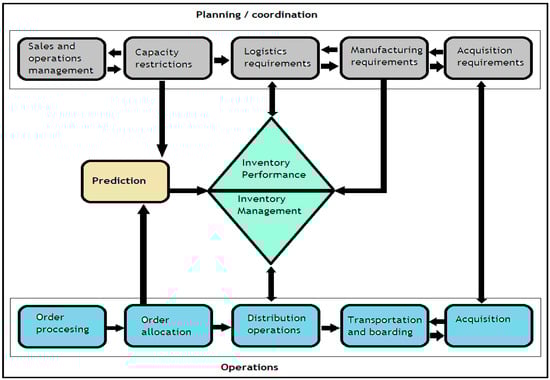
Figure 1.
Information flow in the supply chain (source: Own elaboration based on Bowersox et al. [9]).
The origin of SCM is similar to that of ERP systems, since it arises from the need to manage business information to optimize processes. Within the evolution of this system, the movement of Quality Management and the Just in time systems implemented by Toyota in the 1970s were very popular, according to Ohno [10].
Although SCM technology currently makes use of other AI technologies to become more efficient, the fact of synchronizing the different links in the chain is absolutely not an easy task. As stated by Schwarz Díaz [11], this complex process requires standardization of the different companies that make up the chain, their infrastructure, software, policies, protocols and work methods, with the additional difficulty that each link presents a different organizational culture, investment level, and modernization.
Currently, customers are looking for to establish a single contract for the complete management of the entire supply chain, in order to reduce the supply times of the materials and maximize the availability of the fleet to match the service company [12].
According to Di Nardo et al. [12], the first phase is to get a list of suppliers that must comply with the technical specifications imposed by the company, then decide for suppliers that meet specifications to subsequently carry out the contract. Finally, inventory management policies must be defined. Contractual agreements are established to speed up the supply chain, and for this, it is necessary to consider the times of issuance of an order, shipping methods of raw materials for repair, and all possible warranty management agreements [12].
The acquisition of a SCM system entails several advantages for business management, which are presented below, in Table 1, taking into account the advantages contemplated by Mora García [13].

Table 1.
Advantages of the Supply Chain Management System (SCM).
2.1.3. Artificial Intelligence (AI)
According to Basco et al. [14], this term refers to a set of algorithms that allow computers to process data at an unusual speed (a task that previously required several computers and people), thus, achieving machine learning. These algorithms have the characteristic of being nourished by data and recently perfectioned, emulating the machine with cognitive capacities typical of human beings, such as vision, language, understanding, planning, and decision.
In turn, Rouhiainen [15] defines AI as “the ability of machines to use algorithms, learn from data and use what they have learned in decision-making just as a human being would” [15] (p. 17). Moreover, Waltersmann [16] define AI as an activity dedicated to manufacturing intelligent machines, with intelligence being the quality that allows this entity to function properly.
According to Brossi et al. [17], the latest AI revolution began in 2012, driven by the availability of new computational resources, specifically those related to video cards or GPUs, which led to the development of a new discipline called “Deep Learning”.
The following are the most outstanding advantages of AI according to Porcelli [18]:
- The importance of achieving the Sustainable Development Goals is highlighted, so that it can be used to combat extreme poverty and improve the quality of life in remote areas in many different ways, for example, by improving agricultural land and agriculture in general.
- It has the potential to create highly effective and personalized education systems that can be tailored to the needs of students.
- In healthcare, the power of computers is used to analyze and make sense of a large amount of electronic data about patients such as: ages, medical records, health status, test results, DNA images sequences, and many others, in order to improve decision-making that helps improve the quality of life of patients.
- In jobs, it reduces additional costs and salaries, increasing the effectiveness and productivity of the company. By automating activities, it enables companies to improve performance by reducing errors and improving quality and speed.
2.1.4. Cloud Computing
This technology offers storage, access, and use of online computing services. It can be expressed at three different levels, depending on the service provided: infrastructure as a service, platform as a service, and software as a service. In addition, it allows companies to access computing resources in a flexible way with low administrative effort and from different devices, offering agility, interoperability, and scalability. This technology helps many of the applications that, until recently, required the installation of a program on a server hosted in companies, to be now executed remotely [14].
For Qasem et al. [19], Cloud Computing “benefits from the adoption of fast-paced information technologies, which is more pronounced for research; this aspect is favourable compared to the traditional software system” [19] (p. 3). This is why this technology is essential for the education sector, due to the possibility of remote access to online study material and at a lower cost for the student and the institutions. This technology can be applied to the world of industrial processes for the control of machine tools and more, in general of the production line. This combination is called Cloud Manufacturing and is one of the key Industry 4.0 technologies, because it allows an integrated control and in reality remote productive complex and distributed [20].
Cloud Computing continues to evolve day by day, according to Osorio Montoya [21]; these technologies are aimed at cognitive computing that involves AI and Blockchain as a global platform, which allows commercial and personal transactions in block networks and towards cognitive security to help reduce costs and respond to cyber-attacks.
Table 2 gathers the main advantages of Cloud Computing, according to the study carried out by Rodríguez [22]:
Table 2.
Main advantages of Cloud Computing compared to business aspects.
2.1.5. Cybersecurity
Basco et al. [14] define this technology as essential for all other technologies, to achieve adequate penetration in this phase of digitization. Due to the evolution towards an intelligent industry and the growing integration of value chain actors, companies are being to some extent forced to develop cybersecurity mechanisms in industrial environments that allow detecting, anticipating, and neutralizing threats to the information systems of companies. This need arises due to the greater connection of people, through different devices and machines.
Since 2010, the concepts used to refer to security, always in its technological aspect, are those listed below: Cyber-resilience, Transparent Security, Active Defense, Cyber-intelligence, Digital Government [23]. In this period, new threats have been detected, becoming increasingly complex. Among these, Casado Ronbledo [23] identifies as the most relevant: Hacktivism, Cyberwar, Hybrid Conflict and Disinformation.
The main advantages of this technological tool are defined by Caamaño Fernández and Herrera Gil [24]:
- Cybersecurity serves to shield organizations against threats and vulnerabilities caused by existing cyber-attacks in cyberspace.
- It facilitates citizens, as well as public and private companies, to benefit from the use of cyberspace through ICT, to share information between the different social actors and behaves as a database for storing information.
- It helps to protect the economic and social stability of companies from their stakeholders, since it allows the continuity of operations with greater security.
- It evaluates the threats and vulnerabilities presented by cyberattacks, in such a way that it reveals the crimes committed and the collection of evidence for their respective prosecution.
2.1.6. Autonomous Cars
To understand the concept of autonomous cars, the three concepts that Anitua Galdón [25] established, must be defined. In the first place, you can find Conditional Automation, which refers to “the specific benefits of the driving mode, through an automated driving system of all aspects of the dynamic driving task with the expectation that the human driver will respond appropriately to a request to intercede” [25] (p. 20). In the second place, High Automation, which is “The specific performance of the driving mode by means of an automated driving system of all aspects of the dynamic driving task, even if a human driver does not respond adequately to a request for intervention” [25]. Finally, Full Automation is described as the “full-time performance, through an automated driving system of all aspects of the dynamic driving task in all road and environmental conditions that can be managed by a human driver” [25].
Ramírez [26] proposes the following summary definition:
An autonomous vehicle is a car that is capable of imitating human capacities for handling and controlling, perceiving the environment around it and moving accordingly. That is, it refers to a car in which the driver only has to enter in the destination address and not worry about anything else [26] (p. 1).
Currently, there are several companies that have made millionaire investments to further promote the development of autonomous car prototypes. Among these large companies can be found: Tesla Motors, Mercedes-Benz, and Uber Technologies Inc., which seek to generate a transportation service network [27].
There are several advantages related to Autonomous Cars that would be brought to logistics management and may improve people’s quality of life, such as:
- The decrease in costs related to the transport, storage, and packaging of food that currently represents 70% [28].
- The reduction of deaths and injuries on roads, due to the replacement of all human drivers by computers [29].
- The supply transportation to the population that currently does not generally use their own cars, for example, the elderly or young people who do not have a driving license [27].
- The improvement in traffic flow in cities, due to the fact that all autonomous cars would be connected in a network, working in a coordinated manner [27].
- Less pollution generated by fuels, because a higher percentage of cars would be electric [27].
2.1.7. Drones
Also known by its acronym in English, Unmanned Aerial Vehicle, UAV-drone, is a propelled, unmanned, and reusable aircraft that operates by remote control and autonomously. The drone is only a platform that carries some type of sensor whose purpose is to obtain geospatial data [30].
There are many utilities of this disruptive technology, for example, drones are currently used to improve agricultural work, to improve internet capabilities, inspection or maintenance of network towers, and media coverage in high-tech areas [31].
Concerning the advantages of this technology, Guevara-Bonilla [32] highlights the following:
- It provides a high temporal resolution, thanks to the ease of repetition of flights.
- It generates a lower operating cost for small projects.
- It allows the collection of high precision data and good spatial resolution since, when operating at low altitude, they generate little atmospheric interference, not being affected by clouds.
- There are no human risks for the crew, when using this type of technology. Besides, they show great ease of use for non-specialized operators.
- Ojeda Bustamante [33] also adds the following advantage of this technology: Drones are very useful for those areas that are difficult to access, referring to, for example, volcanoes, fires, areas with concentration of radioactivity, or other disaster areas, such as landslides or floods, among others.
2.1.8. Big Data, Data Analysis and Data Mining
It refers to the data characterized by its volume (large amount), speed (at which it is generated, accessed, processed, and analyzed), and a variety of structured and unstructured data [14]. These data can be reported by machines and equipment, sensors, cameras, microphones, mobile phones, production software, and can come from various sources, such as companies, suppliers, customers, and social networks. The analysis of this data using advanced algorithms is key to make decisions in real time. Furthermore, it allows companies to achieve better standards of product and process quality, and facilitates them access to new markets, a phenomenon known as ‘Data-based Innovation’ [14].
Currently, in the business environment, it is necessary to establish a Big Data strategy. Joyanes Aguilar [34] affirms that this strategy should be included in the company’s global strategy, in order to achieve an exponential increase in the knowledge of the business to generate value and improve companies’ efficiency. In this way, technology is used to transform data into information and this latest into better products and customer services.
Table 3 brings together the main advantages of this technology for logistics management, according to Parada Torralba [35].
Table 3.
Main advantages of Big Data, Data Analysis, and Data Mining in logistics management.
2.1.9. Collaborative Robots
Basco et al. define this technology as a set of intelligent machines that automate tasks that were previously confined only to the human domain. In the world of industry, the trend is to advance on the automation of production processes, navigation and control, the integration of sensors and actuators, and the communication of interfaces [14] (p. 6).
This technology is characterized by its small size, its flexibility, and its affordable price. Unlike traditional industrial robots, therefore, it is ideal for small and medium-sized companies. An investment in this technology offers a rapid return on investment, due to the fact that these robots do not require specialized technicians for assembly and commissioning, being able to be reconfigured to operate at various points in a production line and allowing companies to optimize their productivity [36].
One of the main uses of this technology is to support humans in repetitive and stressful tasks. That is, they avoid work overload, improving working conditions, and the quality of life of the companies’ staff [37].
The main advantages of this technology are described by I-CTEC [38]:
- They are systems that can be programmed in an easy and simple way.
- Personnel training is done quickly and intuitively, and without the need of prior programming knowledge.
- It provides a 100% safe environment when working with them in different phases of the manufacturing process, improving, as a consequence, product quality and prices. The various tasks can be adjusted to the process gradually, that is, there is no need to fully automatize production.
2.1.10. 3D Simulation
It refers to a technology that allows virtually adjusting and representing the joint operation of machines, processes, and people in real time, before being put into operation. This helps to prevent breakdowns, save time, and evaluate the final result in a controlled environment. As a matter of fact, it allows reducing the costs associated with learning processes (of “trial and error”), through a virtual representation of the design of new products, or through testing different configurations in the operations of the production plant [14].
This technology was originated, according to Casal Angulo [39], “In 1929 with the presentation of the first flight simulator called “Link Trainer”, developed by Edwin A. Link that offered a new and innovative alternative for the training of war pilots. This type of training emphasizes the repetition of situations and management of events to improve retention and learning, while promoting active reflection and analysis as a powerful pedagogical tool” [39] (p. 12).
In this sense, Virtual Reality was introduced for the first time in 1991. In the last two decades, there has been a development of Virtual Reality simulators and the use of 3D models. At the same time, studies on the usefulness of simulators in development of clinical competencies began [40].
According to Basco et al. [14], currently, with this technology, it is possible to test (in the virtual world) different configurations until achieving an “optimal virtual configuration” that will then be reflected in the physical production line. Furthermore, the experiences obtained in the real world will serve to improve the virtual environment, generating a kind of collaboration between the physical plant and its virtual representation (“virtual plant”) [14] (p. 28).
Table 4 lists the advantages of 3D simulation, according to Cantú-González et al. [41].
Table 4.
Main advantages of 3D Simulation.
2.2. The Relationship between the New Technologies of Industry 4.0 and Business Results
Torrent-Sellens [42] affirms that, in each Industrial Revolution that humanity has undergone, there are common productive factors that are consolidated as sources of economic growth, job skills change, and social structure. These factors are never the technology on which economic change is based, but what does generate new productive factors are the interactions between different economic activities, business models, market structures, and the organization of the economy. These interactions lead to even growth, where each sector contributes to total development.
“A complete analysis of the effects of Industry 4.0 on business results should identify and consider its four pillars: technology, manufacturing and networks, work and smart products” [42] (p. 5). Companies must make their self-assessment on these four pillars, since they help to measure the impact generated by the technologies used in the Industry 4.0 and the information gathered will serve for decision-making.
The expected benefits of the implementation of Industry 4.0 in companies, according to Torrent-Sellens [42], should be the following:
- (1)
- For products: customization, quality, and reduction of launch times.
- (2)
- For operations: decrease in operating costs, increase of productivity, and higher visualization and control.
- (3)
- Collateral or secondary effects: sustainability and worker satisfaction.
In this regards, Torrent-Sellens [42] concludes that organizations, by using the different technologies of Industry 4.0, generate value through the enhancement of R&D and human capital, which enhances better results, related to an increase in sales, value added, exports, gross operating margin, productivity, employment, and wages.
Another study that summarizes the relationship of Industry 4.0 technologies with business results is the one carried out by Blanco et al. [43]. The application of the above-mentioned technologies to production processes will make them more efficient, due to the optimization of energy resources or raw materials, as well as costs reduction. Moreover, they will make companies more flexible, due to the reduction of deadlines and product customization. In this sense, the incorporation of Industry 4.0 technologies onto existing products will improve their functionalities and allow the appearance of new products. In addition, Industry 4.0 enables the emergence of new business models, such as car sharing services, thanks to the incorporation of sensors into vehicles, or the concept implementation of collaborative economy.
Finally, the sustainability of the economy must be accompanied by social and environmental sustainability, that is, not only business results are expected, but also greater protection of natural resources and ecosystems. This is why the use of disruptive technologies from Industry 4.0, for example, the use of Big Data, becomes essential to obtain the necessary data that leads to decision-making on the preservation of the environment. In fact, according to Ballestero and González Aranda [44], “an economy and a society will not be sustainable if their natural environment is not, and it is still possible to act to achieve sustainability” [44] (p. 137).
The hypotheses raised for this article are focused on the search for the relationship of continuous improvement with Industry 4.0 technologies that entail better business results.
Continuous improvement has been related to quality management systems and lean tools. However, this is a philosophy that any company of any size and industry can apply. This philosophy has entry barriers perceived by the different hierarchical levels of the organization. “While top managers primarily attribute the limited success to shortcomings of improvement methods and supporting technical systems” [45] (p. 1122). Employees point out “to limited support and commitment from management, in addition to other organizational factors, such as lack of involvement, motivation and teamwork” [45] (p. 1122). These two different perceptions of the two interest groups of the company generate the need to achieve continuous improvement, through a commitment from the management and active leadership [45].
At present, the different technologies of Industry 4.0 represent better business results for industrialists, because their implementation helps to achieve the objectives of economic, environmental, and social sustainability [46]. Thus, continuous improvement requires a union of efforts to have a qualified staff that allows guiding the company towards a competitive future, and in this way, generating innovations, improving products, production methods, and productive process [47].
3. Hypothesis
After the analysis carried out in the literature review, the following hypotheses are presented for the present research work:
Hypothesis 1 (H1).
The new technologies of Industry 4.0 positively impact business results.
Hypothesis 2 (H2).
The new technologies of Industry 4.0 promote continuous improvement.
Hypothesis 3 (H3).
Continuous improvement leads to higher business results.
The proposed hypothesis model is presented in Figure 2.
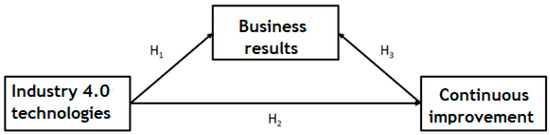
Figure 2.
Hypothesis model.
4. Materials and Methods
After having investigated in the Literature review section the concepts that the different authors exposed about the disruptive technologies of Industry 4.0, and having identified their origin and main advantages, the methodology used to analyze the results obtained in the research work is detailed below.
Next, the population, sample, the process of collecting the information, and the statistical analyses for its contrast are described.
4.1. Population under Study
Taking into account that, regardless of seniority, economic sector and size of the company, defining the size of the company as its number of employees, 109 professionals from different areas were chosen. The main condition was that their daily work involved intervention in logistics management, having also knowledge of the different disruptive technologies that are being implemented in the processes of their companies.
The target population was 250 professionals from 80 companies in Latin America and Europe. The fundamental condition to be able to fill out the questionnaire was that their daily work had to intervene in the logistics chain of the company, therefore, they had access to information, software, financial resources of the area and in general, to knowledge of the Industry 4.0 technologies implemented in the logistics processes.
A sample of 109 professionals who met the required characteristics, successfully completed the questionnaire, resulting in a response rate of 43.6%.
When distributing the survey, no special economic activity was required, since all companies are obliged to carry out logistics management, regardless of their corporate purpose. The professionals contacted, for the most part, belong to companies in the mining, industrial, commercial, and other sectors not included in the main options. Those who work in sectors not included said that they work in the technology sector. This information can be observed in Table 5. Economic sectors in which professionals work. It was also evidenced that these professionals mostly work in medium-sized companies, followed by small companies and finally, large companies with more than 250 employees. This is observed in Table 6. Number of employees of the company in which the surveyed professional works. Regarding the age of the company in the market, the predominant frequency was more than 10 years, followed by the range of between five and 10 years and finally, less than five years. This information is represented in Table 7: Age of the company in the market.
Table 5.
Economic sectors in which the surveyed professionals work.
Table 6.
Number of employees of the company in which the surveyed professional works.
Table 7.
Age of the company in the market.
4.2. Collection of Information
4.2.1. Data Collection Process
The data collection process was carried out through a structured form in the Google Forms tool, the distribution was made through social networks and email. This tool has important advantages such as: a very simple and intuitive interface, easy administration and easy completion, easy preview, automatic evaluation function and response summary, in addition to not involving an economic cost for the research [48].
4.2.2. Description of the Questionnaire
To structure the questionnaire, a review of studies by other researchers was carried out. For example, in a study carried out by Pacheco Cárdenas [49], the different best-known technologies of Industry 4.0 were researched. The following questions were taken from a study carried out by the Catholic University of Colombia for the manufacturing sector of Bogotá. However, they have been adapted them for this work:
- Which of the Industry 4.0 technologies do you know about? Cloud Computing Big data, Internet of things (IoT), 3D Printing, Artificial Intelligence, Augmented Reality, and Cybersecurity.
- Explain what factors you took into account for the implementation of Industry 4.0.
- Have you implemented Industry 4.0 technologies in your organization?
To determine the reason for investing in Industry 4.0 technologies, the ANDI Digital Transformation Survey 2017 was reviewed. In this, it was possible to identify the proposal of different reasons, among which were to gain a brand, to gain online presence, to achieve disruption in its own industry or other industries, to generate new income, to reduce costs and to automate processes [50]. In a study carried out by Cano Olivos and Orue Carrasco [51], the logistics models for small and medium-sized companies in Mexico were studied. In this research, there were scales in rating surveys from 1 to 5, where 1 was the lowest rating. This led to the structuring of several questions for the questionnaire, among these:
- Rate from 1 to 5, with 1 being the worst rating and 5 the best rating, the efficiency of logistics management with the current technologies that your company has.
- Rate from 1 to 5, with 1 being “Not at all important” and 5 “Very important”, the level of importance that your company gives to Information Technology (IT) as a facilitating tool in the development of your organization’s strategy.
- On a scale of 1 to 5, where 1 indicates “Totally disagree” and 5 “Totally agree”, check whether your company assigns improvement teams to processes.
- On a scale of 1 to 5, where 1 indicates “Totally disagree” and 5 “Totally agree”, mark if your company controls the processes through a system of indicators.
- On a scale of 1 to 5, where 1 indicates “Totally disagree” and 5 “Totally agree”, mark if your company works on continuous improvement of processes.
- On a scale of 1 to 5, where 1 indicates “Totally disagree” and 5 “Totally agree”, indicate whether your company periodically conducts opinion surveys to staff to evaluate their level of satisfaction in aspects such as: work environment, open atmosphere and communication, participation schemes, training, salary, recognition or professional perspectives.
- On a scale of 1 to 5, where 1 indicates “Totally disagree” and 5 “Totally agree”, indicate if your company makes alliances with other organizations, which help to improve logistics management, derived from external relations.
- On a scale of 1 to 5, where 1 indicates “Totally disagree” and 5 “Totally agree”, indicate whether your company at the time of organizing logistics processes takes into account the needs, expectations, requirements, and customer satisfaction.
- On a scale of 1 to 5, where 1 indicates “Totally disagree” and 5 “Totally agree”, indicate whether your company controls the degree of application of the established logistics procedures.
- On a scale of 1 to 5, where 1 indicates “Totally disagree” and 5 “Totally agree”, indicate whether your company has a method to assess the degree of effectiveness of activities.
Finally, in the study carried out by Bravo Alay and Martillo Fernández [52], the importance of implementing the enabling technologies of Industry 4.0 was investigated. In this study, scales of the level of importance were used, defined as very important, moderately, neutral, little importance, and not immediately important. With this scale, a question was structured for the surveyed professionals to indicate the level of importance of different aspects in their companies and, thus, collect information on business results. The question was, rate with an X each of the following Industry 4.0 technologies, according to the level of importance for the logistics management of your company where 1 indicates “not important” and 5 “very important”.
The first part of the survey contains what is related to general information about the company. In this part, an attempt was made to identify the size of the company, the age, and the economic activity. In the second part of the survey, a focus was given to the different knowledge in disruptive technologies of Industry 4.0 that the 109 professionals surveyed had. There, the possibility of choosing among 10 disruptive technologies was given to determine the level of knowledge of the participants about each one of them. They were asked about the implementation of one or more of these in their companies; the main motivation for having carried out said implementation and the three areas of the company where the use of some of the disruptive technologies is most evident.
The final part of the survey focused on obtaining information on the contribution that disruptive technologies have made in logistics management, if these technologies contribute to the formulation of the organization’s strategy, if resources are defined to develop different projects, if the company takes into account its employees. In terms of job satisfaction, if the company considers customer satisfaction to improve processes and finally if the company measures the results and establishes actions to improve them. All these data collected allow to obtain an overview of the level of use of the different disruptive technologies in companies and to be able to conclude on the aspects in which the different professionals surveyed should focus their efforts on companies to obtain greater business results.
4.3. Statistical Analysis
With the data obtained in MS Excel, through the Google Forms with information from 109 professionals, from the mining, industrial, energy, construction, transport, communications, commercial, tourism, education, financial, solidarity, healthcare, cultural, and other sectors not defined, but mostly from the technology sector, the responses were tabulated in the IBM SPSS software. These professionals are located in Spain and Latin America. The Spanish were 28, representing 25.69%, and the Latin Americans were 81 professionals, representing 74.31%. For this study, 240 surveys were sent, of which 109 were completed, for a response rate of 45.42%. The IBM SPSS software facilitates the download of collected information, because it is purely statistical. Subsequently, frequency tables and bar graphs were made for analysis and discussion that, at the end of the research work, were contrasted with the two hypotheses stated. For this, the SmartPLS software that is “a free and easy-to-use modelling package used for partial least squares analysis” [53] (p. 35) was used. Finally, this analysis serves as input to compile the main conclusions of the research work.
The sample was defined according to the non-probability sampling technique. By means of this technique, “the selection of the study subjects will depend on certain characteristics, criteria, etc. that the researcher considers at a time” [54] (p. 228). The subtype of the technique is by convenience. This technique “allows us to select those accessible cases that agree to be included. This, based on the convenient accessibility and proximity of the subjects for the researcher” [54] (p. 230).
5. Results
For this study, 109 surveys of professionals from different areas have been analyzed, their work in companies directly intervenes in logistics management. As mentioned, the results of the surveys were coded and managed through the IBM SPSS program. This is a module program, which allows working through different statistical type menus, and it is supported in a graphical environment to solve problems and process data [55]. The tables of all the answers collected to the questions of the questionnaire and their graphic representation are presented below.
Most of the professionals surveyed belong to companies that have between 50 and 250 employees, which represents 51.4% of the responses obtained, while 27.5% belong to companies with fewer than 50 employees and 21.1% to companies with more than 250 employees. This tells us that 78.9% of the people surveyed, who add up to 86 people, work in micro, small, and medium enterprises.
The survey data have shown that 18.3% of the surveyed professionals work in mining companies and another 18.3% in industrial companies, and 12.8% have chosen among the options that they work in “Other sectors”. It was possible to identify, among them, the one related to technology, in the majority. Furthermore, 9.2% work in the commercial sector, 6.4% in the energy sector, as well as in the education sector. For their part, 5.5% work in the financial sector, the same percentage as in the transport sector. The remaining 17.6% work in smaller proportions, in different sectors such as: agriculture, construction, tourism, solidarity, healthcare, and culture.
Moreover, 52.3% of the professionals who work in companies with more than 10 years of antiquity in the market, while 33.9% of those surveyed in companies between five and 10 years of antiquity and the remaining 13.8% in companies less than five years old. This is important, since most of the respondents work in companies with more than five years of experience, with which their consolidation is greater, and it is likely that they are implementing or thinking of implementing Industry 4.0 tools in their logistics functions.
The questionnaire contains 13 questions, of which 10 have been structured on a Likert scale from 1 to 5, where 1 means the worst rating and 5 is the highest rating and a neutral criterion is rated 3. The other three questions are closed, where the professionals surveyed choose among some specific options the answer that according to their knowledge is more adapted to reality.
The questions in the questionnaire are listed below:
- Answer YES or NO, regarding whether the data that your company collects, due to its logistics operation, is analyzed with an Artificial Intelligence tool.
- Regardless of the Industry 4.0 technologies your company has invested in, please state the main reason you believe the investment was made.
- While organizations seem to recognize that technological innovation is necessary to gain competitive advantage, they may not yet have begun implementing disruptive technologies. Order from 1 to 3, the three areas in which you think the investment is most evident.
- Rate from 1 to 5, with 1 being the worst rating and 5 the best rating, the efficiency of logistics management with the current technologies that your company has.
- Rate from 1 to 5, being 1 “Not important” and 5 “Very important”, the level of importance that your company gives to Information Technology (IT) as a facilitating tool in the development of your organization’s strategy.
- On a scale of 1 to 5, where 1 indicates “Strongly disagree” and 5 “Strongly agree”, check whether your company assigns improvement teams to processes.
- On a scale of 1 to 5, where 1 indicates “Totally disagree” and 5 “Totally agree”, mark if your company controls the processes through a system of indicators.
- On a scale of 1 to 5, where 1 indicates “Totally disagree” and 5 “Totally agree”, mark if your company works on continuous improvement of processes.
- On a scale of 1 to 5, where 1 indicates “Totally disagree” and 5 “Totally agree”, indicate whether your company periodically conducts opinion surveys to staff to assess their level of satisfaction in aspects such as: work environment, work environment openness and communication, participation schemes, training, salary, recognition or professional perspectives.
- On a scale of 1 to 5, where 1 indicates “Totally disagree” and 5 “Totally agree”, indicate if your company makes alliances with other organizations that help improve logistics management, derived from external relations.
- On a scale of 1 to 5, where 1 indicates “Totally disagree” and 5 “Totally agree”, indicate whether your company at the time of organizing logistics processes takes into account the needs, expectations, requirements, and customer satisfaction.
- On a scale of 1 to 5, where 1 indicates “Totally disagree” and 5 “Totally agree”, indicate whether your company controls the degree of application of the established logistics procedures.
- On a scale of 1 to 5, where 1 indicates “Totally disagree” and 5 “Totally agree”, indicate whether your company has a method to assess the degree of effectiveness of activities.
The answers with their main statistical data are listed in Table 8.
Table 8.
Results obtained in the final questionnaire.
Regarding question 1, the results generated were that of the 109 professionals surveyed, 34 of them representing 31.2% affirm that they do use AI tools to analyze data in the company. The remaining 68.8%, equivalent to 75 professionals surveyed, indicate that they do not use tools in the company to analyze data, which shows that it is a very low percentage that takes advantage of the benefits of AI technology for decision-making.
On question 2 of the survey, the 109 professionals from different economic sectors determined the main reasons why the company has invested or would invest in AI technology. Of those surveyed, 44, representing 40.4%, affirm that the investment was made or would be made to automate processes; 18.3%, representing 20 professionals, affirm that it is to generate higher income; 16.5%, which is equivalent to 18 professionals, affirm that it is to reduce costs; and 15.6%, which is equivalent to 17 professionals, affirm that they do it or would do it to achieve disruption in their own industry. Finally, 9.2%, which is equivalent to 10 professionals surveyed, affirm that their use is for the purpose to improve customers’ knowledge of their brand.
The study carried out on the areas of the companies where disruptive technologies are most implemented, investigated in question 3, has generated the following results: of the 109 professionals surveyed, 45 of them, representing 41.3%, affirm that the area where most disruptive technologies are implemented is in computing; 14 professionals, representing 12.8%, affirm that it is in the logistics area; 11 professionals, representing 10.1%, affirm that it is in the engineering area; 9 professionals, representing 8.3%, state that it is in the area of finance and accounting; 8 professionals, representing 7.3%, affirm that it is in the production area; and that same amount and percentage affirm that it is in the area of strategic direction. Finally, the remaining 14 professionals, representing 12.95%, affirm that the implementation is made in the other areas, including marketing and sales, human talent, quality management, and communications.
Question 4 was established to carry out the investigation of the perception of efficiency that the implementation of technological tools in logistics management has had. From this, it has been obtained that, of the 109 professionals surveyed, 38.5%, which is equivalent to 42 professionals, affirm that logistics management is very good with current technological tools; 27.5%, which is equivalent to 30 professionals, affirm that it is regular; 25.7%, which is equivalent to 28 professionals, affirm that it is good; and 5.5%, that represent six professionals, affirm that it is bad. Finally, 2.8%, equivalent to three professionals, say that the perception is very bad.
Question 5 was formulated to inquire about the importance of implementing ICTs as a tool to establish the company’s strategy. On this question, of the 109 professionals surveyed, the responses of 50 of them, representing 45.9%, affirm that they fully agree that their companies give importance to implementing ICTs to develop their strategy; 45 professionals, representing 41.3%, affirm that it is important to implement ICTs; 11 professionals, representing 10.1%, affirm that it is moderately important; and two professionals, representing 1.8%, affirm that it is not very important to implement ICTs. Finally, one professional, who represents 0.9%, affirms that it is not important to implement ICTs to establish the company’s strategy.
In the inquiry into the opinion of professionals to determine whether or not they agree with the allocation of resources to improve processes in companies, found in question 6, it has shown that, of the 109 professionals surveyed, 48 of them, that represents 44%, affirm that they totally agree that the company allocates resources to improve processes; 41 professionals, representing 37.6%, affirm that they agree; 14 professionals, representing 12.8%, state that they neither agree nor disagree; and six professionals, representing 5.6%, state that they disagree and totally disagree.
The research on the use of indicators to control processes, associated with question 7, has shown that, of the 109 professionals surveyed, 53 of them, representing 48.6%, affirm that they fully agree that the company uses a system of indicators to control processes; 36 professionals, representing 33%, say they agree; 14 professionals, representing 12.8%, state that they neither agree nor disagree; and four professionals, representing 3.7%, claim to disagree. Finally, two professionals, representing 1.8%, affirm that they totally disagree.
Question 8 generated results on the implementation of actions for the continuous improvement of processes in companies. On this question, of the 109 professionals surveyed, the responses of 48 of them, representing 44%, have been that they fully agree that their companies work on the continuous improvement of processes; 43 professionals, representing 39.4%, affirm that they agree; 13 professionals, representing 11.9%, state that they neither agree nor disagree. Finally, five professionals, representing 4.6%, claim to disagree that the company works on continuous process improvement.
The conduct of opinion surveys in the company to determine the level of employee satisfaction was investigated in question 9. The results showed that of the 109 professionals surveyed from different economic sectors, 47 of them, representing 43.1 % affirm that they fully agree that their companies carry out opinion surveys to evaluate the level of satisfaction of their employees; 26 professionals, representing 23.9%, affirm that they agree; 18 professionals, representing 16.5%, state that they neither agree nor disagree; 11 professionals, representing 10.1%, claim to disagree. Finally, seven professionals, representing 6.4%, state that they totally disagree.
The investigation of the establishment of external alliances in the company to improve logistics management, developed in question 10, has generated the following results: of the 109 professionals surveyed, 41 of them, representing 37.6%, affirm that they are fully agree that their companies make alliances with other companies, in order to improve logistics management; 38 professionals, representing 34.9%, affirm that they agree; 17 professionals, representing 15.6%, state that they neither agree nor disagree; nine professionals, representing 8.3%, claim to disagree. Finally, four professionals, representing 3.7%, state that they totally disagree.
Question 11 was structured to investigate the evaluation of customer satisfaction in the company. This has generated that of the 109 professionals surveyed, 53 of them, representing 48.6%, affirm that they fully agree that their companies evaluate customer satisfaction, in order to organize logistics processes; 38 professionals, representing 34.9%, affirm that they agree; 12 professionals, representing 11%, state that they neither agree nor disagree; and three professionals, representing 2.8%, claim to disagree. Finally, three professionals, representing 2.8%, affirm that they totally disagree.
Question 12 was asked to investigate the degree of application of established logistics procedures. The results generated showed that of the 109 professionals surveyed, 44 of them, representing 40.4%, affirm that they agree that the degree of application of established logistics procedures is controlled in their companies; 41 professionals, representing 37.6%, affirm that they fully agree; 19 professionals, representing 17.4%, state that they neither agree nor disagree; and three professionals, representing 2.8%, state that they disagree. Finally, two professionals, representing 1.8%, state that they totally disagree.
Finally, the investigation of 109 professionals on the degree of effectiveness of logistics activities, formulated in question 13, has shown that, of the 109 professionals surveyed, 44 of them, representing 40.4%, affirm that they completely agree with the fact that their companies control the degree of efficiency of logistics activities; 39 professionals, representing 35.8%, affirm that they agree; 14 professionals, representing 12.8%, state that they neither agree nor disagree; and 10 professionals, representing 9.2%, claim to disagree. Finally, two professionals, representing 1.8%, state that they totally disagree.
The hypotheses are contrasted, through the use of the SmartPLS software. The following model (Figure 3) represents the results.
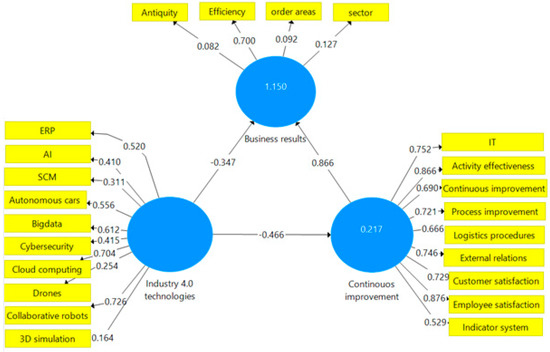
Figure 3.
Graphic representation of the hypothesis validation model.
As it can be observed in Table 9, the t statistic for the relationship between continuous improvement and business results is 7.602, that is, it is far from 0. The p value is 0.000, which is less than 0.05. These results indicate that there is a high significance for the established hypothesis. That is to say that it does generate the effect that is sought to be demonstrated (Molina Arias, 2017). Likewise, the t statistic for the relationship between Industry 4.0 technologies and continuous improvement is 2.772, it is also far from 0. The p value is 0.006, that is, it is less than 0.05, which indicates that it has high significance. For the relationship between Industry 4.0 technologies and business results, the t statistic is 6.013, it is far from 0, and its p value is 0.000, which means that it is less than 0.05. This indicates that it has high significance.
Table 9.
SmartPLS Bootsrapping.
“Regarding the values to consider a Path coefficient acceptable, authors such as Chin, (1998) suggest that it should be = or> 0.2 or even> 0.3” [56] (p. 18). This indicates that the relationships obtained between business results and continuous improvement present a significant relationship. On the other hand, the relationship between Industry 4.0 technologies and business results does not present a significant relationship, as does the relationship between Industry 4.0 technologies and continuous improvement. All this can be seen in Table 10.
Table 10.
Path coefficients.
Table 11 shows Cronbach’s alpha, that indicates the correlation between the items included in a scale. According to Oviedo and Campo-Arias [57], Cronbach’s alpha values between 0.70 and 0.90 suggest good internal consistency. This indicates that the Cronbach’s alpha of business results have low internal consistency, while the Cronbach’s alpha of continuous improvement and Industry 4.0 technologies have high internal consistency of the scales. “The interpretation of Spearman’s rho coefficient agrees with values close to 1; indicate a strong and positive correlation. Values close to –1 indicate a strong and negative correlation. Values close to zero indicate that there is no linear correlation” [58]. The Spearman rho of the business results is close to 0, therefore, it indicates that there is no correlation. On the other hand, Spearman’s rho for continuous improvement and Industry 4.0 technologies is close to 1, indicating a strong positive correlation. Composite reliability greater than 0.60 is acceptable, while greater than 0.70 is ideal [59], which indicates that the composite reliability of business results is not acceptable and that of continuous improvement and Industry 4.0 technologies are ideal. Finally, the mean extracted variance (AVE) is recommended to be greater than 0.5 so that the indicators of the latent variable are more representative [60]. Indicators of business performance and Industry 4.0 technologies turn out to be less representative. On the other hand, the indicators of continuous improvement have shown that they are more representative.
Table 11.
Construct reliability and validity.
6. Discussion
Regarding our first aim, it was confirmed that the new technologies of Industry 4.0 positively impact business results. This statement may be the most obvious of the hypotheses proposed, but it was necessary to measure this first assertion by the same procedure as the rest of the hypotheses, thus, strengthening its validity and reinforcing the current literature on the subject, such as the results presented by Torrent-Sellens [42] where it is stated that companies that use 4.0 technologies manage to improve their business results, or the studies by Blanco et al. [43] that describe how the use of these technologies reduces production schedules, improves the flexibility of the company and the customization of products, which translates into improved results.
Concerning the second aim, the proposed hypothesis is accepted, demonstrating that the new technologies of Industry 4.0 promote continuous improvement. This hypothesis is the basis of the research presented, directly relating the concepts of Industry 4.0 and continuous improvement. The validity of this hypothesis, which has been demonstrated in the results section, reveals that the efforts made by companies in the incorporation of technologies related to Industry 4.0 are directly transferred to an improvement in the quality of the companies’ processes, both in the processes that provide direct value to the products and to the rest of the processes. Therefore, the use of these technologies is not reflected as a punctual and specific modification of part of its processes, rather, it implies the continuous improvement of the set of processes. This reaffirms what is extracted from the bibliography [42] where it is indicated that 4.0 technologies increase the quality of processes, as well as productivity and monitoring and control.
The combined effect of technology 4.0 and continuous improvement appears to achieve better results in organizations. Mesa and Carreño [8], Torrent-Sellens [42] and Blanco et al. [43], among others, suggested in their studies that that the implementation of 4.0 technologies causes typical effects of continuous improvement, such as improving the quality of processes, and that all this translates into improved results. Our study is a proof of the relationship between 4.0 technologies, continuous improvement, and business results. All these points allow researchers to continue deepening the direct relationships between Industry 4.0 and continuous improvement, allowing the formulation of new hypotheses based on the hypotheses validated in this work.
Regarding managers, it can be concluded that the efforts made in the implementation of 4.0 technologies and in continuous improvement translate into a direct increase in business results. In addition, 4.0 technologies should not be seen only as a modification of a specific process; these technologies have a positive impact on the set of processes through continuous improvement, which increases organizational results.
7. Conclusions
This study analyzes the relationships between the technologies of Industry 4.0, continuous improvement, and the business results. As has been verified in the discussion of the results obtained, the initial hypotheses of this research are verified favorably, that is:
- The new technologies of Industry 4.0 positively impact business results.
- The new technologies of Industry 4.0 promote continuous improvement.
- Continuous improvement leads to higher business results.
The accomplishment of these hypotheses transfers to the companies the advantages on the results of implementing the technologies available in the new industrial revolution, being these technologies an enhancer of the continuous improvement of the organizations, which again increases the results of the companies. With all this, it can be affirmed that the efforts made by the companies in the acquisition and implementation of 4.0 technologies are transferred to a continuous improvement of their processes and finally to an increase in the results of the business lines.
Nevertheless, the cross-sectional design of this research is a disadvantage. Even though the structural equations method was employed, interpretation of the causality between the different constructs should be accepted with caution. In order to examine the causality of these relationships, future research should use longitudinal studies. Second, although this study uses a broad measure for organizational performance, the measure is subjective and could be complemented with objective and financial data.
For future research, we also identify three approaches that could enrich the study of the analyzed relationships. First, we suggest that it would be helpful to examine which HRM practices are clearly linked to Industry 4.0 and their impact on organizational results. Second, our model analyzes relationships among Industry 4.0, continuous improvement, and business results. One of the main factors that are omitted from the model is environmental management. In consequence, we suggest that future research should analyze how environmental management could be enhanced to foster the relationships in the model.
Finally, future research should study in depth the functioning of Industry 4.0 in relation to total quality models, since they include continuous improvement techniques.
Author Contributions
V.H.A.-M. and L.P.-G. are the originators of the initial idea for the work. L.P.-G. developed the proposed models and methodology, V.H.A.-M. carried out the queries and made the computations in SmartPLS. C.M.-R. analysed the results and presented the discussions and conclusions. M.D. provided the state of the art and supervised the research work. All authors analysed the data, preformed the formal analysis, and participated in the writing and revising of the manuscript. All authors have read and agreed to the published version of the manuscript.
Funding
This work was supported by the Escuela Técnica Superior de Ingenieros Industriales of the Universidad Nacional de Educación a Distancia (UNED) under Contract 2021-ICF05.
Institutional Review Board Statement
Not applicable.
Informed Consent Statement
Not applicable.
Data Availability Statement
Data sharing not applicable.
Conflicts of Interest
The authors declare no conflict of interest.
References
- Porter, M.E. Competitive Advantage: Creating and Sustaining Superior Performance; Rei Argentina S.A: Buenos Aires, Argentina, 1991. [Google Scholar]
- del Val Román, J.L. Industry 4.0: The Digital Transformation of Industry; Conference of Directors and Deans of Computer Engineering; Faculty of Engineering of the University of Deusto: Bilbao, Spain, 2016; Available online: http://coddii.org/wp-content/uploads/2016/10/Informe-CODDII-Industria-4.0.pdf (accessed on 15 June 2021).
- González, L.G.; Díaz, C.A.C.; Gómez, N.L.G. ERP’s (Business Resource Planning) in Large and Medium-Sized Companies Allow a Competitive Advantage. 2017, pp. 1035–1054. Available online: https://www.riico.net/index.php/riico/article/view/1489/1149 (accessed on 20 July 2021).
- Quispe-Otocama, A.M.; Padilla-Martínez, M.P.; Telot-González, J.A.; Nogueira-Rivera, D. Information and communication technologies in business management of pymes commercial. Ing. Ind. 2017, 38, 81–92. [Google Scholar]
- Riascos-Erazo, S.C.; Arias-Cardona, V.H. Analysis of organizational impact on the process of implementation of ERP Information Systems-Case Study. Entramado 2016, 12, 284–302. [Google Scholar] [CrossRef]
- MBedón, I.C.; Piedrahita, L.O.C. Resource planning systems of public companies. Pro-Sci. Rev. De Prod. Cienc. E Investig. 2019, 3, 21–28. [Google Scholar]
- Silva, J.D. Supply chain management: A review from logistics and the environment. Entre Cienc. E Ing. 2017, 11, 51–59. [Google Scholar]
- Mesa, J.I.; Carreño, D.A. Methodology to apply Lean in supply chain management. Espacios 2020, 41, 30. [Google Scholar]
- Bowersox, D.J.; Closs, D.J.; Cooper, M.B. Supply Chain Logistics Management; McGraw-Hill: México, Mexico, 2002; Available online: https://books.google.com.ni/books?id=9Gu1AAAAIAAJ (accessed on 15 June 2021).
- Ohno, T. Toyota Production System: Beyond Large-Scale Production, 1st ed.; Productivity Press: Barcelona, Spain, 1991. [Google Scholar]
- Schwartz, M. Synchronizing SCM with smart inventories. Logística 360 2018, 1, 50–52. [Google Scholar]
- di Nardo, M.; Clericuzio, M.; Murino, T.; Sepe, C. An Economic Order Quantity Stochastic Dynamic Optimization Model in a Logistic 4.0 Environment. Sustainability 2020, 12, 4075. [Google Scholar] [CrossRef]
- García, L.A.M. Integral Logistics Management. Best Practices in the Supply Chain, 2nd ed.; Ecoe Ediciones: Bogotá, Colombia, 2016. [Google Scholar]
- Basco, A.I.; Beliz, G.; Coatz, D.; Garnero, P. Industry 4.0. Manufacturing the Future; Argentine Industrial Union, Inter-American Development Bank and Institute for the Integration of Latin America and the Caribbean: Buenos Aires, Argentina, 2018. [Google Scholar]
- Rouhiainen, L. Artificial Intelligence: 101 Things You Should Know about Our Future Today; Alienta Editorial: Barcelona, Spain, 2018. [Google Scholar]
- Waltersmann, L.; Kiemel, S.; Stuhlsatz, J.; Sauer, A.; Miehe, R. Artificial Intelligence Applications for Increasing Resource Efficiency in Manufacturing Companies—A Comprehensive Review. Sustainability 2021, 13, 6689. [Google Scholar] [CrossRef]
- Brossi, L.; Dodds, T.; Passeron, E. Artificial Intelligence and Youth Welfare in Latin America; LOM Ediciones: Santiago de Chile, Chile, 2019. [Google Scholar]
- Porcelli, A.M. Artificial intelligence and robotics: Its social, ethical and legal dilemmas. Derecho Glob. Estud. Sobre Derecho Justicia 2020, 6, 49–105. [Google Scholar] [CrossRef]
- Qasem, Y.A.M.; Abdullah, R.; Jusoh, Y.Y.; Atan, R.; Asadi, S. Analyzing Continuance of Cloud Computing in Higher Education Institutions: Should We Stay, or Should We Go? Sustainability 2021, 13, 4664. [Google Scholar] [CrossRef]
- Di Nardo, M. Developing a Conceptual Framework Model of Industry 4.0 for Industrial Management. Ind. Eng. Manag. Syst. 2020, 19, 551–560. [Google Scholar] [CrossRef]
- Osorio Montoya, J.A. Risk Management and Security in Cloud Computing for SMEs; Pilot University of Colombia: Bogotá, Colombia, 2018; pp. 1–11. [Google Scholar]
- Rodríguez, G.S. Cloud computing: Some technical-legal considerations. Rev. Lex 2019, 17, 147–168. [Google Scholar]
- Casado Robledo, M.J. Protecting information has been a constant throughout history. Rev. Española de Control Externo 2020, 22, 88–101. [Google Scholar]
- Caamaño Fernández, E.E.; de J. Herrera Gil, R. Cybersecurity Risk Prevention from the Forensic Audit: Combining Organizational Human Talent; NOVUM, Revista de Ciencias Sociales Aplicadas, National University of Colombia: Manizales, Colombia, 2020; Volume 1, pp. 61–80. [Google Scholar]
- Anitua Galdón, M.G. Autonomous Car Strategies of Automotive Companies and New Players; Comillas Pontifical University: Madrid, Spain, 2019; Available online: https://repositorio.comillas.edu/xmlui/bitstream/handle/11531/27730/TFG-%20Anitua%20GaldoIn%2C%20MariIa%20Gabriela.pdf?sequence=1&isAllowed=y (accessed on 30 May 2021).
- Ramírez, L.A. Autonomous Vehicles; Faculty of Sciences and Technologies, Electronics and Informatics Department, Catholic University “Nuestra Señora de la Asunción: Asunción, Paraguay, 2016; pp. 1–19. [Google Scholar]
- Li, Y.; Díaz, M.; Morantes, S.; Dorati, Y. Autonomous vehicles: Innovation in urban logistics. Rev. RIC 2018, 4, 31–39. [Google Scholar]
- Oppenheimer, A. Every Man for Himself, 1st ed.; Debate: Barcelona, Spain, 2018. [Google Scholar]
- Harari, Y.N. 21 Lessons for the 21st Century; Debate: Barcelona, Spain, 2018. [Google Scholar]
- Addati, G.A.; Pérez Lance, G. Introduction to UAVs, Drones or UAVs for Civil Use; University of CEMA: Buenos Aires, Argentina, 2014; Available online: https://www.econstor.eu/bitstream/10419/130802/1/799216895.pdf (accessed on 10 June 2021).
- Wilson, A. Dominate the Drones, Basic Guide to Start Earning Money with Drones, 1st ed.; Babelcube Inc.: Antioch, Tennessee, 2018. [Google Scholar]
- Guevara-Bonilla, M.; Meza-Leandro, A.S.; Esquivel-Segura, E.A.; Arias-Aguilar, D.; Tapia-Arenas, A.; Masís-Meléndez, F. Use of unmanned aerial vehicles (UAVs) for the monitoring and management on natural resources: A synthesis. Rev. Tecnol. En Marcha 2020, 33, 77–88. [Google Scholar]
- Ojeda Bustamante, W.; Flores Velázquez, J.; Ontiveros Capurata, R.E. Use and Handling of Drones with Applications to the Water Sector, 1st ed.; Mexican Institute of Water Technology: Ciudad de México, Mexico, 2016; Available online: https://www.imta.gob.mx/biblioteca/libros_html/riego-drenaje/uso-y-manejo-de-drones.pdf (accessed on 23 June 2021).
- Joyanes Aguilar, L. Big Data: Analysis of Large Volumes of Data in Organizations, 1st ed.; Alfaomega Grupo Editor S.A: Ciudad de México, Mexico, 2013. [Google Scholar]
- Parada Torralba, P. How Big Data has revolutionized logistics. Big Data 2020. Available online: https://www.iebschool.com/blog/big-data-en-logistica-big-data/ (accessed on 15 May 2021).
- Pape, J.P. Collaborative robots a new era in industrial automation. Pharmatech 2014, 1, 32–33. [Google Scholar]
- Gualtieri, L.; Palomba, I.; Merati, F.A.; Rauch, E.; Vidoni, R. Design of Human-Centered Collaborative Assembly Workstations for the Improvement of Operators’ Physical Ergonomics and Production Efficiency: A Case Study. Sustainability 2020, 12, 3606. [Google Scholar] [CrossRef]
- Continuous Training Course.Collaborative Robotics Application, Mexico D.F, México. 2017. Available online: https://i-ctec.org/wp-content/uploads/2017/02/Tema2_Conociendo-la-Robo%CC%81tica-Colaborativa-1.pdf (accessed on 18 May 2021).
- Del C. Casal Angulo, M. Simulation as a Methodology for Learning Non-Technical Skills in Nursing; Nursing PhD Program; University of Valencia: Valencia, Spain, 2016; Available online: https://core.ac.uk/download/pdf/71059825.pdf (accessed on 8 June 2021).
- Núñez Ricardo, F.J. Using Virtual Reality Simulators in Basic Science Teaching; Faculty of Education and Humanities, Militar University of Nueva Granada: Bogotá, Colombia, 2017; Available online: https://repository.unimilitar.edu.co/bitstream/handle/10654/17077/NuñezRicardoFedericoJavier2017.pdf?sequence=1&isAllowed=y (accessed on 18 July 2021).
- Cantú-González, J.R.; del C. Guardado García, M.; Herrera Balderas, J.L. Process simulation, a perspective in pro to the operational performance. Rev. Iberoam. De Prod. Académica y Gestión Educ. 2016, 3, 1–21. [Google Scholar]
- Torrent-Sellens, J. Industry 4.0 and business results in Spain. Oikonomics 2019, 1, 1–11. [Google Scholar]
- Blanco, R.; Fontodrona, J.; Poveda, C. Industry 4.0: The state of the art. Rev. Econ. Ind. 2017, 1, 151–164. [Google Scholar]
- Ballestero, F.; González Aranda, J.M. The use of disruptive ICTs for improving environmental sustainability and competitiveness. The opportunity represented by LifeWatch ERIC. Sostenibilidad Para La Compet. 2020, 1, 135–146. [Google Scholar]
- Lodgaard, E.; Ingvaldsen, J.A.; Aschehoug, S.; Gamme, I. Barriers to continuous improvement: Perceptions of top managers, middle managers and workers. Procedia CIRP 2016, 41, 1119–1124. [Google Scholar] [CrossRef][Green Version]
- Ghobakhloo, M. Industry 4.0, digitization, and opportunities for sustainability. J. Clean. Prod. 2020, 252, 119869. [Google Scholar] [CrossRef]
- Erol, S.; Jäger, A.; Hold, P.; Ott, K.; Sihn, W. Tangible Industry 4.0: A Scenario-Based Approach to Learning for the Future of Production. Procedia CIRP 2016, 54, 13–18. [Google Scholar] [CrossRef]
- Aznar Crespo, P. Quizzes in Google Forms [Webinar]; University of Alicante: Alicante, Spain, 2021; Available online: https://web.ua.es/es/ice/documentos/formacion/webinares/cuestionarios-en-google-forms.pdf (accessed on 7 June 2021).
- Pacheco Cárdenas, A.S. Proposal for the Implementation of Industry 4.0 in the Manufacturing Sector of Bogotá; Degree Work; Catholic University of Colombia: Bogotá, Colombia, 2020; Available online: https://repository.ucatolica.edu.co/bitstream/10983/25322/1/PROPUESTA%20DE%20IMPLEMENTACI%C3%93N%20DE%20LA%20INDUSTRIAL%204.0%20EN%20EL%20SECTOR%20MANUFACTURERO%20DE%20BOGOT%C3%81.pdf (accessed on 22 June 2021).
- National Association of Businessmen of Colombia. Digital Transformation Survey 2017; ANDI: Bogotá, Colombia, 2017; Available online: http://www.andi.com.co/Uploads/Encuesta%20Transformaci%C3%B3n%20Digital%20ANDI.pdf (accessed on 29 May 2021).
- Cano Olivos, P.; Orue Carrasco, F.; Martínez Flores, J.L.; Mayett Moreno, Y.; López Nava, G. Logistics management model for small and medium-sized companies in Mexico. Contaduría y Adm. 2015, 60, 181–203. [Google Scholar]
- Bravo Alay, K.V.; Martillo Fernández, K.E. Circular Economy and Industry 4.0 as a Strategy for International Trade in Ecuador; University of Guayaquil Faculty of Administrative Sciences: Guayaquil, Ecuador, 2019; Available online: http://repositorio.ug.edu.ec/handle/redug/45780 (accessed on 18 June 2021).
- Garson, G.D. Partial Least Squares: Regression & Structural Equation Models; School of Public & International Affairs. North Carolina State University: Asheboro, NC, USA, 2016; Available online: https://www.smartpls.com/resources/ebook_on_pls-sem.pdf (accessed on 30 June 2021).
- Otzen, T.; Manterola, C. Sampling Techniques on a Population Study. Int. J. Morphol. 2017, 35, 227–232. [Google Scholar] [CrossRef]
- University of Cordoba. Data Analysis Using Computerized Procedures. Introduction to SPSS. 1st Psychopedagogy (Academic Year 2009/2010). University of Córdoba. Faculty of Education Sciences. 2010. Available online: http://www.uco.es/dptos/educacion/invadiv/images/stories/documentos/METODOS/RECURSOS/SPSS.pdf (accessed on 9 May 2021).
- Nahuat Román, B. Influence of Intellectual Capital on Innovation: An Individual-Level Perspective. Nova Sci. 2020, 12, 1–31. [Google Scholar]
- Oviedo, H.C.; Campo-Arias, A. Approach to the use of the alpha coefficient by Cronbach. Rev. Colomb. De Psiquiatr. 2005, 24, 572–580. [Google Scholar]
- Martínez Ortega, R.M.; Tuya Pendás, L.C.; Martínez Ortega, M.; Pérez Abreu, A.; Cánovas, A.M. The correlation coefficient of the Spearman ranks characterization. Rev. Habanera De Cienc. Médicas 2009, 8. Available online: http://scielo.sld.cu/scielo.php?script=sci_arttext&pid=S1729-519X2009000200017 (accessed on 9 June 2021).
- Angelo, D.L.; Neves, A.N.; Correa, M.; Sermarine, M.; Zanetti, M.C.; Brandao, M.R.F. Psychometric Properties of the Perfectionism for Sports Performance Scale (PPS-S) for the brazilian context. Cuad. De Psicol. Del Deporte 2019, 19, 1–11. [Google Scholar] [CrossRef]
- Méndez-Giménez, A.; Fernández-Río, J.; Cecchini-Estrada, J.A. Validation of the Spanish version of the Friendship Goals Questionnaire in Physical Education. Univ. Psychol. 2014, 13, 227–238. [Google Scholar]


Publisher’s Note: MDPI stays neutral with regard to jurisdictional claims in published maps and institutional affiliations. |
© 2021 by the authors. Licensee MDPI, Basel, Switzerland. This article is an open access article distributed under the terms and conditions of the Creative Commons Attribution (CC BY) license (https://creativecommons.org/licenses/by/4.0/).