1. Introduction
Adverse weather conditions significantly impact roadway conditions, vehicle performance, visibility distance, driver´s behavior, travel demand, traffic flow characteristics, and traffic safety. Visibility is fundamental for the driving task, and its reduction influences drivers´ behavior, which must be understood towards the design of appropriate mitigation strategies [
1,
2].
1.1. Visibility Reduction
Ni et al. [
3] claim fog is a climatic condition that directly impacts driver’s vision. Its presence reduces both contrast and visibility of the scene in which it is directed, hence, details, as the distance view increases. The absence or reduction of long-range visual information are dangerous, since, under normal visibility situations, drivers tend to look further ahead on the road they are traveling than at its edges [
4]. Therefore, fog increases the risk of accidents because it hides long-range visual information, hampering the prediction of the path to be taken and the anticipation of events such as pileups or vehicle decelerations ahead [
5].
Ahmed et al [
6] explored the viability of using weather information collected from airports in real-time crash-risk assessments on highways. A Bayesian logistic regression approach estimated the probability of crash occurrence, and the results showed the reduction in visibility reported by airports’ weather stations is associated with crash occurrence.
Previous studies have demonstrated that, although the percentage of accidents under fog is small compared to normal visibility conditions, they tend to be more severe and involve multiple vehicles [
7,
8,
9]. Abdel-Aty et al. [
7] concluded head-on and rear-end crashes are the two most common crash types under fog condition. In Brazil, fatal crash statistics from the federal highway patrol indicate fog contributed as a major factor to 11,753 accidents from 2011 to 2020 [
10].
Chen et al. [
11] described the influence of adverse weather on the perceived risk for drivers during car-following based on a driving simulation experiment. They used an entropy weight method and multiple linear regression to explore the effects of different weather conditions on the perceived risk level of drivers and observed such levels increase in function of fog intensity due to the reduction in visibility.
A study with a driving simulator conducted by Yan et al. [
12] confirmed drivers reducing speed under low-visibility conditions is not enough for their responding in time to impending changes in road geometries and speed of vehicles ahead, or to an emergency event. Although some drivers would keep longer headway distances, rear-end crashes may occur, since they may not be able to see the breaking lights of the front vehicle [
13].
Effects of foggy climate during driving have been widely studied; however, gaps on the understanding of driver’s visual search strategy in low visibility sections have been identified. The use of an eye-tracking system for a deep understanding of driving behavior in low visibility can guide researchers and designers towards improving road safety through more effective measures.
1.2. Eye Tracking
Visual attention, which is closely related to eye movements, refers to the way information is processed in an environment, and has been a contributing factor to traffic crashes. The recording of eye movements, considered by Velichkovsky et al. [
14] an appropriate tool for identifying drivers’ visual attention, has drawn the interest of the academic community.
Studies have evidenced the region to which the eyes are pointing is closely related to what is being coded and processed by the driver, and the duration of a look reveals the processing difficulty faced. Chapman and Underwood [
15] demonstrated drivers require longer durations in complex scenarios, thus, potentially leading to a crash.
According to Zhang et al. [
16], the eye movement behavior can be analyzed from glance measures or fixations measures supported by an eye-tracker of sufficient accuracy and precision. Fixation analyses are commonly associated with cognitive processing and applied for evaluations of mental efforts. The length of fixation duration has been found to be connected with the complexity degree of a visual scene, and shorter, but more frequent fixations may reduce processing time.
Eye tracking information is essential for the understanding of the way climatic variations in an external environment impact the driving task. Konstantopoulos et al. [
17] recorded the eye movements of driving instructors and learner drivers while they drove three virtual routes that included day, night, and rain routes in a driving simulator. The results showed rainy weather significantly affected drivers´ eye movements, and more frequent and shorter fixations indicate faster drivers’ information processing.
1.3. Use of Driving Simulators
Driving simulators are essential in different fields of study and have been widely used for investigations on the impact of individual driver´s differences, vehicle technology, driver support systems, road projects, and effectiveness of road safety interventions [
18]. They have become versatile towards achieving different objectives [
19,
20,
21], and enable analyses of several factors that influence drivers´ behaviors (e.g., emotional state [
22,
23,
24], and use of hallucinogenic substances [
25,
26,
27] and distracting devices such as cell phones [
28,
29,
30]).
According to Bella [
31], the advantages of driving simulators include better experimental control, higher efficiency, low cost, safety, and ease of data collection, i.e., they provide sustainability and safety to investigations on infrastructure design associated with drivers´ behavior under fog. Drivers can be repeatedly confronted to different circumstances, including specific climatic conditions, such as fog and heavy rain, with no risk to life and reduced costs, which is a great advantage regarding field tests [
32]. Studies with driving simulators under foggy conditions have focused mainly on kinematic aspects of the vehicle guided by the driver, analyzing variables such as average speed, speed variation, acceleration, collision time, and lane position [
33,
34,
35,
36,
37]. However, few have analyzed the influence of those climatic conditions on driver’s eye movement behavior.
This article studies the driver’s behavior under environmental conditions, specifically regarding the influence of fog. It describes a controlled experiment in a driving simulator, a strategy that offers significant benefits for research on road safety and geometric design - test arrangements are shifted to a virtual environment, thus saving time and costs, and providing safety to volunteers. The logistical effort reception of volunteers at the simulator facilities and the production of a wide variety of road scenarios associated with eye track system are significantly reduced. The fog conditions analyzed refer to a curved road segment of a highway with one of the highest worldwide daily volumes of trucks and characterized by a high fog formation. The conditions were faithfully recreated in the driving scenarios employed in the experiments, where the drivers’ visual profile was analyzed.
2. Methods
2.1. Apparatus
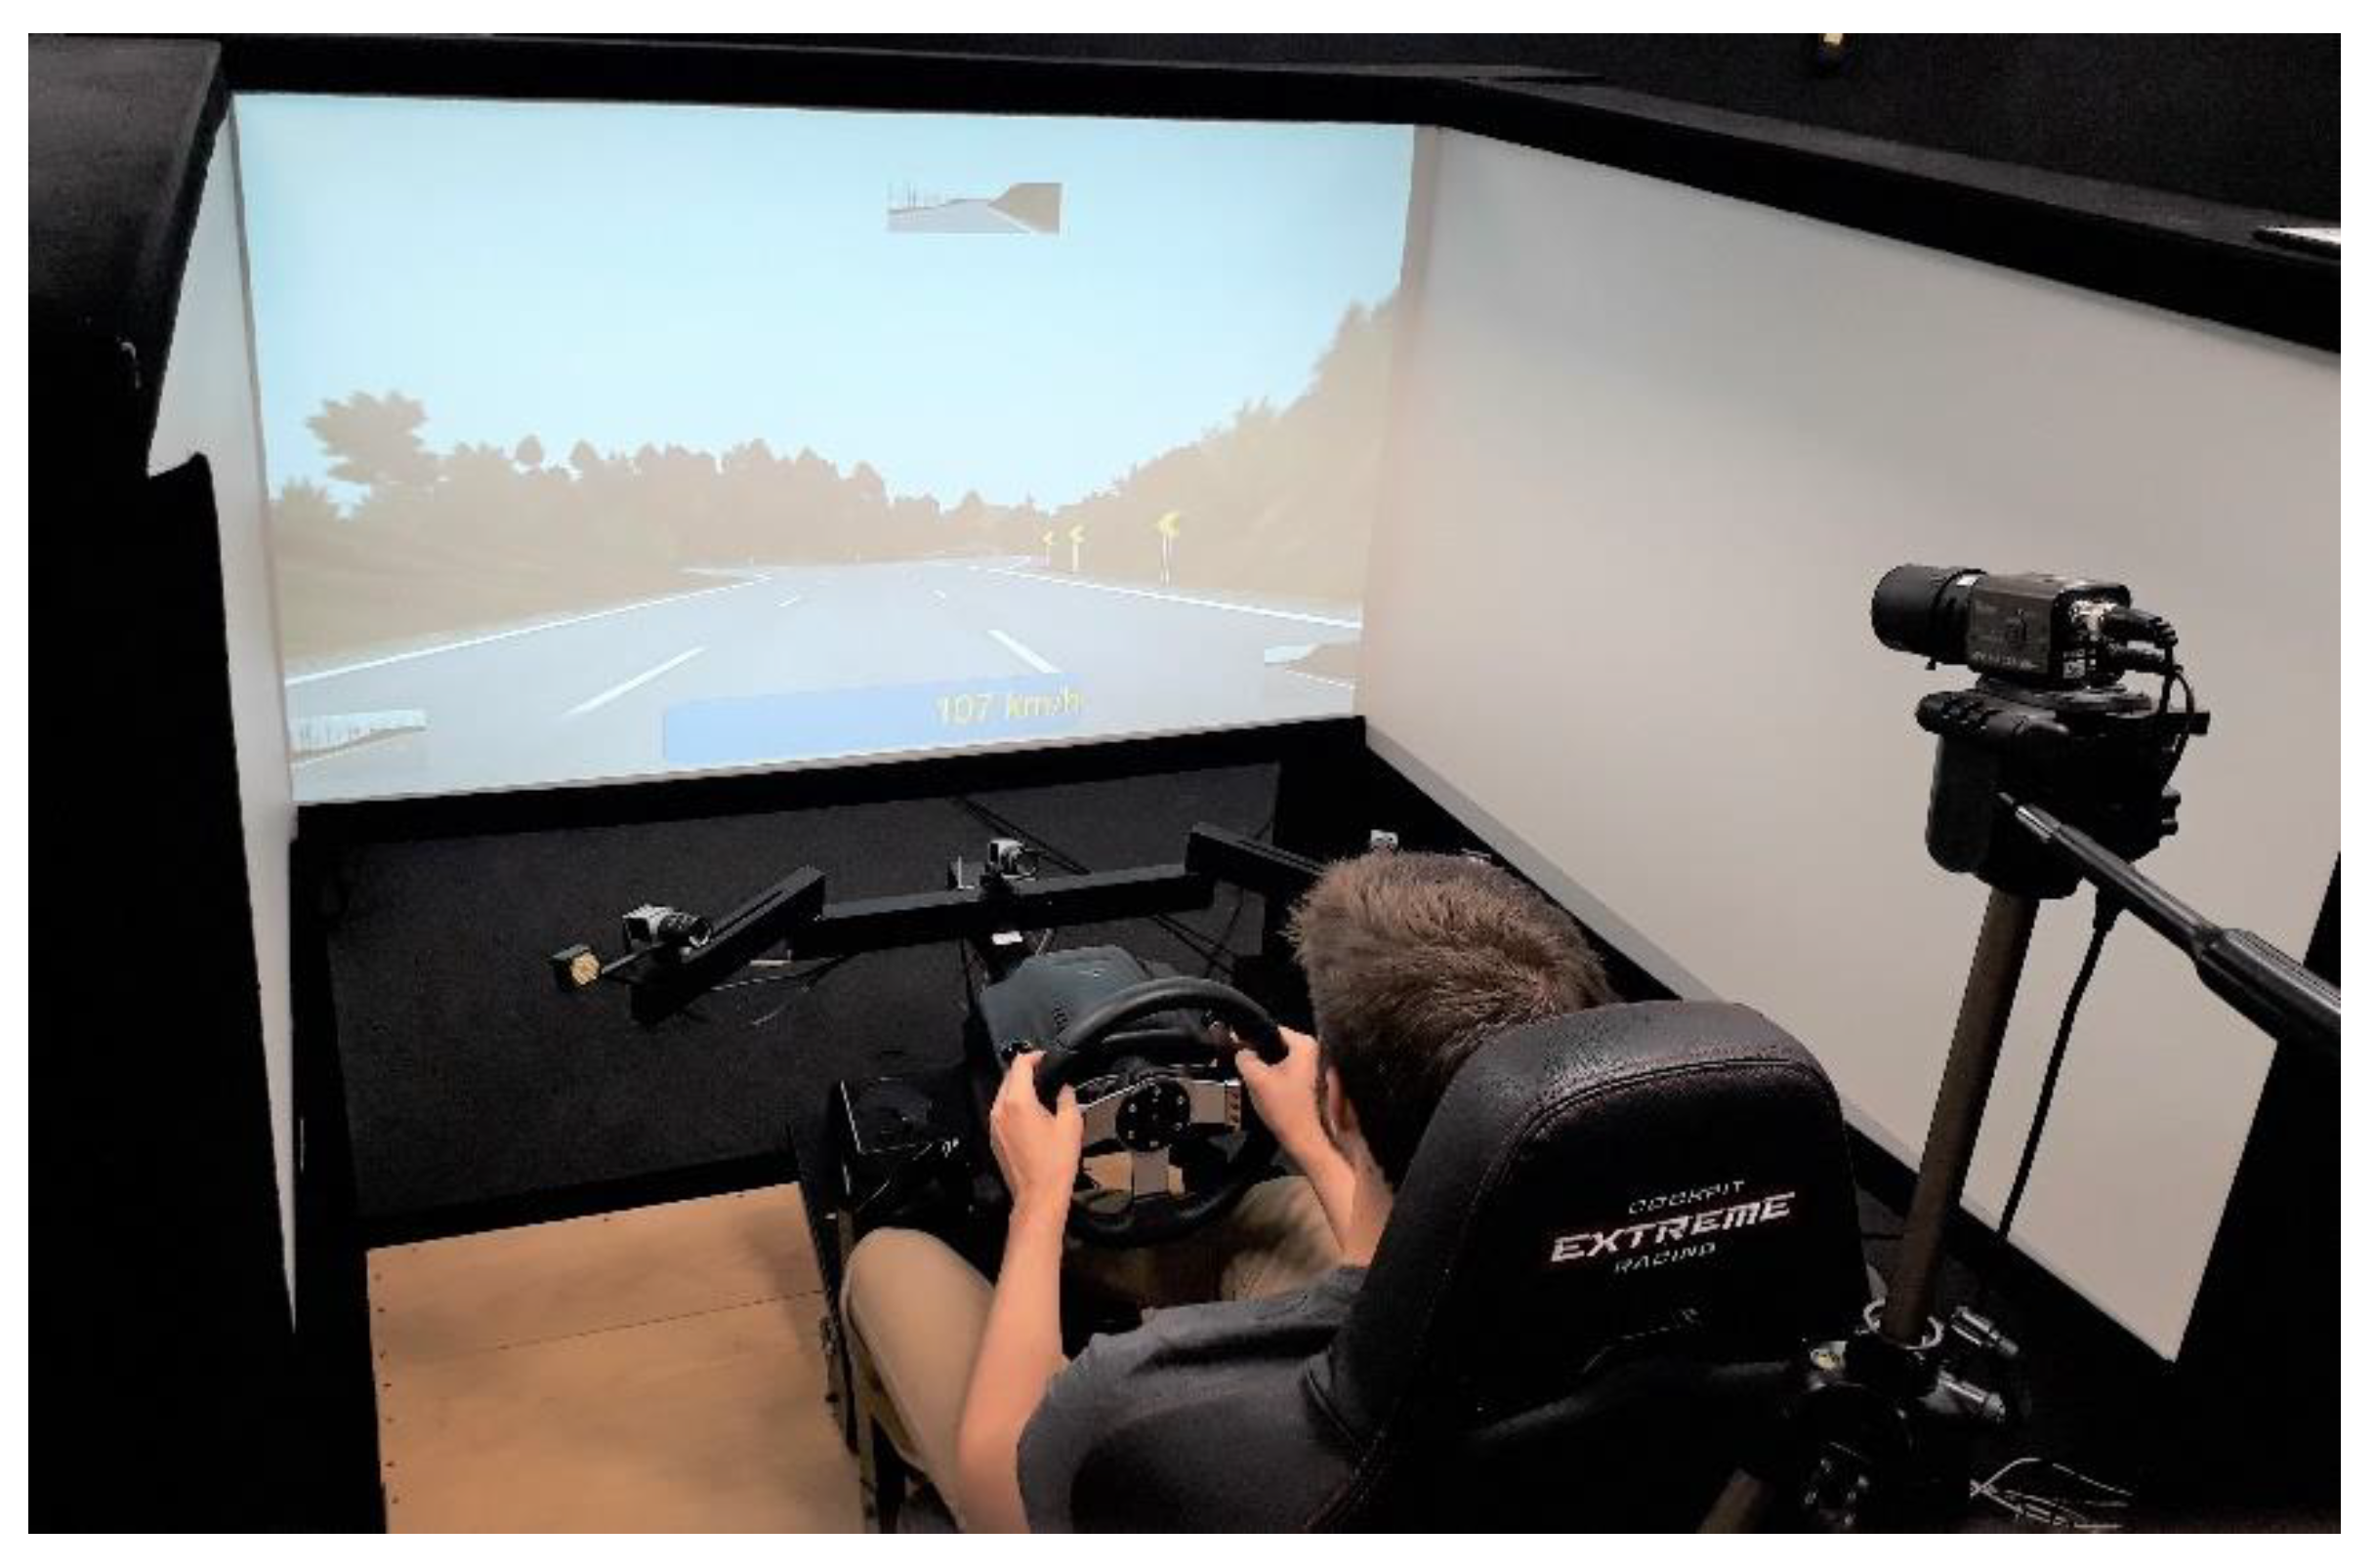
The Sustainable Road Safety Project of the Department of Transportation Engineering from the São Carlos School of Engineering, University of São Paulo, has developed a fixed-base driving simulator from human, vehicle, and traffic research. It is equipped with a driving cockpit with a car seat, a steering wheel with paddle shift and force feedback, and accelerator, brake, and clutch pedals. The simulated environment was projected on a 1.40 × 0.80 m flat panel of 1080p resolution and 60 Hz projection rate. Rear and lateral mirrors and a speedometer in a head-up display (HUD) were also projected on the panel. Speakers reproduced sounds similar to vehicle engines and wind for deeper immersion (
Figure 1). The simulator has been employed in other studies developed in the department [
19,
20,
29,
38,
39,
40].
Two computers processed the real-time simulation. The first, responsible for environment rendering and simulation running, was strengthened with two GPUs, whereas the other modeled the vehicle´s dynamics, which included a road-vehicle interaction and mechanical answers to the driver’s actions. The vehicle’s dynamics were similar to a Brazilian ordinary vehicle version, thus enabling participants to perceive a medium-fidelity immersion with visual and auditory stimuli similar to a real driving experience, due to the high computational capacity that modeled and rendered a virtual environment in real time.
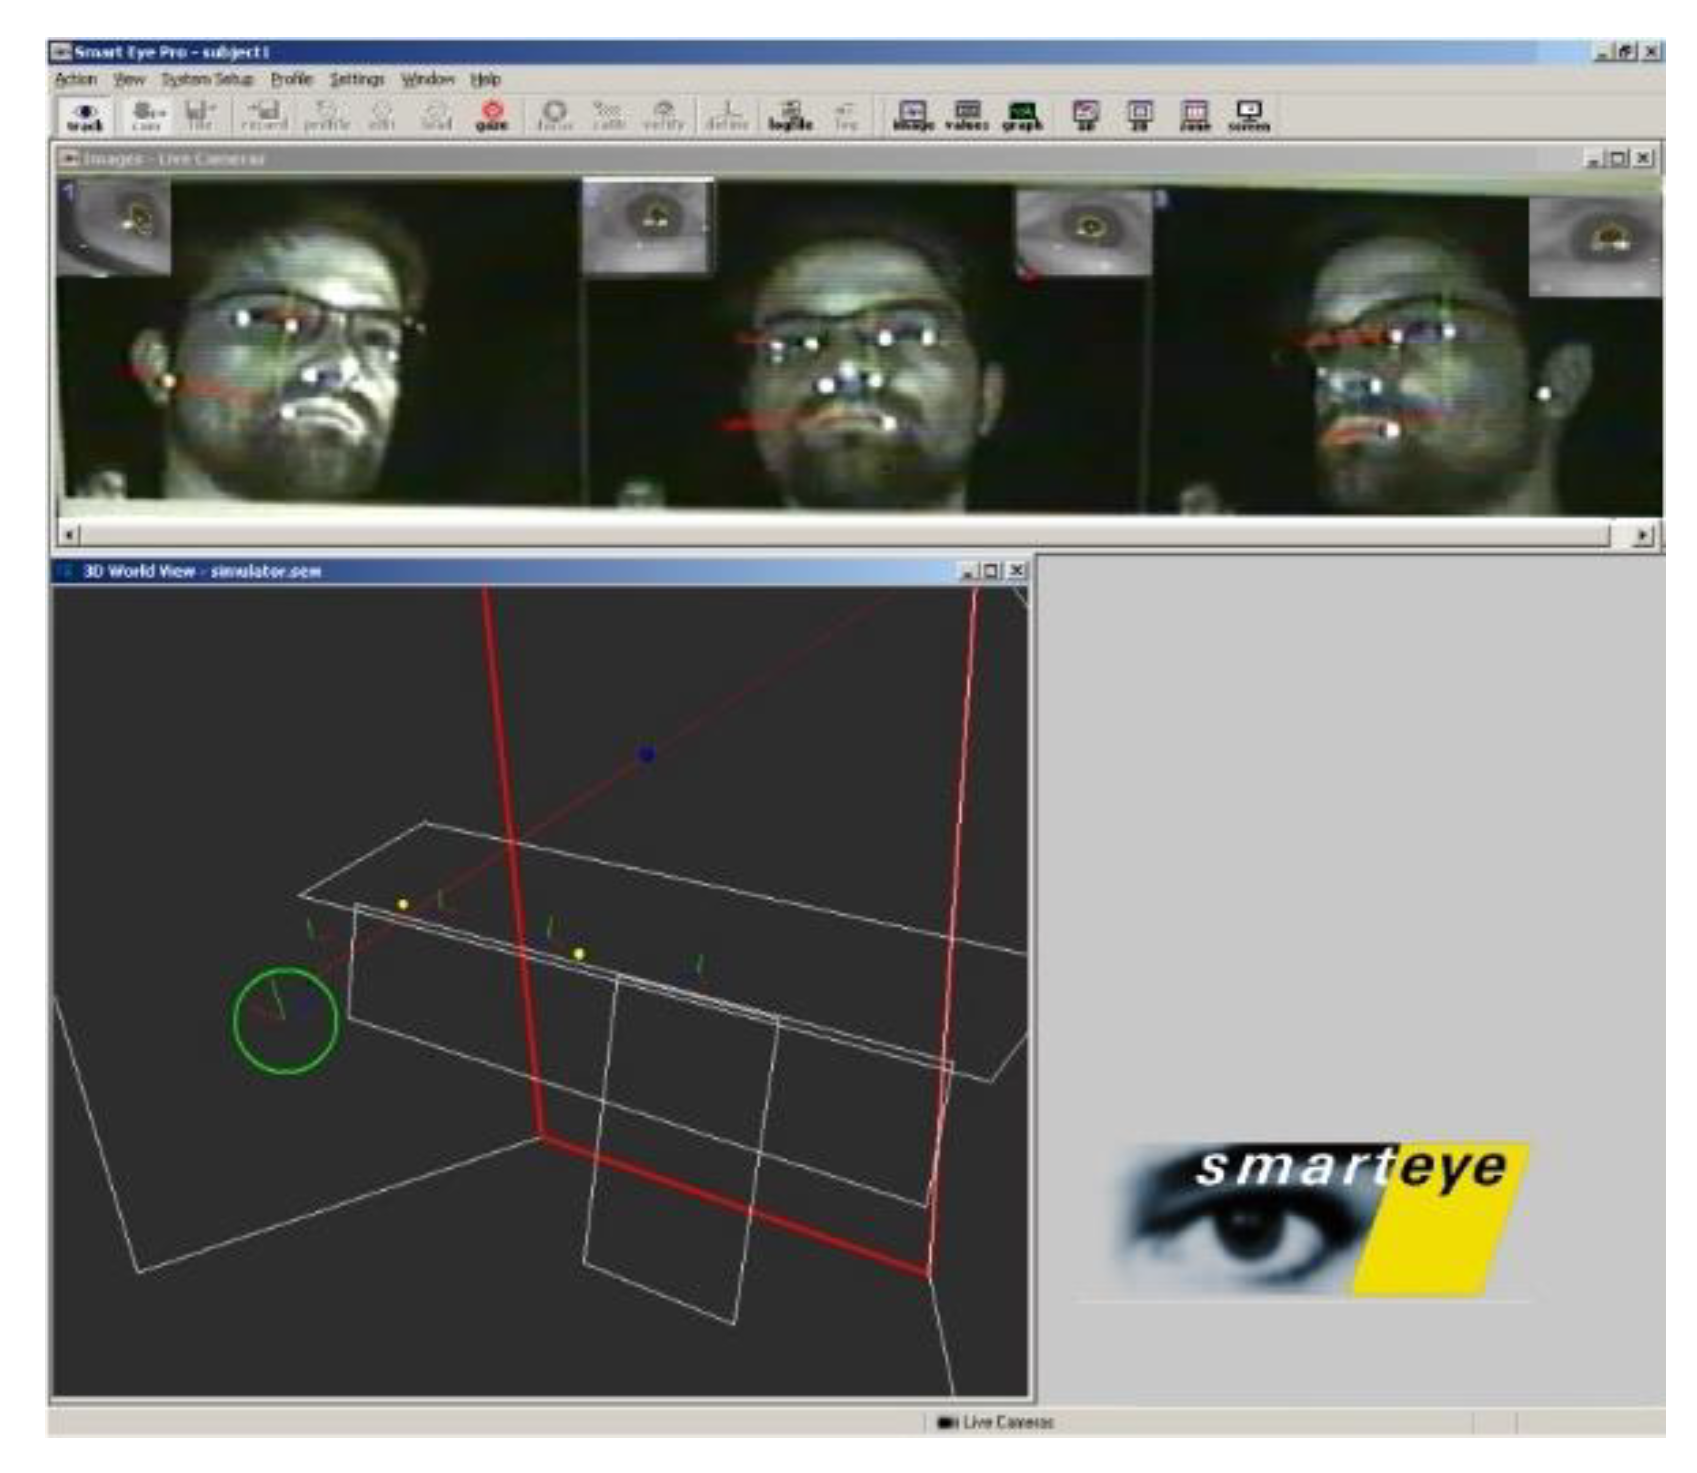
Appropriate equipment—model Pro 5.10
® Smart Eye - attached to the simulator recorded the eyes’ movements. Pro 5.10 is comprised of three front cameras that perform the driver’s eye-tracking, and an additional rear camera, which records the scenes seen by the driver. The equipment provides raw data reliability and 3D filtered data, and remotely tracks the direction of the gaze, head position, eyelid opening, blinks, attachment points, pupil size, among other monitoring and measurements.
Figure 2 shows an example of the software interface, which detects the intersection of the driver’s gaze with objects created in the environment for better determining the response time and maps the areas on the screen most viewed by the driver. MAPPS 3.3 software, developed by EyesDX, analyzed data on the eyes’ movement.
2.2. Study Segment
The rural road simulated was a 10 km stretch of a Brazilian highway that connects Sao Paulo to Curitiba and is the main connection between Brazil and other South American countries. The stretch is located in a mountainous region with fog incidence in certain periods. The highway administrator provided the stretch geometric design necessary for virtual modeling, the AADT (Average Annual Daily Traffic), as well as the location, type, and severity of accidents occurred in recent years.
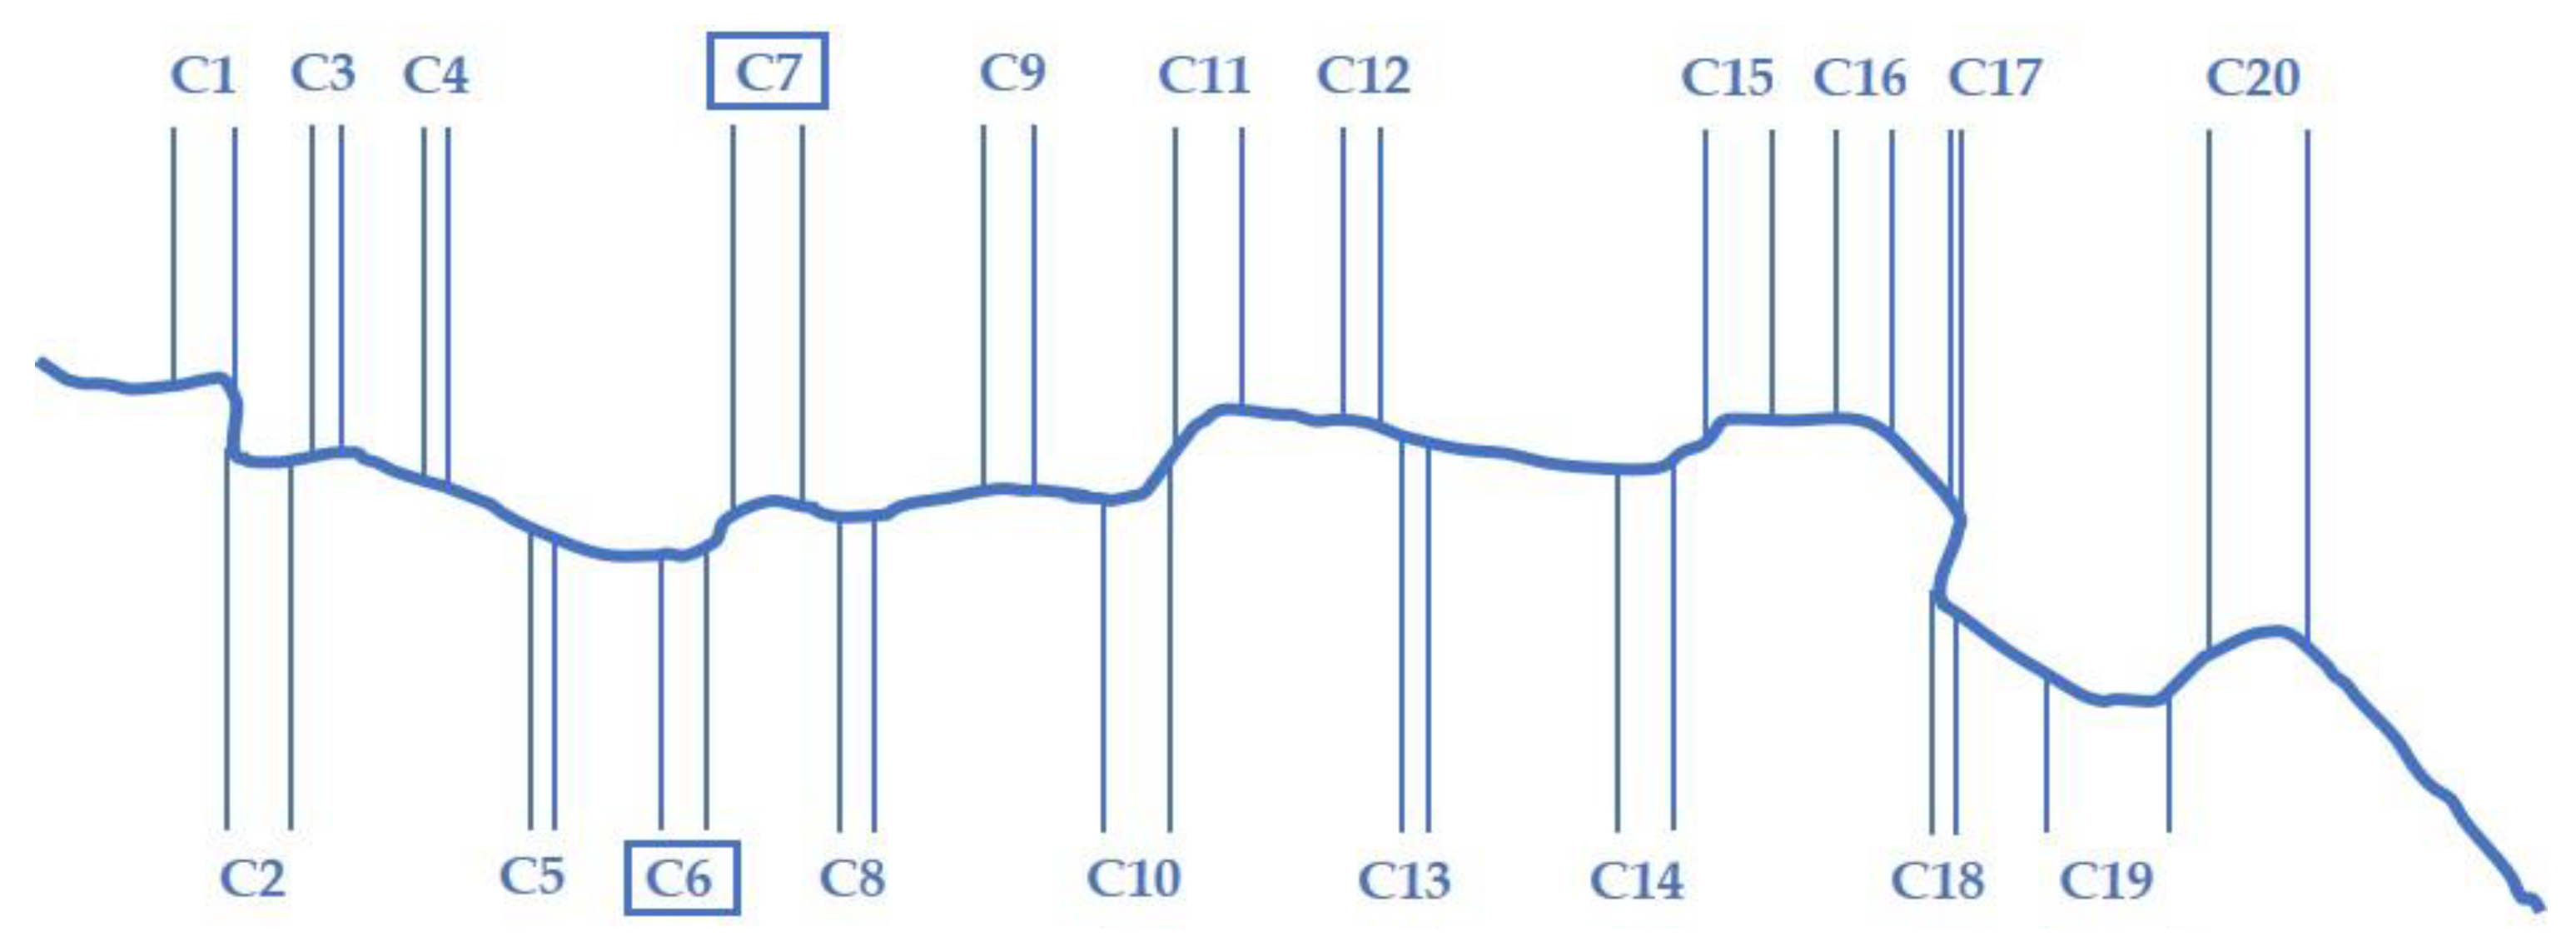
The stretch is comprised of 20 curves (
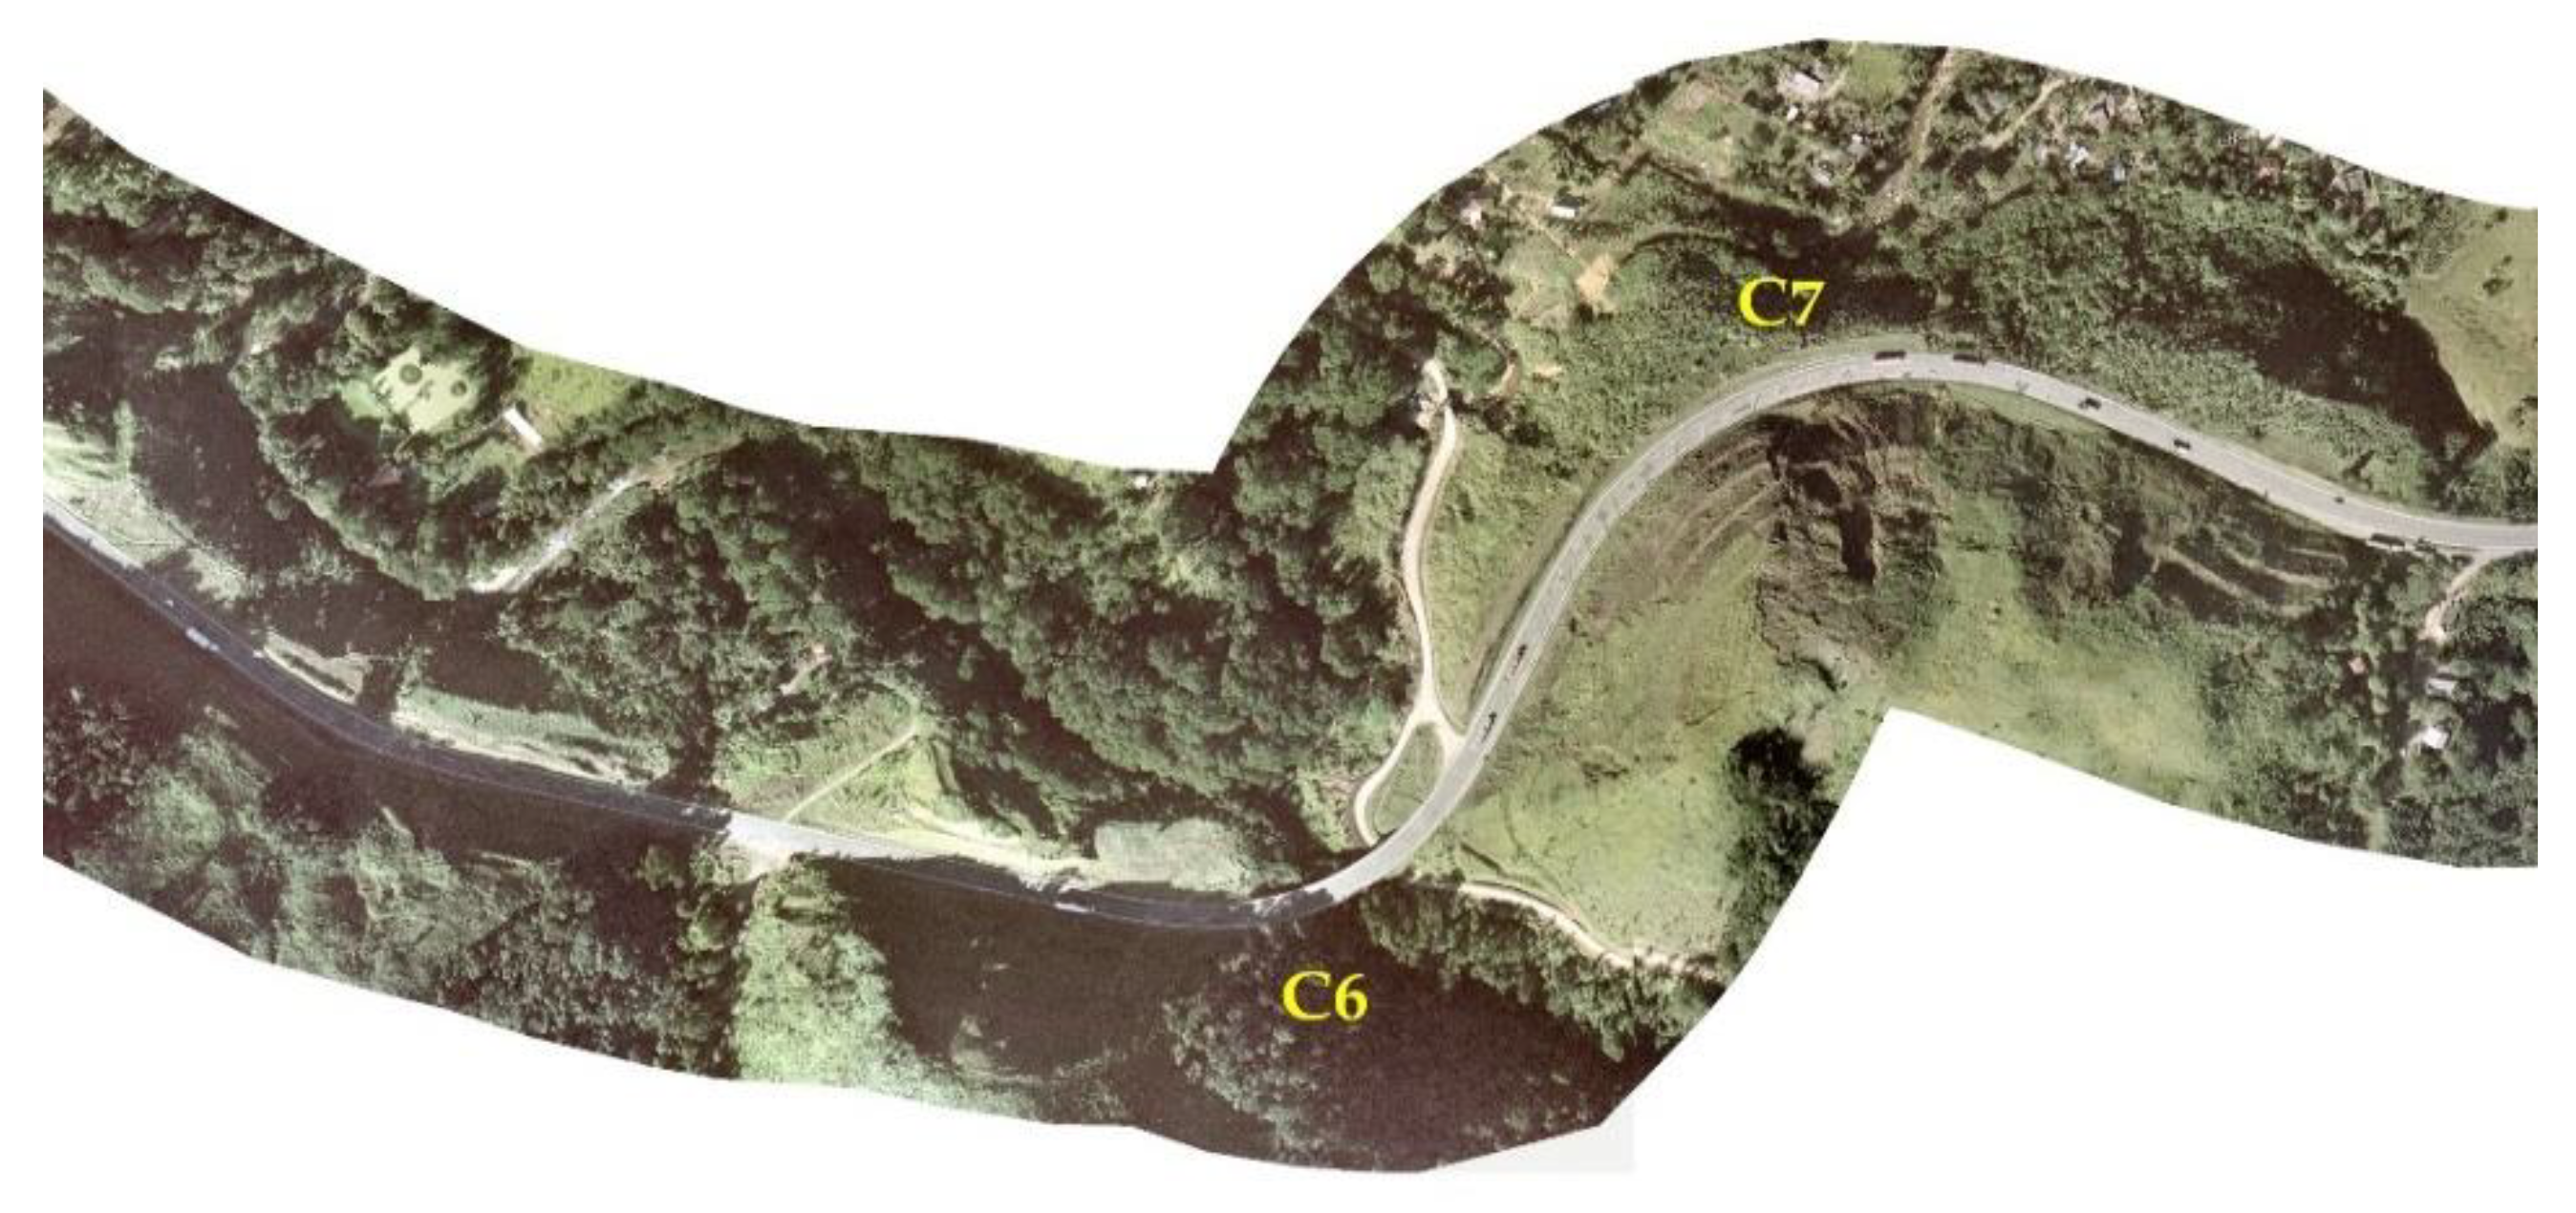
Figure 3), and the fog analysis was performed in a segment selected according to the fog car crash statistics of the road from 2011 to 2020. The hypothesis is the accidents are related to drivers’ inability to react properly under fog conditions at those spots. Considering geometry and crash statistics, the fog analyses were performed between the 6th (C6) and the 7th curves (C7) (
Figure 4). Both position and intensity of the fog were fixed in all foggy trials, and passenger vehicles and trucks were distributed proportionately.
2.3. Simulator Scenario
The scenarios were modeled and simulated by Virtual Test Drive (VTD) package developed and marketed by Vires
®, according to the data collected (see
Figure 5), and then analyzed by Python programming codes. They were designed for analyses in the selected stretch of the test highway, with a heavy x passenger car proportion of the traffic flow respecting the results from National Traffic Counting Plan (PNCT). The only changes between the scenarios were independent variables presence and absence of fog for ensuring no difference would be confused with other factors. Field surveys for the fog visibility calibration in the studied region were not part of this research. Based on previous studies [
11,
13,
41,
42], the heavy fog condition was considered a critical scenario (visibility distance is shorter than or equal to 200 m); therefore, fog position (settled in the tangent between C6 and C7) and fog intensity according to visibility (50 m) were fixed in all foggy trials.
A valid interpretation of the results depends on a series of factors related to proper design, execution, and analysis. As suggested by Fisher et al. [
18], the scenarios were randomized for each participant towards avoiding bias. Randomization ensures an equal distribution of all characteristics among the treatment groups, thereby diminishing the potential for confounding. A pilot data collection was conducted prior to the definitive experiment for saving resources and subjects.
2.4. Experimental Design and Procedure
Thirty-eight volunteers were required to have had a driver’s license for at least one year and normal or corrected-to-normal vision. The group was formed by 23 men and 15 women, aged between 20 and 36 years old (M = 26.9, SE = 4.0).
A within-subjects’ design (repeated measures) was employed, and each subject experimented two visibility conditions, namely clear and foggy, totalizing two trials/scenarios for each one. The scenario under clear conditions represents the control group in which the participant drives with no influence of reduced visibility, and will be useful for analyses of the default behavior of each participant. A scenario under fog is expected to enable analyses of the way the environment outside the car changes the drivers’ behavior. The order of the scenarios was randomly sorted for each participant towards avoiding bias, as well as accommodating the limited time each participant would spend in the simulator and minimizing possible simulator sickness.
A Protection of Human Subjects in Research approval was obtained from the Brazilian National Health Council prior to the experiments. Upon arrival at the laboratory, each participant signed an informed consent and filled a personal information questionnaire. They were also instructed on procedures and mechanical operations of the simulator. The instructions did not include any detailed information on the experiments that might potentially influence the driving behavior. The participants were instructed to drive as normally as they usually do in a real car. Subsequently, they drove an adaptation scenario until they had felt adapted to the simulator and comfortable with the simulation. The adaptation simulation lasted at least 5 min for each participant and could be repeated as many times as necessary. A profile for the eye-tracking system was then created and calibrated by Smart Eye® software, and the participants drove for approximately 5 min in each of the two experimental scenarios, with a 2 min interval between them. They were instructed to pull over and stop after they had driven along the data collection segments. The experiment lasted approximately 20 min.
2.5. Data Analysis
The dependent variables analyzed were number and duration of fixations, pupil diameter, and area tracked by the participants´ eyes. Their individual and combined analyses aimed at finding relevant incorporations for the dealing with such a weather situation. Therefore, the drivers’ visual performance patterns in fog weather must be uncovered as a function of the different visibility conditions towards the development of technologies, optimization of the systems’ application effectiveness, and correct improvements in the visualization of signaling on highways. The following variables were analyzed in both scenarios: (i) Number of fixations, which provides information on sampling rate, i.e. frequency at which the information is collected from the screen; (ii) Mean fixation duration, as an indicator of processing time (shorter mean fixation duration means shorter processing times); (iii) Pupil Diameter, according to which the presence of fog increases contrast visibility, thus decreasing the pupil diameter; and (iv) Screen’s area tracked, which reflects the visual search spread, i.e., effectiveness of the visual search strategy adopted by the driver.
The lack of visibility can significantly affect a driver’s visual strategies before driving in a foggy area. The number of fixations in a foggy zone is expected to be greater, whereas the fixation duration is shorter, thus indicating the drivers’ ability to react properly.
A paired t-test analysis was computed by SigmaPlot (v.12) with paired t-test tool. However, a Wilcoxon test was applied when normality was violated by Shapiro-Wilk test. The analyses were organized into number of fixations, mean fixation durations, pupil diameter, and area tracked.
3. Results and Discussion
3.1. Number of Fixations
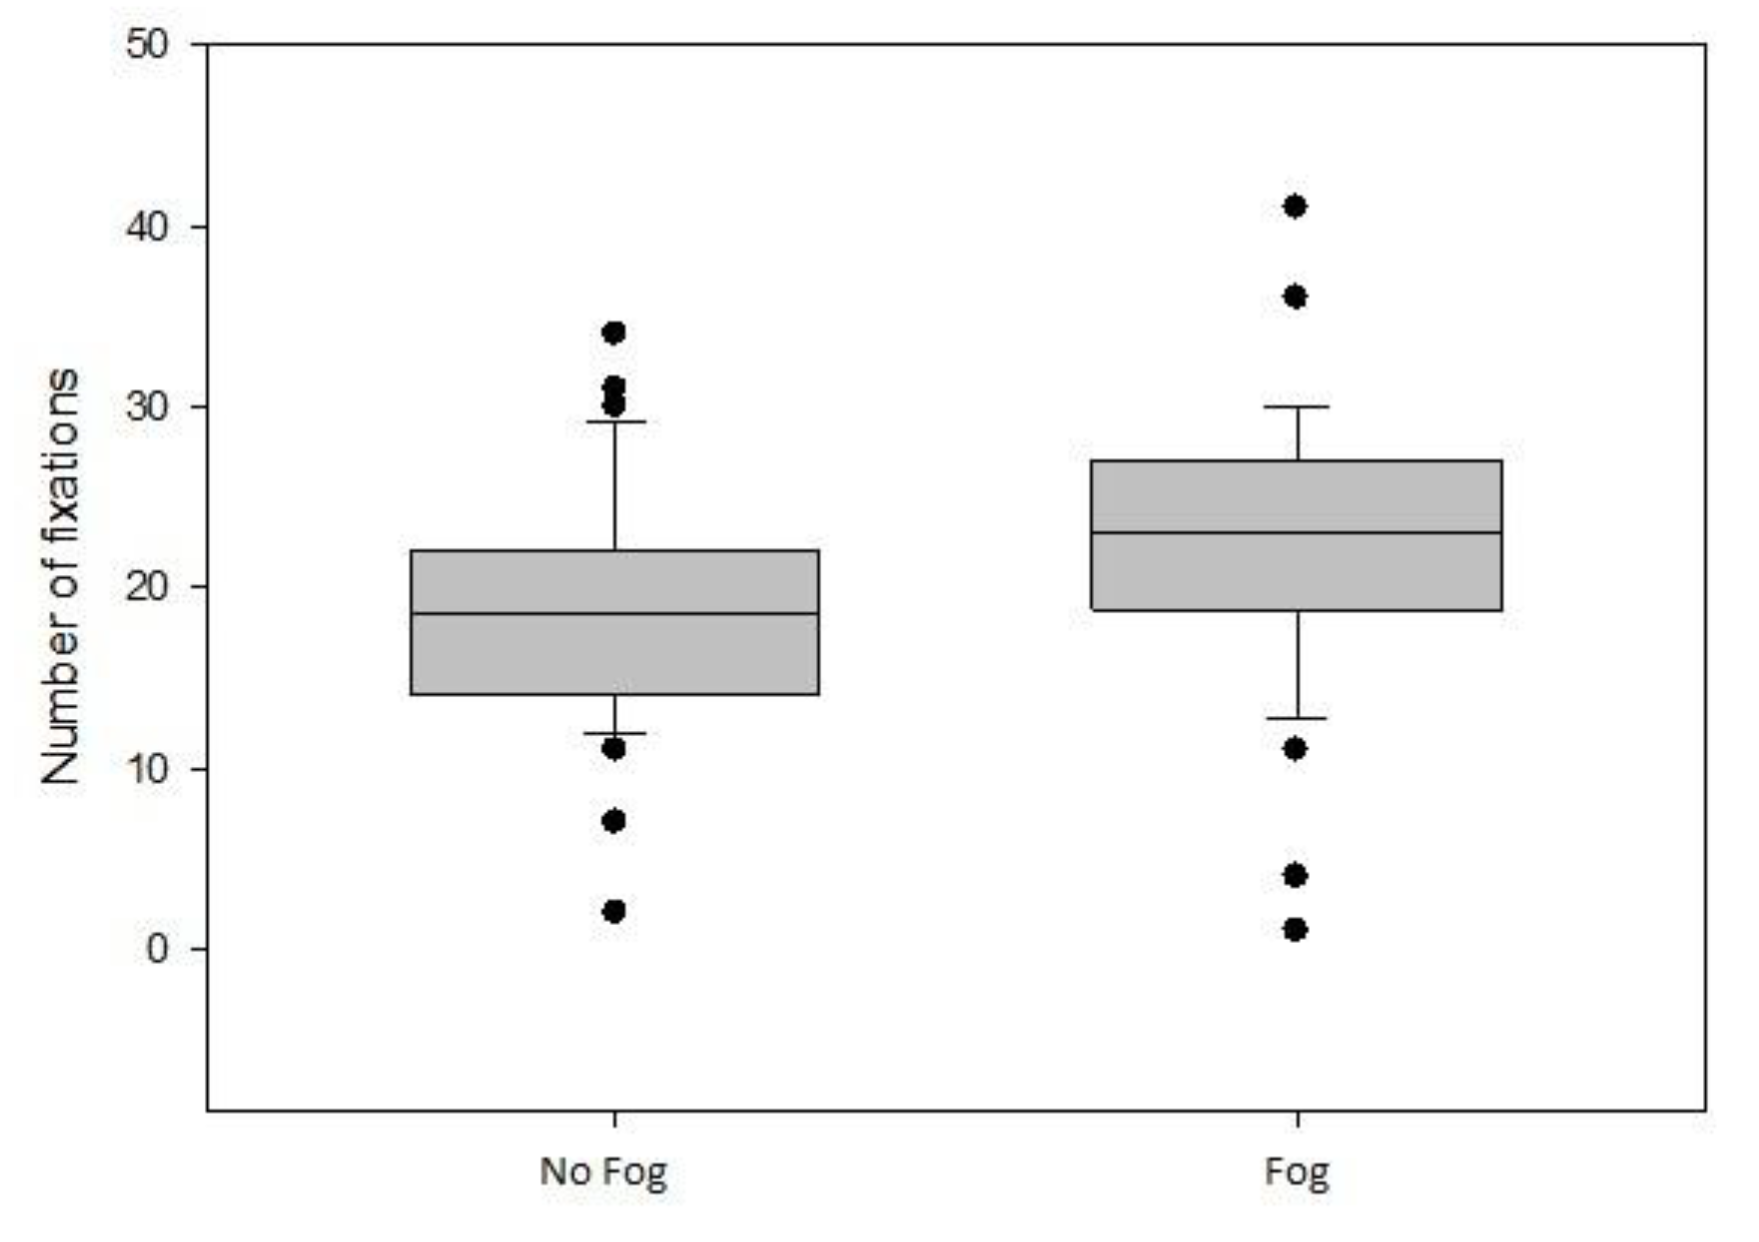
Table 1 and the Boxplot in
Figure 6 show the results of the Wilcoxon test. The number of fixations was calculated for each subject in the two scenarios. Wilcoxon test compared the average number of fixations during driving with and without fog regarding how fog influences such a number. The foggy scenario showed a significantly higher number of fixations (Median = 23.00) than the no fog one (Median = 18.50), z = 3.958,
p < 0.001, r = 0.45, thus indicating the presence of fog increased the average number of fixations and was statistically significant.
3.2. Mean Fixation Durations
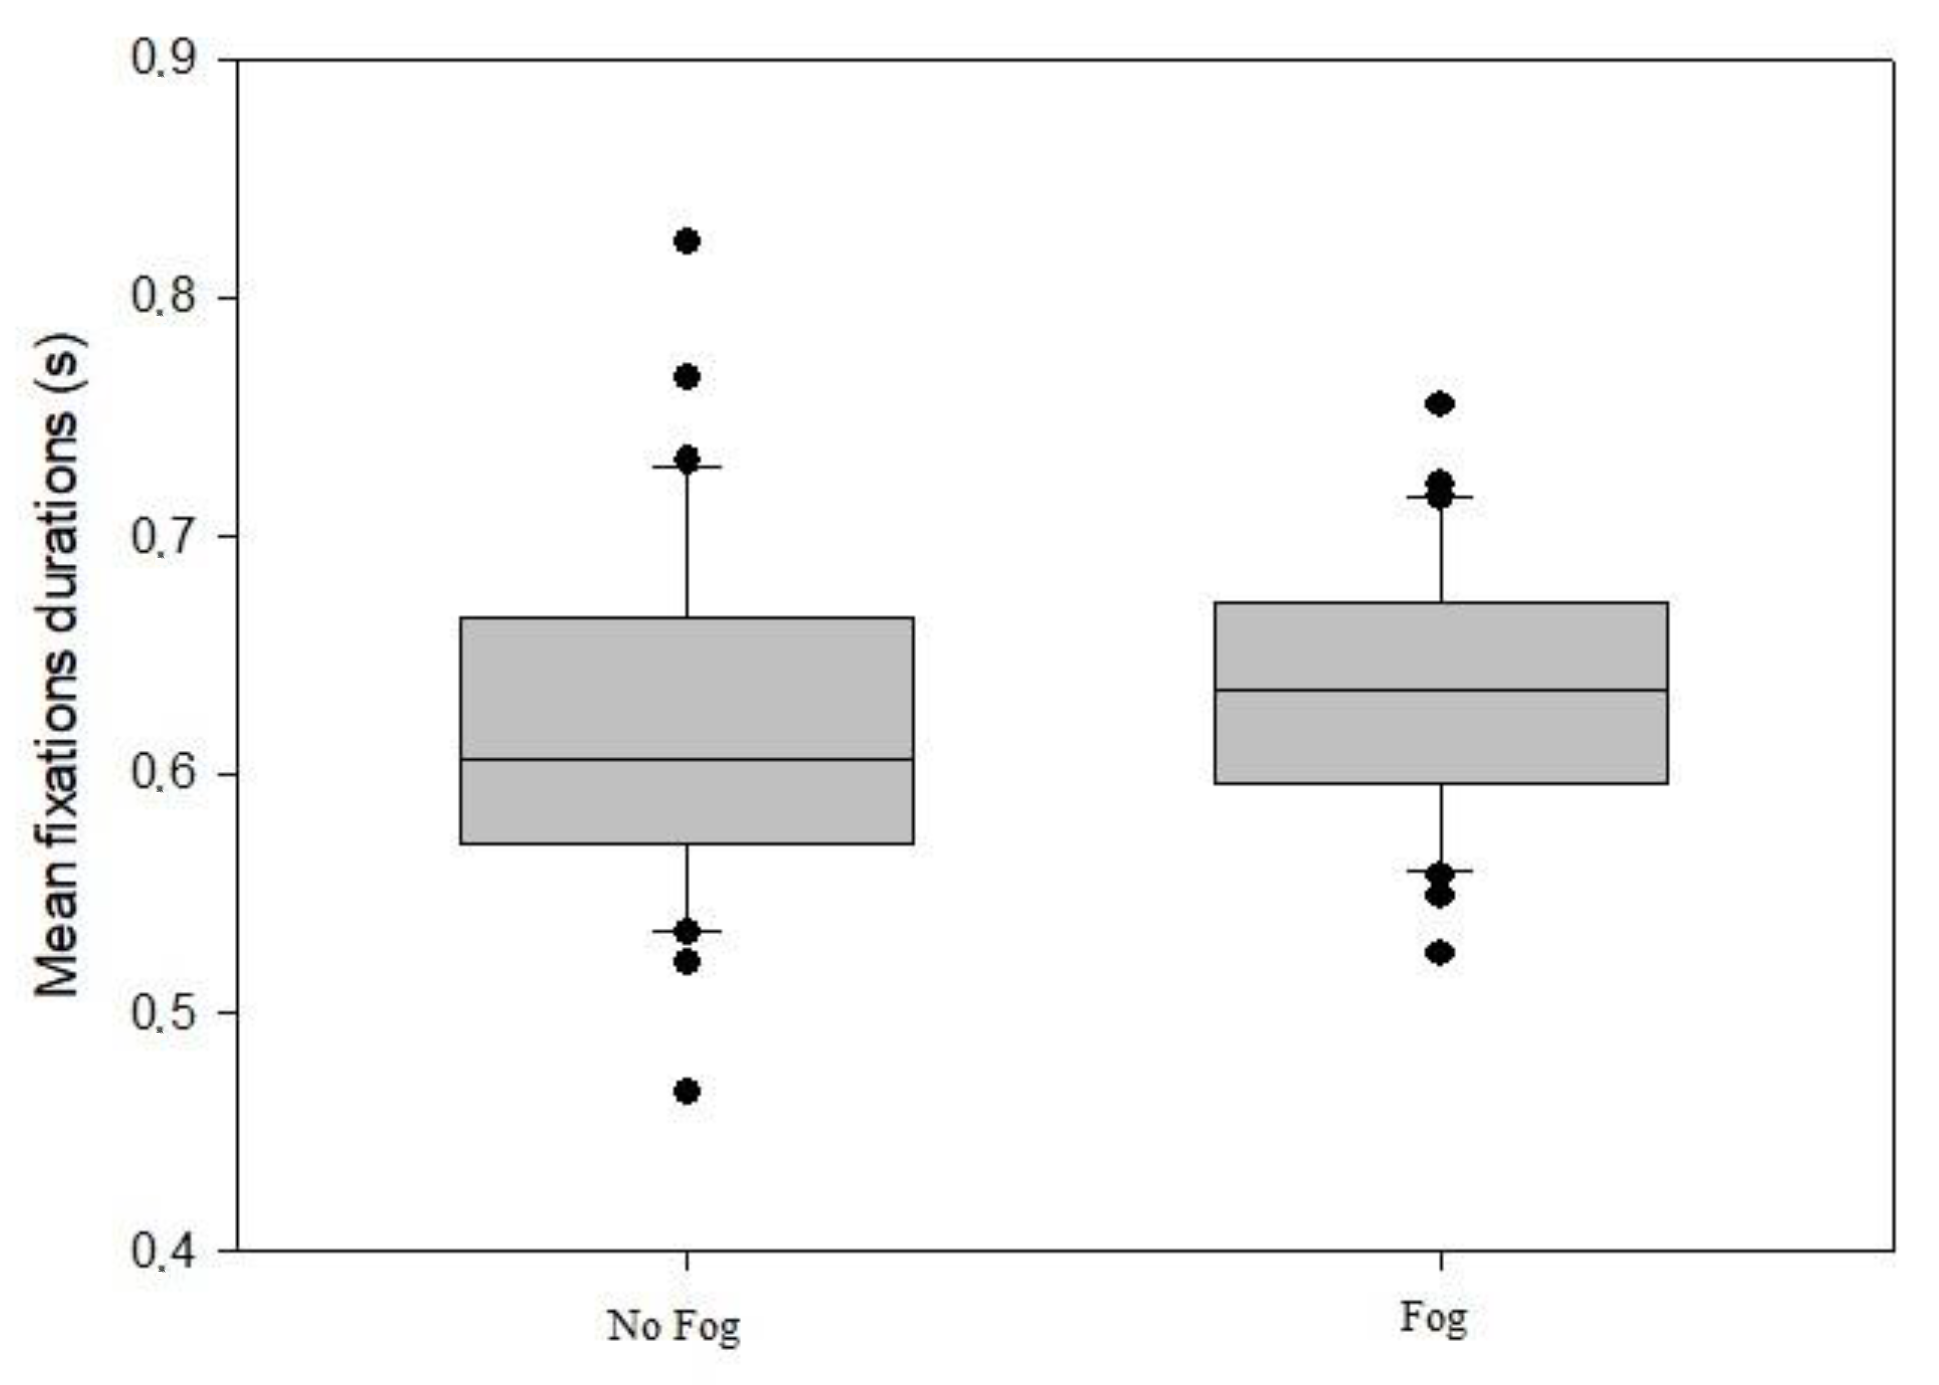
A paired
t-test compared the average duration of the fixations during driving with and without fog. Shapiro-Wilk test for normality revealed data were normally distributed (P = 0.559), and the descriptive analysis indicated the average durations of fixation were 0.634 s (EP = 0.0744) under fog and 0.617 s (EP = 0.0525) with no fog. The test results (
Table 2 and
Figure 7) showed no significant difference in the fixation durations between the scenarios (t (37) = −1.254 and
p = 0.218 > 0.05).
3.3. Pupil Diameter
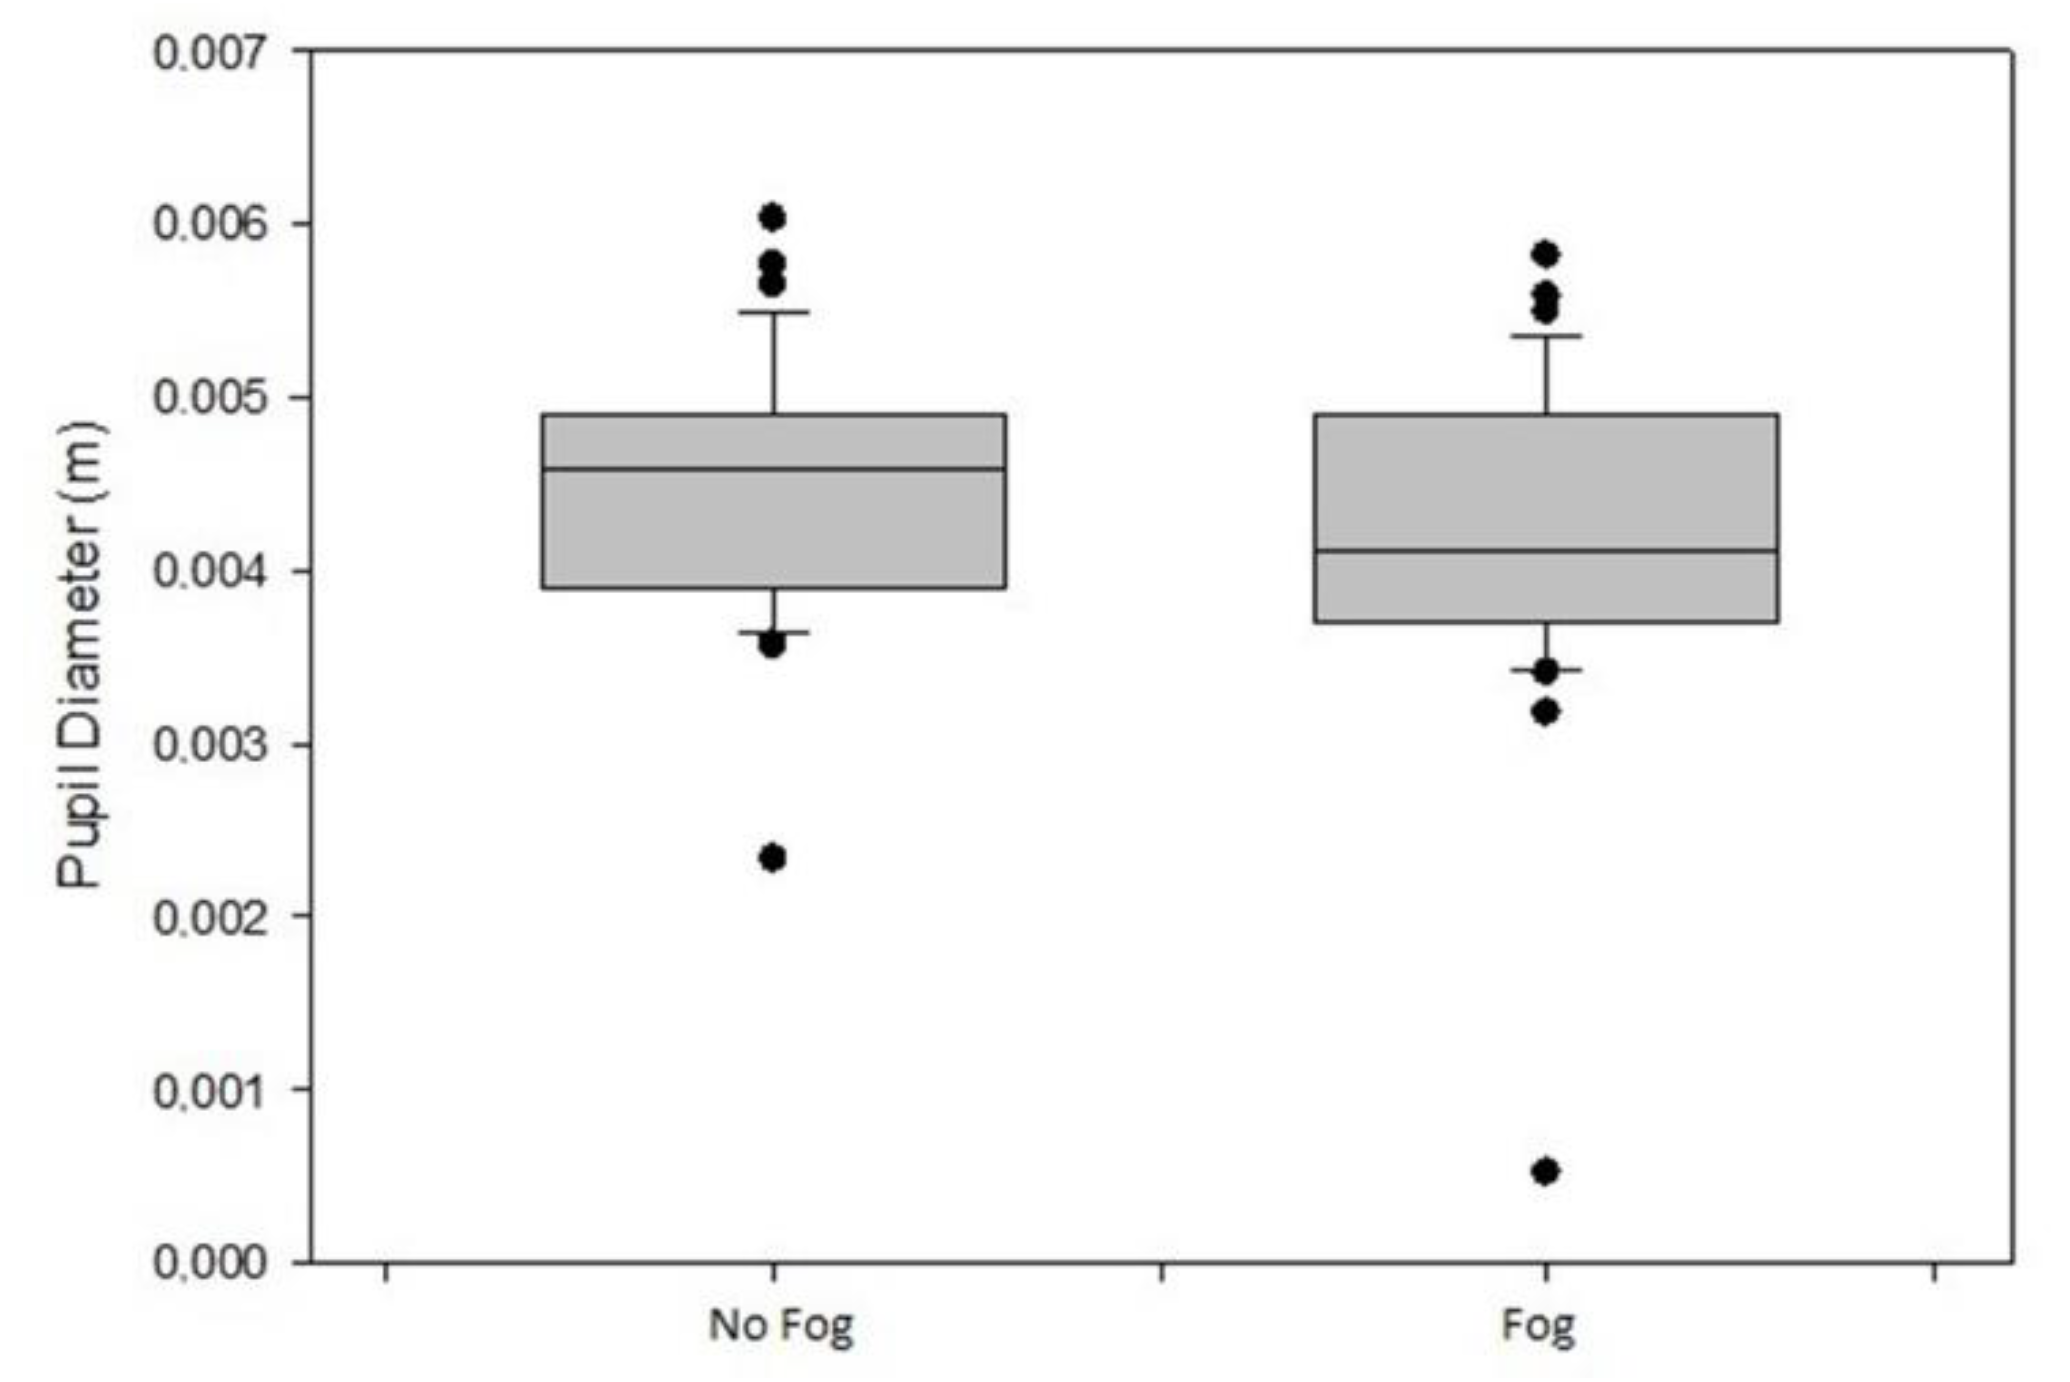
Table 3 and the Boxplot in
Figure 8 show the results of the Wilcoxon test, which compared the average pupil diameter during driving with and without fog. It was significantly lower (Median = 0.00411 m) in the foggy scenario in comparison with that of no fog (Median = 0.00458 m). z = −3.676.
p < 0.001. r = −0.42, indicating the presence of fog decreased the average pupil diameter and was statistically significant.
According to Ni et al. [
3], the presence of fog reduces the overall contrast and visibility of the driving scene, resulting in reduced visible details as a function of increasing distance. Contrast reduction is evident when a decrease in the pupil diameter is verified in the foggy scenario, limiting the amount of light reaching the retina.
3.4. Area Tracked
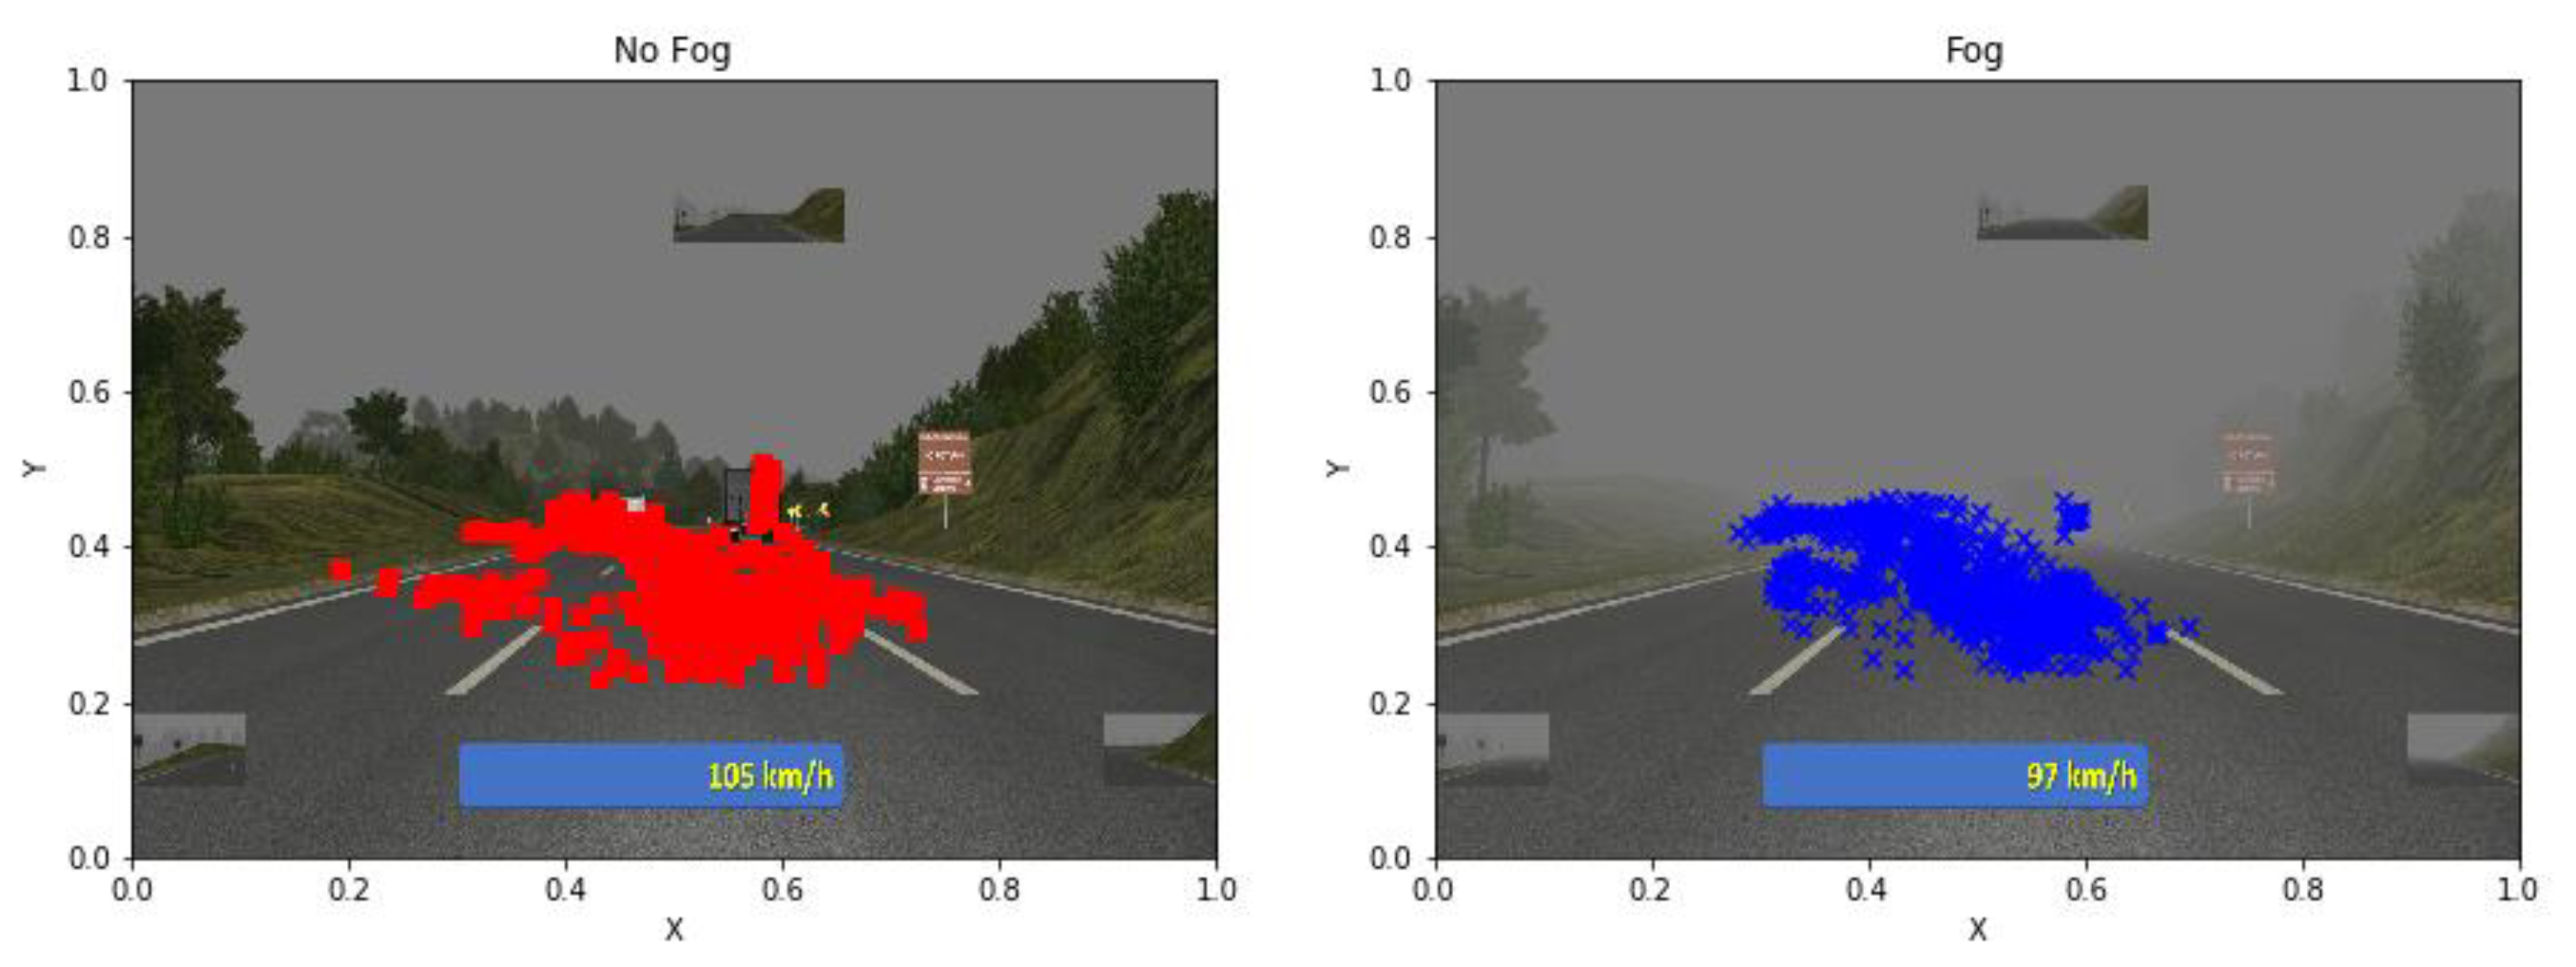
Figure 9 shows a comparison of clear (red) and foggy (blue) scenarios. Changes were expected in the distribution of visual attention as a direct consequence of the degree of visual information available to drivers. Since the purpose of the study is to compare the regions of the external environment tracked, the points of interest internal to the vehicle, i.e., mirrors and head-up display, were excluded from the analysis area. The figure shows scatter graphs for a volunteer in each scenario and an overview of the visual spatial distribution for each condition.
Despite the similarity of the fixation patterns, the clear area tracked showed broader regions than the foggy scenario, hence, statistical differences. As exemplified in
Figure 10 below, for one of the participants, the polygon’s area shaped by the extreme points in blue (foggy) is 0.061 m
2 and the area shaped by the extreme points in red (clear) is 0.090 m
2.
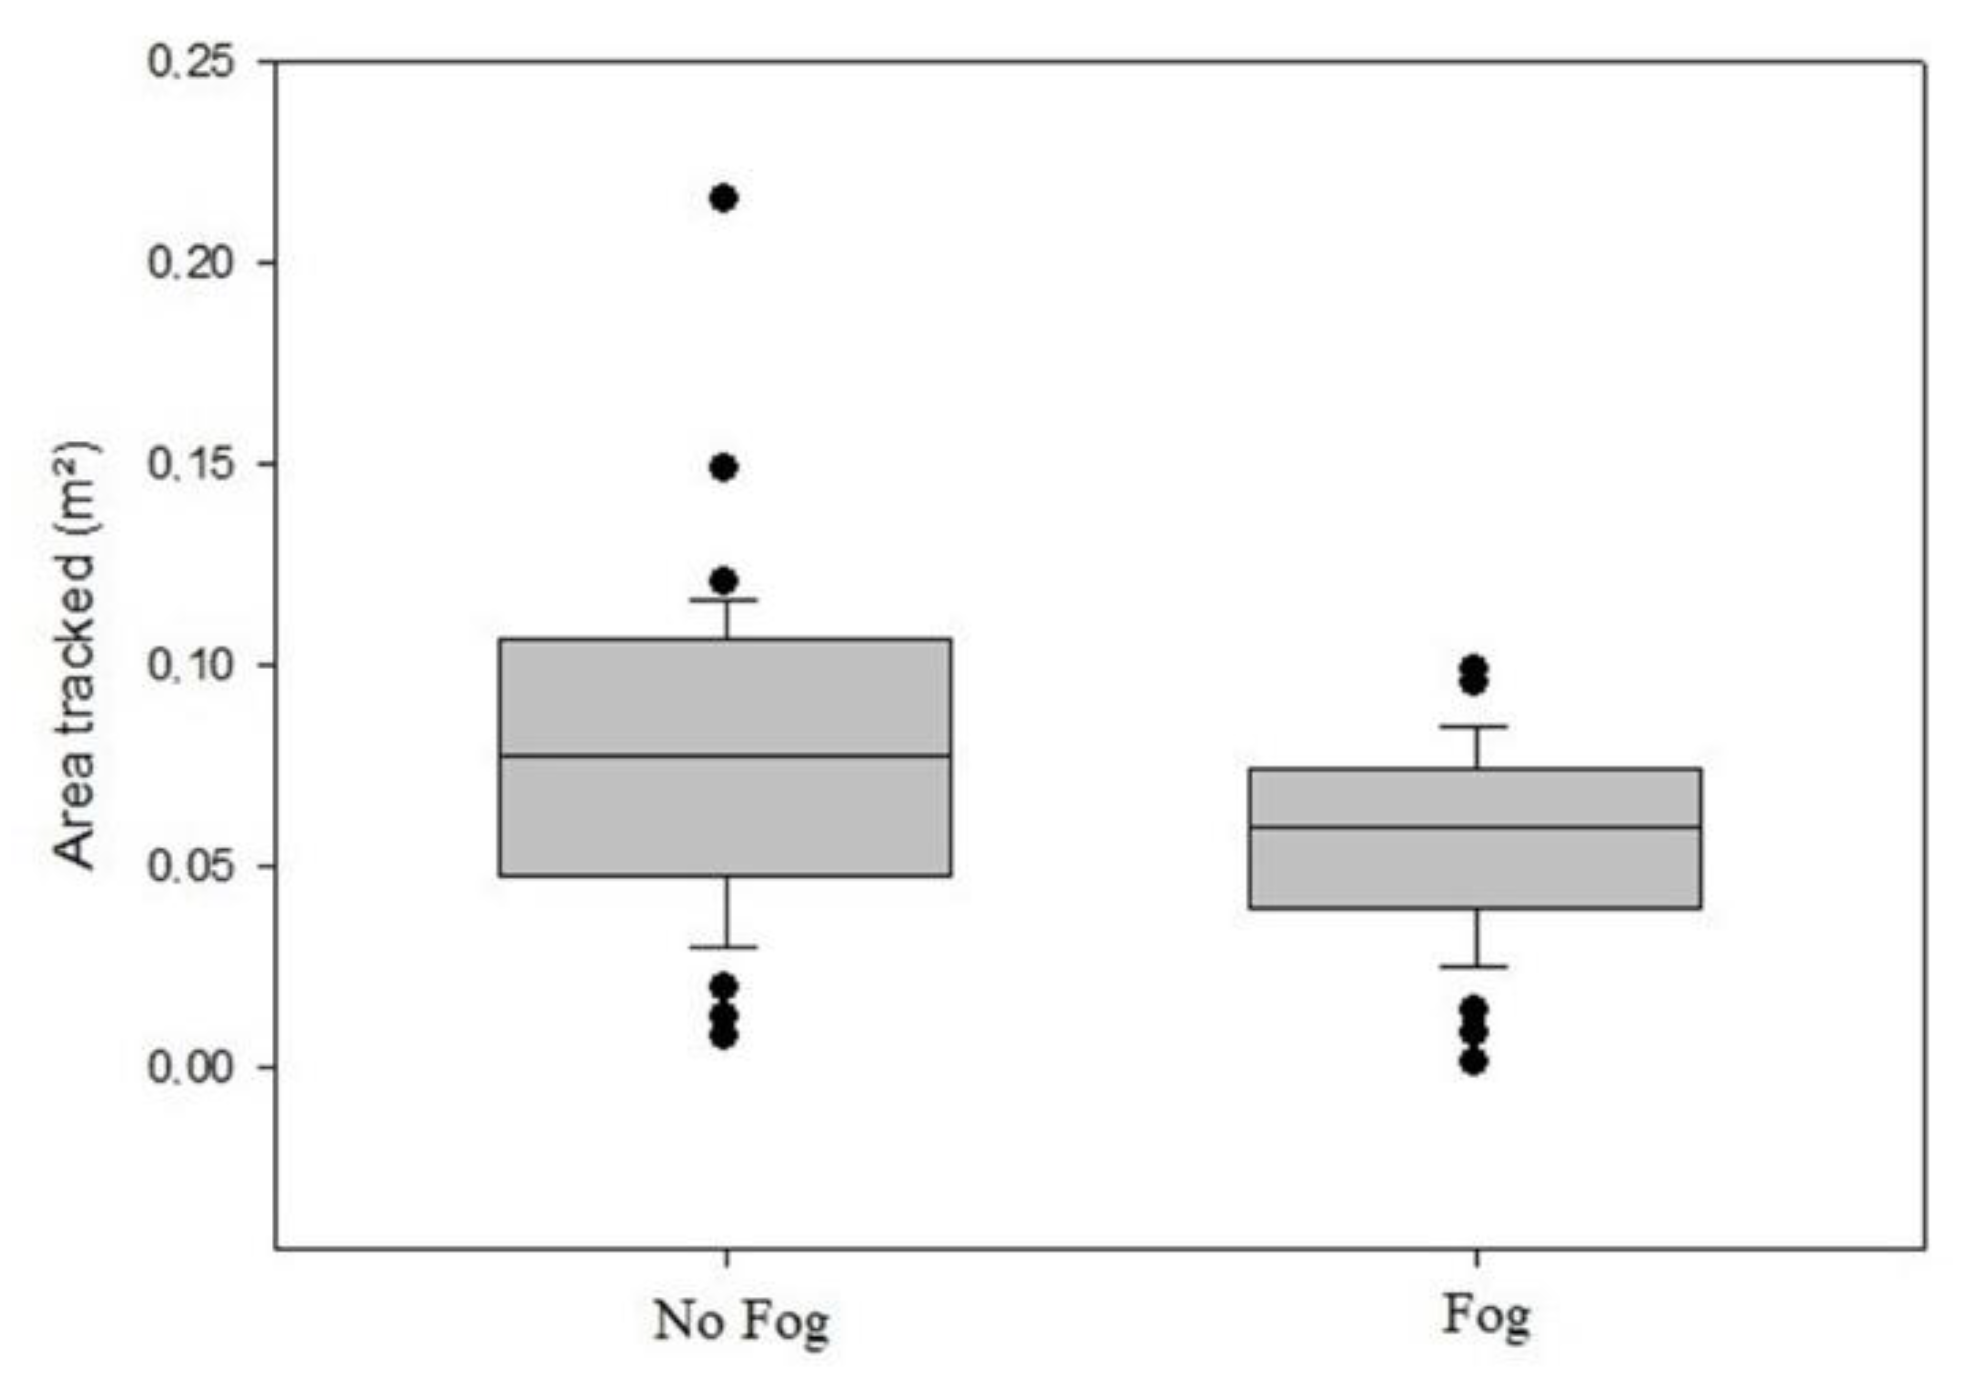
A paired
t-test compared the area tracked during driving in clear and foggy scenarios (see
Table 4 and
Figure 11 for the results). Shapiro-Wilk test for normality revealed data were normally distributed (
p = 0.080), and the descriptive analysis indicated the average areas tracked were 0.0789 m
2 (EP = 0.0404) under clear condition, and 0.0561 m
2 (EP = 0.0234) under fog. The test results showed a significant difference in the area tracked between the scenarios (t (37) = 3.548) and a statistically significant change (
p = 0.001).
4. Conclusions and Future Research
Apart from the knowledge of differences in a driver´s eyes´ behaviors while driving under clear and foggy conditions, the reasons for such differences must also be known towards the design of interventions in highway projects that provide safety for drivers driving under foggy conditions.
Fixation duration is a good indicator of difficulties in a driver´s processing some information. Although no statistical difference has been found for the mean fixations duration, this can also be understood as a result, since under foggy conditions, the duration of drivers’ fixations, i.e., their information processing time is the same of that in a scenario with no fog.
On the other hand, if the processing time remains the same, the amount of information processed leads to a significant difference, clearly shown by the increased number of fixations in the foggy scenario over the clear one. Despite a smaller field of vision, the driver searches for more visual information and spatial references in a foggy scenario for either staying on the track, or better understanding the situation.
Regarding differences in the spread of view, the drivers’ areas tracked are reduced under foggy conditions, and a great number of visualizations is provided in the center of the screen, indicating drivers do not see much beyond the shoulders.
Our results can enable designers to reconsider the design of edge lines for assuring they are visible in fog, or even design fog warnings with short messages on gantries over the roadway. Such possibilities can improve both drivers’ processing capacity and variables (e.g., processing time of autonomous vehicle algorithms), since they will be able to know the image’s locations to be focused on when analyzing a scene under fog weather.
Although some studies have addressed driving under foggy conditions, the literature lacks research on eye tracking as a dependent variable. This is one of the first studies that use driving simulators for the understanding of the driving infrastructure’s environment under fog in the Brazilian scenario.
The driving simulator guarantees realistic experiences for a safe driving under different dangerous conditions such as fog. Its potential has been confirmed for testing under controlled road virtual environments, since it enables repeatability of specific combinations of features, and cost reduction. Investigations on driving in a specific scenario can also be more effective than that in the real world, as well as safer, because of the absence of physical risk, regardless of the driver´s performance. The eye track system association provided a realistic extract of a driver´s behavior, and data from almost forty drivers who covered 760 kilometers in a virtual scenario could be analyzed in a sustainable manner.
Author Contributions
Conceptualization, A.P.C.L. and F.C.; methodology, F.C.; software, F.C.; validation, F.C.; formal analysis, F.C.; investigation, A.P.C.L. and F.C.; resources, A.P.C.L. and F.I.K.J.; data curation, F.C.; writing—original draft preparation, F.C.; writing—review and editing, A.P.C.L. and F.I.K.J.; visualization, F.C.; supervision, A.P.C.L.; project administration, A.P.C.L.; funding acquisition, A.P.C.L. and F.I.K.J. All authors have read and agreed on the published version of the manuscript.
Funding
This research was financially supported by the Department of Transportation Engineering, São Carlos Engineering School (EESC), University of São Paulo (USP) and the Coordenação de Aperfeiçoamento de Pessoal de Nível Superior (CAPES; 001).
Institutional Review Board Statement
A Protection of Human Subjects in Research approval was obtained from the Brazilian National Health Council prior to the experiments.
Informed Consent Statement
All subjects gave their informed consent for inclusion before they participated in the study. The study was conducted in accordance with the Declaration of Helsinki, and the protocol was approved by the Ethical Research Committee (CEP) (2.611.849).
Data Availability Statement
No new data were created in this study. Data sharing obtained during the project is not applicable to this article due to legal and privacy issues.
Acknowledgments
The authors acknowledge the University of São Paulo for the support provided to the research activities, the São Paulo Research Foundation (FAPESP) for the financial support, grant 2013/25034-5, the Conselho Nacional de Desenvolvimento Científico e Tecnológico (CNPq), grants 307772/2019-0 and 307772/2019-5, Vi-Grade, Smart Eye and MULTITTECH Engineering.
Conflicts of Interest
The authors declare no conflict of interest. The funders had no role in the design of the study, collection, analysis, or interpretation of data, writing of the manuscript, and decision on the publication of results.
References
- Hassan, H.M.; Abdel-Aty, M. Analysis of drivers’ behavior under reduced visibility conditions using a Structural Equation Modeling approach. Transp. Res. Part. F Traffic Psychol. Behav. 2011, 14, 614–625. [Google Scholar] [CrossRef]
- Khan, M.N.; Ghasemzadeh, A.; Ahmed, M.M. Investigating the impact of fog on freeway speed selection using the SHRP2 naturalistic driving study data. Transp. Res. Rec. 2018, 2672, 93–104. [Google Scholar] [CrossRef]
- Ni, R.; Bian, Z.; Guindon, A.; Andersen, G.J. Aging and the detection of imminent collisions under simulated fog conditions. Accid. Anal. Prev. 2012, 49, 525–531. [Google Scholar] [CrossRef] [PubMed] [Green Version]
- Serafin, C. Driver Eye Fixations on Rural Roads: Insight into Safe Driving Behavior. Security 1994, 1–72. Available online: https://deepblue.lib.umich.edu/bitstream/handle/2027.42/1069/86718.0001.001.pdf?sequence=2 (accessed on 27 June 2021).
- Rosey, F.; Aillerie, I.; Espié, S.; Vienne, F. Driver behaviour in fog is not only a question of degraded visibility—A simulator study. Saf. Sci. 2017, 95, 50–61. [Google Scholar] [CrossRef]
- Ahmed, M.M.; Abdel-Aty, M.; Lee, J.; Yu, R. Real-time assessment of fog-related crashes using airport weather data: A feasibility analysis. Accid. Anal. Prev. 2014, 72, 309–317. [Google Scholar] [CrossRef]
- Abdel-Aty, M.; Ekram, A.A.; Huang, H.; Choi, K. A study on crashes related to visibility obstruction due to fog and smoke. Accid. Anal. Prev. 2011, 43, 1730–1737. [Google Scholar] [CrossRef] [PubMed]
- Hamilton, B.; Tefft, B.; Arnold, L.; Grabowski, J. Hidden Highways: Fog and Traffic Crashes on America’s Roads; AAA Found. Traffic Saf.: Washington, DC, USA, 2014. [Google Scholar]
- Whiffen, B.; Delannoy, P.; Siok, S. Fog: Impact on Road Transportation and Mitigation Options. In Proceedings of the National Highway Visibility Conference, Madison, WI, USA, 18−19 May 2004; pp. 1–12. [Google Scholar]
- DPRF Dados Abertos das Rodovias Federais. Available online: https://www.prf.gov.br/portal/dados-abertos (accessed on 13 June 2021).
- Chen, C.; Zhao, X.; Liu, H.; Ren, G.; Liu, X. Influence of adverse weather on drivers’ perceived risk during car following based on driving simulations. J. Mod. Transp. 2019, 27, 282–292. [Google Scholar] [CrossRef] [Green Version]
- Yan, X.; Xue, Q.; Ma, L.; Xu, Y. Driving-simulator-based test on the effectiveness of auditory red-light running vehicle warning system based on time-to-collision sensor. Sensors 2014, 14, 3631–3651. [Google Scholar] [CrossRef] [PubMed]
- Wu, Y.; Abdel-Aty, M.; Cai, Q.; Lee, J.; Park, J. Developing an algorithm to assess the rear-end collision risk under fog conditions using real-time data. Transp. Res. Part. C Emerg. Technol. 2018, 87, 11–25. [Google Scholar] [CrossRef]
- Velichkovsky, B.M.; Rothert, A.; Miniotas, D.; Dornhofer, S.M.; Joos, M.; Pannasch, S. Visual fixations as a rapid indicator of hazard perception. NATO Sci. Ser. SUB Ser. I LIFE Behav. Sci. 2003, 355, 313–322. [Google Scholar]
- Chapman, P.R.; Underwood, G. Visual search of driving situations: Danger and experience. Perception 1998, 27, 951–964. [Google Scholar] [CrossRef] [PubMed] [Green Version]
- Zhang, Y.; Yan, X.; Li, X.; Xue, Q. Drivers’ eye movements as a function of collision avoidance warning conditions in red light running scenarios. Accid. Anal. Prev. 2016, 185–197. [Google Scholar] [CrossRef] [Green Version]
- Konstantopoulos, P.; Chapman, P.; Crundall, D. Driver’s visual attention as a function of driving experience and visibility. Using a driving simulator to explore drivers’ eye movements in day, night and rain driving. Accid. Anal. Prev. 2010, 42, 827–834. [Google Scholar] [CrossRef] [PubMed]
- Fisher, D.L.; Lee, J.D.; Rizzo, M.; Caird, J. Handbook of Driving Simulation for Engineering, Medicine, and Psychology; CRC Press: Boca Raton, FL, USA, 2011; ISBN 1420061011. [Google Scholar]
- Larocca, A.P.C.; Ribeiro, R.L.; da Cruz Figueira, A.; Lulio, L.C.; Rangel, M.A.C. Analysis of perception of vertical signaling of highways by drivers in a simulated driving environment. Transp. Res. Part. F Traffic Psychol. Behav. 2018, 58, 471–487. [Google Scholar] [CrossRef]
- Figueira, A.C.; Larocca, A.P.C. Analysis of the factors influencing overtaking in two-lane highways: A driving simulator study. Transp. Res. Part. F Traffic Psychol. Behav. 2020, 69, 38–48. [Google Scholar] [CrossRef]
- Dols, J.F.; Molina, J.; Camacho-Torregrosa, F.J.; Llopis-Castelló, D.; García, A. Development of driving simulation scenarios based on building information modeling (BIM) for road safety analysis. Sustainability 2021, 13, 2039. [Google Scholar] [CrossRef]
- Matthews, G.; Saxby, D.J.; Funke, G.J.; Emo, A.K.; Desmond, P.A. Driving in states of fatigue or stress. In Handbook of Driving Simulation for Engineering, Medicine, and Psychology; CRC Press: Boca Raton, FL, USA, 2011; pp. 29-1–29-11. [Google Scholar]
- Baulk, S.D.; Biggs, S.N.; Reid, K.J.; van den Heuvel, C.J.; Dawson, D. Chasing the silver bullet: Measuring driver fatigue using simple and complex tasks. Accid. Anal. Prev. 2008, 40, 396–402. [Google Scholar] [CrossRef]
- Matthews, G. Towards a transactional ergonomics for driver stress and fatigue. Theor. Issues Ergon. Sci. 2002, 3, 195–211. [Google Scholar] [CrossRef]
- Ramaekers, J.G.; Moeller, M.R.; Theunissen, E.L.; Kauert, G.F. Validity of three experimental performance tests for predicting risk of cannabis induced road crashes. In Handbook of Driving Simulation for Engineering, Medicine, and Psychology; CRC Press: Boca Raton, FL, USA, 2011; pp. 45-1–45-8. [Google Scholar]
- Ortiz-Peregrina, S.; Ortiz, C.; Anera, R.G. Aggressive Driving Behaviours in Cannabis Users. The Influence of Consumer Characteristics. Int. J. Environ. Res. Public Health Artic. Int. J. Environ. Res. Public Health 2021, 18, 3911. [Google Scholar] [CrossRef]
- Grotenhermen, F.; Leson, G.; Berghaus, G.; Drummer, O.H.; Krüger, H.P.; Longo, M.; Moskowitz, H.; Perrine, B.; Ramaekers, J.G.; Smiley, A.; et al. Developing limits for driving under cannabis. Addiction 2007, 102, 1910–1917. [Google Scholar] [CrossRef]
- Sullman, M.J.M.; Baas, P.H. Mobile phone use amongst New Zealand drivers. Transp. Res. Part. F Traffic Psychol. Behav. 2004, 7, 95–105. [Google Scholar] [CrossRef]
- Vieira, F.S.; Larocca, A.P.C. Drivers’ speed profile at curves under distraction task. Transp. Res. Part. F Traffic Psychol. Behav. 2017, 44, 12–19. [Google Scholar] [CrossRef]
- Strayer, D.L.; Drews, F.A.; Crouch, D.J. A Comparison of the Cell Phone Driver and the Drunk Driver. Hum. Factors 2006, 48, 381–391. [Google Scholar] [CrossRef]
- Bella, F. Driving simulator for speed research on two-lane rural roads. Accid. Anal. Prev. 2008, 40, 1078–1087. [Google Scholar] [CrossRef]
- Lucas, F.R.; Russo, L.E.A.; Kawashima, R.S.; Figueira, A.C.; Larocca, A.P.C.; Kabbach, F.I., Jr. Use of driving simulators Applied to road safety project. Bol. Ciencias Geod. 2013, 19, 341–352. [Google Scholar] [CrossRef] [Green Version]
- Yang, G.; Ahmed, M.; Gaweesh, S.; Adomah, E. Connected vehicle real-time traveler information messages for freeway speed harmonization under adverse weather conditions: Trajectory level analysis using driving simulator. Accid. Anal. Prev. 2020, 146, 105707. [Google Scholar] [CrossRef] [PubMed]
- Yan, X.; Li, X.; Liu, Y.; Zhao, J. Effects of foggy conditions on drivers’ speed control behaviors at different risk levels. Saf. Sci. 2014. [Google Scholar] [CrossRef]
- Bella, F.; Silvestri, M. Effects of directional auditory and visual warnings at intersections on reaction times and speed reduction times. Transp. Res. Part. F Traffic Psychol. Behav. 2017, 51, 88–102. [Google Scholar] [CrossRef]
- Brooks, J.O.; Crisler, M.C.; Klein, N.; Goodenough, R.; Beeco, R.W.; Guirl, C.; Tyler, P.J.; Hilpert, A.; Miller, Y.; Grygier, J.; et al. Speed choice and driving performance in simulated foggy conditions. Accid. Anal. Prev. 2011, 43, 698–705. [Google Scholar] [CrossRef]
- Mueller, A.S.; Trick, L.M. Driving in fog: The effects of driving experience and visibility on speed compensation and hazard avoidance. Accid. Anal. Prev. 2012, 48, 472–479. [Google Scholar] [CrossRef]
- dos Santos, M.I.; Meira, P.T.; de Oliveira, S.; Ribeiro, R.L.; Larocca, A.P.C.; Junior, F.I.K. Conceito, configuração e aplicação de um simulador de direção no Brasil – Estudo de caso. Transportes 2017, 25, 1. [Google Scholar] [CrossRef]
- Figueira, A.C.; Larocca, A.P.C. Proposal of a driver profile classification in relation to risk level in overtaking maneuvers. Transp. Res. Part. F Traffic Psychol. Behav. 2020, 74, 375–385. [Google Scholar] [CrossRef]
- de Campos, C.I.; Marcomini, L.A.; Panice, N.R.; Piva, F.J.; Larocca, A.P.C. Perception analysis of highway quality of service using a driving simulator and eye tracking system. Transportes 2020, 28, 165–179. [Google Scholar] [CrossRef]
- Wu, Y.; Abdel-Aty, M.; Park, J.; Zhu, J. Effects of crash warning systems on rear-end crash avoidance behavior under fog conditions. Transp. Res. Part. C Emerg. Technol. 2018, 95, 481–492. [Google Scholar] [CrossRef]
- Park, J.; Abdel-Aty, M.; Wu, Y.; Mattei, I. Enhancing In-Vehicle Driving Assistance Information Under Connected Vehicle Environment. IEEE Trans. Intell. Transp. Syst. 2019, 20, 3558–3567. [Google Scholar] [CrossRef]
Figure 1.
Simulator’s physical structure.
Figure 1.
Simulator’s physical structure.
Figure 2.
Eye tracking recorder software.
Figure 2.
Eye tracking recorder software.
Figure 3.
Layout of the section under study and identification of curves.
Figure 3.
Layout of the section under study and identification of curves.
Figure 4.
Aerial image of the curves analyzed.
Figure 4.
Aerial image of the curves analyzed.
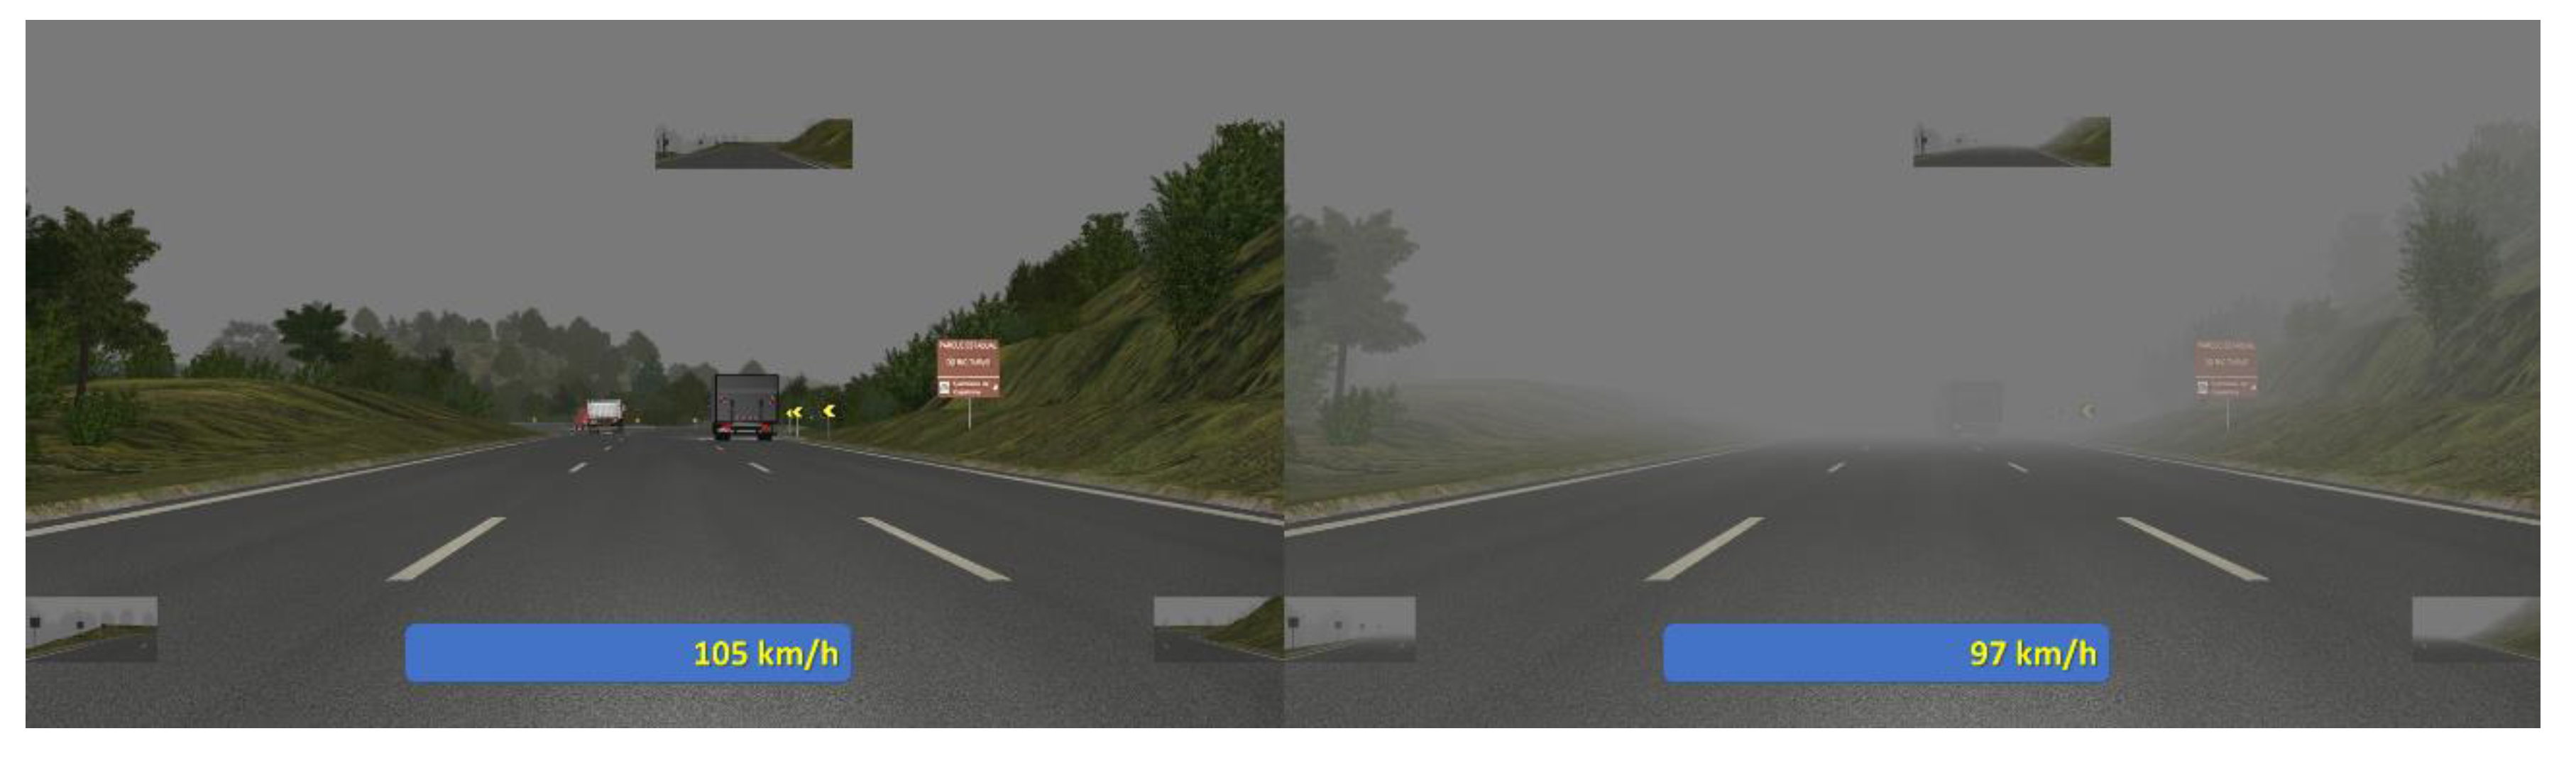
Figure 5.
Screenshots of the simulated scenarios. Comparison between absence (left) and presence (right) of fog in the stretch after 6th curve.
Figure 5.
Screenshots of the simulated scenarios. Comparison between absence (left) and presence (right) of fog in the stretch after 6th curve.
Figure 6.
Boxplot for number of fixations. The participants performed approximately 23 fixations in the foggy scenario and around 18.5 in a clear one. The change occurred was greater than expected by chance; a statistically significant difference (p ≤ 0.001) was detected.
Figure 6.
Boxplot for number of fixations. The participants performed approximately 23 fixations in the foggy scenario and around 18.5 in a clear one. The change occurred was greater than expected by chance; a statistically significant difference (p ≤ 0.001) was detected.
Figure 7.
Boxplot for mean of fixations durations—0.617 s in clear scenario and 0.634 under fog. The change from the treatment was not great enough for excluding the possibility of the difference being due to chance (p = 0.218). Power of performed test with alpha = 0.050: 0.107, which is below the desired power of 0.800, indicating lower probability of detecting a difference when one actually exists.
Figure 8.
Boxplot for pupil diameter. The participants´ pupil diameters were approximately 0.411 cm in the foggy scenario and around 0.458 cm in the clear one. The change from the treatment was greater than that expected by chance, showing a statistically significant difference (p ≤ 0.001).
Figure 8.
Boxplot for pupil diameter. The participants´ pupil diameters were approximately 0.411 cm in the foggy scenario and around 0.458 cm in the clear one. The change from the treatment was greater than that expected by chance, showing a statistically significant difference (p ≤ 0.001).
Figure 9.
The upper image shows an example of a comparative spread of search between clear (left) and foggy (right) scenarios for one of the participants, and the picture behind indicates the regions where the illustrated fixations might be allocated.
Figure 9.
The upper image shows an example of a comparative spread of search between clear (left) and foggy (right) scenarios for one of the participants, and the picture behind indicates the regions where the illustrated fixations might be allocated.
Figure 10.
Example of polygons shaped by points tracked in clear (red) and foggy (blue) scenarios for one of the participants.
Figure 10.
Example of polygons shaped by points tracked in clear (red) and foggy (blue) scenarios for one of the participants.
Figure 11.
Boxplot for area tracked. The participants tracked approximately 0.0561 m2 of screen in the foggy scenario and around 0.0789 m2 in the clear one. The change from the treatment was greater than expected by chance, showing a statistically significant change (p = 0.001).
Figure 11.
Boxplot for area tracked. The participants tracked approximately 0.0561 m2 of screen in the foggy scenario and around 0.0789 m2 in the clear one. The change from the treatment was greater than expected by chance, showing a statistically significant change (p = 0.001).
Table 1.
Wilcoxon Signed Rank Test for number of fixations.
Table 1.
Wilcoxon Signed Rank Test for number of fixations.
| Group | N | Missing | Median | 25% | 75% |
|---|
| No Fog | 38 | 0 | 18.500 | 14.000 | 22.000 |
| Fog | 38 | 0 | 23.000 | 18.750 | 27.000 |
Table 2.
Paired t-test for mean fixations durations.
Table 2.
Paired t-test for mean fixations durations.
| Treatment Name | N | Missing | Mean | Std Dev | SEM |
|---|
| No Fog | 38 | 0 | 0.617 | 0.0744 | 0.0121 |
| Fog | 38 | 0 | 0.634 | 0.0525 | 0.0085 |
| Difference | 38 | 0 | −0.0169 | 0.0833 | 0.0135 |
Table 3.
Wilcoxon Signed Rank Test for pupil diameter.
Table 3.
Wilcoxon Signed Rank Test for pupil diameter.
| Group | N | Missing | Median | 25% | 75% |
|---|
| No fog | 38 | 0 | 0.00458 | 0.00390 | 0.00491 |
| Fog | 38 | 0 | 0.00411 | 0.00369 | 0.00490 |
Table 4.
Paired t-test for area tracked.
Table 4.
Paired t-test for area tracked.
| Treatment Name | N | Missing | Mean | Std Dev | SEM |
|---|
| No fog | 38 | 0 | 0.0789 | 0.0404 | 0.00655 |
| Fog | 38 | 0 | 0.0561 | 0.0234 | 0.00380 |
| Difference | 38 | 0 | 0.0228 | 0.0396 | 0.00642 |
| Publisher’s Note: MDPI stays neutral with regard to jurisdictional claims in published maps and institutional affiliations. |
© 2021 by the authors. Licensee MDPI, Basel, Switzerland. This article is an open access article distributed under the terms and conditions of the Creative Commons Attribution (CC BY) license (https://creativecommons.org/licenses/by/4.0/).


