Article

Effects of Variable Weather Conditions on Baled Proportion of Varied Amounts of Harvestable Cereal Straw, Based on Simulations

1
Independent Researcher, 172 40 Stockholm, Sweden
2
Department of Agriculture and Food, Research Institutes of Sweden (RISE), 750 07 Uppsala, Sweden
*
Author to whom correspondence should be addressed.
Sustainability 2021, 13(16), 9449; https://doi.org/10.3390/su13169449
Submission received: 21 June 2021 / Revised: 17 August 2021 / Accepted: 18 August 2021 / Published: 23 August 2021
(This article belongs to the Topic Actions for Bioenergy and Biofuels: A Sustainable Shift)

Abstract

:
All harvestable cereal straw cannot be collected every year in regions where wet periods are probable during the baling season, so some Swedish studies have used ’recovery coefficients’ to estimate potential harvestable amounts. Current Swedish recovery coefficients were first formulated by researchers in the early 1990s, after discussions with crop advisors, but there are no recent Swedish publications on available baling times and recovery proportions. Therefore, this study evaluated baling operations over a series of years for representative virtual farms and machine systems in four Swedish regions, to determine the available time for baling, baled straw ratio and annual variation in both. The hourly grain moisture content of pre-harvested cereals and swathed straw was estimated using moisture models and real weather data for 22/23 years, and the results were used as input to a model for simulating harvesting and baling operations. Expected available baling time during August and September was estimated to be 39–49%, depending on region, with large annual variation (standard deviation 22%). The average baling coefficient was estimated to be 80–86%, with 1400 t·year−1 harvestable straw and 15 t·h−1 baling capacity, and the annual variation was also considerable (s.d. 20%).

1. Introduction

Cereal straw is a sustainable and renewable resource that has been used for various purposes for centuries [1] Considerable amounts of this residue are available in many regions (e.g., [1,2,3,4]), where it can be used in the energy sector as part of the green energy supply and in efforts to mitigate climate change (e.g., [5,6]). Extensive re-use of biomass, including straw and waste resources, would also generate other beneficial effects, such as (a) progress towards a biobased economy centred on biological and renewable resources (e.g., [7,8,9,10]), (b) creation of job opportunities in rural areas, strengthening the rural economy and promoting sustainable development (e.g., [5,6,9,11,12]), (c) raw material for biobased industries (e.g., biobased textiles) and (d) raw material for second-generation biofuels (e.g., biomethane, bioethanol) or cogeneration of heat and electricity (e.g., [5,13,14,15,16]). Use of biomass and wastes in this way to contribute to a circular economy would reduce overexploitation of non-renewable resources and decrease greenhouse gas emissions (e.g., [7,9,16,17,18]).
The total amounts of crop residues produced in the European Union-27 (EU-27) are significant. Based on data for the period 1997–2008, Scarlat et al. [3] estimated total production to be 258 M dry tonnes/year. However, not all harvestable straw can be removed, as local conditions may require all or part of the straw to be incorporated into the soil, to maintain or improve soil organic matter content and cultivation properties. According to Scarlat et al. [3], there is a sustainable collectable amount of 111 M dry tonnes of crop residues/year on average in the EU-27, when considering environmental and harvesting constraints, with the annual amount ranging from 86 to 133 M tonnes over a 10-year period. A proportion of the collectable total, around 28 M tonnes, is used in animal production or for purposes other than energy, leaving an estimated 87 M tonnes per year available for bioenergy purposes [3]. In a review of multiple studies, Kretschmer et al. [1] reported similar estimates, i.e., 50–127 M dry tonnes/year of agricultural residues (mainly cereal straw) available for bioenergy purposes or new uses in the EU-27. However, this potential is unevenly distributed and mainly concentrated in France, Germany, Poland, Romania, Italy, Hungary and Spain [1].
The significant amounts of agricultural residues available in the EU-27 represent an important resource for supplying renewable and sustainable bioenergy. Based on data for the period 1997–2008, Scarlat et al. [3] estimated that these residues can make a potential contribution of 3.2% on average to final energy consumption. Hence, agricultural residues can contribute significantly to achieving the EU-27 target of “at least 32% energy from renewable sources in the Union’s gross final consumption of energy in 2030” [6,19].
In Sweden, the potential amount of straw available for fuel purposes is estimated at approximately 1 million tonnes per year, which corresponds to 3–4 TWh or 300,000–400,000 m3 diesel [20]. This study focused mainly on bioenergy and biofuel applications using this renewable and sustainable agricultural residue.
However, straw as a fuel has the following major limitations:
  • It is a bulky material, even when compacted
  • It is a biological, hygroscopic and degradable material that needs to be stored at moisture content <18% (wet basis, w.b.) to avoid spoilage due to mould growth
  • The collection period is short (a few weeks), particularly in the Nordic countries
  • Annual supply varies, mainly due to yearly yield differences and recovery difficulties due to wet weather conditions during baling
  • Weather variations mean that the time available for cereal harvesting and straw recovery operations varies between years
  • The annual amounts of straw expected to be collected are uncertain and therefore planning its use is difficult at both farm and regional levels [21,22].
Approximately one-third of days during the Swedish baling period (August–September) are rainy (≥0.5 mm) in the main cereal production regions and there is great monthly variation. Average air relative humidity is approximately 81% and the variation is also considerable (data from SMHI, period 1990–2018, own compilation [23]). This means that the Swedish weather conditions for straw baling are troublesome, particularly in some years.
As all harvestable straw cannot be collected every year, due to climate factors, delayed crop maturity, lack of time or resources due to other farm operations etc., Henriksson & Stridsberg proposed in 1992 [24] that the harvestable straw amounts in Sweden be multiplied by a specific factor, a ‘recovery coefficient’ (0.4 to 0.8 depending on the cereal crop and region), to estimate potential quantities that can be harvested.
These recovery coefficients were developed after discussions with crop advisors and were based on cultivation conditions and machine systems existing in the 1980s. Later Swedish studies have used them at the farm or national level (e.g., [21,24,25,26,27,28]). An advantage of recovery coefficients is that they are easy to use when harvest index (ratio between grain yield and aboveground biomass) or grain/straw ratio and grain yield are known, which is the case in Sweden. The drawbacks of recovery coefficients are their poor correlation with cereal yield [20,22], in addition, yields are subject to considerable annual variation in Sweden [29].
The straw recovery process is complex and dependent on multiple factors. Some factors are more or less well known at the farm level, e.g., crop grown, expected straw yield, crop area, number of fields, field size, available machines and their capacity, human resources, etc. An unknown but important consideration for harvesting and straw recovery operations is climate, a less predictable factor, particularly in regions where wet periods can be expected. Grain and straw harvesting operations require low moisture contents of the grain and straw, but the requirements are higher for straw as drying of bales is difficult to carry out at a reasonable cost.
Weather variation also leads to considerable differences in the time available to perform harvesting and baling operations, and weather conditions are difficult to determine and may vary between and within days. However, some knowledge of the expected time available for work is important when planning field operations or when new systems need to be dimensioned (e.g., [30,31]). To avoid the use of an uncertain average available time and, in parallel, to capture possible interactions between crops, machine system, weather and other factors, researchers have developed simulation models where field operations are replicated for a series of years, either on a daily or hourly basis, using historical weather data (e.g., [21,30,31,32,33,34,35,36,37,38,39]).
Straw recovery consists of several steps (baling, bale collection/loading, transport, unloading and storage), which differ depending on the system used. The most uncertain link in this chain is baling, as it requires a low straw moisture content, which in turn is weather-dependent and thus an unpredictable factor.
No assessment of harvestable cereal straw recovery operations under Swedish conditions has been published in recent years. Therefore this study evaluated baling operations over a series of years for representative farm conditions and machine systems in four regions of Sweden with a straw surplus (Västmanland, Östergötland, Västra Götaland and Skåne). The objectives were to determine the available baling time, baled straw recovery ratio and annual variation in these, using simulation and real weather data, thereby contributing to greater utilisation of this resource, supporting bioenergy systems towards sustainability goals.

2. Materials and Methods
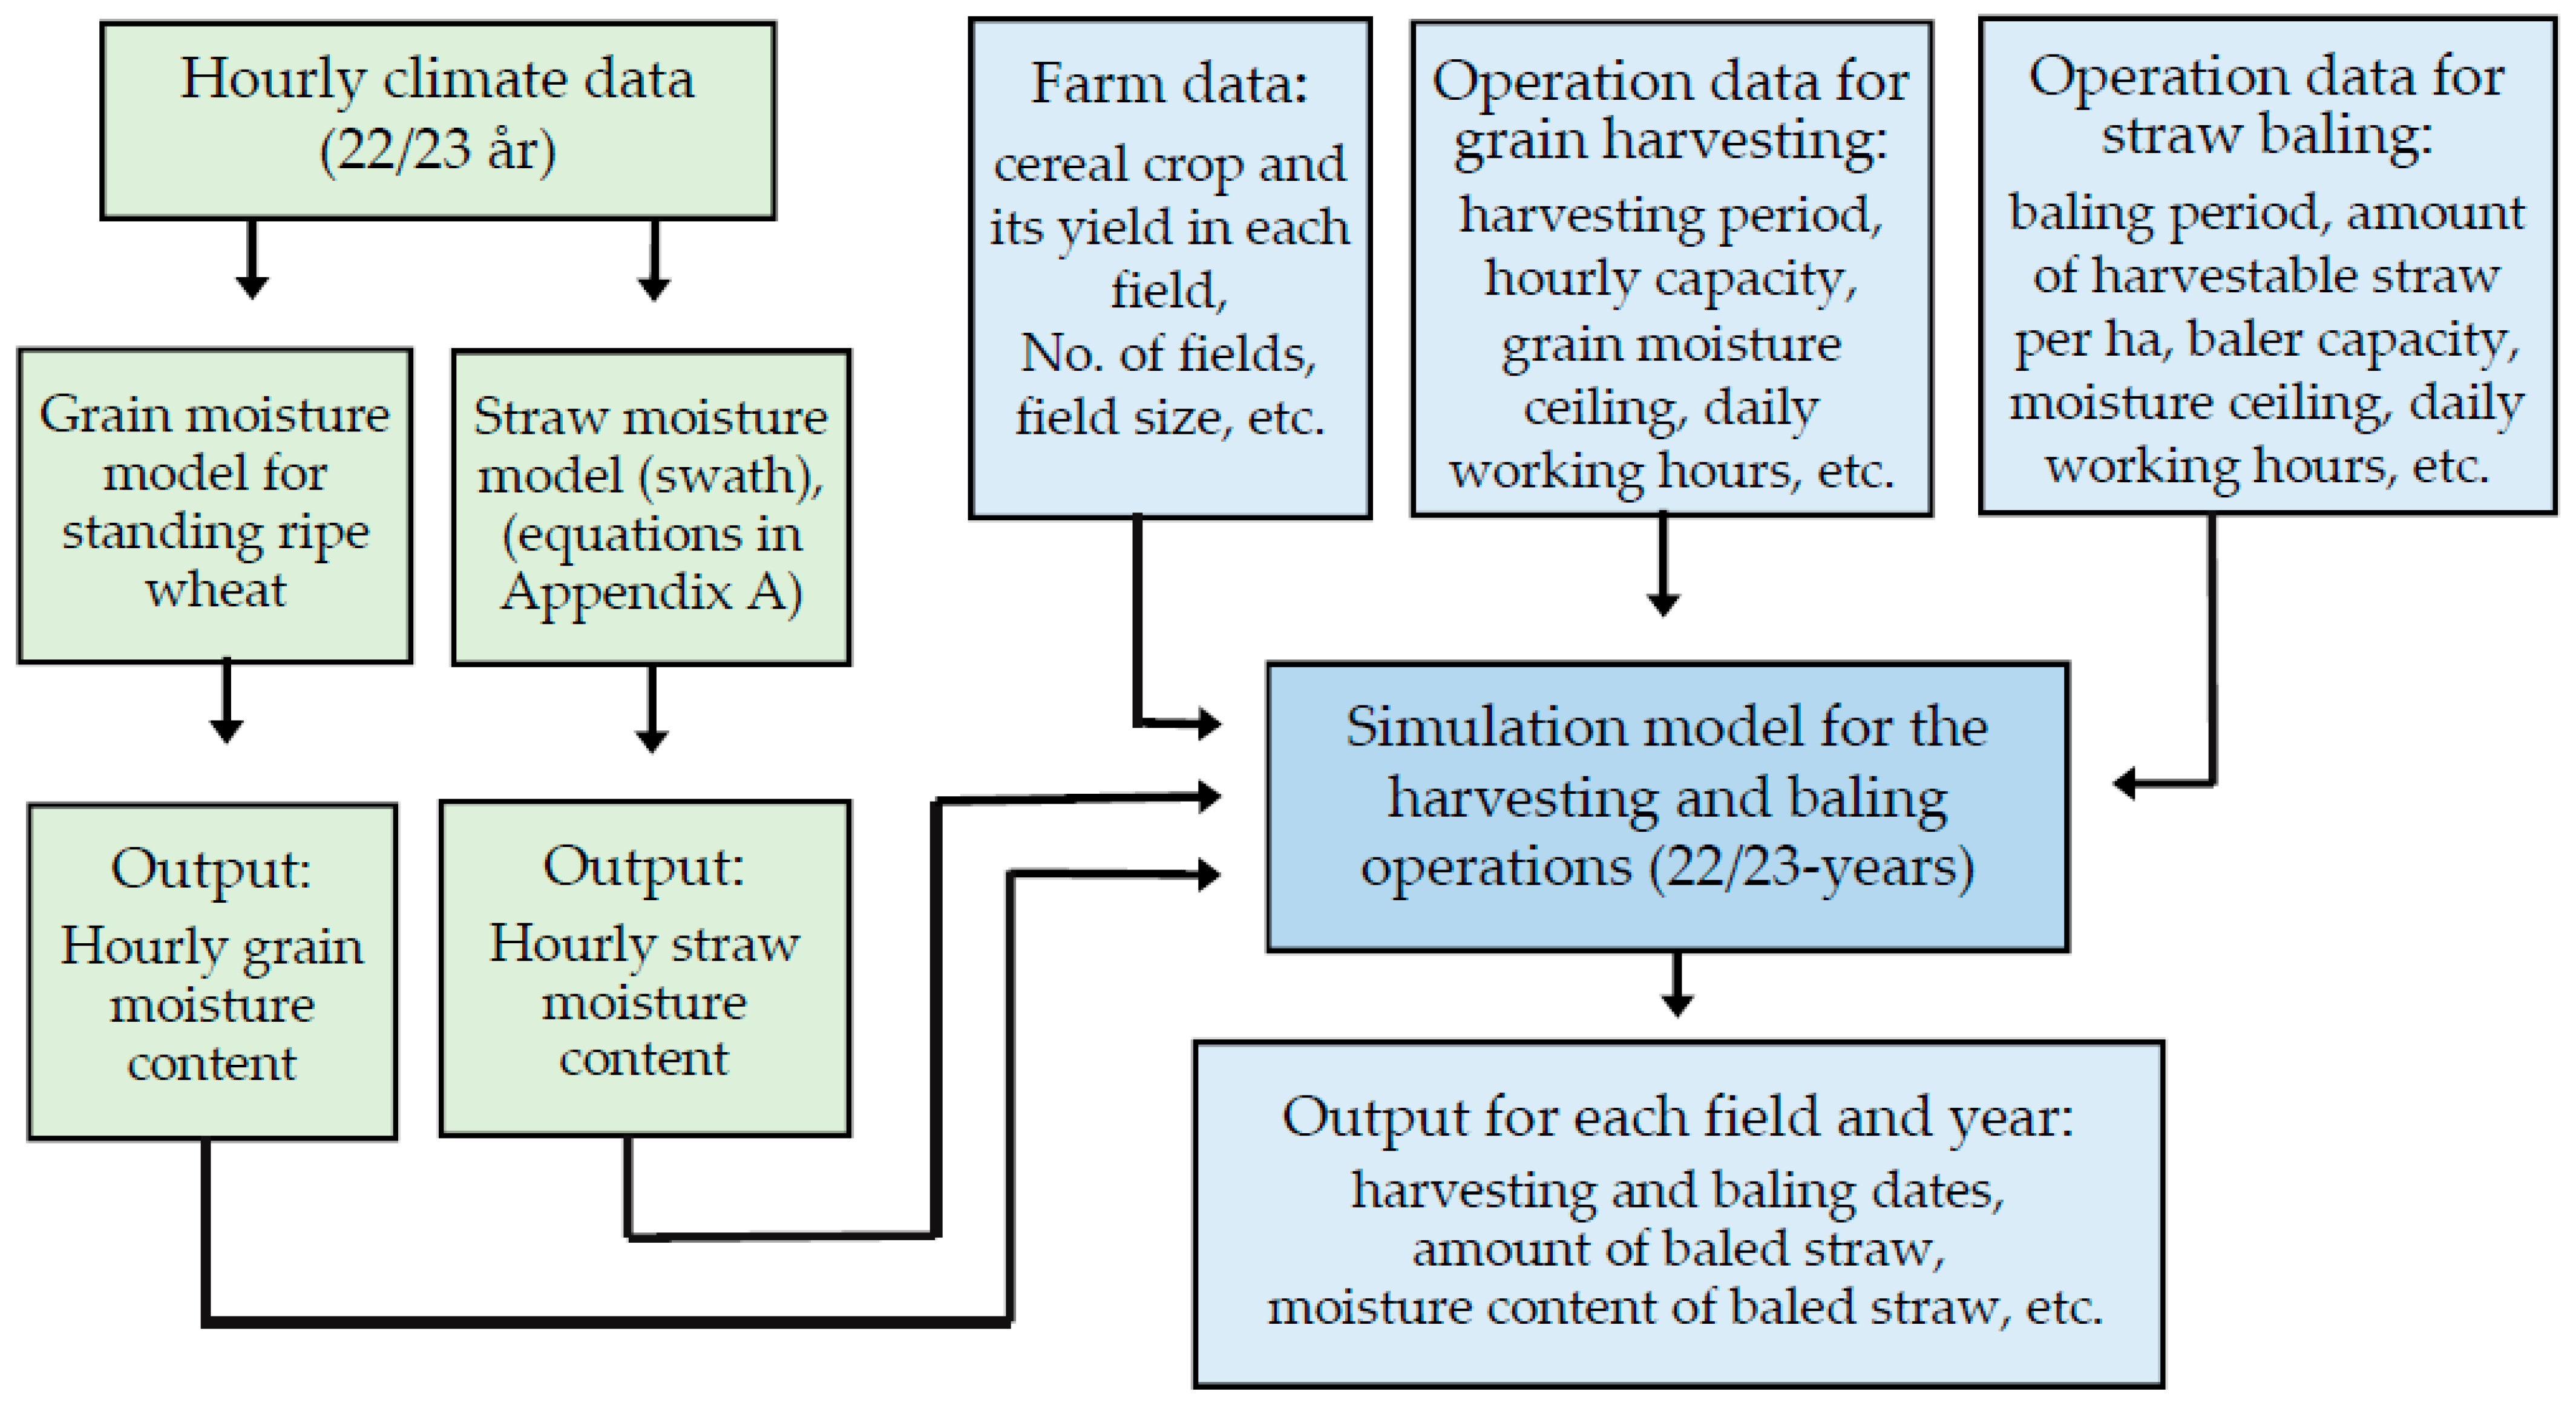
2.1. Outline

The following steps were taken to achieve the objectives of the study (Figure 1):
  • An existing model [30] was applied for predicting hourly grain moisture content of standing ripe winter wheat during 22/23 harvesting seasons
  • A second existing model [40,41] was used for estimating the hourly moisture content of swathed cereal straw during the same 22/23 seasons
  • Predicted moisture content data for grain and straw were used as input to a simulation model for cereal harvesting operations, which included a module for straw baling. The operations were simulated for 22/23 harvesting seasons on an hourly basis
  • Several baling parameters were evaluated on representative virtual farms for the four Swedish regions in terms of their effects on amounts of baled straw, baled straw ratio and annual variation in both.

2.2. Weather Data

The moisture content of ripe standing cereal grain and swathed straw is largely determined by the weather, which in turn affects when harvesting and baling operations can be carried out. The simulation models used in this study to estimate moisture contents require data on the following weather variables on an hourly basis: temperature, precipitation, relative humidity, global radiation, wind speed and cloudiness. These data were obtained from weather stations of the Swedish Meteorological and Hydrological Institute (SMHI [23]) and the Swedish Ordnance Survey [42] for the period from 16 July to 15 October, 1995/1996–2017. For the region of Västmanland, the weather data were downloaded from stations near Västerås (59°36′ N, 16°32′ E), for Östergötland from stations near Linköping (58°24′ N, 15°37′ E), for Västra Götaland from stations near Skara (58°23′ N 13°26.3′ E) and for Skåne from stations near Hörby (55°51′ N, 13°39′ E). Global radiation data were completed using the STRÅNG model [43].

2.3. Estimation of Hourly Moisture Content of Swathed Cereal Straw

A simulation model was used to predict the hourly moisture content of swathed straw. The model was developed under Swedish conditions and is described in detail by Nilsson & Karlsson [40] and Nilsson & Bernesson [41]. The calculations were made in a spreadsheet computer application, employing the equations presented in Appendix A. The results were verified in a field experiment with swathed straw from winter wheat in the Uppsala region (59°51′ N, 17°38′ E) in August 2019 and are depicted in Figure 2.
The model estimates the equilibrium moisture content of swathed straw based on the adsorption (wetting) process, estimating the 18% (w.b.) moisture content equilibrium at 85–90% air relative humidity. At this humidity level, there are risks of mould growth and heat generation in stored bales [44,45,46]. The moisture content at equilibrium with 80% air relative humidity (16% moisture content according to the model), which corresponded to 18% (w.b.) moisture content for the desorption (drying) process [47,48], was used as the moisture ceiling for the baling operation. For further details, see Appendix A.
In a comparison of equilibrium moisture content in yellow and grey straw (i.e., straw that had been exposed to precipitation) from several cereal crops harvested with a straw walker or axial-flow combine harvester, Nilsson & Bernesson [41] found small differences.
All water content values in this study are expressed on a wet basis (w.b.) and all amounts of straw are expressed in kilograms (kg) or metric tonnes (t), unless otherwise stated.

2.4. Simulation Model for Harvesting and Straw Baling Operations

The event-driven model used for simulating harvesting operations [30,31,38] simulates the operation hourly for many years with specific farm conditions (e.g., number of fields, crops, crop area, amount of straw per ha, harvesting capacity, current precipitation, working hours etc.) (Figure 1).
Annual maturation dates of the cereal crops were calculated for each field with a procedure based on daily temperature and photoperiod according to Angus et al. [49]. If the estimated maturity date for a crop fell outside the intervals shown in Table 1, it was assumed that the field maturity date would be the nearest value in the range shown in the table. This was done to avoid extreme values in the simulation model.
The harvesting model, whose functional unit was one hectare, was extended with a module that simulated baling operations, using as input the hourly straw moisture content estimated with a separate model [40,41].
Harvesting and baling operations were simulated for representative virtual farms in the four Swedish regions, with varied harvestable straw quantities for 22/23 years in terms of amounts baled and baled proportions.

2.5. Virtual Farms

The virtual farms were located in the regions of Västmanland, Östergötland, Västra Götaland and Skåne. Table 2 shows the distribution of cereal crops by area on the virtual farms, which corresponds to the county level, and Table 3 shows the standard yields of the main cereal crops for the county.
Straw/grain yield ratio (Table 4) was used to estimate amounts of harvestable straw per hectare for the main cereal crops in the different regions (Table 5).
The effective baling time required to bale 1400 tonnes was approximately 10 days with 15 t·h−1 baling capacity and 9 h·day−1 working time. In a baling period of approximately 45 days, it was most likely that there were a sufficient number of available days for completing the operation in most years.

2.6. Premises and Input Data for Simulating Harvesting and Baling Operations

The following main assumptions, parameters and input data were used in the models for simulating harvesting and baling operations on the virtual farms:
  • Harvestable amount of straw: 600–2800 t·year−1
  • Baling capacity (square bales): 15 t·h−1
  • Daily harvesting capacity: 6% of cereal crop area and 22% grain moisture ceiling for operating (parameters for this operation under Swedish conditions [30])
  • 20 days as a maximum after crop maturation to perform harvesting operations on individual fields to avoid unreasonable delays in the simulations due to precipitation or other reasons (ripening periods are given in Table 1)
  • Daily schedule for harvesting and baling operations: 11.00–20.00 h, including weekends
  • Grain drying capacity was assumed not to be a limiting factor
  • 2 days as a minimum waiting time between harvesting and baling operations, for swathed straw moisture content to reach equilibrium with air relative humidity and for weeds to dry
  • 16 days as a maximum between harvesting and baling operations on individual fields
  • A baling period until September 15, 18, 18 and 22 for Västmanland, Östergötland, Västra Götaland and Skåne, respectively
  • Baling operations carried out by contractors. To replicate a real farm that does not own a large baler and hires a baler only when there are sufficient amounts of dry straw, the following requirements were set to start the operation on a certain day:
    At least 60 tonnes sufficiently dry swathed straw (≤18% w.b.), i.e., approx. 4 h effective baling time
    Straw moisture content ≤18% for at least 4 h on the first day of a baling batch; on the following days the operation continued as long as dry straw was available
  • Number of fields in the virtual farms: 32
  • Individual field data on expected ripening period according to Table 1
  • Maximum precipitation of 0.1 mm in the current simulation hour, resulting in approximately 1.6% higher straw moisture content at around 18% (w.b.) moisture content.

3. Results

3.1. Predicted Moisture Content of Swathed Cereal Straw

The hourly moisture content of swathed straw was estimated using a simulation model and historical weather data for 22/23 years (for further details, see Section 2.3). Figure 3 presents the mean available time for baling when straw moisture content did not exceed 18% (w.b.) during daytime for the four regions. The regional estimation can be considered the expected available baling time.
The available time decreased from approximately 50–55% in the second half of July to approximately 20% during the first two weeks of October for all regions except Östergötland, which showed 5–10% higher available baling time. The annual variation for 15-day periods was large, as indicated by the standard deviation (error bars in Figure 3) (22% on average considering all regions and 15-day periods).
Figure 4 shows the estimated available baling time per year in August and September for the Skåne region. In some years (e.g., 1998) this time was very short throughout the whole season, while in other years (e.g., 1995, 2001, 2006 and 2007) it was very short during one month. The yearly variation was even larger for 15-day periods. The other regions studied displayed a similar pattern as in Figure 4. Variation in available baling time makes straw recovery an uncertain process, demanding high baling capacity in Sweden, particularly during years with unfavourable weather conditions.

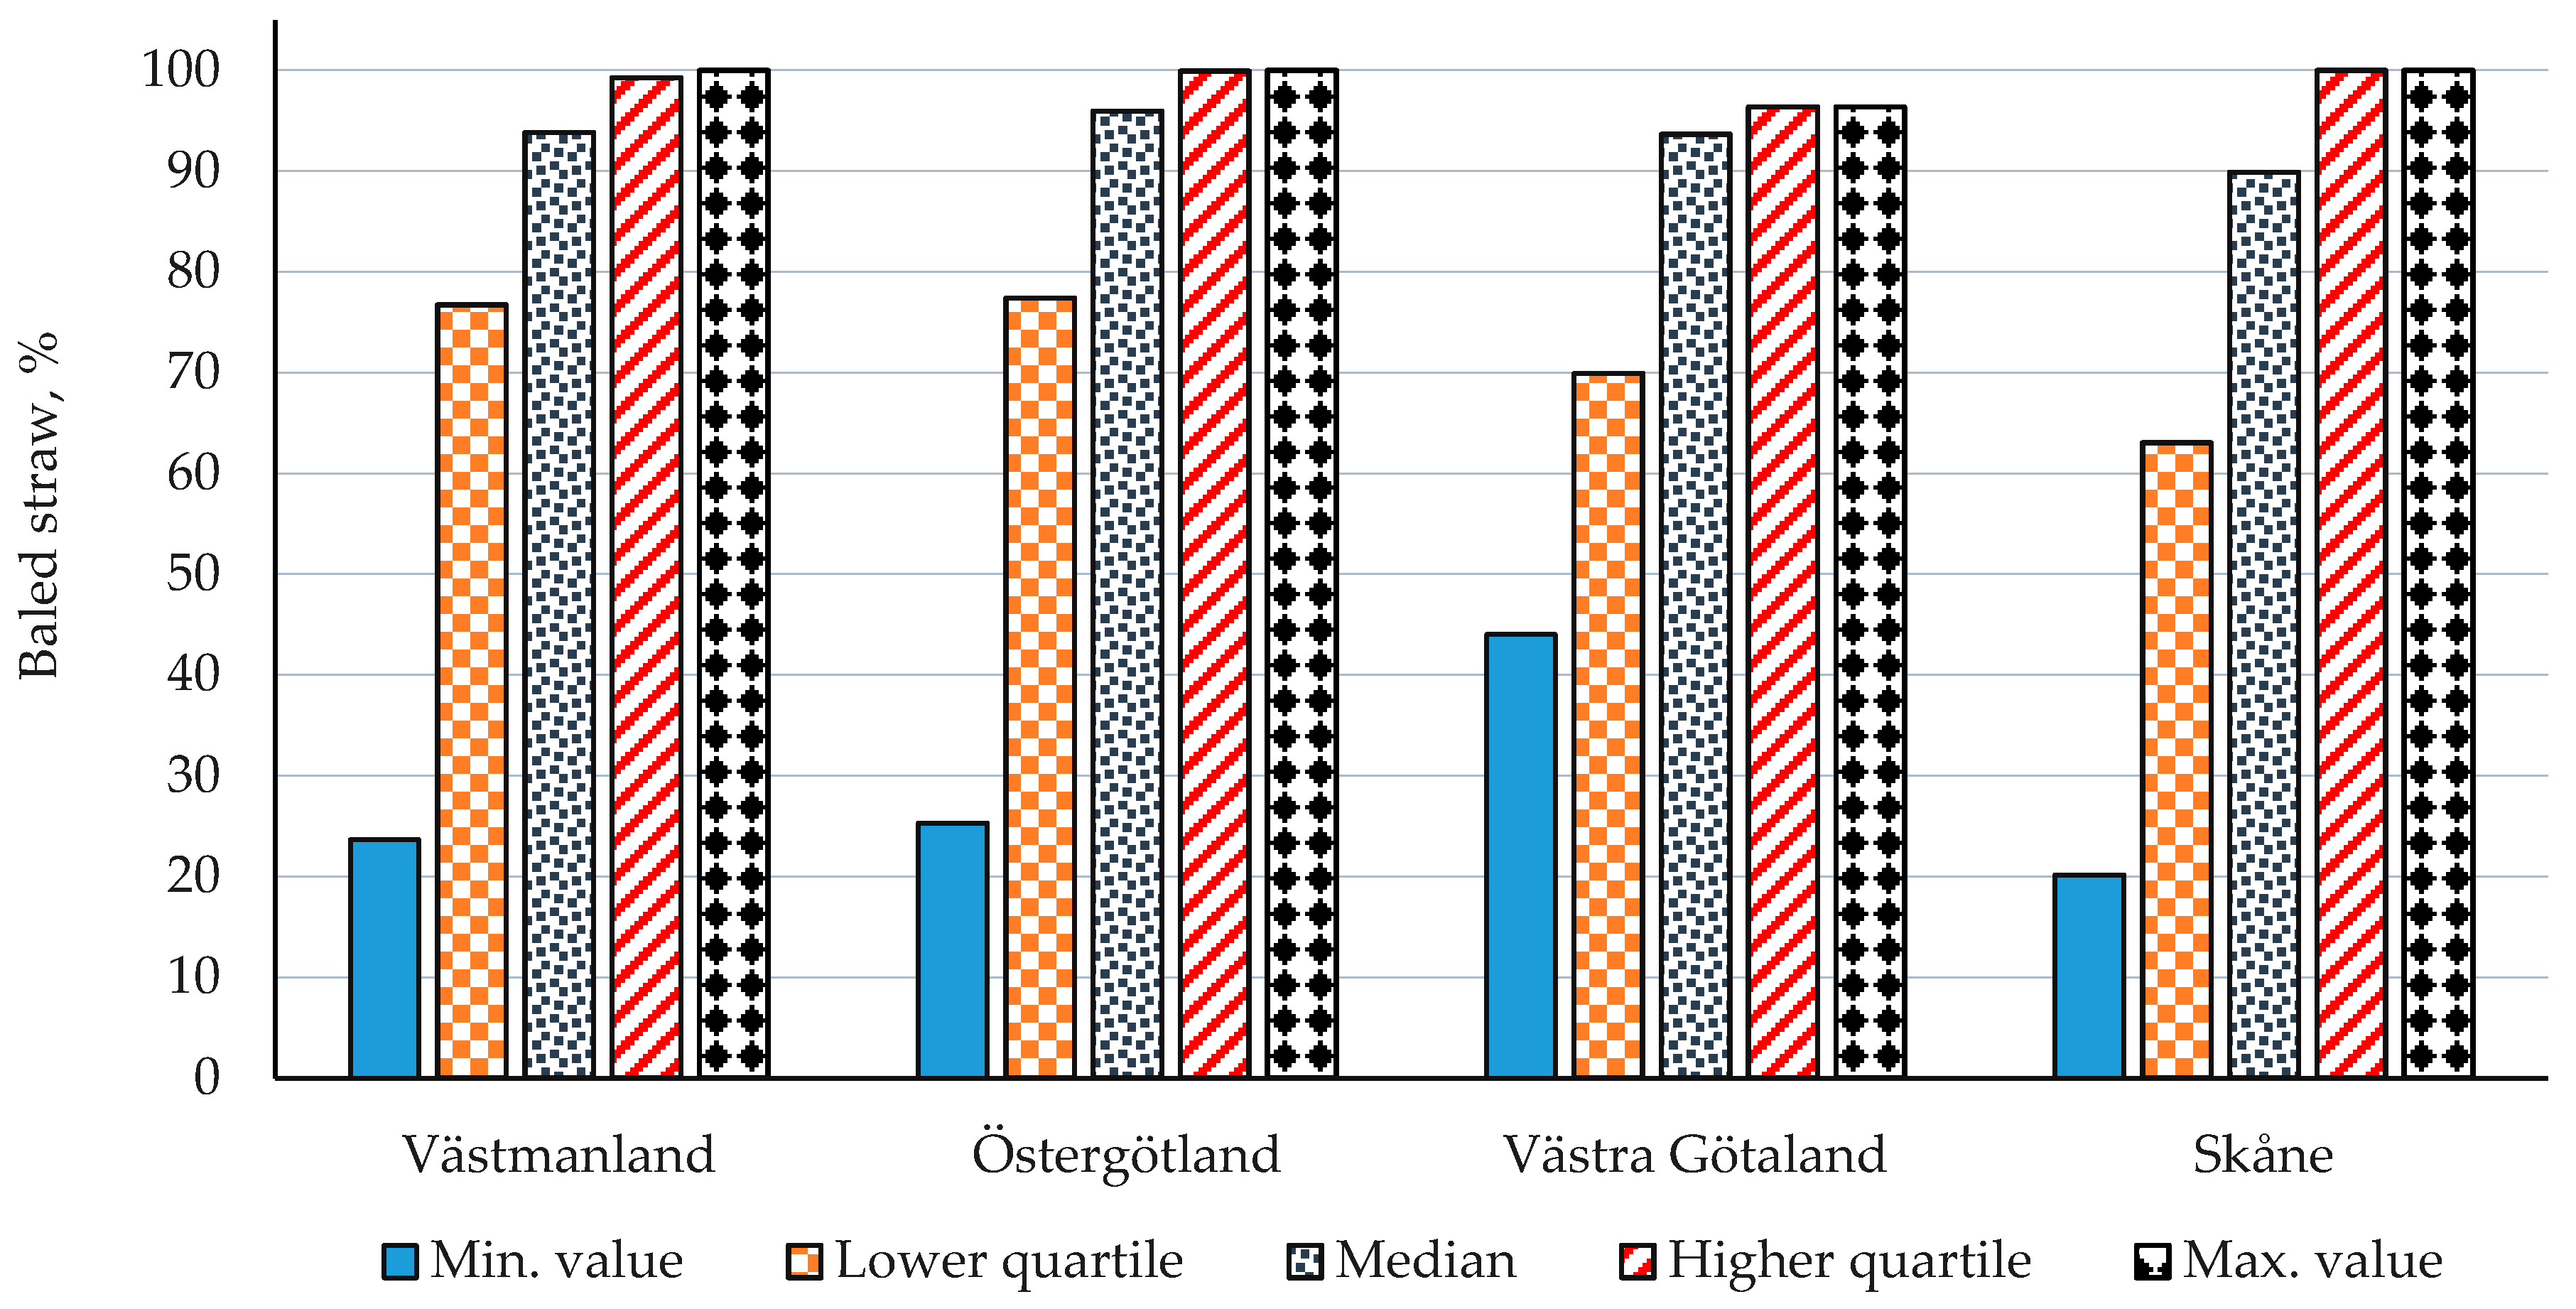
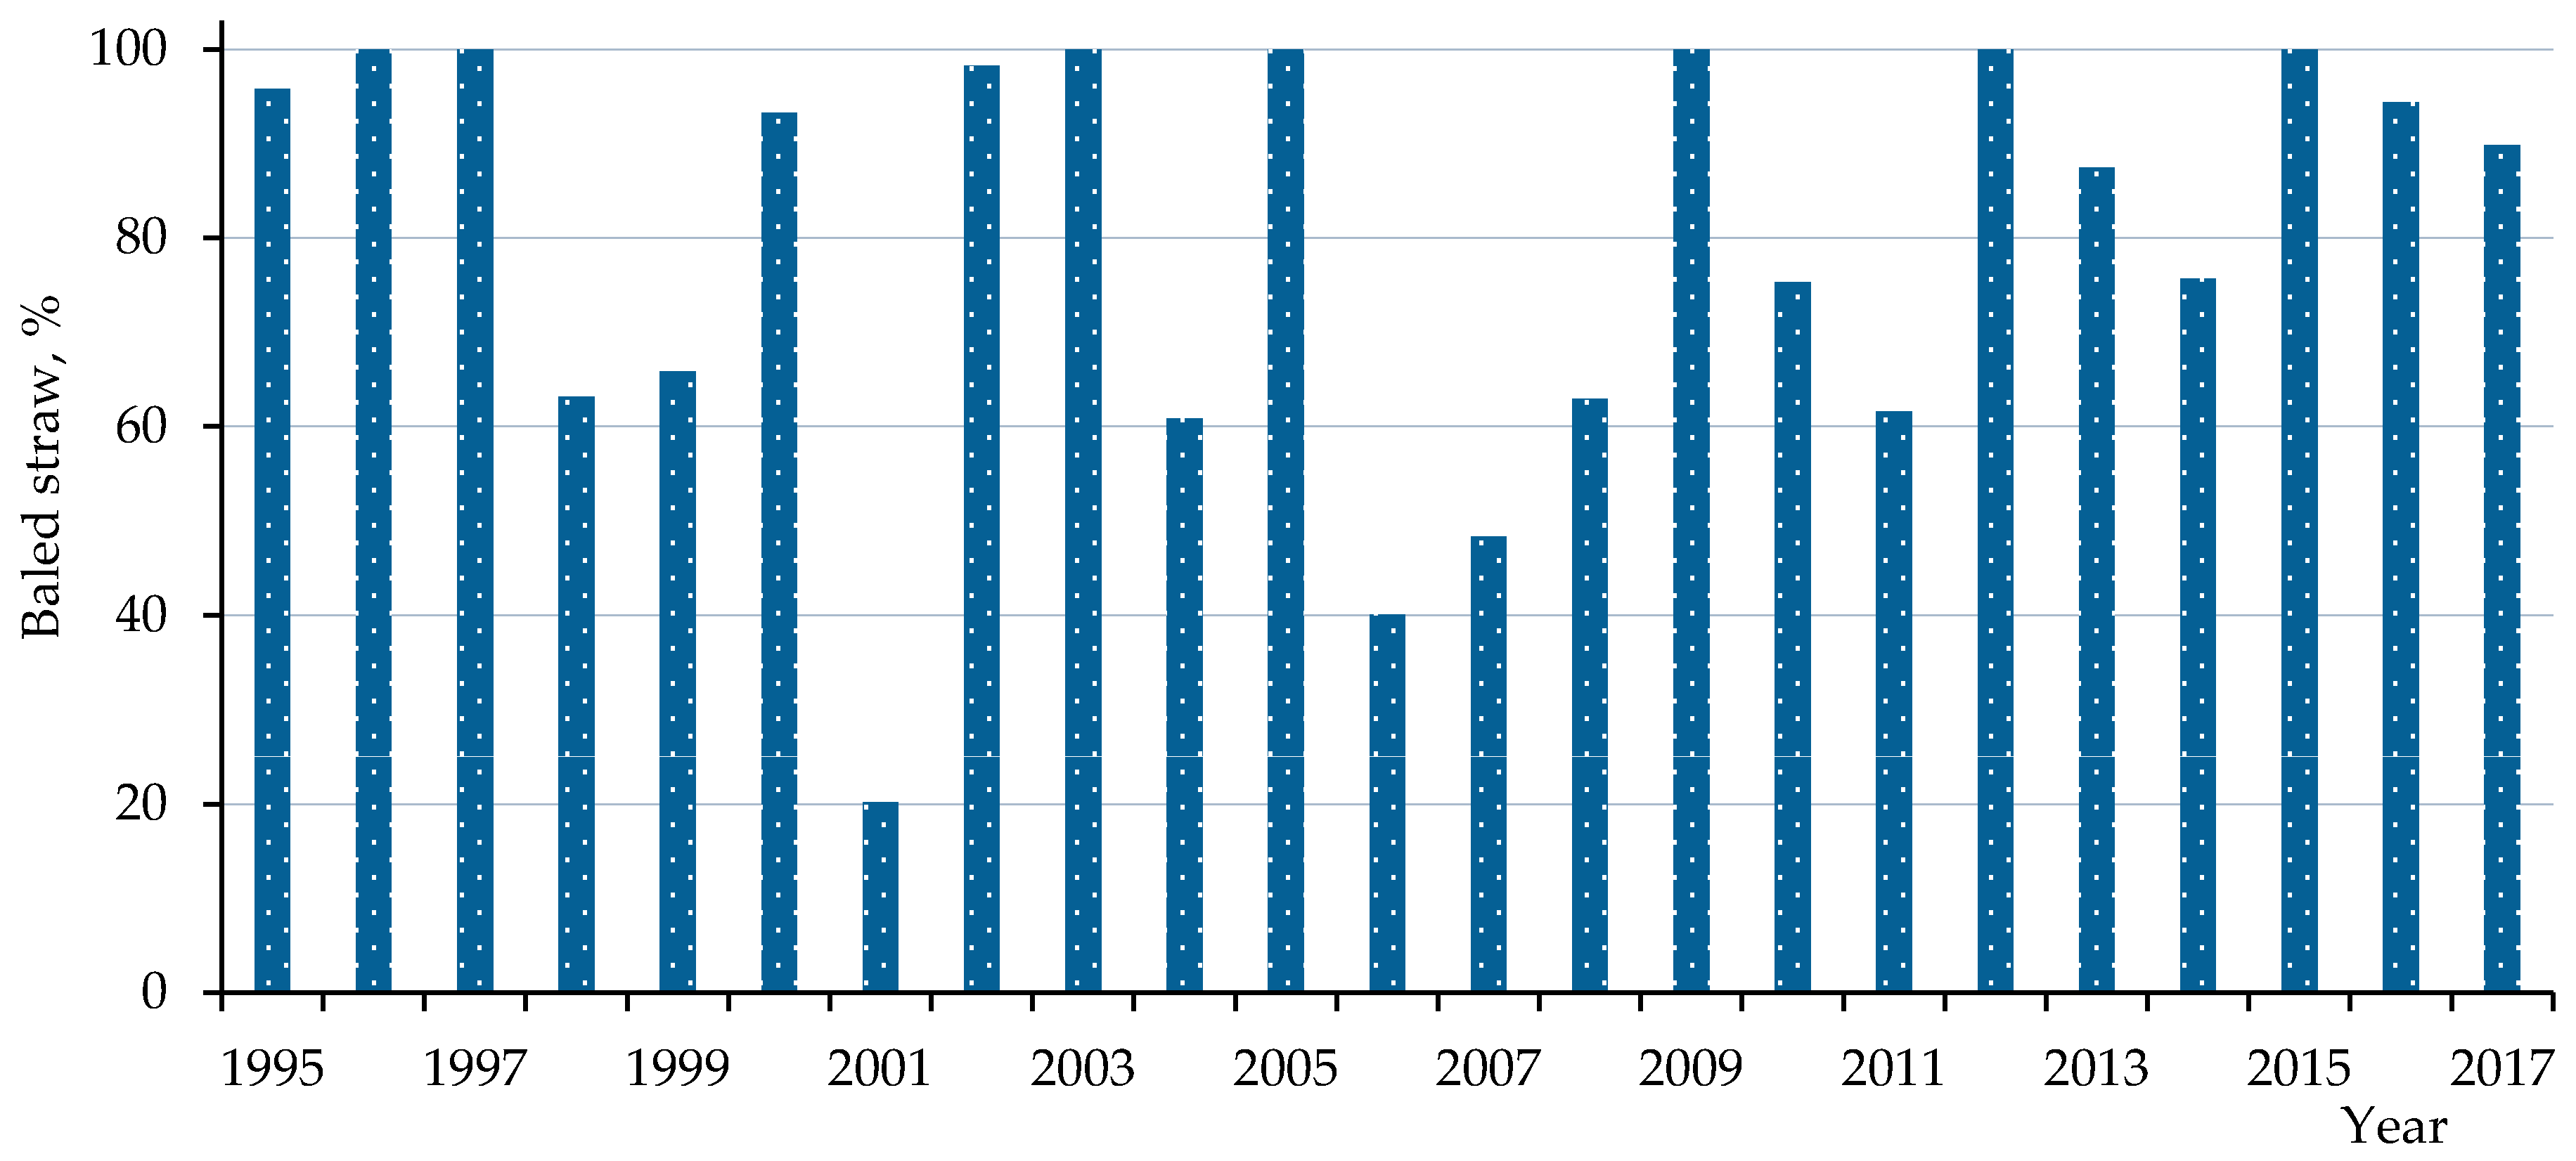
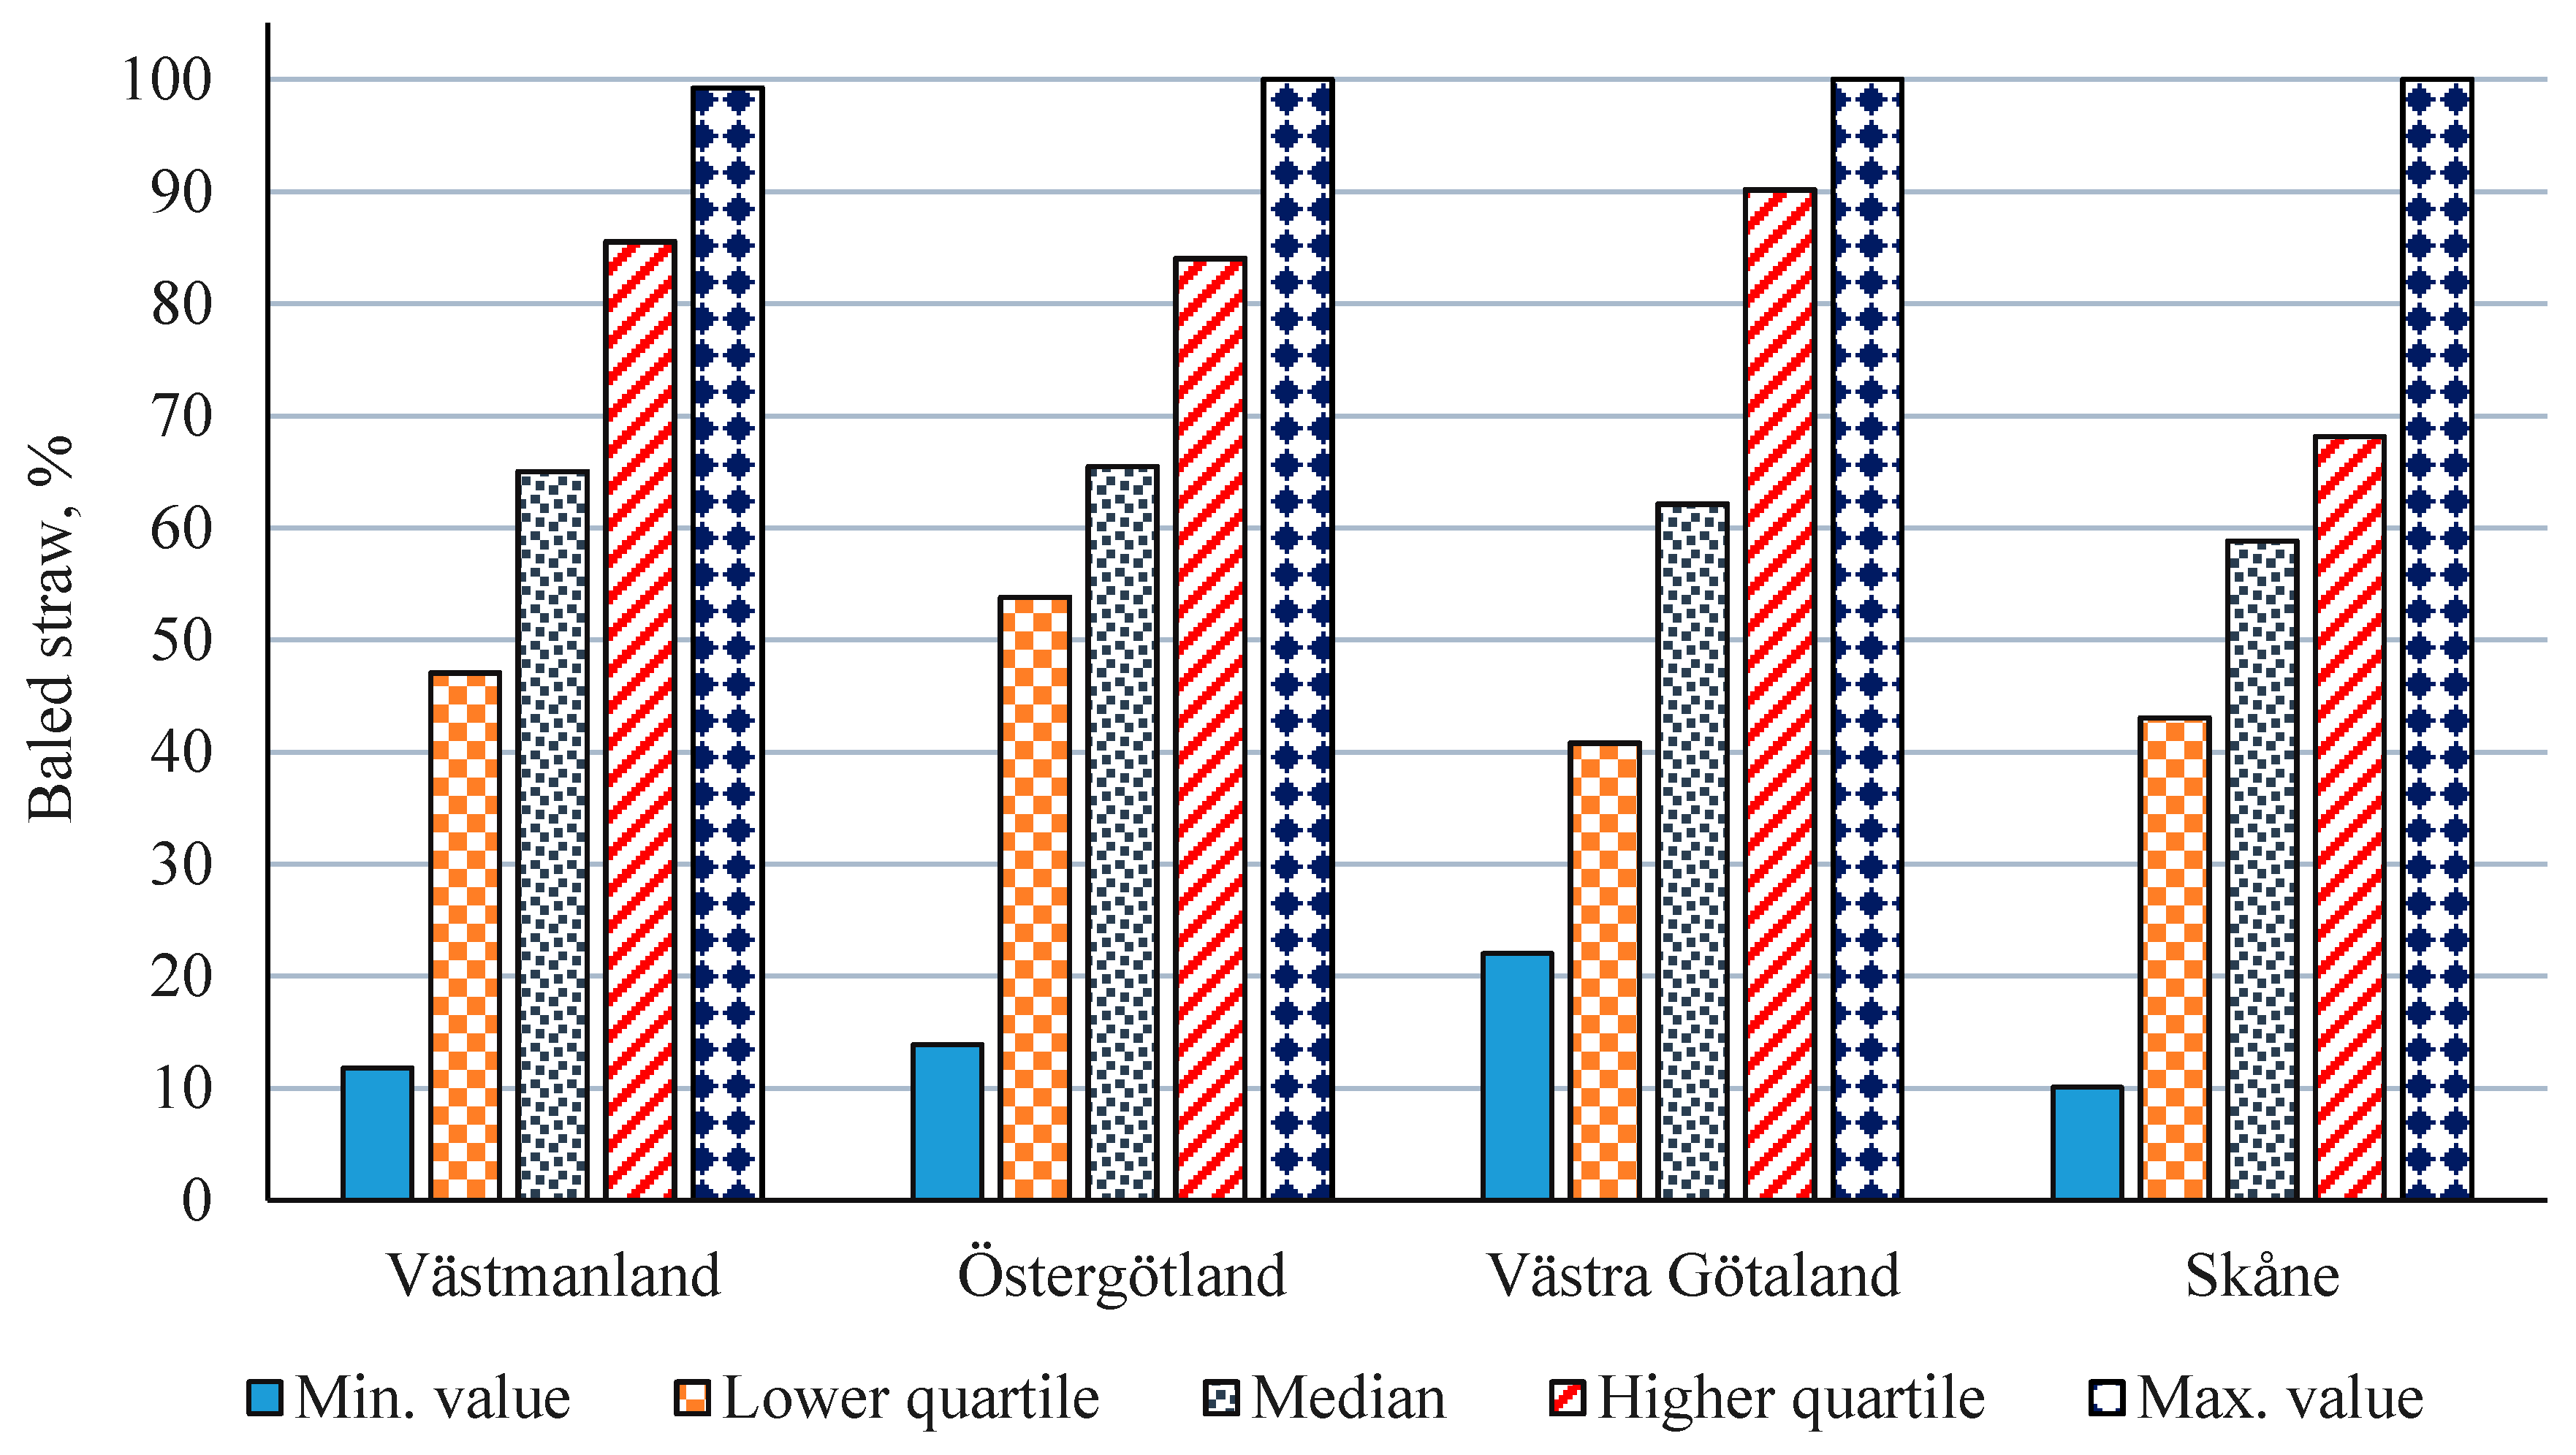
3.2. Estimated Straw Baling Coefficient

Figure 5 depicts the estimated average percentage of baled straw with varied amounts of harvestable straw and a baling capacity of 15 t·h−1 for representative virtual farms in each region. The highest estimated percentages of baled straw were at 600 and 1000 t·year−1. With quantities of harvestable straw above 1000 t·year−1 the baled share decreased, especially with amounts higher than 1800 t. However, the highest baled proportions estimated meant low annual baler utilisation (600 tonnes requires approx. 40 h of operation). A balance between high amounts of harvestable straw, a baled proportion of 80% or higher and high annual baler utilisation occurred at 1400 t·year−1, on a virtual farm with approximately 570, 410, 520 and 400 hectares of cereal crops in Västmanland, Östergötland, Västra Götaland and Skåne, respectively. The estimated baled percentage with 1400 t·year−1 of harvestable straw in these regions was 84, 86, 82 and 80%, respectively (Figure 5).
With an amount of 1400 t·year−1 harvestable straw, the standard deviation, in this case, a measure of variation in annual baled percentage, was 21, 22, 18 and 22%, respectively. The Östergötland region showed more favourable conditions for straw baling, as reflected in the higher proportion of baled straw (Figure 5).
The average percentage of the annually baled straw with 1400 t·year−1 of harvestable straw was considered as the baling coefficient for the respective region, as these percentages were estimated for representative regional farm conditions and cereal crop distributions. They corresponded to approximately 90 h or 10–11 days of effective baling work when 100% of the 1400 t was baled. Note that these coefficients apply only under the conditions and restrictions specified in Section 2.6.
The calculated proportion of baled straw varied for the individual crops (Figure 6). It was highest for winter wheat (>80%) which also showed less annual variation, and lowest for spring wheat (67–76% depending on the region, with large annual variation).
Figure 7 depicts the quartile distributions of annual baled percentage for the four regions. In 50% of years, 90% or more of the harvestable straw was baled, while in 75% of years more than 60% was baled. Lower amounts of baled straw mainly occurred during a few years, with very low percentages during one or two years, as shown in Figure 8 for the Skåne region

3.3. Moisture Content of Baled Straw

The median moisture content of the baled straw was within the range of 12–13% (w.b.) for all regions. The higher quartiles were in the range of 13–14%, indicating that the majority of the baled fields were baled at straw moisture content lower than 15%. At this moisture content, straw is in equilibrium with air relative humidity of about 70% for the drying (desorption) process [47,48,52]. At 70% humidity, mould development is greatly reduced even at optimal temperatures for microbe growth (about 20 °C) [45]. For further information, see Appendix A.

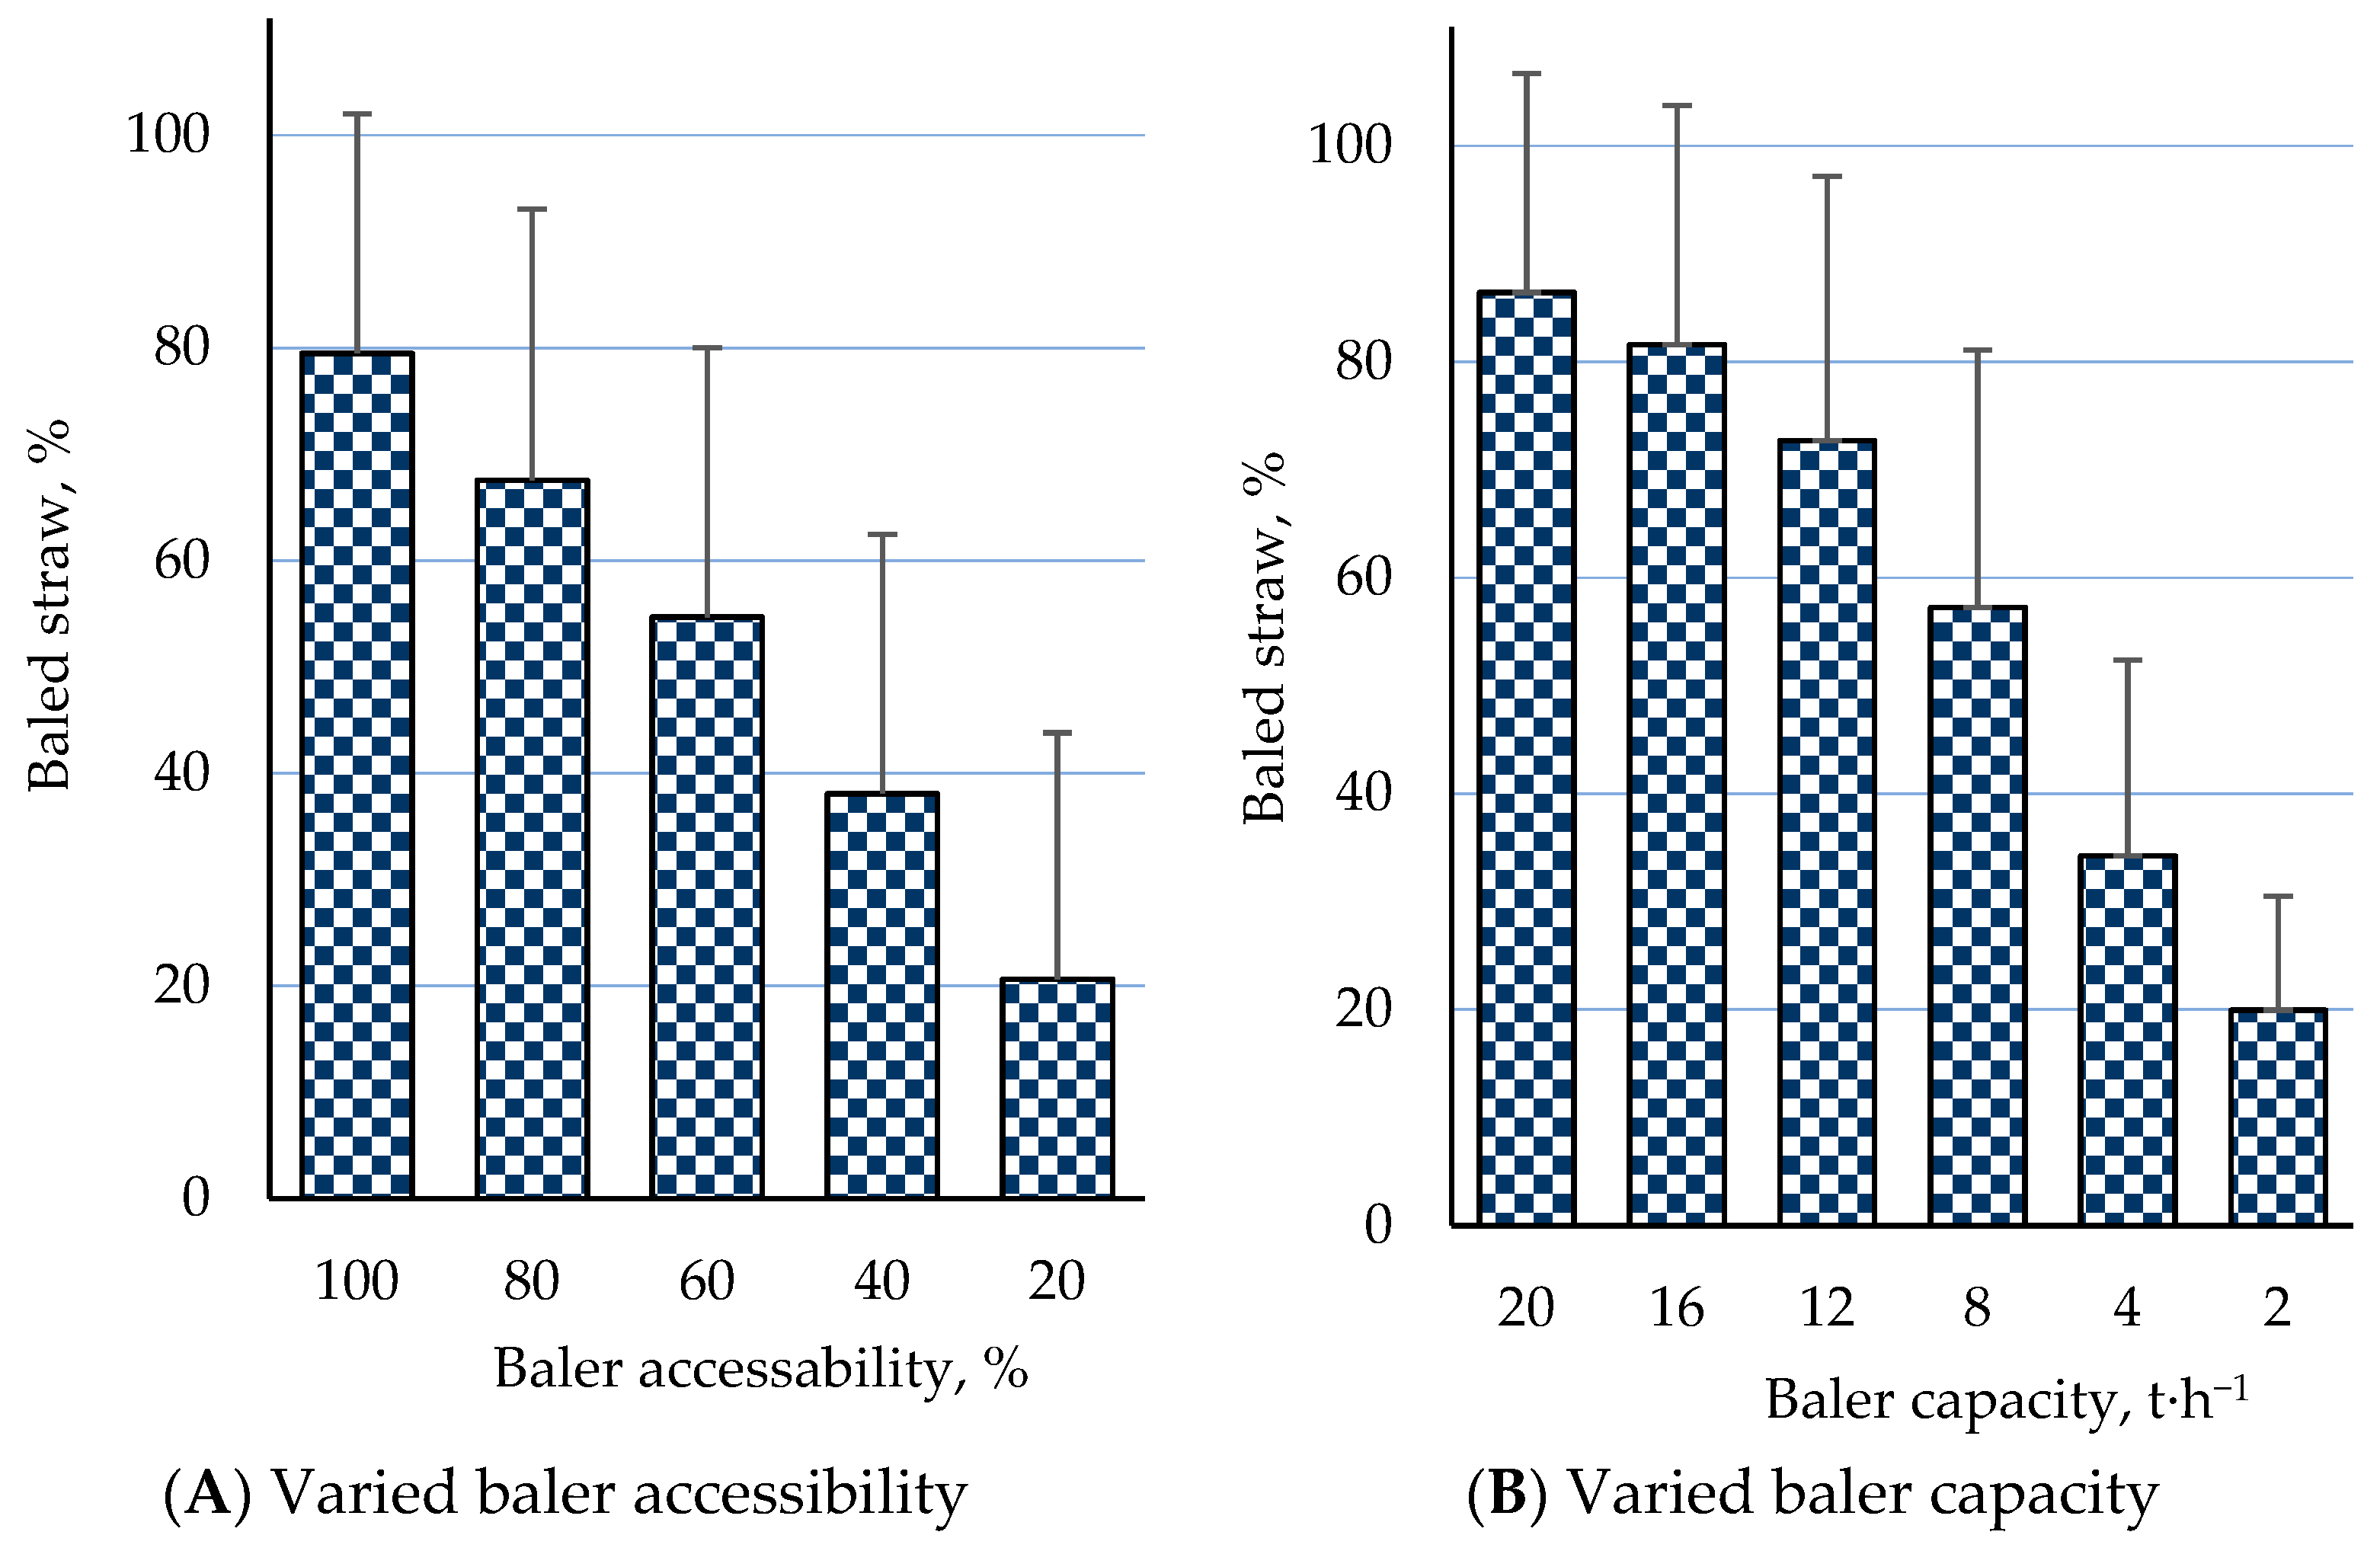
3.4. Sensitivity Analysis

A sensitivity analysis involving reducing baler accessibility and baling capacity was made, to assess how these factors affected amounts of baled straw. Baling operations were simulated for a representative virtual arable farm in the Skåne region with 1400 t·year−1 harvestable straw.

3.4.1. Limited Baler Accessibility

Figure 9A displays the average percentage of straw baled annually with varied accessibility of a baler to start a batch of operating days. Baler accessibility was reduced for each field by a random parameter in the simulation model. The baled amount decreased with lower accessibility, particularly when it was 60% or lower. However, the annual variation was considerable, as indicated by the standard deviation of the baled straw in Figure 9A. The reductions were not evenly distributed annually and mainly occurred in years with little available baling time.

3.4.2. Reduced Baler Capacity

Figure 9B presents the average percentage of straw baled annually with varied baling capacity. The percentage only decreased considerably when capacity was significantly reduced, specifically to 4 or 8 t·h−1. Note that baler accessibility was set to 100% in the model when a value was required. As with baler accessibility, the decreases were not evenly distributed between years. For several baling seasons, the amount baled was close to 100% with the baling capacity of 8 t·h−1. This can be explained by the high available baling time in some years in the Skåne region (see Figure 4). The effective number of working days with this capacity was around 20 days (1400 tonnes of straw/(8 t·h−1 × 9 h·day−1)). Therefore during years with favourable weather conditions, most of the straw could be baled.

4. Discussion

4.1. Weather Conditions

The average proportion of rainy days (≥0.5 mm precipitation) in August and September 1990–2018 was approximately one-third in the four Swedish regions analysed, although the annual variation was considerable. Fortunately, very problematic years with little available baling time only occurred in a few years, as clearly illustrated in Figure 4 for the Skåne region. The Västra Götaland region showed poorer weather conditions but had a more even crop distribution (Table 2), allowing harvesting and baling operations to be spread over more days.
Most of the weather data used were downloaded from one station for each region and assumed to be valid for the whole region. However, all four regions are rather large and daily weather may vary from site to site. This adds uncertainty to the estimated available baling times for particular locations, years or months. Nevertheless, the estimated averages from 22/23 years for the regions did not differ greatly (Figure 3), and hence a similar pattern can be expected within a region in the long term.

4.2. Moisture Content Prediction Models for Standing Mature Wheat and Swathed Cereal Straw

Drying and wetting processes are complicated and depend on multiple factors, so different simplifications and assumptions must be made if a model is to be useful and the amount of input data manageable [41].
To increase the reliability of estimates of swathed straw moisture content, a model developed and validated in Sweden for crops and weather conditions similar to those in the four regions studied was utilised [40,41]. The harvesting model used was also developed under Swedish conditions [30,38] so its results should be reliable for the regions.
In this study, it was assumed that the moisture content in swathed straw was evenly distributed, which is not always the case under real field situations. Swath parameters may vary a great deal, e.g., swath thickness, amount of weeds, straw lying on stubble or soil, site exposure to rain, dew, wind, solar radiation etc. All these factors lead to an uneven straw moisture content distribution in swathed straw in regions with spells of unfavourable weather conditions during the baling season, making their prediction the weakest link in this study.
The estimated moisture content median and higher quartile for baled straw were in the range 12–13% and 13–14% (w.b.), respectively, for all four regions, i.e., much lower than the 18% (w.b.) moisture ceiling for operations. Abawi [36] analysed harvesting operations and found that the moisture content of ripe standing wheat fluctuates around a certain average, depending on prevailing weather conditions. Weather variation means a mixture of “good” and “bad” days, making moisture contents tend to an average. However, weather variation also includes periods of persistent inclement weather in some years.

4.3. Farm Premises and Assumptions for Simulating Baling Operations

The harvestable straw quantities per hectare used in this study were based on grain yields (Table 3), but the actual annual yield variation is considerable. A yield calculation for the analysed crops and regions over the 10-year period 2010–2019 showed a yield range of 1470–3800 kg·ha−1, with a coefficient of variation of 10–23% (data from Swedish Board of Agriculture, own compilation (Jordbruksverket [50]. Similar yield variations have been found in another study based on 50-year statistics for cereal yields in Sweden, with the annual differences even larger at the farm level [29].
An equally wide range of estimated recoverable residues:grain yield ratios (0.8–1.6 for wheat, 0.8–1.3 for barley) has been reported by Glithero et al. [22], who concluded that there is no clear relationship between harvested grain:straw yield for wheat in their study area (England). Based on five-year data for Swedish cereal crops, Nilsson & Bernesson [20] reported varied harvestable straw:grain ratios (20 cm stubble) of 0.41–0.96 for winter wheat cultivars and 0.29–0.46 for barley.
In this study, quantities from 2.2 to 4.6 t·ha−1 harvestable straw were assumed, depending on crop and region. These values are similar to estimates of harvestable straw for wheat and barley (median 2.5 and 2.3 t·ha−1, respectively) for the 2010 harvest in England [22] from straw yield experiments in Denmark [53], from a recovery study of wheat residues in Sweden [54] and for harvestable cereal straw in Finland with a cutting height of 20 cm [55].

4.4. Available Baling Time

Mean available baling time during working hours (11.00–21.00 h) was estimated to be approximately 44% in August and September for the four regions, with higher values for August than September and higher values for Östergötland than other regions (Figure 3). Unfortunately, moisture content values for swathed straw are not reported in the Swedish literature, so comparisons were not possible.
With a straw recovery period of about 40–50 days, the expected number of suitable days for baling varied from 18–22 days per year, which suggests that around 3000 t·year−1 of straw could theoretically be baled on average over a series of years with a baling capacity of 15 t·h−1. In practice, about half this amount is usually recovered at that baling capacity [21,56,57], which is in line with the results from this study (for further details, see Section 3.2).

4.5. Baling Coefficient

When estimating average baled percentages with varying quantities of straw for representative farm conditions in each region (see Figure 5), it was assumed that at least 80% of the harvestable straw was baled on average for a series of years to be considered a baling coefficient. However, there is no objective criterion for this proportion and a lower percentage could be accepted, e.g., around 60%, which occurred at 2800 t·year−1 harvestable straw, leading to a lower baling capacity requirement in relation to straw amount. A similar baled proportion of 65% with 2200 t·year−1 as shown in Figure 5 was reported by Nilsson & Bernesson [21] for a straw amount of approximately 2000 t·year−1.
The average proportion of baled straw for the whole farm was estimated at 84, 86, 82 and 80% for the Västmanland, Östergötland, Västra Götaland and Skåne region, respectively, with an amount of 1400 t·year−1 harvestable straw, 15 t·h−1 baling capacity and a baling period until mid-September. These coefficients are at least 5% higher than those originally reported by Henriksson & Stridsberg [24] following discussions with crop advisors. This discrepancy can be explained in part by the fact that the advisors based their estimates on experiences from the 1980s, with cultivation conditions, farm sizes, machine systems, climate and so on for that decade.
In this paper, we explicitly state the method, premises and parameters with which the coefficients were estimated, so that the values can be adjusted if farm conditions or premises deviate, e.g., amount of straw, baling period duration, moisture content ceiling for operating, baling capacity, working hour per day, the minimum expected baled straw quantities in seasons with poor weather conditions, etc.

4.6. Baled Proportions with a High Amount of Harvestable Straw

Figure 10 shows the quartile distribution of baled percentage for the virtual farms in the four regions with an amount of 2800 t·year−1 harvestable straw and baling capacity of 15 t·h−1. The higher quartile denotes that in at least 25% of years, it was possible to bale more than 80% except in the Skåne region. Comparing Figure 7 with Figure 10 shows that the proportion of baled straw decreased for half the years by approximately 30% with an amount of 2800 t·year−1 (median values). The reductions were not evenly distributed over the years, mainly occurring in 50% of years (Figure 7, Figure 8 and Figure 10). Nilsson & Bernesson [21] arrived at a similar conclusion.
On the other hand, if a farmer will accept the collection of a lower proportion (e.g., 60% on average) of the 2800 t·year−1 harvestable straw during 50% of years, then 15 t·h−1 baling capacity is adequate, assuming the conditions and constraints described in Section 2.6.

4.7. Validity of Results

In general, models allow general patterns and trends of complex scenarios to be explained and effects of main parameters and variables of a process to be quantified, so new knowledge can be acquired. In addition, it is possible to capture interactions between the main factors influencing a system, which are difficult to visualise with analysis. However, model results are usually difficult to apply to specific cases and do not necessarily give a completely correct picture of reality, mainly due to general assumptions, simplifications and limited input data.
In this study, harvesting and baling operations were simulated for virtual farms in four Swedish regions, to assess the influence of weather conditions on amounts and proportions of baled straw. It was assumed that each farm represented the standard conditions for the region. However, it is well known that no two farms have similar conditions in terms of crop distribution, operation priorities, access to a baler, machine system, soils, swath properties, annual variations in straw yield, etc. The complexity of the drying and wetting process of swathed straw adds further uncertainty in the estimation of straw moisture content.
Considering the above limitations, the main conclusions of this study are likely to be mainly valid for regions with comparable climate and agricultural conditions to the four Swedish regions (central and southern parts of the country, not strictly geographically).

4.8. Equation for Rough Estimation of Performance of a Straw Baling System

A system in which a high proportion of harvestable straw is baled requires the number of available days for operating to be equal to or greater than the number of effective baling days that the work requires during a collecting season, i.e.:
Adays ≥ Edays
where:
  • Adays: number of available days for straw baling.
  • Edays: number of effective days that the baling operation requires for a given amount of straw; and where:
A days = Pe length A time Af baler Rf low Mf matching
e.g., Adays = 45 ∗ 0.45 ∗ 0.9 ∗ 0.8 ∗ 0.6 = 9 days
where:
  • Pelength: period length for straw baling operations (e.g., 45), days
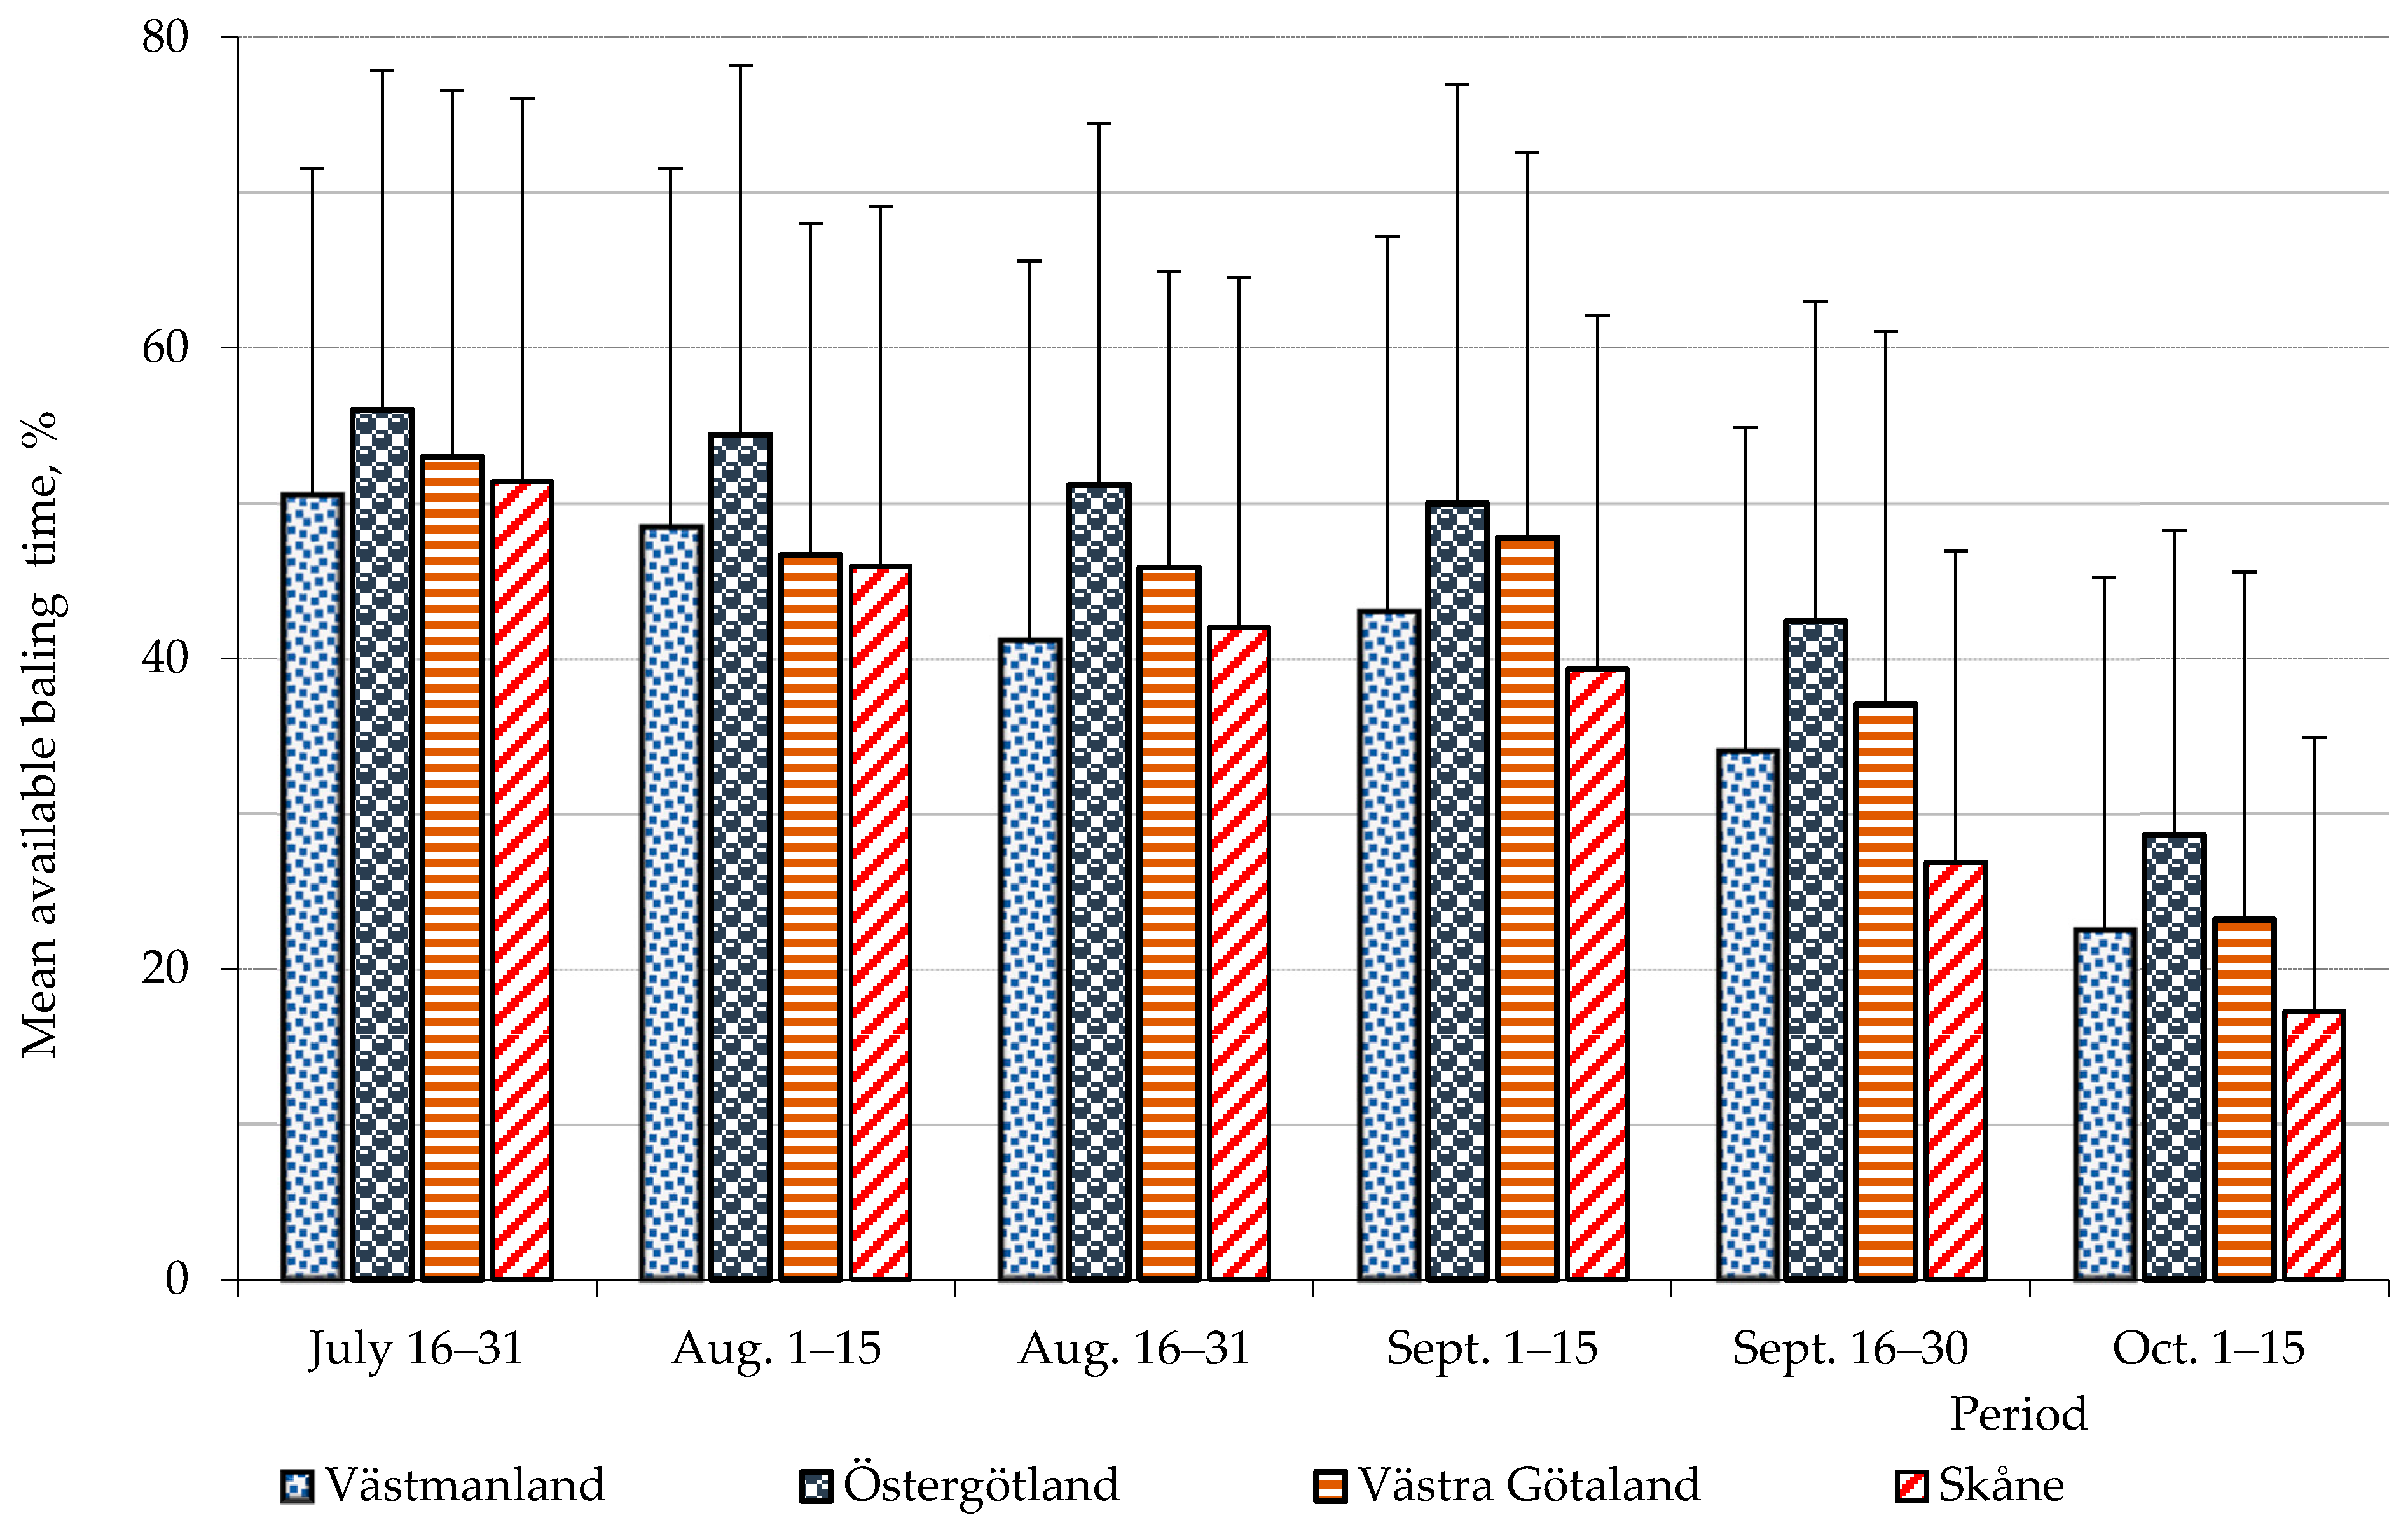
  • Atime: available expected time proportion for straw baling (e.g., 0.45 for the regions studied, see Figure 3)
  • Afbaler: access factor to a baler, (0.1 if the chance of getting a baler when needed is 10%, 1.0 if a baler is always available when needed)
  • Rflow: reducing factor for baling a higher straw proportion than average (0.5 to 1.0: 0.5 for baling a higher straw proportion than average a 1 for mean available baling time according to Figure 3)
  • Mfmatching: matching factor to compensate restrictions of the baling system, e.g., not enough straw ready to be baled on an available baling day (0.3 if the baling system operates with difficulties and 0.8 if everything goes smoothly, without bottlenecks); and
E days = H a St amount Ba cap Wh day
e . g . ,   E days = 450 2.5 15 9 = 8.3   days
where:
  • Ha: area to be baled, ha
  • Stamount: amount of straw per hectare, t·ha−1
  • Bacap: baling capacity, t·h−1
  • Whday: working hours per day, h·day−1
The results of Equation (2) were compared with estimates from other Swedish studies. Considering only weather factors, Lundin [58] (Cited by Nilsson [59]) estimated 40, 36, 41 and 55 available days for straw recovery in Västmanland, Östergötland, Västra Götaland and Skåne, respectively. These values are twice as high as the estimates in the present study because the mean available baling time was estimated at approximately 45% (Figure 3), which is consistent with information from Nilsson & Bernesson [21], C. Gunnarsson [56] and F. Johansson [57].
Brundin [60] (Cited by Nilsson [59]) developed a similar formula to Equation (2) to estimate the number of available days for straw collection but obtained higher estimates than those in this study. However, his equation does not take into account limiting factors caused by the machine system. Even so, any collecting system requires machines, whose parameters and limitations affect the amounts of straw collected.

5. Conclusions

By analysing the straw recovery process in regions where wet periods are probable during the baling season, this study provided important data support for increasing the efficiency of operations, enabling higher proportions of straw to be recovered and helping bioenergy systems move towards greater sustainability.
This study simulated 22/23 years of baling operations for representative virtual farms in four Swedish regions on an hourly basis, using historical weather data. The main conclusions, which should be valid for regions with similar climate and agricultural conditions to the regions assessed, were as follows:
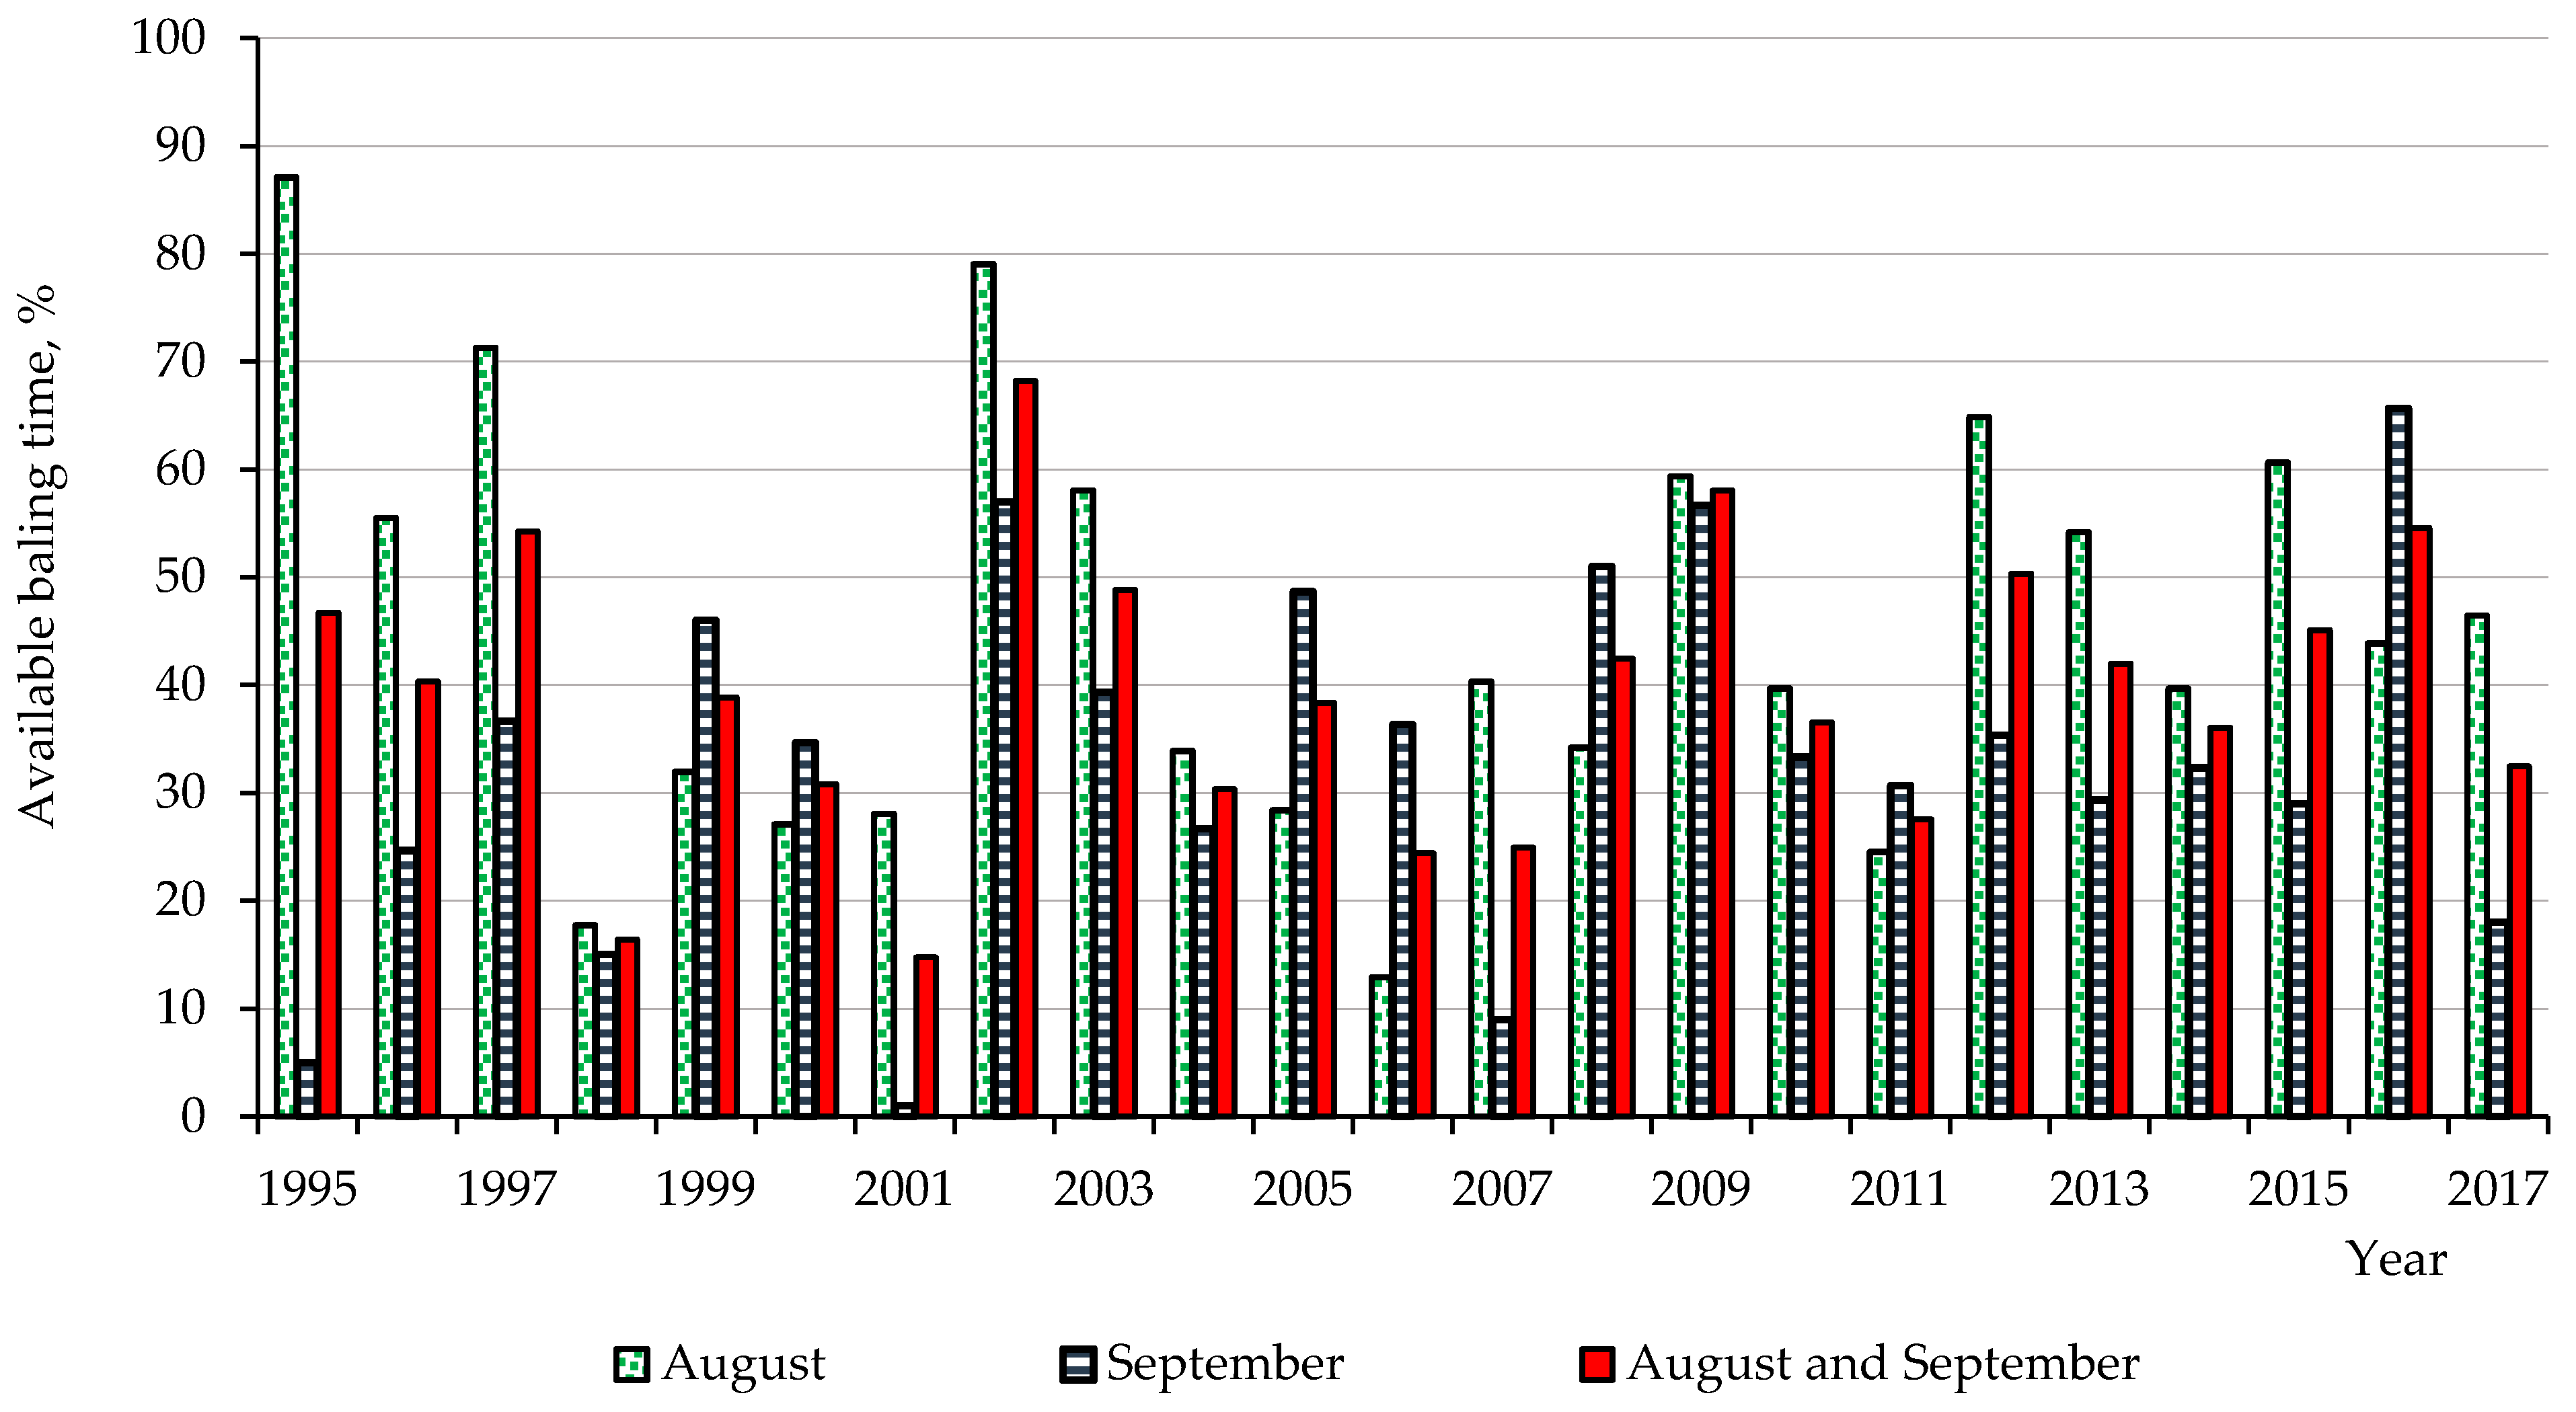
  • The estimated available baling time during working hours (11.00–21.00 h) was 39–49%, depending on the region. The time decreased from around 50% at the beginning of August to 30–40% at the end of September. The annual variation was large, with a standard deviation of around 22% in all regions.
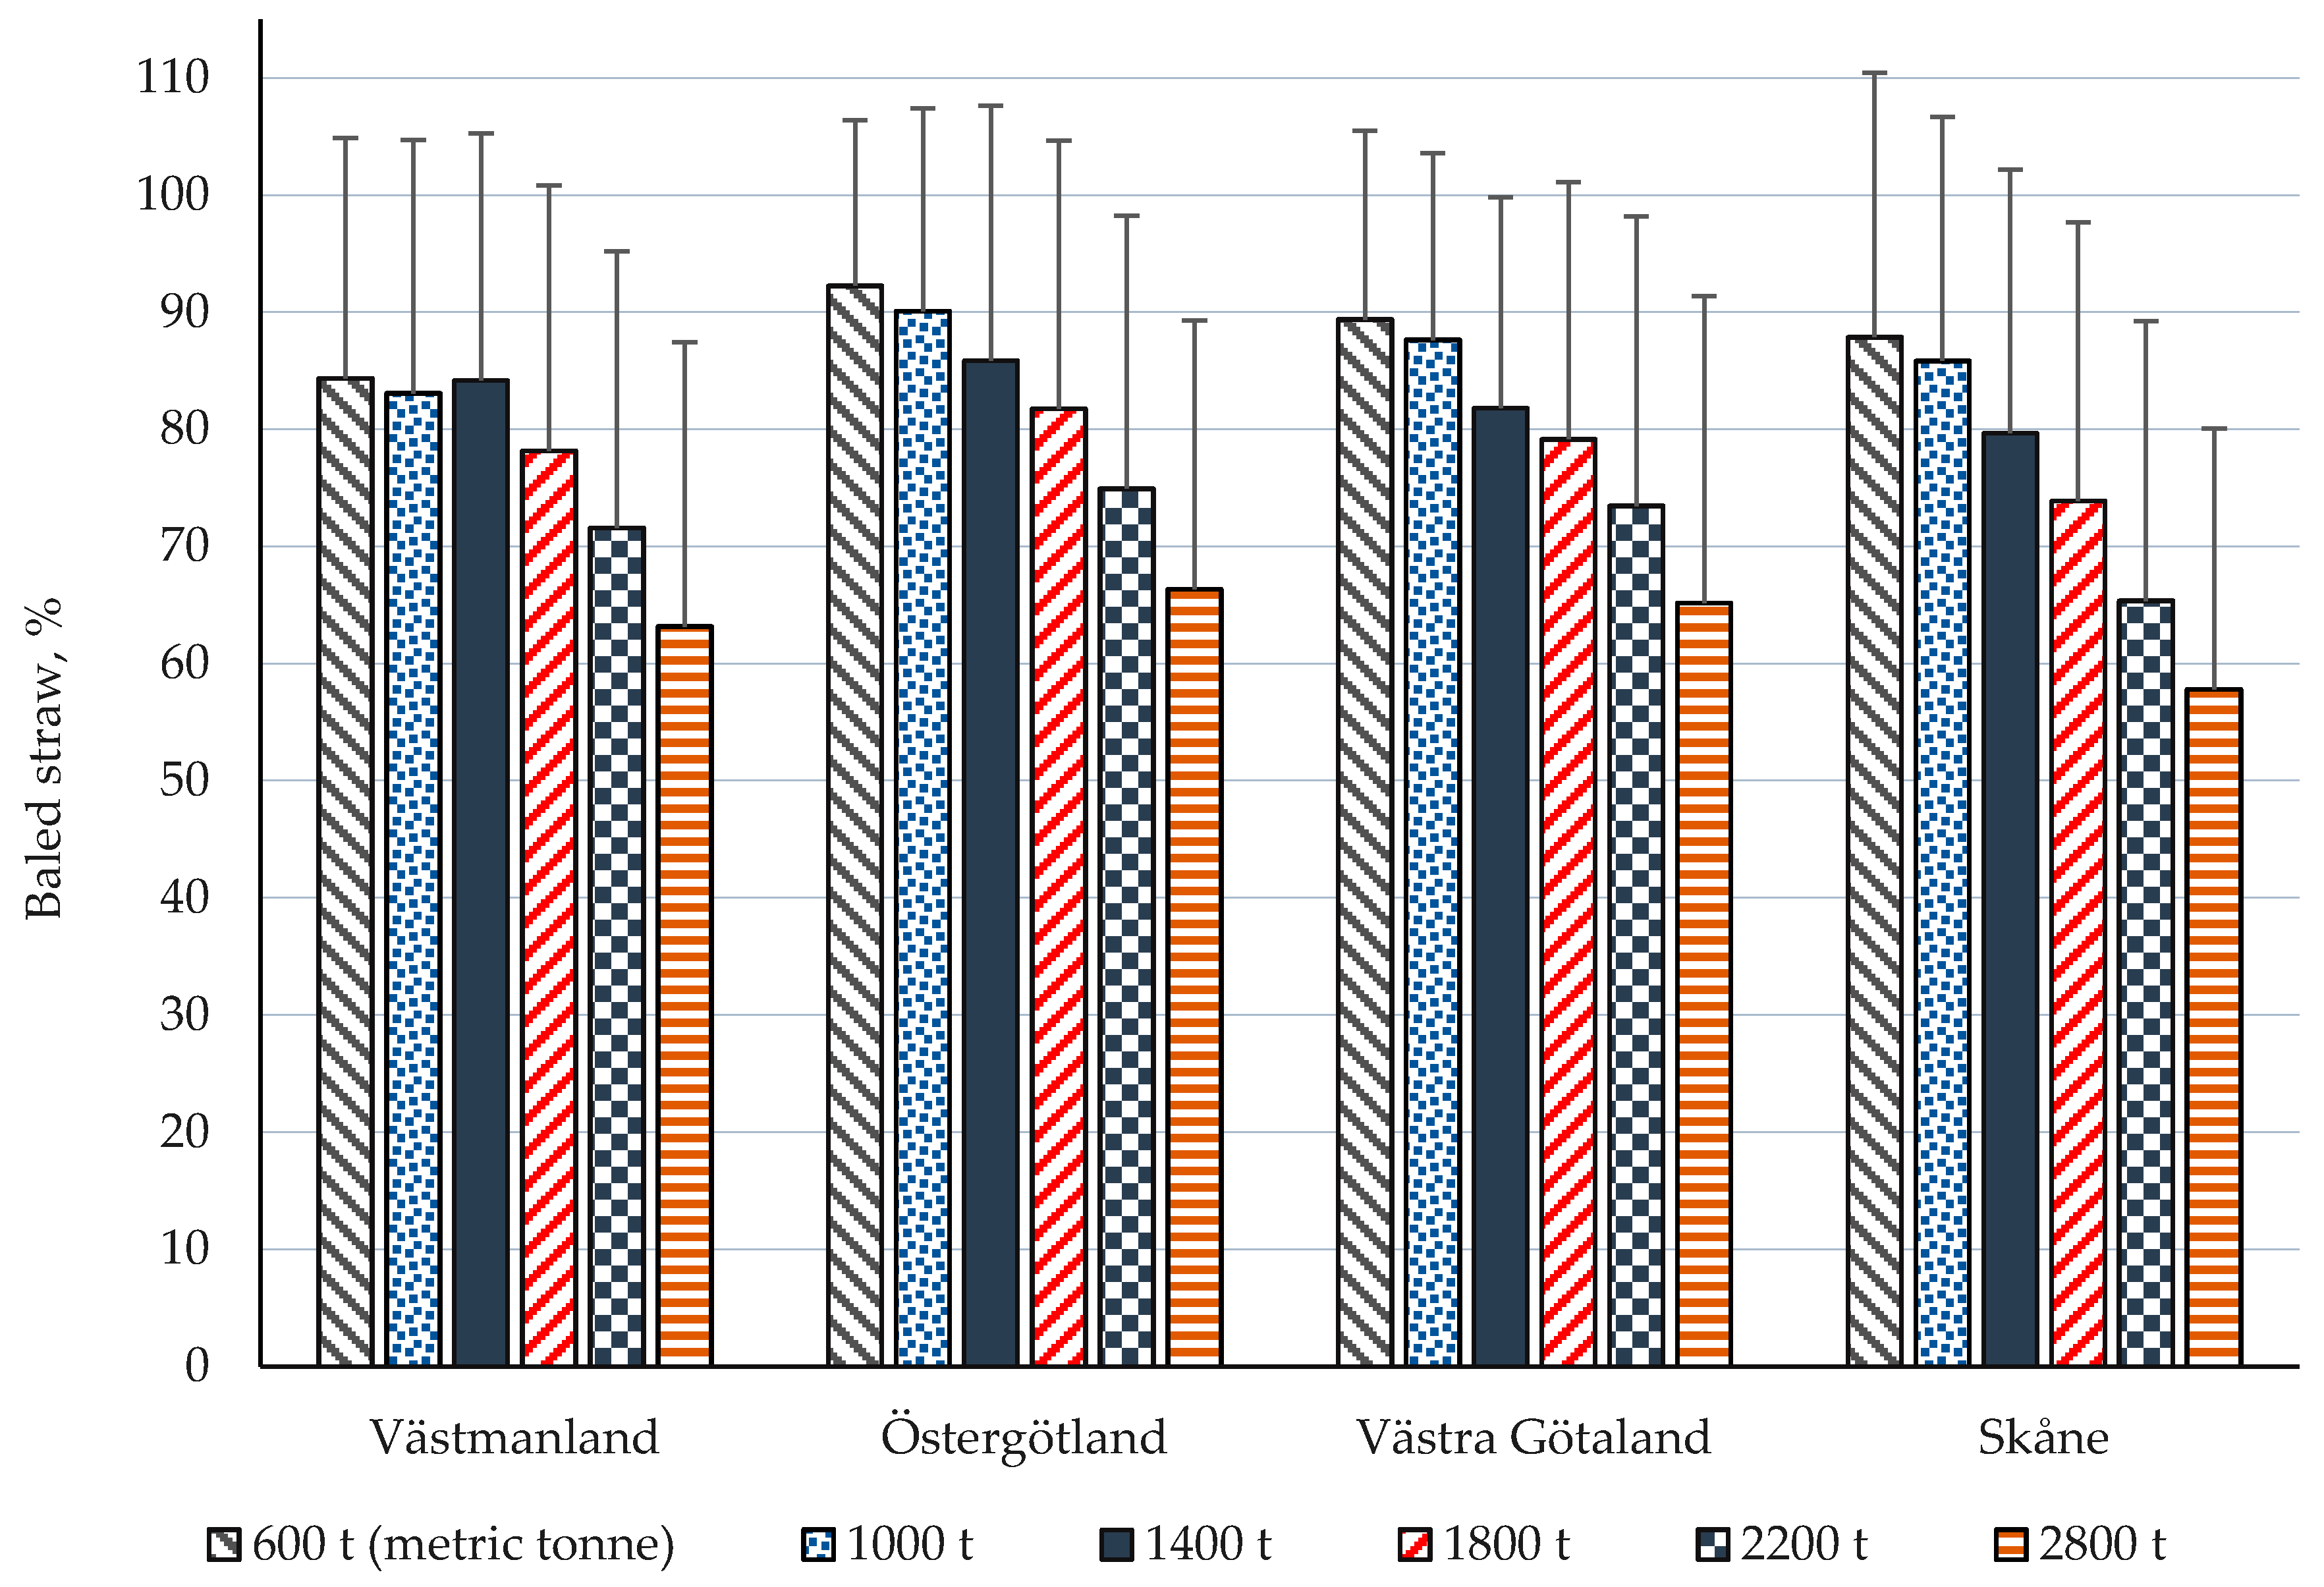
  • A reasonable balance between a large amount of harvestable straw and a high proportion of baled straw (over 80% on average) was reached at 1400 t·year−1 harvestable straw with the baling capacity of 15 t·h−1 (one baler) and a baling period to mid-September.
  • An 80% proportion of baled straw is not standard. A lower ratio, e.g., around 60% on average, would be reached at 2800 t·year−1 harvestable straw with the same baling capacity.
  • A rough estimate showed that approximately 25% of days in the baling season were effective baling days on average. Matching factors between sufficiently dry swathed straw amount and the baling system set restrictions on utilising most of the available baling time.
  • In one to two baling seasons out of 10, the proportion of baled straw was reduced to about 60% or less, even for an “optimised" system with the baling capacity of 15 t·h−1, 1400 t·year−1 harvestable straw and a baling period of 45 days per year.
  • A baling system where a high proportion of harvestable straw is baled in most years requires the number of available working days for the operation to be greater than the average number of effective baling days that a given amount of straw demands with a certain baling capacity.
  • The most uncertain item of this study was the prediction of changes in straw moisture content for the swathed straw, due to the complexity of straw wetting and drying processes.

Author Contributions

Conceptualization and methodology, C.G., N.J. and M.S.; software and data curation, A.d.T.; writing—original draft preparation A.d.T. and M.S.; writing—review and editing C.G., N.J. and M.S.; supervision, C.G.; project administration, C.G.; funding acquisition, C.G. All authors have read and agreed to the published version of the manuscript.

Funding

This research was funded by the Swedish Energy Agency, project grant number 45910-1 “Residues from cereal production for the Swedish biobased industry”.

Institutional Review Board Statement

Not applicable.

Informed Consent Statement

Not applicable.

Data Availability Statement

Not applicable.

Acknowledgments

Authors would like to thank Fredrik Johansson, Executive Manager and Agricultural Contractor, for the valuable information on straw handling under practical conditions and, the Researcher, Martin Knicky (RISE) for his contribution in the straw moisture determinations in the field experiment.

Conflicts of Interest

The authors declare no conflict of interest.

Appendix A. Model for Estimating Moisture Content of Swathed Cereal Straw

The baling requirement of low straw moisture content means that weather has a great influence on when this operation can be carried out. Several researchers have used models to investigate how weather affects moisture contents of straw or hay in the field (e.g., [40,41,61,62,63,64]).
A model developed in Sweden [40,41] was used in this study. It divides straw moisture into bound and free water according to an idea of Atzema) [64]. Bound water follows relative air humidity with some delay, and increases when air relative humidity is higher than the equilibrium moisture content of straw, or vice versa. Free water is related to dew and precipitation so that the potential evapotranspiration (E) equation can be used to estimate the effects of drying and wetting processes. If E > 0 free water evaporates, and when E < 0 water vapour condenses to dew. Table A1 presents the equations applied in this study for estimating the moisture content of swathed cereal straw. A complete model description can be found in Nilsson & Karlsson [40] and Nilsson & Bernesson [41].
Table A1. Moisture model equations for swathed cereal straw *.
ProcessConditionEquations (Time Step = One Hour)Value of Parameter
Quantity of bound water at equi-librium moisture content
q eq 0.30   q dm
q eq ( t ) = q dm ( A ln RH ( t ) ) 1 / B
A = 582.3
B = 2.69
Quantity of bound water
q b ( t ) 0 and q b ( t ) 0.25   q dm
q b ( t ) = q eq ( t ) + q eq ( t 1 ) + q eq ( t 2 ) 3  
Change in dew water due to dew **E < 0
Δ q d ( t ) = E ( t )
Change in dew water due to evaporation **E ≤ 0
Δ q d ( t ) = E ( t )
Quantity of water due to dew
q d ( t ) 0
q d ( t ) = q d   ( t 1 ) + Δ q d ( t )
Change in precipitation water due to absorptionP > 0
Δ q pa ( t ) = I c ( t ) ( 1 e bP I c ( t ) )   where   I c ( t ) = q dm ( M cMax M c ( t 1 ) )
b = 0.45

McMax = 3.5
Change in precipitation water due to evaporation **E > 0
Δ q pe ( t ) = E ( t ) ( 1 e cq p ( t 1 ) )
c = 0.35
Quantity of water due to precipitation
q p ( t ) 0
q p ( t ) = q p ( t 1 ) + Δ q pa ( t ) Δ q pe ( t )
and: if (qb(t) + qd(t) + qp(t)) > 3.5 qdm then qp(t) = 3.5 qdm − qb(t) − qd(t)
Actual moisture content, decimal (dry base)
M c ( t ) 3.5
M c ( t ) = q b ( t ) + q d ( t ) + q p ( t ) q dm
*: For further information on the model, see Nilsson & Karlsson [40] and Nilsson & Bernesson [21,41]. **: If weather data are available, the potential evapotranspiration computation may be facilitated by programmes obtainable on the internet (e.g., [65]).
where:
  • qeq(t): quantity of water at equilibrium moisture content at time t, kg·m−2
  • qdm: quantity of dry matter (straw), kg·m−2
  • RH(t): air relative humidity at time t, decimal
  • qb(t): quantity of bound water at time t, kg·m−2
  • qeq(t), qeq(t − 1), qeq(t − 2): quantity of bound water at time t, t − 1, t − 2, kg·m−2
  • Δqd(t): change in absorbed or dried dew water per time step (one hour), kg·m−2 h−1
  • E(t): potential evapotranspiration of water at time t, mm h−1 (or kg·m−2 h−1);
  • qd(t): quantity of dew water at time t, kg·m−2
  • Δqpa(t): change in precipitation water due to absorption per time step (one hour), kg·m−2 h−1
  • Ic(t): interception storage capacity at time t, kg·m−2
  • P: precipitation, mm/h (or kg·m−2 h−1)
  • McMax: maximal moisture content of straw: 3.5 (dry base) (empirical determination)
  • Δqpe(t): change in precipitation water due to evaporation per time step (one hour), kg·m−2 h−1
  • qp(t): quantity of precipitation water at time t, kg·m−2
  • Mc(t): actual moisture content of straw at time t, decimal (dry base).
Parameter “b” in Table A1 is related to the hourly increase of water from precipitation, i.e., how much water straw absorbs from it. The higher the value, the higher the estimated absorbed water. In this study, the parameter “b” was set to 0.45 in the model, which is the value used by Nilsson & Bernesson [21].
Parameter “c” (Change of precipitation water due to evaporation), is related to hourly moisture decrease from precipitation, i.e., the higher the value, the faster the estimated drying process due to evaporation. Nilsson & Bernesson [21], in their study on Dynamic simulation of handling systems, set this parameter to 0.85, but in their report on straw Moisture characteristics, values from 0.35–1.05 are given by Nilsson & Bernesson, [41]. All parameter values in this range showed a high correlation between measured straw moisture content and simulated values. In this study, the parameter “c” was set to a lower value (0.35), which is more in line with the field experiment conducted in Uppsala in August 2019 (Figure 2), to ensure that the model did not overestimate the drying process after precipitation.
The parameter variations between different studies indicate that the drying or wetting processes for swathed straw are complex, depending on many factors (including weather, swath properties, weed amount, swath compaction, nitrogen fertilisation, fungal treatment, etc.) that are difficult to capture in a simulation model.
As a hygroscopic material, straw dries out or moistens if the straw moisture content is not in equilibrium with surrounding air relative humidity (without considering rain or dew). In Sweden, the recommendation is to bale cereal straw at a maximum of 18% (w.b.) moisture content, to reduce the risk of mould development and heat generation. At this humidity, the straw moisture content is in equilibrium with air relative humidity of between 80 and 90%, depending on temperature and whether the moisture equilibrium was reached by drying (desorption) or moistening (adsorption). In experiments comparing the processes, the equilibrium moisture content of wheat straw has been found to be 1.5–2% lower for the moistening process within a certain range of air relative humidity, due to the so-called hysteresis effect [47,48]. Thus, an 18% moisture content is reached at lower air relative humidity when the straw is drying than wetting.
A Swedish study examining the drying process of wheat and barley straw reported that an 18% (w.b.) equilibrium moisture content was reached at 80% relative humidity at 10 °C and 83% relative humidity at 20 °C [52].
The model used in this study predicts equilibrium moisture content of straw based on the humidification process, resulting in 18% (w.b.) moisture content relating to 85–90% air relative humidity [41]. If a baling operation is carried out when the straw moisture content is in equilibrium with such a high relative humidity level (85–90%), there is a risk of mould development in bales stored at temperatures higher than 5 °C [45], which occur commonly during the baling season in Sweden (August–September). At lower relative humidity, for example, 80%, mould development is strongly inhibited at temperatures of 10 °C or lower [44,45,46]. These temperatures are not uncommon from the end of August in the regions analysed in this study. Accordingly, the moisture content that is in equilibrium with 80% air relative humidity, i.e., 18% (w.b.), was used as the moisture ceiling for straw baling operations in the drying process but 16% was used in the model that based moisture estimation on the moistening process. Thus available baling time was unlikely to be overestimated, which would probably lead to a higher proportion of baled straw for the baling systems analysed.

References

  1. Kretschmer, B.; Allen, B.; Hart, K. Mobilising Cereal Straw in the EU to Feed Advanced Biofuel Production; Institute for European Environmental Policy: Bruxelles, Belgium, 2012; Available online: http://minisites.ieep.eu/assets/938/IEEP_Agricultural_residues_for_advanced_biofuels_May_2012.pdf (accessed on 20 August 2021).
  2. Edwards, R.A.H.; Šúri, M.; Huld, M.A.; Dallemand, J.F. GIS-Based Assessment of Cereal Straw Energy Resource in the European Union. In Proceedings of the 14th European Biomass Conference & Exhibition, Biomass for Energy, Industry and Climate Protection, Paris, France, 17–21 October 2005; Available online: https://www.academia.edu/22384487/GIS_based_assessment_of_cereal_straw_energy_resource_in_the_European_Union?from=cover_pag (accessed on 20 August 2021).
  3. Scarlat, N.; Martinov, M.; Dallemand, J.F. Assessment of the availability of agricultural crop residues in the European Union: Potential and limitations for bioenergy use. Waste Manag. 2010, 30, 1889–1897. [Google Scholar] [CrossRef] [PubMed]
  4. Eurostat. Agricultural Production—Crops. Statistics Explained. 2020. Available online: https://ec.europa.eu/eurostat/statistics-explained/index.php?title=Agricultural_production_-_crops#Cereals (accessed on 13 August 2021).
  5. European Commission. Greening Our Energy Supply—The Role of Bioenergy from Forestry and Agriculture. 2010. Directorate General for Agriculture and Rural Development. Available online: https://ec.europa.eu/info/sites/default/files/food-farming-fisheries/sustainability_and_natural_resources/documents/leaflet-greening-our-energy-supply_en.pdf (accessed on 13 August 2021).
  6. Directive (EU) 2018/2001 of the European Parliament and of the Council of 11 December 2018 on the Promotion of the Use of Energy from Renewable Source. Available online: https://eur-lex.europa.eu/legal-content/EN/TXT/HTML/?uri=CELEX:32018L2001&from=EN#d1e1665-82-1 (accessed on 13 August 2021).
  7. Scarlat, N.; Dallemand, J.F.; Monforti-Ferrario, F.; Nita, V. The role of biomass and bioenergy in a future bioeconomy: Policies and facts. Environ. Dev. 2015, 15, 3–34. [Google Scholar] [CrossRef]
  8. Morone, P. Sustainability Transition towards a Biobased Economy: Defining, Measuring and Assessing. Sustainability 2018, 10, 2631. [Google Scholar] [CrossRef] [Green Version]
  9. D’Adamo, I.; Falcone, P.M.; Morone, P. A New Socio-economic Indicator to Measure the Performance of Bioeconomy Sectors in Europe. Ecol. Econ. 2020, 176, 106724. [Google Scholar] [CrossRef]
  10. Bastos Lima, M.G. Corporate Power in the Bioeconomy Transition: The Policies and Politics of Conservative Ecological Modernization in Brazil. Sustainability 2021, 13, 6952. [Google Scholar] [CrossRef]
  11. Eziyi, I.; Krothapalli, A. Sustainable Rural Development: Solar/Biomass Hybrid Renewable Energy System. Energy Procedia 2014, 57, 1492–1501. [Google Scholar] [CrossRef] [Green Version]
  12. Spinelli, L.; Pari, L.; Magagnotti, N. New biomass products, small-scale plants and vertical integration as opportunities for rural development. Biomass Bioenergy 2018, 115, 244–252. [Google Scholar] [CrossRef]
  13. Ekman, A.; Wallbergb, O.; Joelsson, E.; Börjesson, P. Possibilities for sustainable biorefineries based on agricultural residues—A case study of potential straw-based ethanol production in Sweden. Appl. Energy 2013, 102, 299–308. [Google Scholar] [CrossRef]
  14. Yamakawa, C.K.; Qin, F.; Mussatto, S.I. Advances and opportunities in biomass conversion technologies and biorefineries for the development of a bio-based economy. Biomass Bioenergy 2018, 119, 54–60. [Google Scholar] [CrossRef]
  15. AGROinLOG. Success Case of the Integration of a Logistics Centre into an Agro-Industry of the Grain-Milling and Feed Sector. Integrated Biomass Logistics Centres for the Agro-Industry, 2020. Available online: http://agroinlog-h2020.eu/wp-content/uploads/2020/06/AGROinLOG_D5.7_Success-case-IBLC-Sweden_FV_30042020_RISE.pdf (accessed on 13 August 2021).
  16. D’Adamo, I.; Falcone, P.M.; Huisingh, D.; Morone, P. A circular economy model based on biomethane: What are the opportunities for the municipality of Rome and beyond? Renew. Energy 2021, 163, 1660–1672. [Google Scholar] [CrossRef]
  17. Sheldon, R.A. Biocatalysis and biomass conversion: Enabling a circular economy. Philos. Trans. R. Soc. A 2020, 378, 20190274. [Google Scholar] [CrossRef]
  18. Sherwood, J. The significance of biomass in a circular economy. Bioresour. Technol. 2020, 300, 122755. [Google Scholar] [CrossRef]
  19. European Commission. The Revised Renewable Energy Directive. Factsheet: Renewable Energy Directive. Available online: https://ec.europa.eu/energy/sites/default/files/documents/directive_renewable_factsheet.pdf (accessed on 13 August 2021).
  20. Nilsson, D.; Bernesson, S. Halm som Bränsle. Del 1: Tillgångar och Skördetidpunkter (Straw as Fuel. Part 1: Available Resources and Harvest Times); Department of Energy and Technology, Swedish University of Agricultural Sciences: Uppsala, Sweden, 2009; Available online: https://pub.epsilon.slu.se/4854/1/nilsson_d_et_al_100630.pdf (accessed on 20 August 2021).
  21. Nilsson, D.; Bernesson, S. Halm som Bränsle. Del 3: Dynamisk Simulering av Hanteringssystem (Straw as Fuel. Part 3: Dynamic Simulation of Handling Systems); Department of Energy and Technology, Swedish University of Agricultural Sciences: Uppsala, Sweden, 2010; Available online: https://pub.epsilon.slu.se/4852/1/nilsson_d_et_al_100630_2.pdf (accessed on 20 August 2021).
  22. Glithero, N.J.; Wilson, P.; Ramsden, S.J. Straw use and availability for second generation biofuels in England. Biomass Bioenergy 2013, 55, 311–321. [Google Scholar] [CrossRef] [Green Version]
  23. SMHI. Ladda ner Meteorologiska Observationer. (Swedish Meteorological and Hydrological Institute. Download Meteorological Observations). Available online: https://www.smhi.se/data/meteorologi/ladda-ner-meteorologiska-observationer/#param=airtemperatureInstant,stations=all (accessed on 10 June 2021).
  24. Henriksson, A.; Stridsberg, S. Möjligheter att Använda Halmeldning till Energiförsörjningen i Södra Sverige (The Potential of Using Straw as a Fuel for the Support of Energy in the Agricultural Area of Southern Sweden); Department of Agricultural Engineering, Swedish University of Agricultural Sciences: Uppsala, Sweden, 1992; Available online: https://pub.epsilon.slu.se/3883/ (accessed on 20 August 2021).
  25. Lindqvist, J. Potential för Biobränsleproduktion i Uddevalla Kommun (Biofuel, Bioenergy, Potential, Municipality of Uddevalla). Master’s Thesis, Department of Technology and Society, Lund University, Lund, Sweden, 2007. Available online: https://lup.lub.lu.se/luur/download?func=downloadFile&recordOId=4468201&fileOId=4469151 (accessed on 20 August 2021).
  26. Broberg, A. Potential för Biogasproduktion i Västra Götaland. Hushållningssällskapet (Potential of biogas production in Västra Götaland. The Rural Economy and Agricultural Societies), 2009. Available online: https://docplayer.se/134805689-Potential-for-biogasproduktion-i-vastra-gotaland.html (accessed on 10 June 2021).
  27. Gustafsson, E. Lokal Handlingsplan för Bioenergi—Tingsryds Kommun. Energikontor Sydost (Local Handling Plan for Bioenergy—Municipality of Tingsryds. Energy Division), 2012. Available online: http://static.wm3.se/sites/2/media/25367_Lokal_handlingsplan_f%C3%B6r_bioenergi_Tingsryd_2012-05-09.pdf?1418646636 (accessed on 10 June 2021).
  28. Sternberg, H. Underlag för Potentialberäkningar av Förnybar Energi (Basic Data for Potential Renewable Energy Estimations). County Administrative Board of Dalarna, Report 2013:03, 2013. Available online: https://www.lansstyrelsen.se/download/18.4df86bcd164893b7cd92d381/1534488489669/2013-03Underlagf%C3%B6rpotentialber%C3%A4kningaravf%C3%B6rnybarenergi.pdf (accessed on 10 June 2021).
  29. De Toro, A.; Eckersten, H.; Nkurunziza, L.; von Rosen, D. Effects of Extreme Weather on Yield of Major Arable Crops in Sweden; Department of Energy and Technology, Swedish University of Agricultural Sciences: Uppsala, Sweden, 2015; Available online: https://pub.epsilon.slu.se/12606/8/deToro_a_etal_151109.pdf (accessed on 20 August 2021).
  30. De Toro, A.; Gunnarsson, C.; Lundin, G.; Jonsson, N. Cereal harvesting—Strategies and costs under variable weather conditions. Biosyst. Eng. 2012, 111, 429–439. [Google Scholar] [CrossRef]
  31. Gunnarsson, C.; de Toro, A.; Jonsson, N.; Lundin, G. Spannmålsskörd—Strategier och Kostnader vid Varierande Väderlek. In JTI-Rapport. Lantbruk & industri, No. 403; Jordbrukstekniska Institutet: Uppsala, Sweden, 2012; Available online: https://www.diva-portal.org/smash/get/diva2:959461/FULLTEXT01.pdf (accessed on 20 August 2021).
  32. Donaldson, G.F. Allowing for Weather Risk in Assessing Harvest Machinery Capacity. Am. J. Agric. Econ. 1968, 50, 24–40. [Google Scholar] [CrossRef]
  33. Van Kampen, J.H. Optimizing Harvesting Operations on a Largescale Grain Farm. Ph.D. Thesis, Wageningen University, Wageningen, The Netherlands, 30 May 1969. Available online: https://edepot.wur.nl/192243 (accessed on 20 August 2021).
  34. Philips, P.R.; O’Callaghan, J.R. Cereal harvesting—A mathematical model. J. Agric. Eng. Res. 1974, 19, 415–433. [Google Scholar] [CrossRef]
  35. Van Elderen, E. Models and techniques for scheduling farm operations: A comparison. Agric. Syst. 1980, 5, 1–17. [Google Scholar] [CrossRef]
  36. Abawi, G.Y. A Simulation Model of Wheat Harvesting and Drying in Northern Australia. J. Agric. Eng. Res. 1993, 54, 141–158. [Google Scholar] [CrossRef]
  37. Sokhansanj, S.; Mani, S.; Bi, X. Dynamic simulation of Mcleod Harvesting System for Wheat, Barley and Canola Crops. In Proceedings of the ASAE/CSAE Annual International Meeting, Ottawa, ON, Canada, 1–4 August 2004; Paper No. 048010. Available online: https://elibrary.asabe.org/abstract.asp?aid=17710 (accessed on 20 August 2021).
  38. De Toro, A. Assessment of Field Machinery Performance in Variable Weather Conditions Using Discrete Event Simulation; Swedish University of Agricultural Sciences: Uppsala, Sweden, 2004; Volume 462, Available online: https://pub.epsilon.slu.se/553/ (accessed on 20 August 2021).
  39. Nawi, N.M.; Chen, G.; Zare, D. The effect of different climatic conditions on wheat harvesting strategy and return. Biosyst. Eng. 2010, 106, 493–502. [Google Scholar] [CrossRef]
  40. Nilsson, D.; Karlsson, S. A model for the field drying and wetting processes of cutflax straw. Biosyst. Eng. 2005, 92, 25–35. [Google Scholar] [CrossRef]
  41. Nilsson, D.; Bernesson, S. Halm som Bränsle. Del 2: Fuktegenskaper (Straw as Fuel. Part 2: Moisture Characteristics); Department of Energy and Technology, Swedish University of Agricultural Sciences: Uppsala, Sweden, 2009; Available online: https://pub.epsilon.slu.se/4854/ (accessed on 20 August 2021).
  42. LantMet. Lantmet Väderstationer. (Ordnance Survey: Weather Stations). Available online: https://www.slu.se/fakulteter/nj/om-fakulteten/centrumbildningar-och-storre-forskningsplattformar/faltforsk/vader/lantmet/ (accessed on 10 June 2021).
  43. SMHI. Extracting STRÅNG Data. (Swedish Meteorological and Hydrological Institute). Available online: http://strang.smhi.se/extraction/index.php (accessed on 10 June 2021).
  44. Lehmann, D. Verlustvorgänge und schimmelbildung bei der trocknung und lagerung von halmfutter (Processes of decomposition and mold growth during drying and storage of straw forage). Landtech. Forshung 1971, 19, 180–187. [Google Scholar]
  45. Sedlbauer, K. Prediction of Mould Fungus Formation on the Surface of and Inside Building Components; Fraunhofer Institute for Building Physics: Stuttgart, Germany, 2001; Available online: https://www.ibp.fraunhofer.de/content/dam/ibp/ibp-neu/de/dokumente/dissertationen/ks_dissertation_etcm45-30729.pdf (accessed on 20 August 2021).
  46. Ramberg, D.T.; Jeppson, P.; Wang, A. Simulation of Relative Humidity and Temperature and Modeling of Mold Growth in Exterior Walls Insulated with Straw Bales in a Southern Swedish climate. In Proceedings of the BS2015: 14th Conference of International Building Performance Simulation Association, Hyderabad, India, 7–9 December 2015; Available online: http://www.ibpsa.org/proceedings/BS2015/p2859.pdf (accessed on 10 June 2021).
  47. Hedlin, C.P. Sorption isotherms of five types of grain straw at 70 degrees F. Can. Agric. Eng. 1967, 9, 37–39. Available online: https://nrc-publications.canada.ca/eng/view/ft/?id=efb99a49-f9d7-4050-b4ca-8f155722704e (accessed on 10 June 2021).
  48. Almeida, G.; Rémond, R.; Perré, P. Hygroscopic behaviour of lignocellulosic materials: Dataset at oscillating relative humidity variations. J. Build. Eng. 2018, 19, 320–333. [Google Scholar] [CrossRef]
  49. Angus, J.F.; Mackenzie, D.H.; Morton, R.; Schafer, C.A. Phasic development in field crops. II. Thermal and photoperiodic responses of spring wheat. Field Crop. Res. 1981, 4, 269–283. [Google Scholar] [CrossRef]
  50. Jordbruksverket. Hektar-och Totalskörd Efter län och Gröda. År 1965–2020. (Swedish Board of Agriculture. Hectare Yields and Total Production: County and Crop. Year 1965–2020). Available online: https://statistik.sjv.se/PXWeb/pxweb/sv/Jordbruksverkets%20statistikdatabas/Jordbruksverkets%20statistikdatabas__Skordar/JO0601J02.px/ (accessed on 19 August 2021).
  51. Jordbruksverket. Normskörd i kg/ha efter län, Gröda och typ av Normskörd. År 2003–2021. (Swedish Board of Agriculture. Standard Yields in kg/ha per County, Crop, and Type of Standard Yield, Year 2003–2021). Available online: https://statistik.sjv.se/PXWeb/pxweb/sv/Jordbruksverkets%20statistikdatabas/Jordbruksverkets%20statistikdatabas__Skordar__Normskord/JO0602A01.px/?rxid=5adf4929-f548-4f27-9bc9-78e127837625 (accessed on 19 August 2021).
  52. Swain, G. Desorption Equilibrium Moisture Content (EMC) of Straw. JTI—Swedish Inst. of Agric. and Envir. Eng., 1985, Report No. 63. Available online: http://www.diva-portal.org/smash/get/diva2:959801/FULLTEXT01.pdf (accessed on 10 June 2021).
  53. Larsen, S.U.; Bruun, S.; Lindedam, J. Straw yield and saccharification potential for ethanol in cereal species and wheat cultivars. Biomass Bioenergy 2012, 45, 239–250. [Google Scholar] [CrossRef]
  54. Suardi, A.; Stefanoni, W.; Bergonzoli, S.; Latterini, F.; Jonsson, N.; Pari, L. Comparison between Two Strategies for the Collection of Wheat Residue after Mechanical Harvesting: Performance and Cost Analysis. Sustainability 2020, 12, 4936. [Google Scholar] [CrossRef]
  55. Hakala, K.; Heikkinen, J.; Sinkkob, T.; Pahkala, K. Field trial results of straw yield with different harvesting methods, and modelled effects on soil organic carbon. A case study from Southern Finland. Biomass Bioenergy 2016, 95, 8–18. [Google Scholar] [CrossRef]
  56. Gunnarsson, C.; (Research Institutes of Sweden (RISE), Gothenburg, Sweden; [email protected]). Personal communication, 2018.
  57. Johansson, F.; (Industrigatan 1, 523 78 Trädet, Sweden). Executive Manager/Agricultural Marketing Agent, Lundby Maskin Station. Personal communication, 2020.
  58. Lundin, G. Underlag för Bestämning av Leveranssäkerhet och Erforderlig Maskininsatsvid Halmbärgning (Basic Data for Determination of Delivery Security and Required Machine Input for Straw Recovery); Unpublished material; 1984. [Google Scholar]
  59. Nilsson, D. Bärgning, Transport, Lagring och Förädling av Halm till Bränsle; Metoder, Energibehov, Kostnader (Harvesting, Transport, Storage and Upgrading of Straw as a Fuel—Methods, Energy Needs, Costs); Department of Energy and Technology, Swedish University of Agricultural Sciences: Uppsala, Sweden, 1991; Available online: https://pub.epsilon.slu.se/3893/1/nilsson_d_090904.pdf (accessed on 19 August 2021).
  60. Brundin, S. Fastbränsle från Jordbruket. Kostnader för Halm- och Gräsbränslesystem (Solid Fuels from Agriculture. Straw and Grass Feedstock Costs for Energy); Swedish University of Agricultural Sciences: Uppsala, Sweden, 1988. [Google Scholar]
  61. Brück, I.G.M.; Van Elderen, E. Field drying of hay and wheat. J. Agric. Eng. Res. 1969, 14, 105–116. [Google Scholar] [CrossRef]
  62. Thompson, N. Modelling the field drying of hay. J. Agric. Sci. 1981, 97, 241–260. [Google Scholar] [CrossRef]
  63. Smith, E.A.; Duncan, E.J.; McGechan, M.B.; Haughey, D.P. A model for the field drying of grass in windrows. J. Agric. Eng. Res. 1988, 41, 251–274. [Google Scholar] [CrossRef]
  64. Atzema, A.J. A model for the drying of grass with real time weather data. J. Agric. Eng. Res. 1992, 53, 231–247. [Google Scholar] [CrossRef]
  65. Ref-ET: Software. Reference Evapotranspiration Calculator; Version 4.1. University of Idaho, 2016. Available online: https://www.uidaho.edu/cals/kimberly-research-and-extension-center/research/water-resources/ref-et-software (accessed on 10 June 2021).
Figure 1. Flowchart of the procedure used to estimate the yearly amount of baled straw on a farm.
Sustainability 13 09449 g001
Figure 2. Comparison of moisture content (%, wet basis) of swathed wheat straw obtained with the simulation model proposed by Nilsson & Karlsson [40] and Nilsson & Bernesson [41] using as parameters: b = 0.45 and c = 0.35 (continuous line) and values measured (squares) in a field experiment in Uppsala in August 2019. The error bar on the measured moisture contents represents one standard deviation (n = 3) for each determination. The secondary axis shows precipitation, drawn as bars.
Sustainability 13 09449 g002
Figure 3. Mean available baling time (i.e., expected proportion of time when the moisture content of swathed straw did not exceed 18% (w.b.)) during baling hours (11.00–21.00 h), by 15-day periods in the Västmanland, Östergötland, Västra Götaland and Skåne regions from July 16 to October 15. Error bars indicate one standard deviation (n = 22/23 years) in percentage annual time available. Values based on simulation with hourly weather data from Västerås and Skara 1996–2017 and from Linköping and Malmö 1995–2017.
Sustainability 13 09449 g003
Figure 4. Estimated available baling time per year, i.e., the proportion of time when straw moisture content did not exceed 18% (w.b.) in August and September and mean values for both months during baling hours (11.00–21.00 h) for the Skåne region in the period 1995–2017. Values based on simulation and hourly weather data, most from the Hörby weather station.
Sustainability 13 09449 g004
Figure 5. Mean estimated annual percentage of baled straw with varied amounts of harvestable straw for virtual farms located in the regions of Västmanland, Östergötland, Västra Götaland and Skåne, with a baling period until September 15, 18, 18 and 22, respectively, and baling capacity of 15 t·h−1 (one baler). The error bars indicate one standard deviation of the annual baled straw percentage (n = 22/23). Values based on simulations and hourly weather data (for further details see Figure 1 and Section 2.4 and Section 2.6).
Sustainability 13 09449 g005
Figure 6. Mean estimated annual percentage of baled straw (baling coefficient) for all cereal crops (winter wheat, spring barley, oats and spring wheat) and for individual crops (spring barley and oats were considered as one crop) on virtual farms located in Västmanland, Östergötland, Västra Götaland and Skåne, with 1400 t·year−1 harvestable straw, a baling period up to September 15, 18, 18 and 22, respectively, and baling capacity of 15 t·h−1 (one baler). The error bars represent one standard deviation of the annual baled percentages. Values based on simulations for 22/23 seasons (for further details see Figure 1 and Section 2.4 and Section 2.6).
Sustainability 13 09449 g006
Figure 7. Quartile distributions of estimated annual baled straw percentage for virtual farms located in Västmanland, Östergötland, Västra Götaland and Skåne with 1400 t·year−1 harvestable straw, a baling period up to September 15, 18, 18 and 22, respectively, and baling capacity of 15 t·h−1 (one baler). Values based on simulations for 22/23 seasons. For further details, see Figure 1 and Section 2.4 and Section 2.6.
Sustainability 13 09449 g007
Figure 8. Estimated percentage of baled straw per year for a virtual farm located in the Skåne region with 1400 t·year−1 harvestable straw and a cereal crop distribution representative for the region (Table 2), the baling capacity of 15 t·h−1 (one baler) and a baling period up to September 22.
Sustainability 13 09449 g008
Figure 9. Mean percentage of straw baled annually with (A) varied baler accessibility to start a batch of baling days and baling capacity of 15 t·h−1 and (B) varied baler capacity and 100% accessibility to a baler for a representative arable farm in the Skåne region with 1400 t·year−1 harvestable straw and a baling period until September 22. The error bars represent one standard deviation of annual baled percentage (n = 23 years), for further details see Figure 1 and Section 2.4 and Section 2.6.
Sustainability 13 09449 g009
Figure 10. Quartile distributions of annual baled straw percentage for virtual farms located in Västmanland, Östergötland, Västra Götaland and Skåne with 2800 t·year−1 harvestable straw, a baling period up to September 15, 18, 18 and 22, respectively, and baling capacity of 15 t·h−1. Values based on simulations for 22/23 seasons, for further details see Section 2.4 and Figure 1.
Sustainability 13 09449 g010
Table 1. Expected maturation period for the main cereal crops in the four Swedish regions studied.
Region/CountyWinter WheatSpring WheatSpring BarleyOats
Västmanland30 July–20 August21 August–12 September13 August–3 September15 August–5 September
Östergötland28 July–18 August19 August–9 September10 August–1 September13 August–3 September
Västra Götaland28 July–18 August19 August–9 September10 August–1 September13 August–3 September
Skåne21 July–11 August13 August–3 September7 August–28 August9 August–30 August
Table 2. Cereal crop area distribution (%) on virtual farms in the four Swedish regions studied *.
Region/CountyWinter
Wheat
Spring
Wheat
Spring BarleyOatsTotal
Västmanland31123225100
Östergötland6651910100
Västra Götaland3662434100
Skåne514405100
* Values based on the crop relative area over four years (2015–2018) at the county level, data from the Swedish Board of Agriculture (Jordbruksverket [50]).
Table 3. Grain yield (kg·ha−1) for crops grown on virtual farms in the four Swedish regions studied *.
Region/CountyWinter WheatSpring WheatSpring BarleyOats
Västmanland5573431646174149
Östergötland6829422850884035
Västra Götaland6189374749264433
Skåne7722520059984900
* Values based on standard yields for 2017 and 2018 for the respective county, data from the Swedish Board of Agriculture (Jordbruksverket [51]).
Table 4. Straw/grain yield ratio for the main cereal crops.
Winter WheatSpring WheatSpring BarleyOats
Straw: grain ratio [20] *0.60.660.370.52
* Cutting height 20 cm.
Table 5. Estimated harvestable straw quantities (kg·ha−1) for the main cereal crops in the four Swedish regions studied *.
Region/CountyWinter WheatSpring WheatSpring BarleyOats
Västmanland3344284817082157
Östergötland4097279018832098
Västra Götaland3713247318232305
Skåne4633343222192548
* Straw quantities based on grain yields (kg·ha−1) in Table 3, multiplied by the straw/grain ratio for each crop in Table 4.
Publisher’s Note: MDPI stays neutral with regard to jurisdictional claims in published maps and institutional affiliations.

