Article

On the Use of Cloud Analysis for Structural Glass Members under Seismic Events

Department of Engineering and Architecture, University of Trieste, 34127 Trieste, Italy
*
Author to whom correspondence should be addressed.
Sustainability 2021, 13(16), 9291; https://doi.org/10.3390/su13169291
Submission received: 14 June 2021 / Revised: 10 August 2021 / Accepted: 16 August 2021 / Published: 18 August 2021

Abstract

:
Current standards for seismic-resistant buildings provide recommendations for various structural systems, but no specific provisions are given for structural glass. As such, the seismic design of joints and members could result in improper sizing and non-efficient solutions, or even non-efficient calculation procedures. An open issue is represented by the lack of reliable and generalized performance limit indicators (or “engineering demand parameters”, EDPs) for glass structures, which represent the basic input for seismic analyses or q-factor estimates. In this paper, special care is given to the q-factor assessment for glass frames under in-plane seismic loads. Major advantage is taken from efficient finite element (FE) numerical simulations to support the local/global analysis of mechanical behaviors. From extensive non-linear dynamic parametric calculations, numerical outcomes are discussed based on three different approaches that are deeply consolidated for ordinary structural systems. Among others, the cloud analysis is characterized by high computational efficiency, but requires the definition of specific EDPs, as well as the choice of reliable input seismic signals. In this regard, a comparative parametric study is carried out with the support of the incremental dynamic analysis (IDA) approach for the herein called “dynamic” (M1) and “mixed” (M2) procedures, towards the linear regression of cloud analysis data (M3). Potential and limits of selected calculation methods are hence discussed, with a focus on sample size, computational cost, estimated mechanical phenomena, and predicted q-factor estimates for a case study glass frame.

1. Introduction

The large use of glass structures in civil engineering applications represents a challenging issue for designers. In addition to intrinsic mechanical features of the involved load-bearing materials [1,2], careful consideration should be paid in earthquake-prone regions to satisfy rigid resistance and displacement demands. This is the case of primary, stand-alone glass structures, but also secondary glass systems belonging to different primary buildings and constructional assemblies [3,4,5,6,7,8].
According to various literature studies, the seismic capacity of glass structures can benefit from innovative tools and special fasteners [9,10,11]. At the component level, refined calculation approaches and investigations of literature have been dedicated to both the pre- and post-cracked analysis of laminated glass (LG) elements [12,13,14], including considerations of their residual strength [15]. In any case, glass structures are still a rather new domain for several professional designers, and certainly require dedicated methods of analysis [16]. Among others, an open issue is represented by the seismic design of glass structures. Most of the available technical documents do not provide specific recommendations for glass [17,18], but suggest the use of “reliable calculation methods” to verify the seismic resistance/displacement capacity of glass components and restraints. Such a technical difficulty is further enforced by the need for a realistic calibration of the expected q-factor [19].
The main goal of present study, in this regard, is to assess the sensitivity of q-factor for glass structures based on simplified or more advanced calculation approaches. As shown in Section 2, consolidated strategies are common for conventional constructional typologies/materials. Moreover, the q-factor itself (with q > 1) is known to represent the intrinsic dissipation capacity of the structure/material to verify. At the same time, established performance indicators (or “engineering demand parameters”, EDPs) in support of seismic analysis and design are available in literature for structural members and systems made of steel, reinforced concrete, timber, or masonry, while such a calibration is missing for glass. To summarize the present discussion, the numerical analysis is focused on a case study glass frame that was earlier investigated in [19]. Differing from [19], however, the attention was given to the seismic performance and capacity of the full-size frame, rather than its key base connections only. To this aim, an original finite element (FE) numerical model was developed and optimized to support the local/global analysis of the frame as a whole. Extended sets of non-linear dynamic analyses were in fact carried out for the frame under in-plane seismic lateral loads. In doing so, three selected methods of analysis that are deeply consolidated for ordinary constructions (M1 to M3 in Section 3) were adapted to the examined structural glass frame and assessed for the q-factor prediction. Basic comparative calculations were first carried out with the support of the incremental dynamic analysis (IDA) approach for the herein called “dynamic” (M1) and “mixed” (M2) procedures. The cloud analysis procedure (M3), as shown, is characterized by high efficiency compared to M1 and M2 methods, but requires the calibration of specific EDPs for glass, as well as an accurate selection of input signals for the structural system to verify. FE comparative results are thus discussed in Section 4, Section 5, Section 6 and Section 7, showing the potential and limits of selected M1 to M3 calculation methods, in support of a realistic and computationally efficient estimation of seismic behavioral trends for glass structures, thus resulting in their optimized structural design.

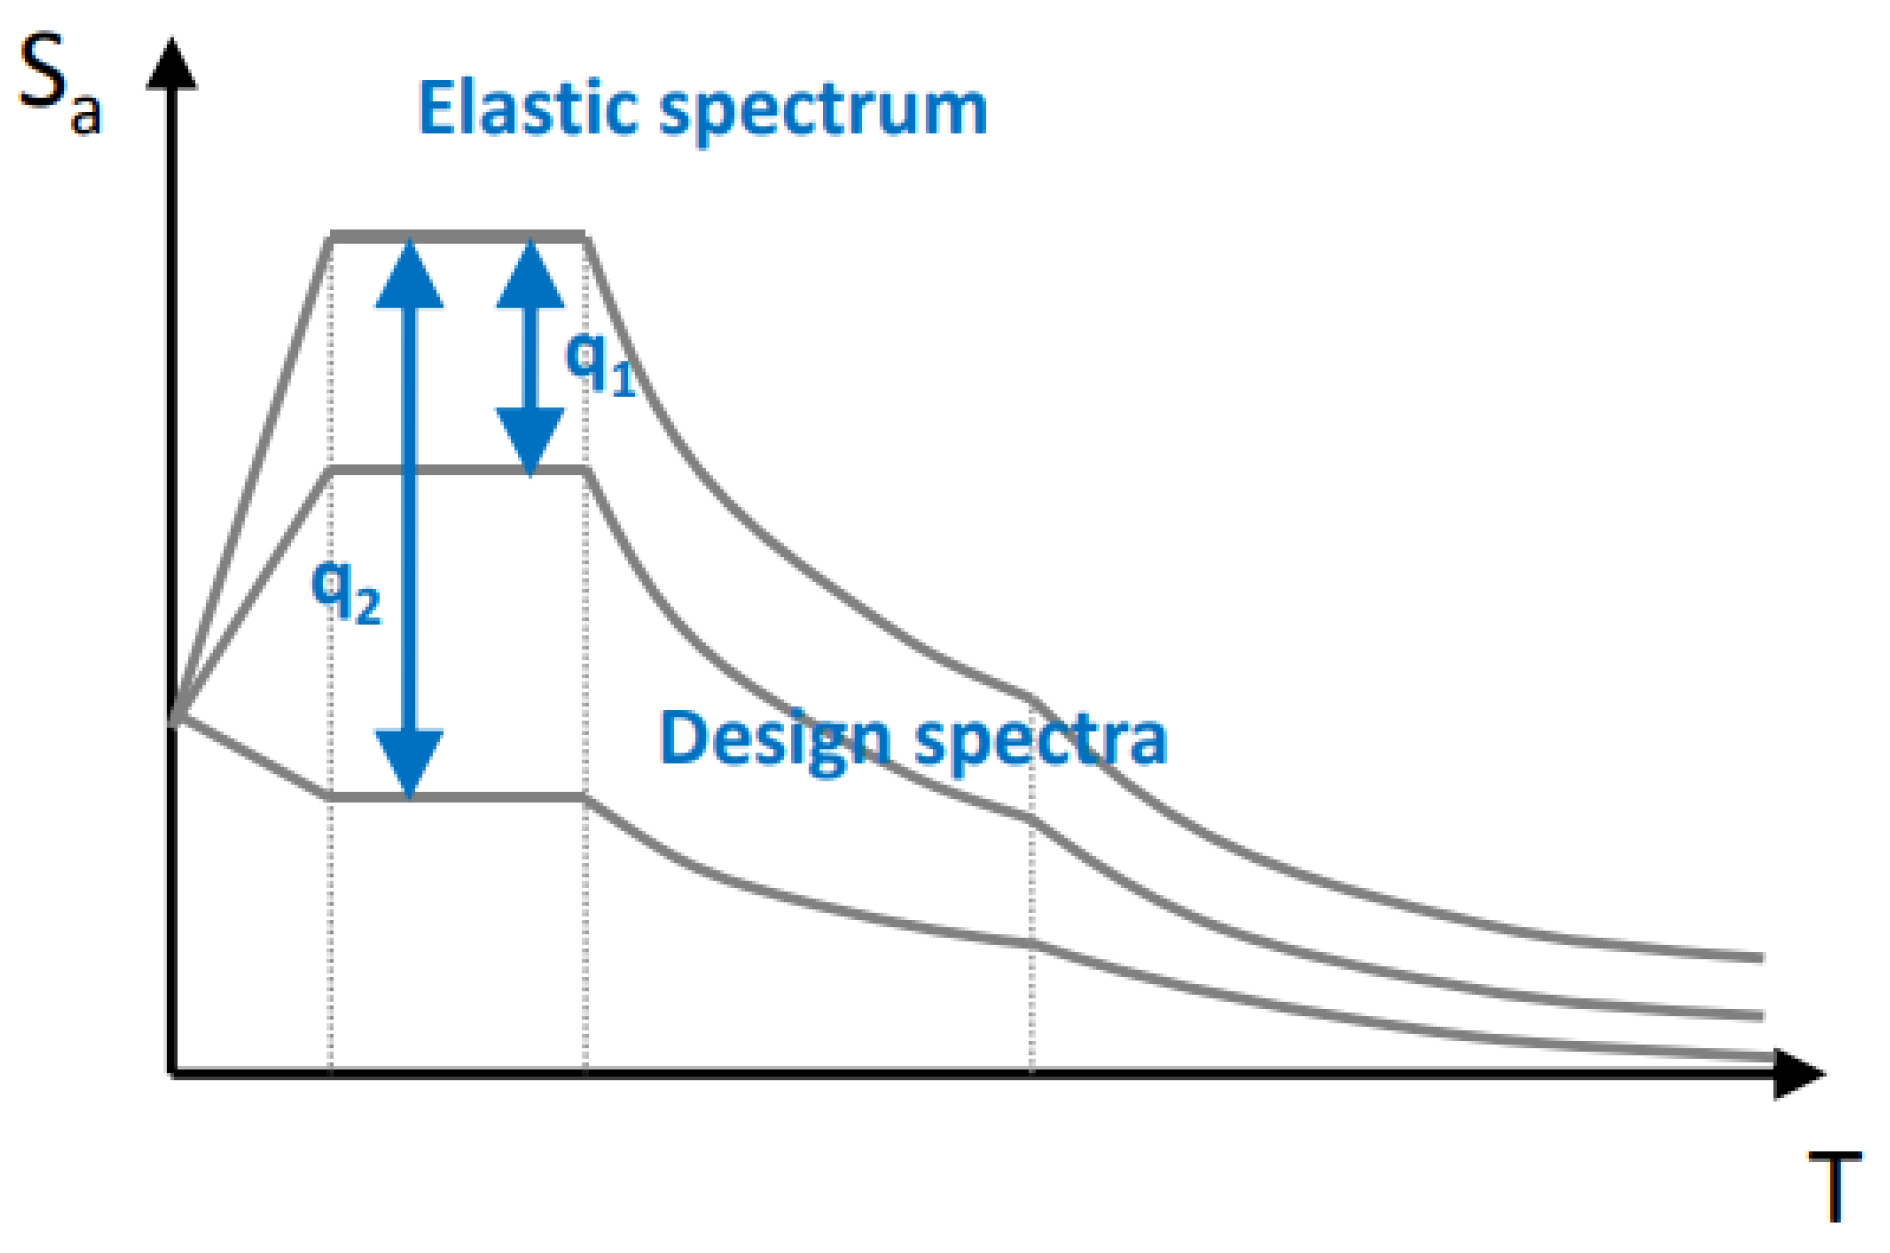
2. State-of-Art and Literature Review on q-factor Methods

Following EC8 [17], the seismic design of buildings is today conducted by using the so-called force-based design (FBD) method. The design base shear is conventionally obtained as the ratio between the elastic base shear and the q-factor of the structure to verify (Figure 1). The q-factor introduction, as such, simplifies its complex energy dissipation capacity (by means of plastic deformations) to a linear elastic model. Due to its strategic role, the q-factor definition is thus a topic which has been deeply discussed in the seismic engineering field as a primary focus of several studies since the 1950s.
A first simple formulation was proposed for the q-factor in the 1980s [20]. Further, it was first recognized by the modern design strategy that structures able to resist severe earthquakes are expected to experience permanent damage. As a matter of fact, design seismic actions are scaled by taking advantage of an intrinsic plastic capacity that is correlated to irreversible deformations.
Typical q-factor values by EC8 are known to span in the range of 1.5 (inverted pendulum systems), 2.0 (torsionally flexible systems), and 3.0 (frame systems), or even higher. Due to this, these constant EC8 values should be generally treated as an upper bound, and thus moving the decision on the acceptable level of damage becomes a designer responsibility. This decision is directly affected by structural features, details, and material properties. In such a general discussion, the choice of standards to adopt constant q-factor values looks very conservative. Several literature studies proved that the dissipative capacity of a structure is generally greater than the recommended limit values. For example, as concerns steel moment resisting frames (MRFs), the EC8 prescribes different q-factors for medium (DCM, local plastic deformations) or high (DCH, global plastic deformations) ductility classes. Macedo et al. [21] evaluated the consequences of adopting the EC8 recommended q-factor and presented a more rational selection methodology based on the specific structure and the site seismic hazard. Costanzo et al. [22] discussed existing design provision for both MRFs and chevron concentrically braced frames (CCBFs), giving evidence of a large lateral overstrength due to the codified design requirements. Also for reinforced concrete frames, studies by Kappos [23], Borzi and Elnashai [24], and Chryssanthopoulos et al. [25] assessed the reliability of q-factor values by EC8, and emphasized their high conservativity. Although the cited results from [23,24,25] looked conflicting, the joint EC8 conservatism was jointly justified with either structural overstrength or ductility supply, or both the aspects. In this context, it is thus recognized that the primary goal of standardizing committees is to simplify, on the safe side, the computational burden for designers. Such a strategy makes it possible to avoid performing complex non-linear analyses, but at the same time can severely limit the actual structural plastic capacity of the examined building systems.
For glass structures, to date, legislative and research efforts have not provided a general recommendation about realistic q-factor values that could be adopted in design. Furthermore, it is already required to satisfy global and local verifications for resistance and displacement capacities in seismic conditions [3]. As such, the typical effect often takes the form of fully elastic design (q = 1). The present study aimed to investigate further the expected structural behavior trends of seismically loaded glass members, based on the observations of a case study frame. Calibrated parameters are presented to possibly support the adaptation of consolidated general procedures to glass structures. The potentials/issues of available methodologies are assessed towards the q-factor calculation for similar structural typologies.

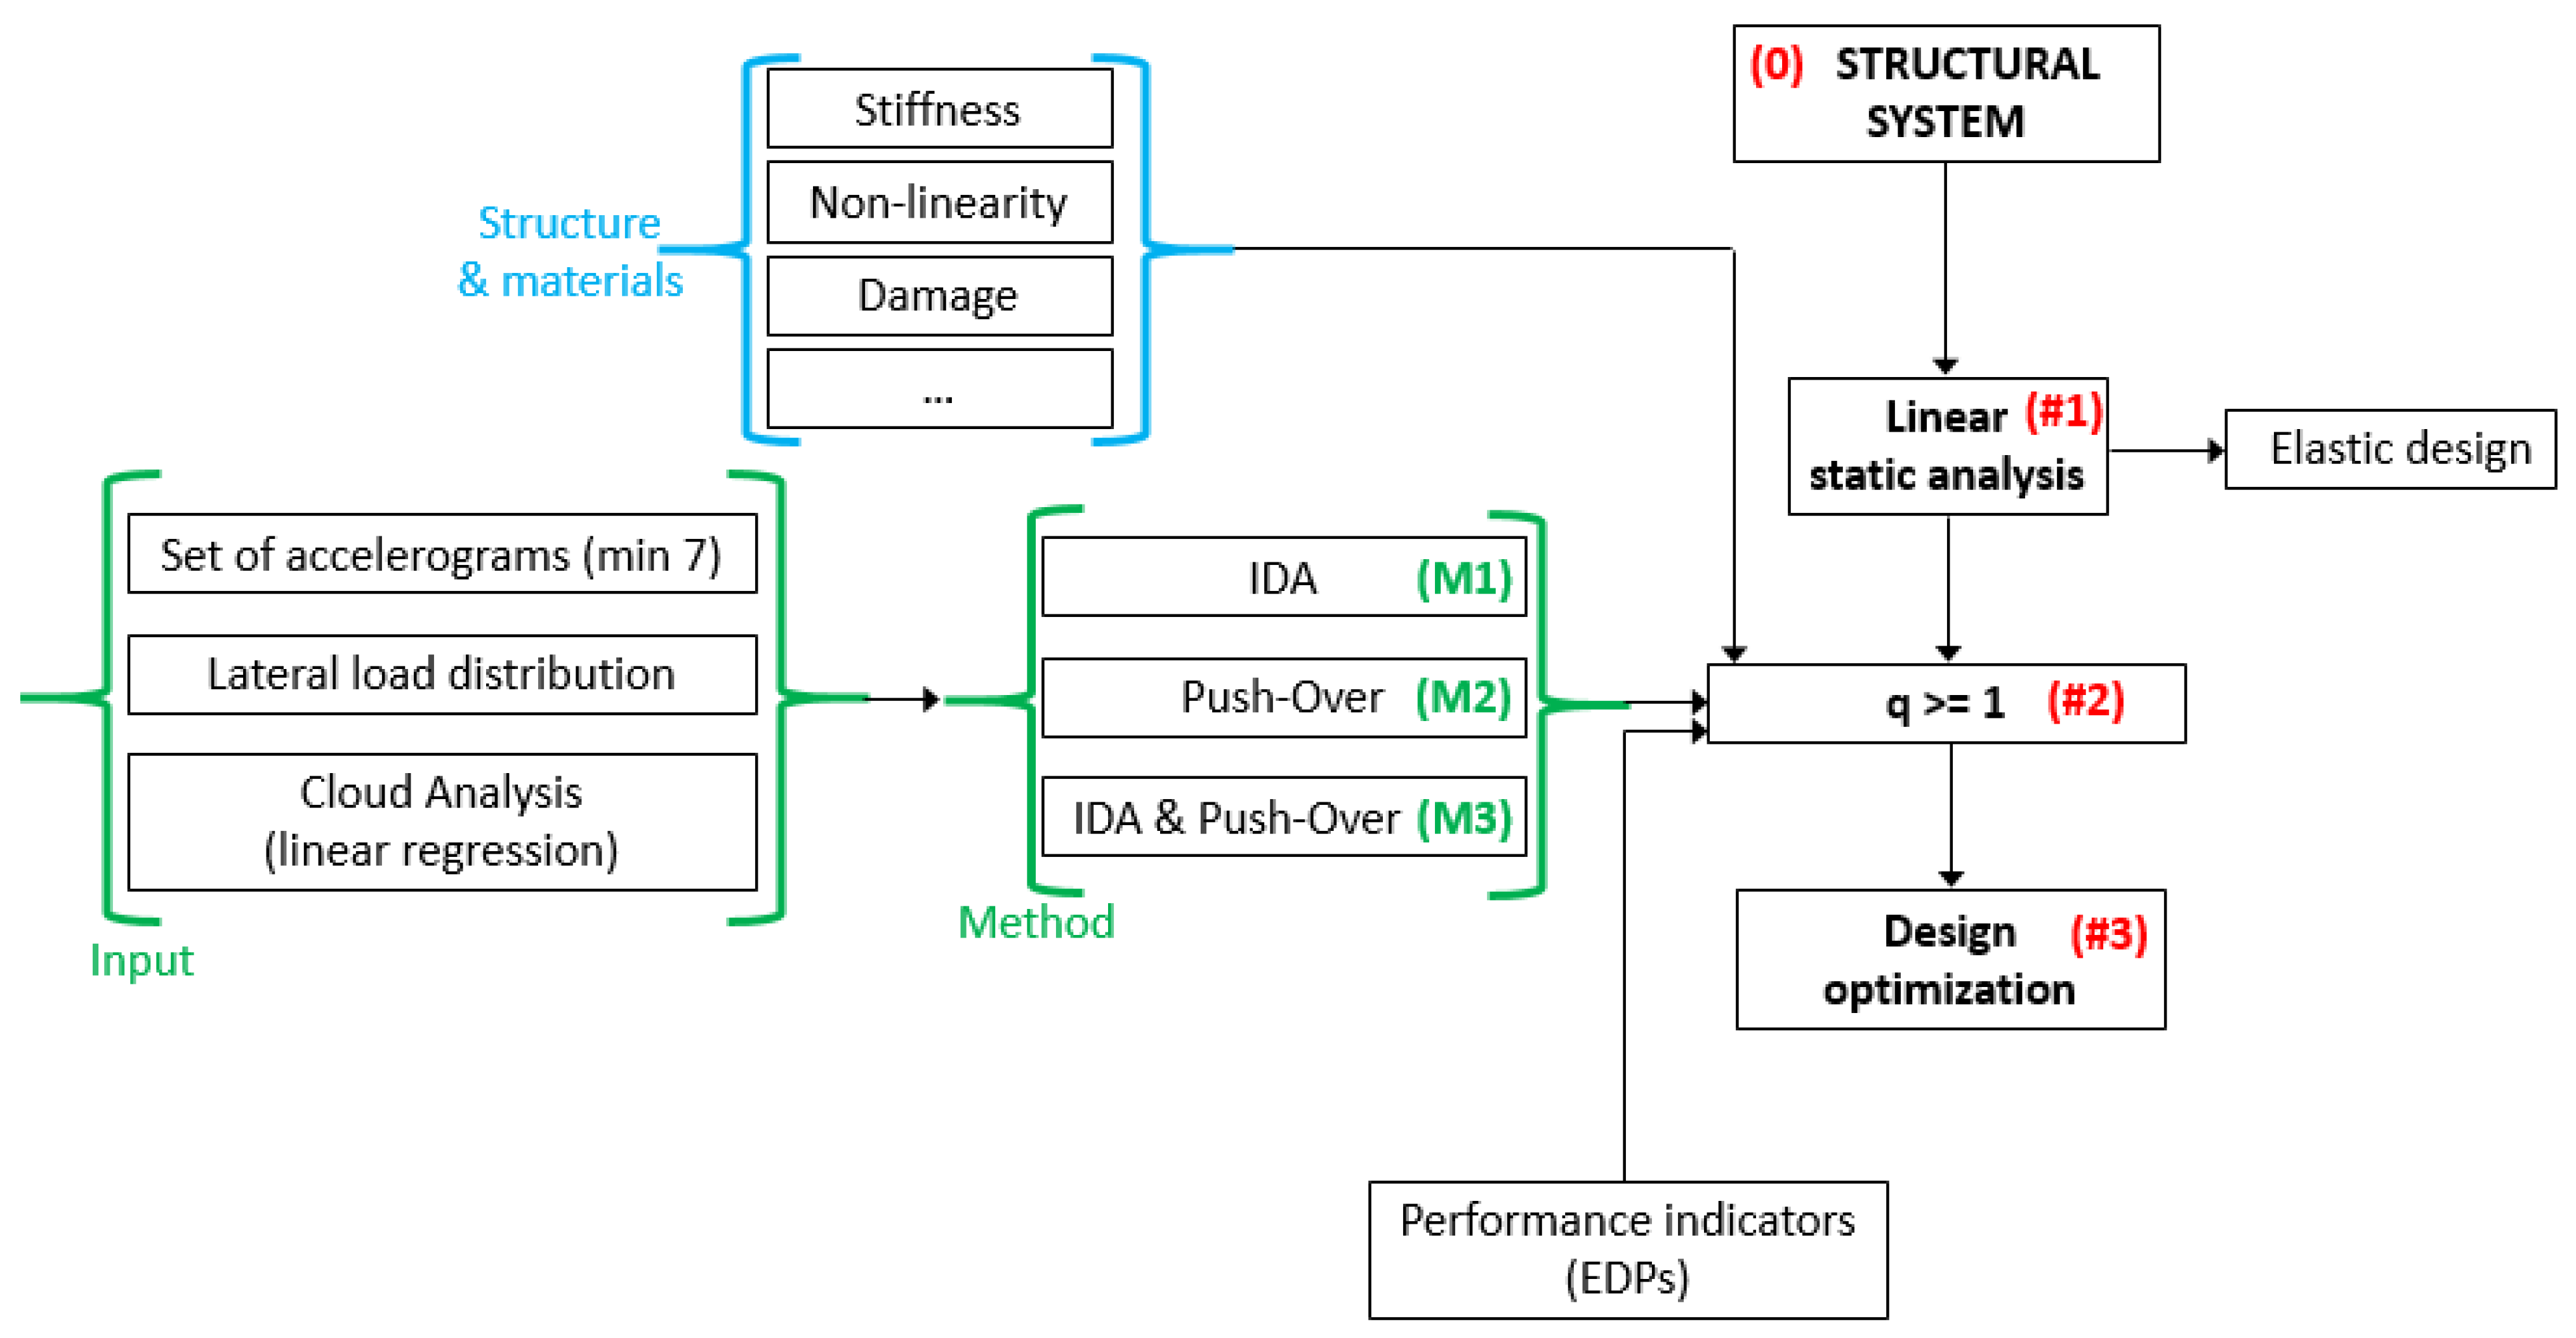
3. q-factor and Selected Calculation Methods

Different approaches can be used from literature to analytically or numerically predict the q-factor of a given structural system [26]. As far as the computational effort and accuracy of a method increase, and the reference EDPs are well defined, moreover, the q-factor estimation is progressively more robust and reliable. Figure 2 shows a typical push-over (PO) analysis result for a reinforced concrete building, in which the EDPs are qualitatively pointed out, depending on various performance levels and limit states. As usual, the most common EDPs are represented:
  • for structural components, by inter-story drift ratios (IDR), with inelastic component deformations and associated forces;
  • for non-structural components (and contents), by inter-story drift ratios (IDR) or peak floor accelerations (PFA), see [27,28,29].
It is worth noting that recommended EDPs are available for traditional constructional materials and systems, but these parameters cannot be directly transferred to glass structures.
It follows that secondary glass members that take place in a primary building must necessarily accommodate the seismic performance and capacity of the building itself (and thus satisfy the corresponding EDPs). For primary/stand-alone glass structures, otherwise, no recommended parameters are available, and thus the present study tries to provide some research developments in this direction.
The above issue arises for novel structural systems and/or innovative materials (glass included), for which no or indicators are provided by design standards for earthquake resistant buildings. Relevant examples of literature can be found in [30,31,32,33,34,35].
From a practical point of view, the flowchart in Figure 3 can be adapted to general constructions/materials, once standardized procedures are established and a primary calculation method is chosen. In case of structural glass (as well as other innovative solutions), the critical step takes place in #2, as a direct/major effect of the analysis method choice and its input basic assumptions (first of all, the reference EDPs).
In the present paper, such an issue is further discussed with a focus on the structural glass frame described in Figure 4 and [19]. Three calculation methods (M1, M2, and M3 from Figure 3) are compared in terms of predicted q-factor, computational efficiency, accuracy, and sufficiency of results. In doing so, special care is taken for the detection of reliable EDPs that could be used for design, especially with regard to the key configurations of yielding and collapse. The so-called M1, M2, and M3 methods herein explored find inspiration from literature, but in the current study are specifically adapted to glass frames. Examples for traditional structures can be found in [36], as regards the M1 (Section 3.1) and M2 (Section 3.2) methods whilst, for the M3 one (Section 3.3), the procedure in use for the construction of fragility curves is adapted to glass. As such, the M3 q-factor is derived from linear regression on a cloud of points that is obtained from non-linear time-history analyses.

3.1. Dynamic (or PGA) Method (M1)

The dynamic (or PGA) method (M1) conventionally defines the q-factor as the ratio between PGAu and PGAy, that is the peak ground acceleration values corresponding to “collapse” or “first yielding” respectively:
q = PGA u PGA y
In accordance with Equation (1), IDA were thus carried out in this paper. Based on Figure 4a and a set of input accelerograms, sequential non-linear time-history numerical analyses were performed to estimate the PGAu and PGAy values of interest. A minimum set of 7 input signals was taken into account [17].

3.2. Mixed Method (M2)

The mixed (M2) method examined in this paper still takes advantage from efficient FE simulations. The q-factor estimation was based in this case on two different contributions, that is:
q = PGA u PGA y · V y V d
In Equation (2), PGAu and PGAy values agree with the definition in Section 3.1, and can be derived from the non-linear IDA for the structural system object of analysis.
At the same time, Vy and Vd in Equation (2) denote the base shear load corresponding to “first significant yield strength” and “allowable design strength”. These base shear values were conventionally derived from non-linear PO simulations according to Figure 4b.

3.3. Cloud Analysis (M3) with Linear Regression

The q-factor of the examined frame was finally estimated in this paper by using the inelastic response spectrum, with the support of the so-called cloud analysis and the spectral acceleration (Sa) definitions [36]. Successful cloud analysis applications can be found in [37,38,39] for various structural typologies and materials.
Differing from Section 3.1 and Section 3.2 (IDA procedure), the cloud analysis is carried out with the support of a set of unscaled accelerograms. The set of input signals (60 in the present study, Table A1 [40]) must be established to ensure an appropriate distribution of cloud data [41,42]. It is in fact known that the major issue of IDA method may consist of a significant computational cost, and most often a marked scaling of original records to various intensity levels, before the desired EDPs could be achieved. This effort is not required in cloud analysis. Moreover, the use of unscaled natural accelerograms in cloud analysis allows to keep all the information related to the event, also known as “record-to-record variability”. From unscaled signals and non-linear dynamic analyses, the correlation is established between selected EDPs and some intensity measure (IM) values of the imposed signals by taking advantage of linear regression [37]. As in case of IDA, however, the unscaled signals require an accurate definition of reference EDPs and are also expected to cover a useful range of values for identifying the required limit states. These signals are thus sensitive to the fundamental vibration period T1 (to predict) and the characteristics of the structure to verify (material properties, damage mechanisms, etc.). Moreover, the input signals should be selected to be representative of the seismic hazard of the site under investigation. When appropriate signals are not available, site-specific ground motion modeling techniques can also be used [43,44,45]. Based on EC8, the q-factor can be finally calculated as:
q = S a ( T 1 ) u S a ( T 1 ) y
where Sa(T1) is the spectral ordinate corresponding to the characteristic period of the design spectrum. The subscripts “u” and “y” in Equation (3) refer to the “collapse” and “first yielding” configurations.

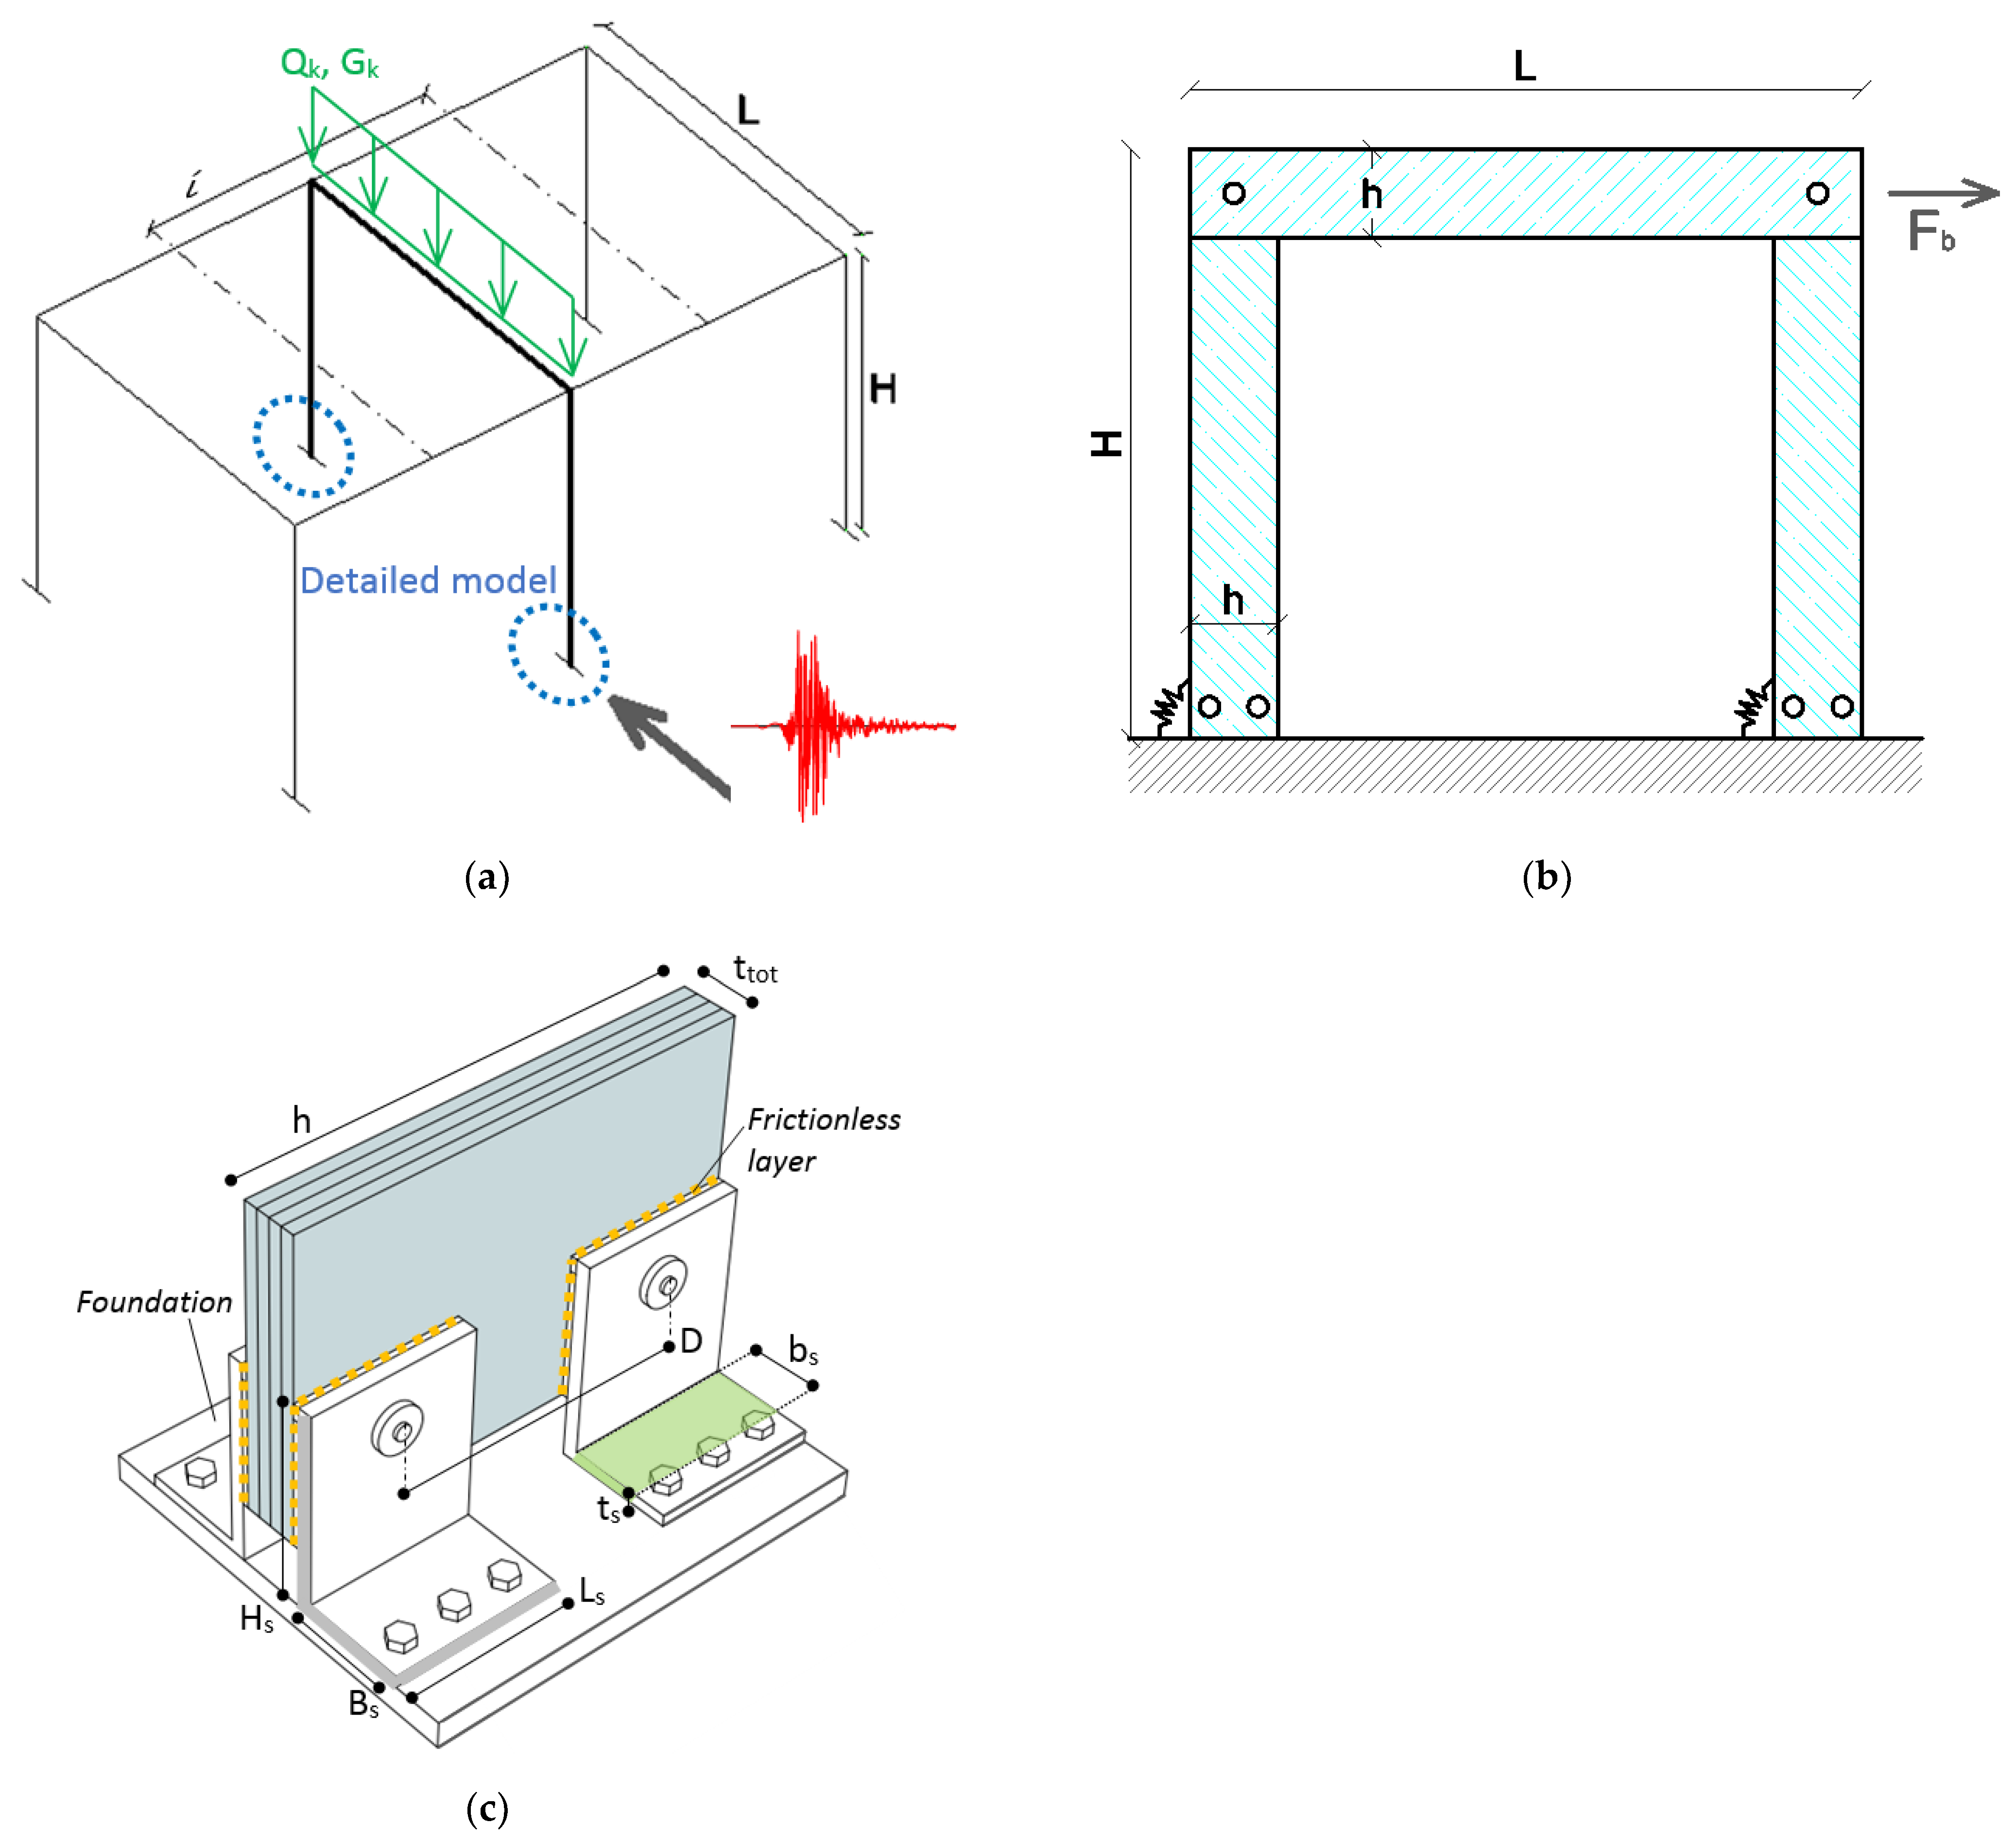
4. Case-Study Glass Frame

4.1. Geometrical and Mechanical Properties

The current research study follows and extends the analytical and numerical investigation reported in [19]. As such, some geometrical and mechanical features are summarized herein for the system in Figure 5a. Each glass frames followed the layout in Figure 5b, with H = 6 m and L = 8 m. Both the beam and column sections were composed of heat-strengthened (HS) LG members, with uniform size (h = 600 mm high × ttot = 66 mm thick) given by 5 × tg = 12 mm glass layers and tint = 1.52 mm thick ionoplast foils. The mechanical connection at each beam–column interception took the form of an ideal pin, see Figure 5b. Possible out-of-plane deformations of the frame were restrained, and the related mechanisms (including lateral-torsional buckling for beams [46,47], or coupled bending-compressive buckling for columns [48]) can be preliminarily disregarded. For the base restraints of columns, stainless steel pins pass through two holes in the glass (φg = 32 mm in diameter, with φ = 24 mm the nominal diameter of bolts and D = 500 mm their distance). Four mild steel brackets (S235 steel) fix the columns to the foundation (ts = 15 mm, Bs = 200 mm, bs = 165 mm, Hs = 300 mm and Ls = 200 mm). The restraint was finally locked by nb anchoring bolts (Figure 5c).

4.2. Preliminary Elastic Seismic Design of the Frame

For calculation purposes, the glazed assembly of Figure 5 is located in a high seismicity region of Italy. Based on [17,49,50], its strength and stiffness should be verified to resist the most unfavorable expected seismic combination of actions Ed, that is:
E d R d
where Rd is the structural capacity.
A simple design of glass members should properly verify that LG columns and beams are not subjected—due to the imposed in-plane seismic loads—to relevant stress peaks and premature fracture. As for regular structures in plan and elevation, the input seismic force Fi the frame should resist is given by:
F i = F b z i m i j n z j m j
with i = 1, …n, mi, mj the story masses and zi, zj their height from the foundation, while the base shear Fb is:
F b = S d ( T 1 )   W   λ q
and:
  • W the aboveground total mass of the building object of analysis,
  • Sd(T1) the design acceleration from the reference spectrum, as a function of the vibration period T1, with Sd = 0.35 g the peak ground acceleration (high seismic region of Italy),
  • λ = 1 a correction factor for one-story buildings with T1 > 2TC (otherwise 0.85), and
  • q ≥ 1 the behavior factor of the system.
Given the lack of more appropriate recommendations, the conventional design of the case study columns suggests the assumption that q = 1. Disregarding the vertical loads that the LG members must sustain (as a part of the framed system of Figure 5), the in-plane lateral force affects the region of glass holes at the base connections, that is:
σ t , m a x = K t · σ t = 2.71 · 77 208.9 M P a
with:
K t = 2 + ( 1 ϕ g h / 2 ) 3 = 2.71
the magnification factor for stresses [51,52,53], while the tensile stress σt in glass is given by:
σ t = F t ( h 2 ϕ g ) · t t o t 77 M P a
with:
F t = ( 0.5 · F b ) · H D = 1236 k N
The resistance verification of the LG columns in seismic conditions requires that:
σ t , m a x f g ; d
with:
f g ; d = k m o d k e d k s f λ g A λ g l f g ; k R M γ M + k e d k v ( f b : k f g ; k ) R M ; v γ M ; v
the design resistance [49]. Among the coefficients in Equation (12), the short-term duration of seismic events (conventionally set in 30 s [3]) suggests kmod = 0.78. Given that the columns are composed of HS glass, Equation (12) results in fg;d ≈ 75 MPa, that is ≈ 1/3rd the maximum stress from Equation (7), due to the seismic shear from Equation (6).
To avoid the improper sizing of load-bearing glass members, the design (with given input parameters) would require the exploitation of a minimum qmin ≈ 3. In other words, the ratio of Equation (7) to Equation (12) and combination with Equation (6) can be used for simple analytical estimates of (minimum) required plastic capacities of the frame, towards the seismic demand. In this regard, it is also worth noting that the analytical model developed in [19] for the ductility estimation of base angle brackets (and properly combined with the stress analysis in Equations (7)–(12)), would result in q = 4.58 (collapse governed by stress peaks in the region of glass holes). However, such an analytical prediction is not able to account for complex mechanisms in the frame as a whole, under dynamic seismic accelerations.

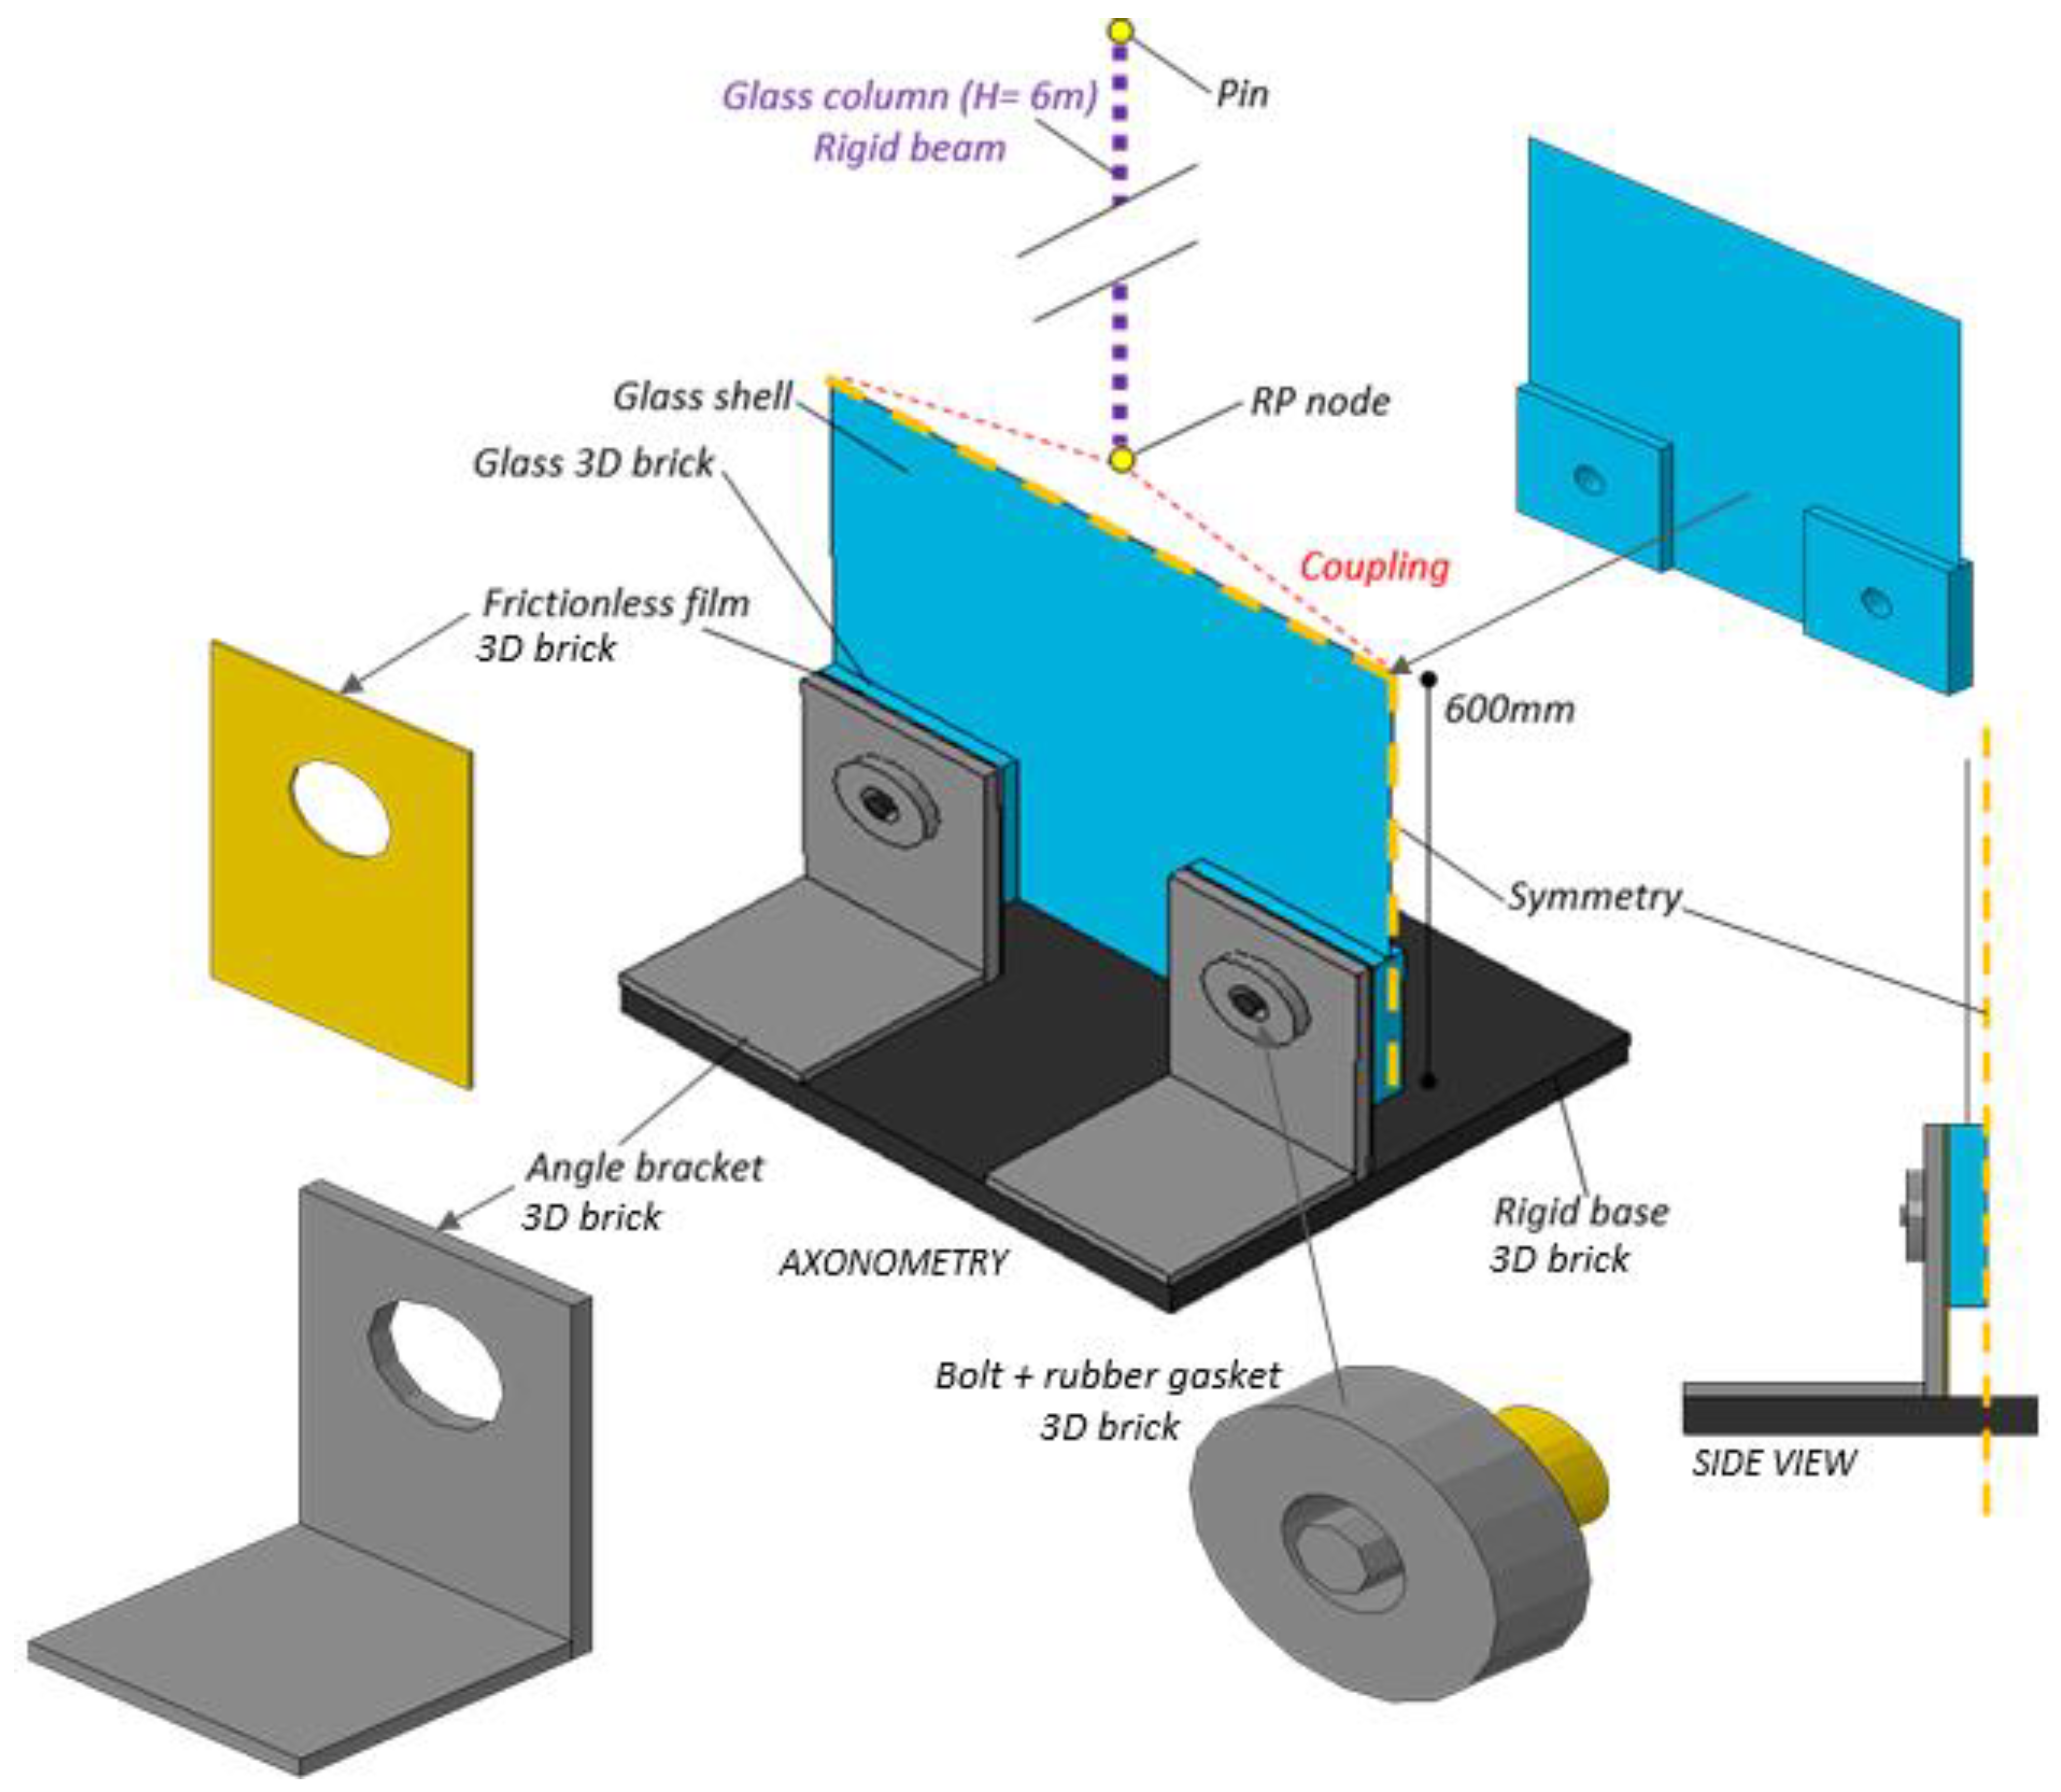
5. Finite Element Numerical Investigation

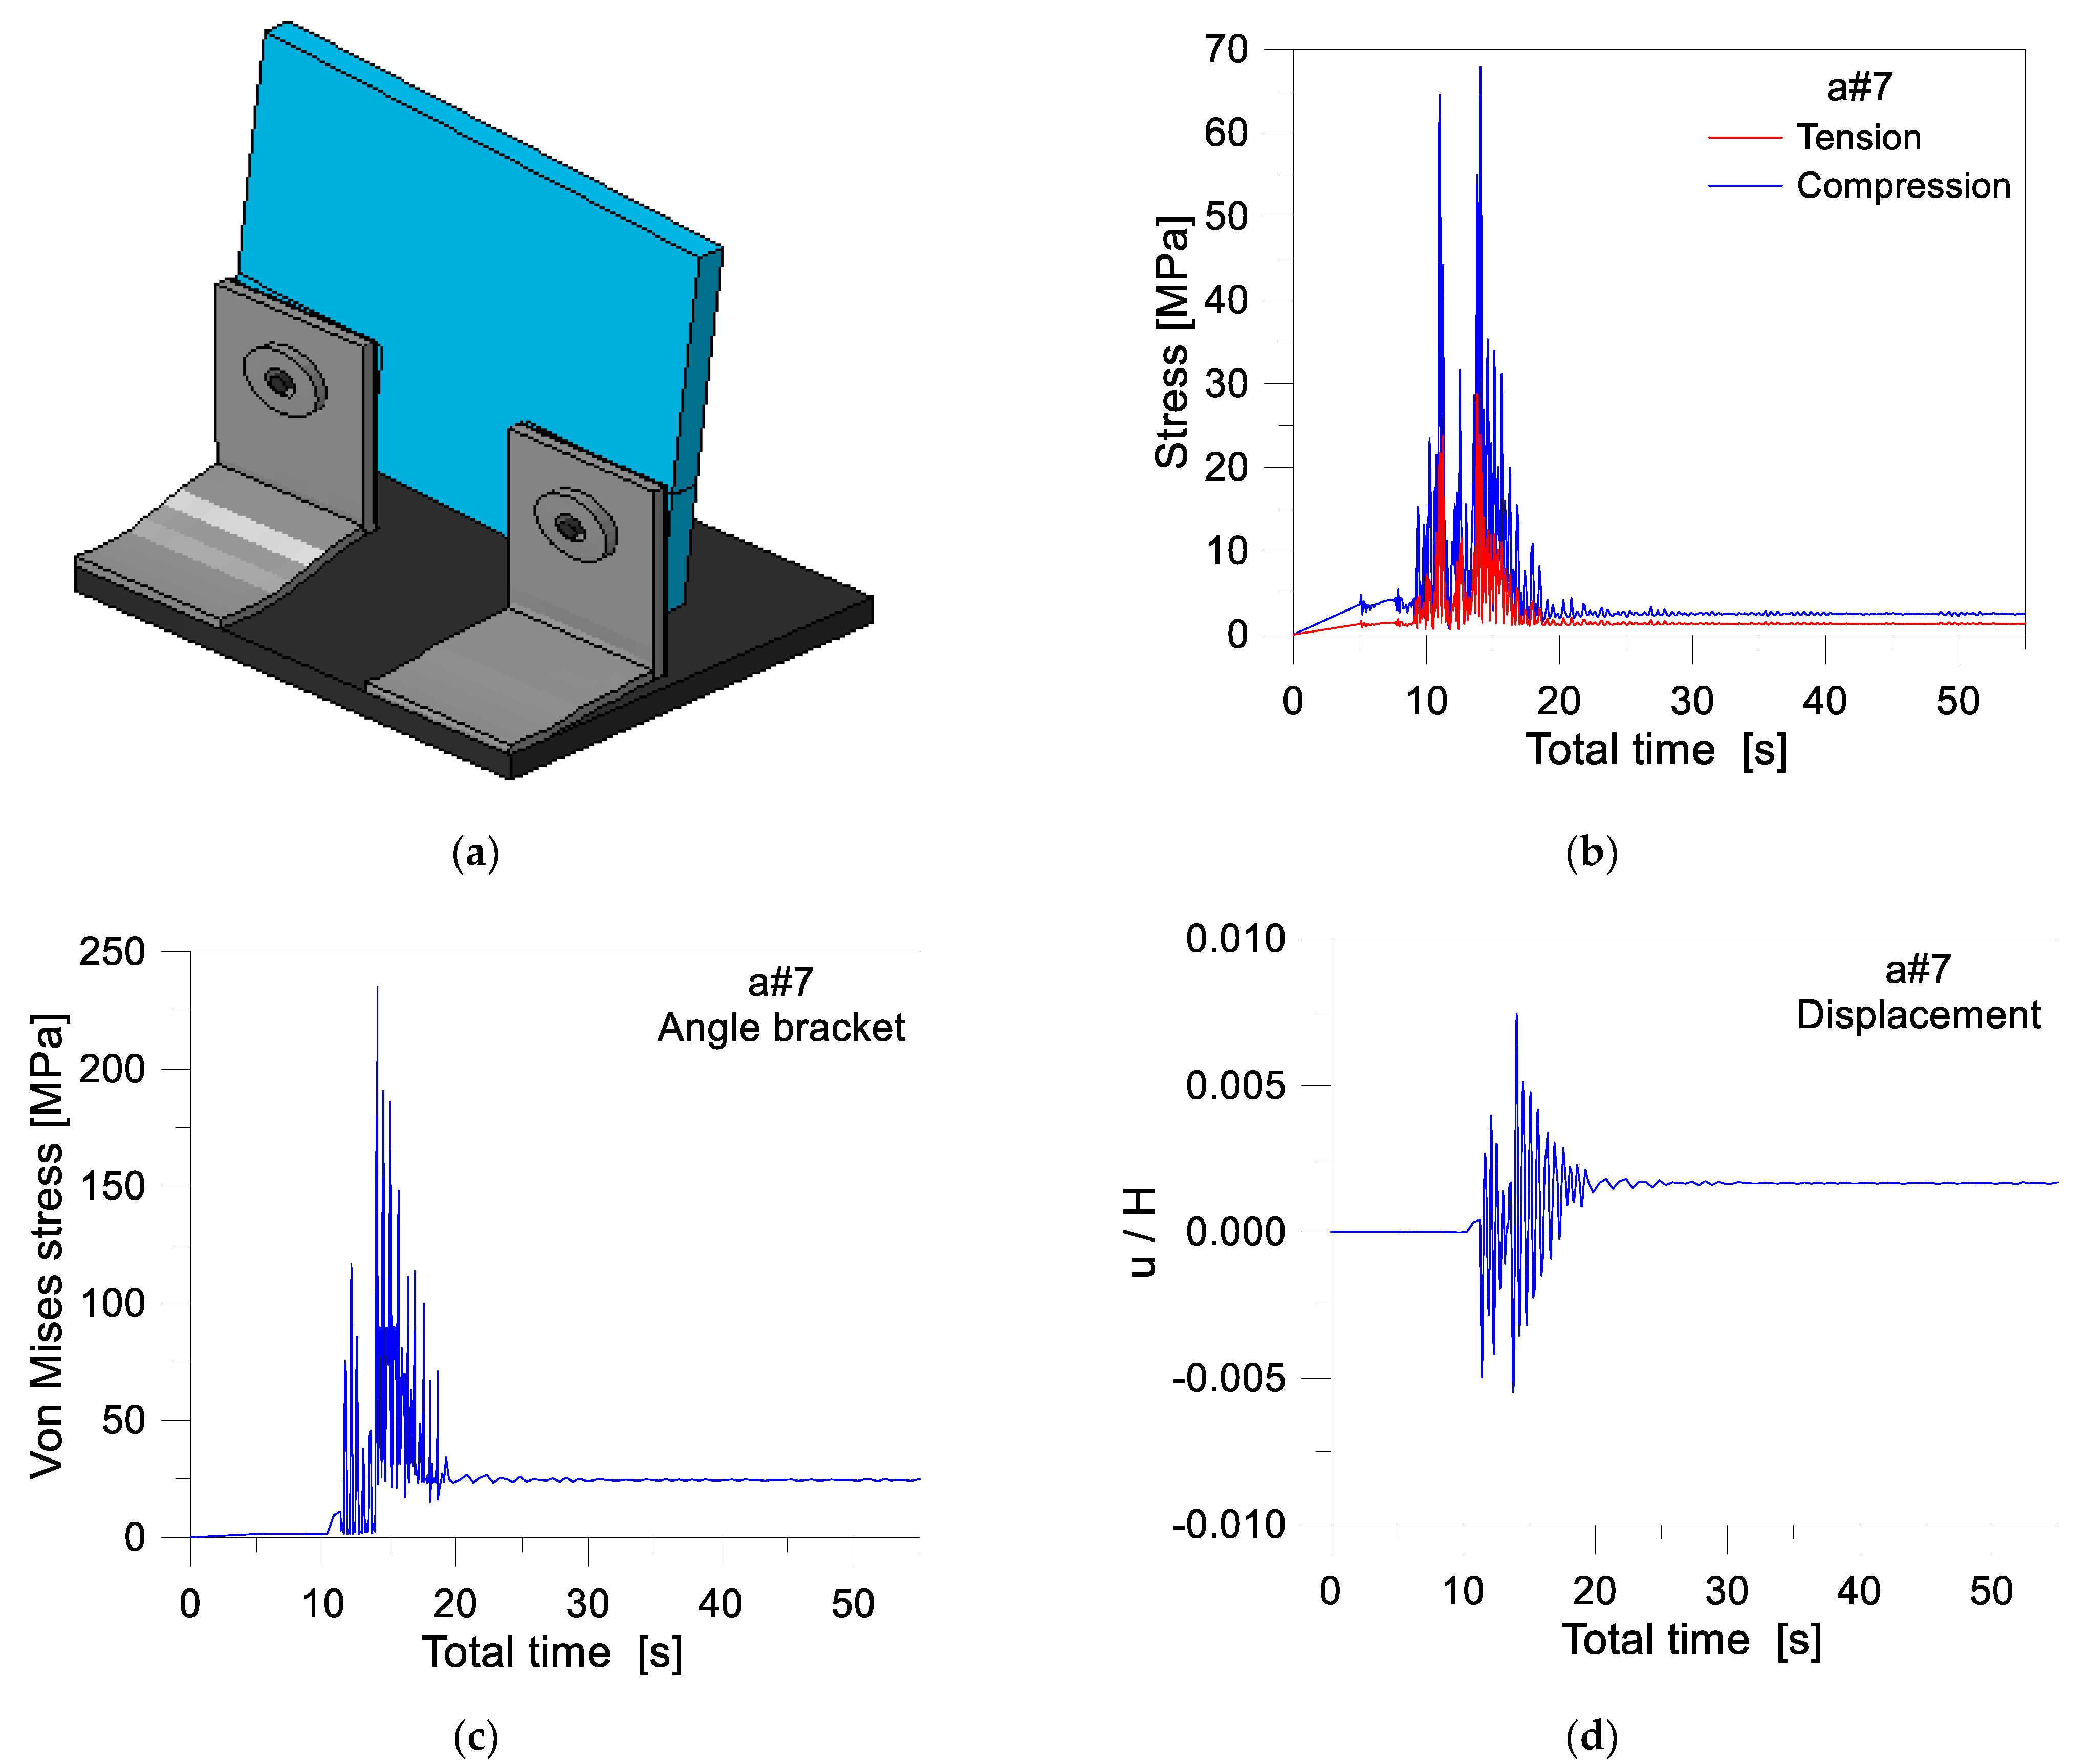
5.1. Numerical Model

The reference numerical analysis was carried out in ABAQUS/Standard [54] on a full three-dimensional model representative of the glass frame object of analysis, inclusive of LG members, and reproducing the geometrical details for base connections (Figure 6). For symmetry, 1/4th the geometry was taken into account.
Differing from [19], the seismic response of the frame as a whole was explored for the purpose of this study. To this aim, a novel optimized FE model was developed to maximize its computational efficiency.
Solid brick elements (C3D8R type from ABAQUS library) were used for rigid base support, angular members, frictionless foils, and bolts. For the glass plate, a mix of brick solid elements and shell elements was used to preserve the accuracy of stress distributions in the regions of holes. Finally, the column in elevation (and top beam) were described as pinned rigid beams. The overall symmetry assumption resulted in 18,000 solid/shell elements and 75,000 DOFs for the frame model in Figure 6. After preliminary validation, such a solution was used to replace the FE assembly from [19], in which a total of 45,000 solid elements and 170,000 DOFs were used for half geometry of the base connection only.

5.2. Materials and Contact Interactions

Key mechanical assumptions for glass and steel members were derived from [19]. An elastic-perfectly plastic law was used for mild steel, with Es = 210 GPa the modulus of elasticity, νs = 0.3 the Poisson’ ratio, and σs,y = σs,u = 235 MPa the yielding/failure strength, with corresponding strain values equal to εy = 0.112% and εu = 25%. The ductile damage material option was also accounted for in FE analyses to detect the possible initiation of ductile failure mechanism in angle brackets.
An elasto-plastic law was also used for steel bolts, with σb,y = σb,u = 1000 MPa the yielding/ultimate resistance (8.8 resistance class). Finally, the rubber layers were described in the form of an equivalent elastic-perfectly plastic material, with Er = 30 GPa and νr = 0.3. The yielding/ultimate stress was conventionally set at 2.4 MPa [19].
The tensile brittleness of glass was included with the concrete damaged plasticity (CDP) model from the ABAQUS library [19]. While the CDP model was primarily developed for concrete, literature studies show that the same model can be efficiently used for structural glass members (under specific loading/boundary conditions), as in the present application. From the post-processing of FE results, fracture initiation in glass was in fact assumed as a reference for “failure”. This means that the overall post-cracked stage was disregarded but the simulation was prevented from additional uncertainties that are typical of the post-cracked response of glass under cyclic loads. In doing so, the nominal mechanical properties for HS were taken into account (Eg = 70 GPa, νg = 0.23 and σtk =70 MPa). Further, the characteristic compressive strength was set to σck = 300 MPa (350–500 MPa [19] the reference strength).
A set of surface-to-surface contacts at the interface of adjacent FE components allowed to reproduce the in-plane lateral response of the frame under seismic loads (with “penalty” tangential characteristic (friction μ = 0.3) and “hard” normal features). “Tie” mechanical constraints were also used to rigidly connect some FE components (i.e., the head of each bolt and the corresponding angle bracket, or the frictionless layer and the adjacent angle bracket).

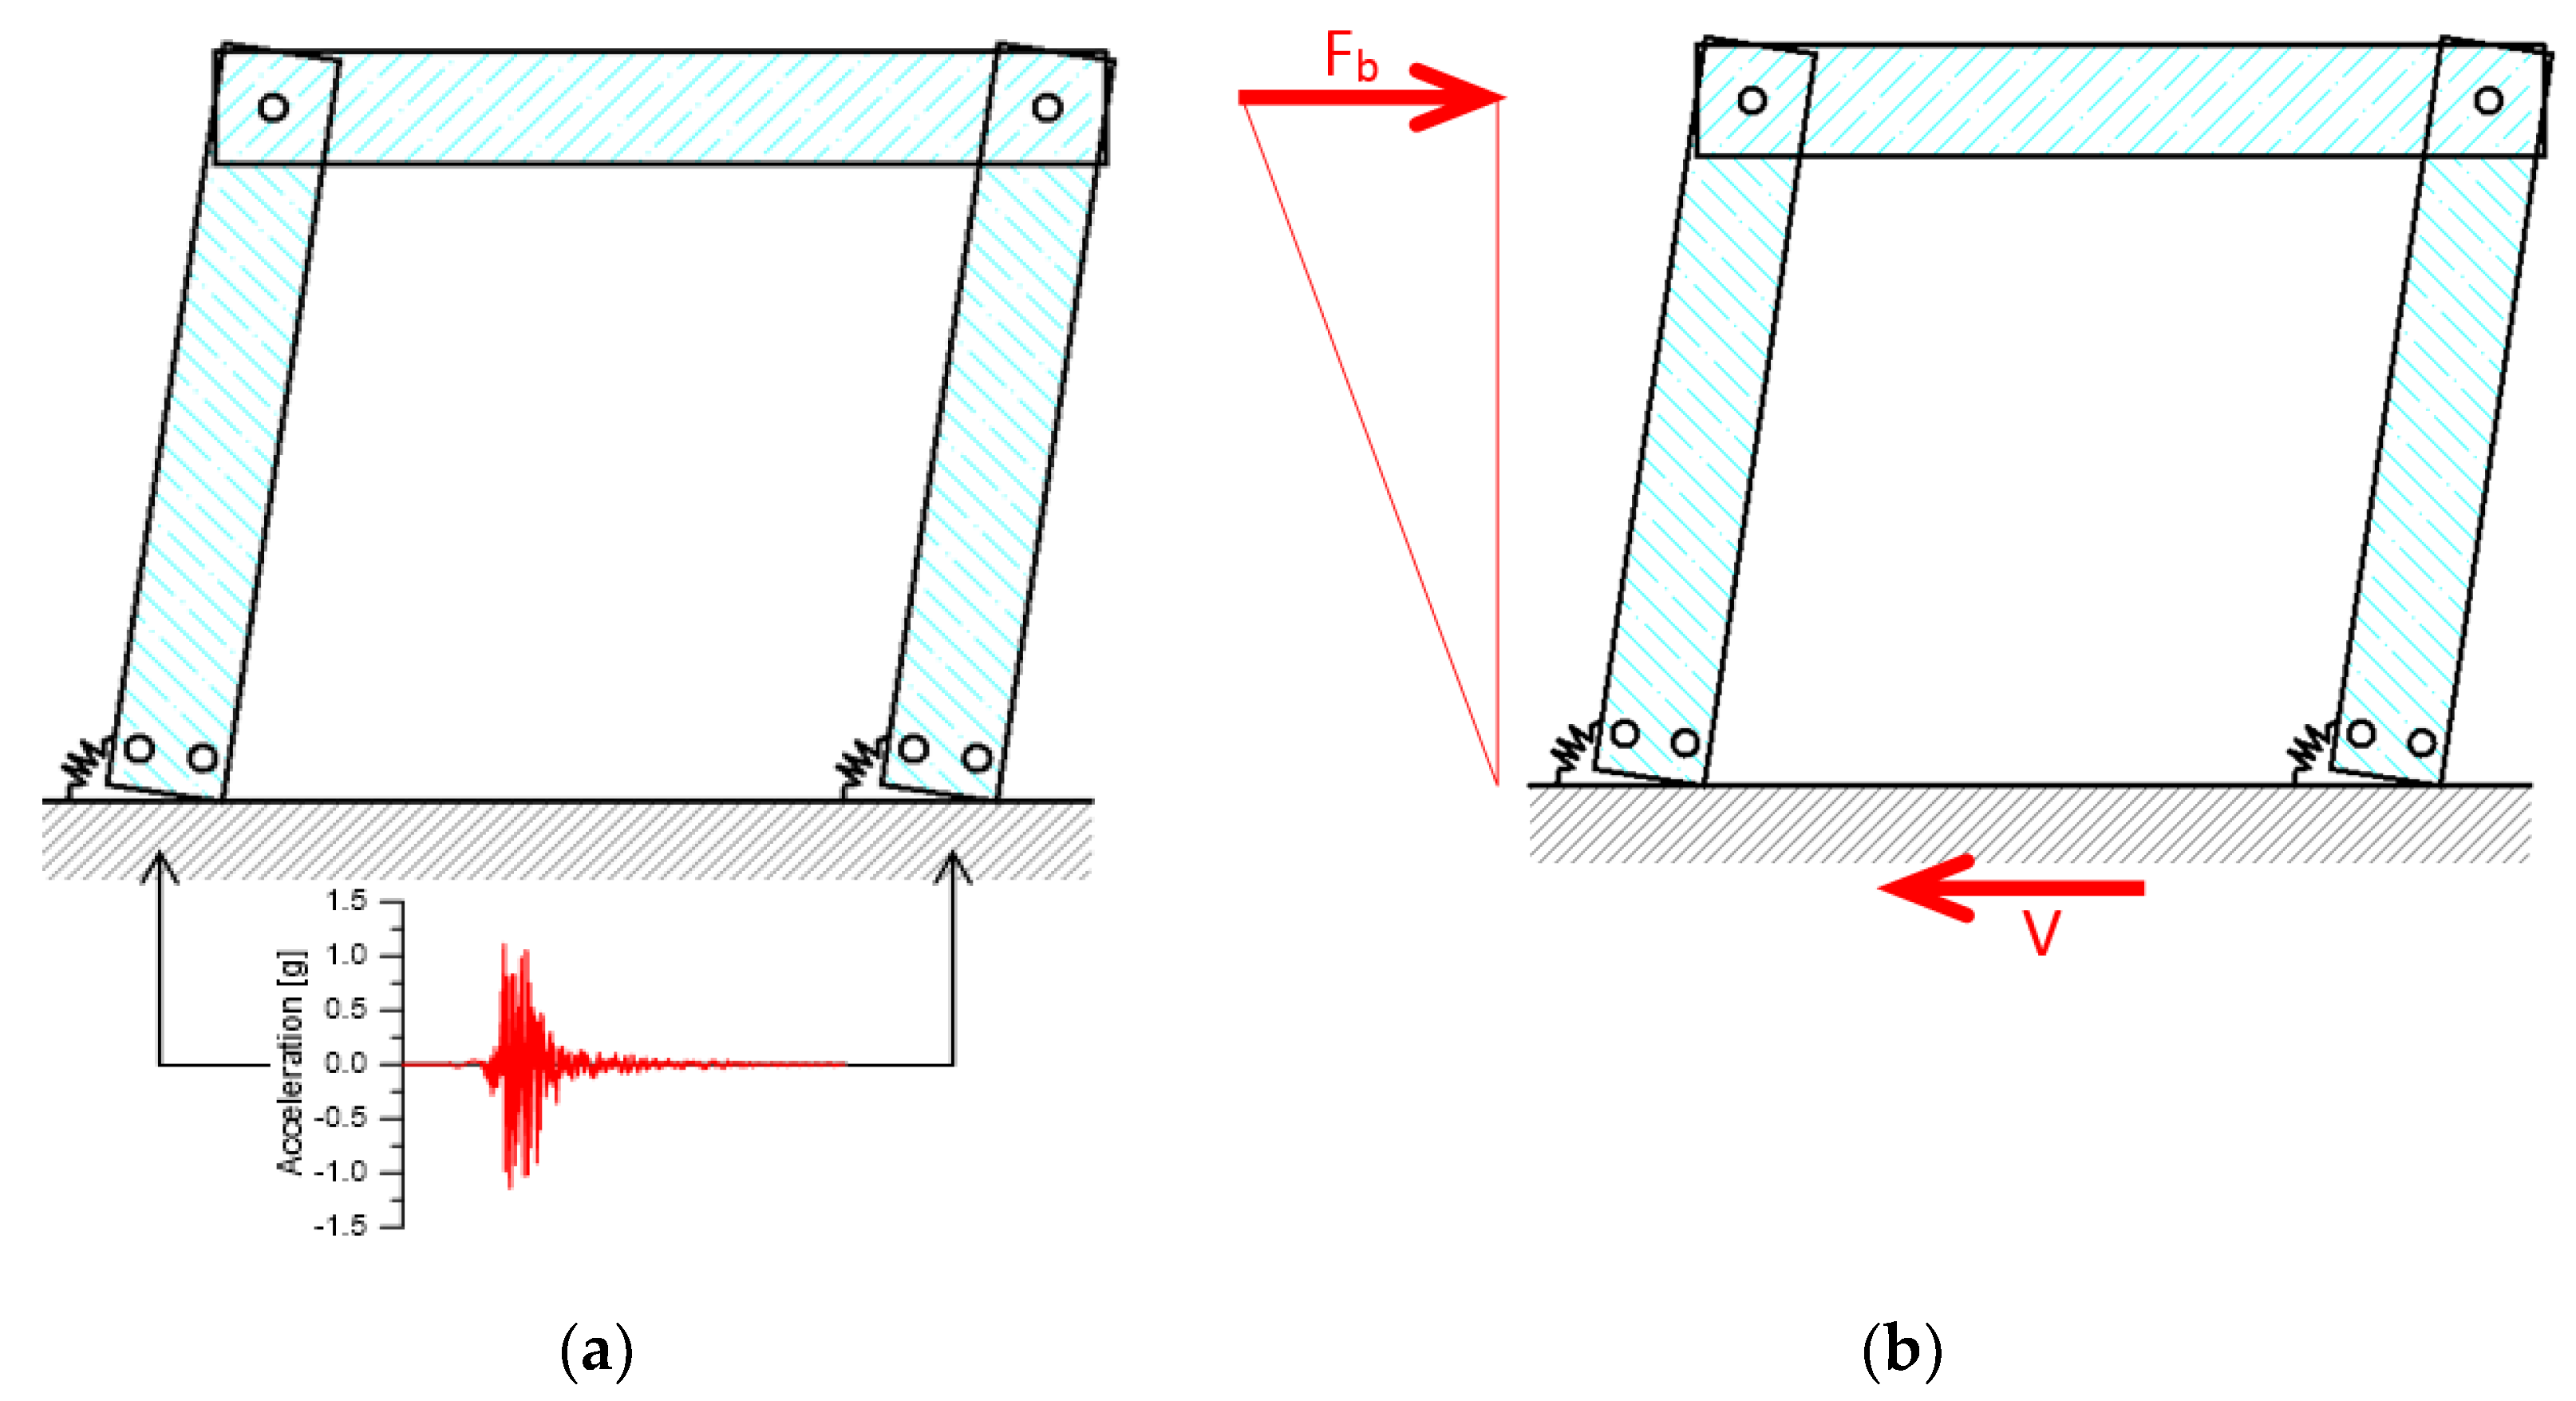
5.3. Loading Strategy

The frame was investigated by taking into account the presence of in-plane seismic loads and dead loads due to constructional members, plus a vertical accidental load Qk = 3 kN/m2 (with i = 1 m). The FE assembly of Figure 6 was used for both the required non-linear static PO and time-history dynamic analyses. As such, two different solving procedures were taken into account, based on two separate steps representative of:
  • S1 = an initial stage for introduction of dead and accidental loads (5 s), followed by
  • S2 = seismic analysis of the pre-loaded glass frame (60 s).
In case of IDA, the main seismic input consisted in the selected accelerogram in Figure 7 (acceleration-time history at the base of the frame for M1 and M2 methods). The used earthquake records were derived from [55], that is considering a PGA of 0.35 g, with type A soil (rock soil), topographic category T1, and a reference nominal life of 50 years. A maximum lower and upper tolerance of 10% was also considered.
For the PO analyses (M2 approach), otherwise, the FE system of Figure 6 was subjected to a linear increasing in-plane shear force in accordance to Figure 7 (base connection rigidly fixed to ground). Finally, in case of cloud analysis (M3), a total of 60 unscaled signals (Table A1 [40]) was taken into account to replace the 7 input signals of M1 and M2 procedures.

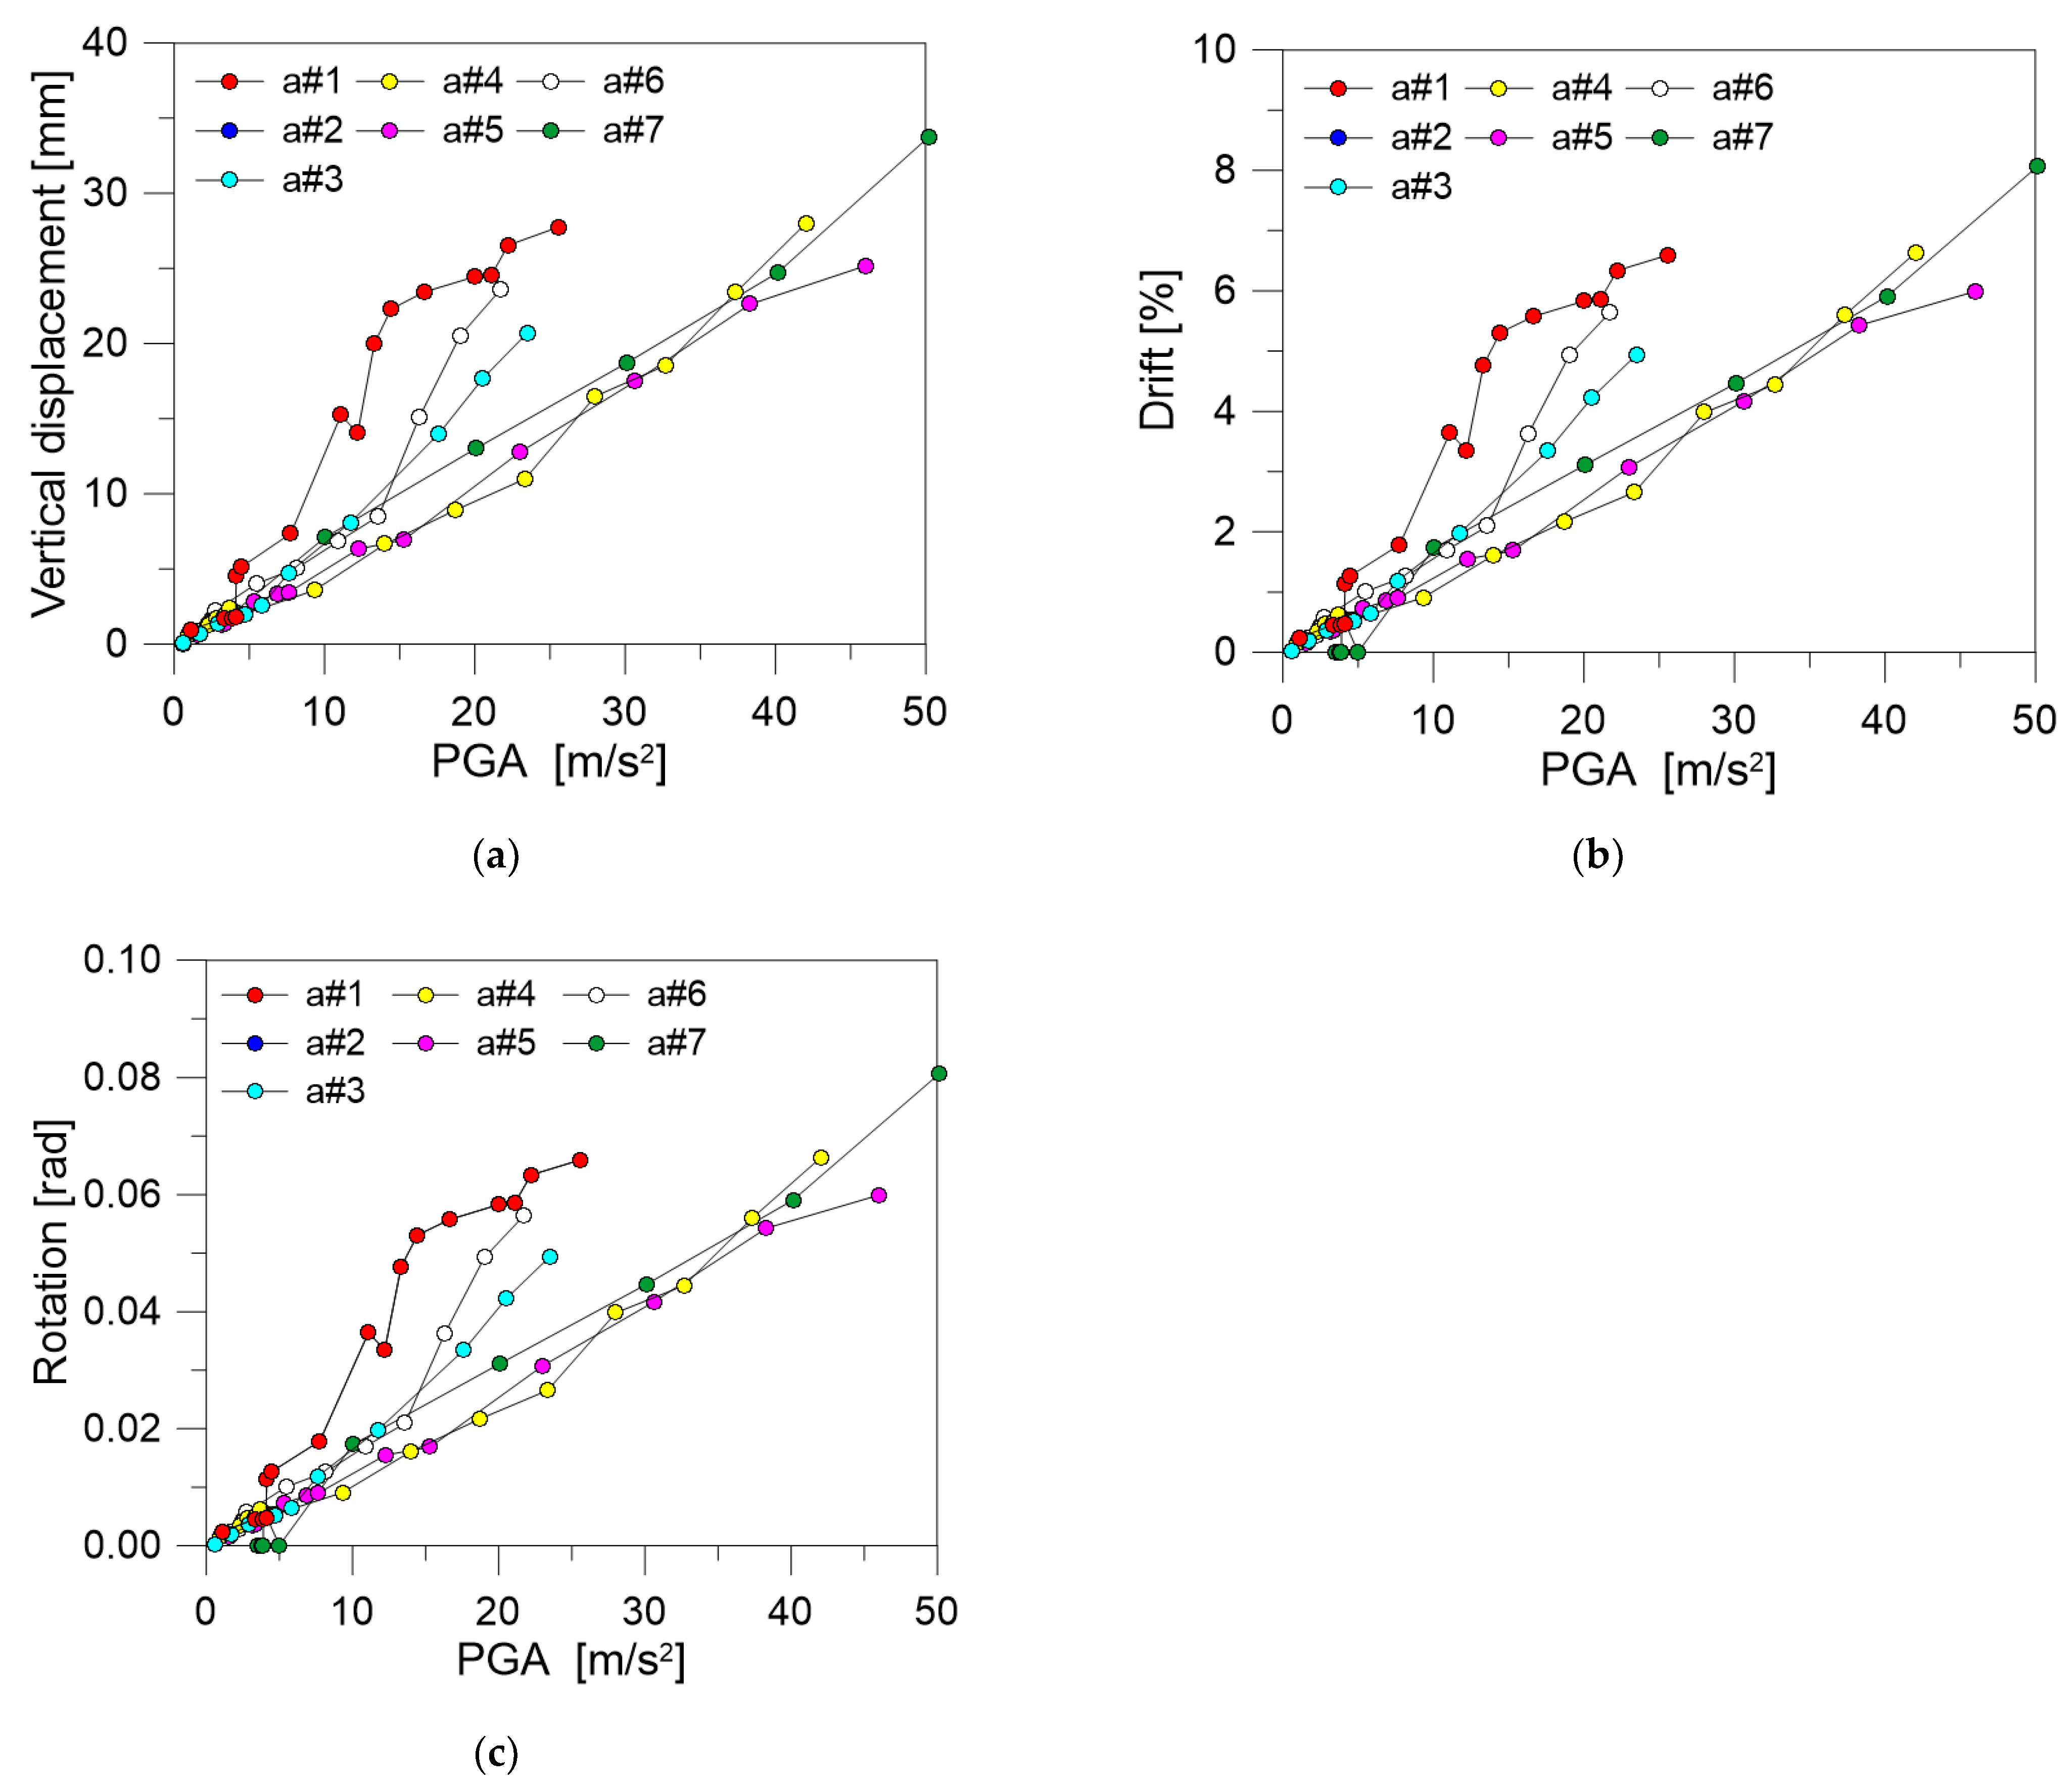
6. Discussion of M1 and M2 Results

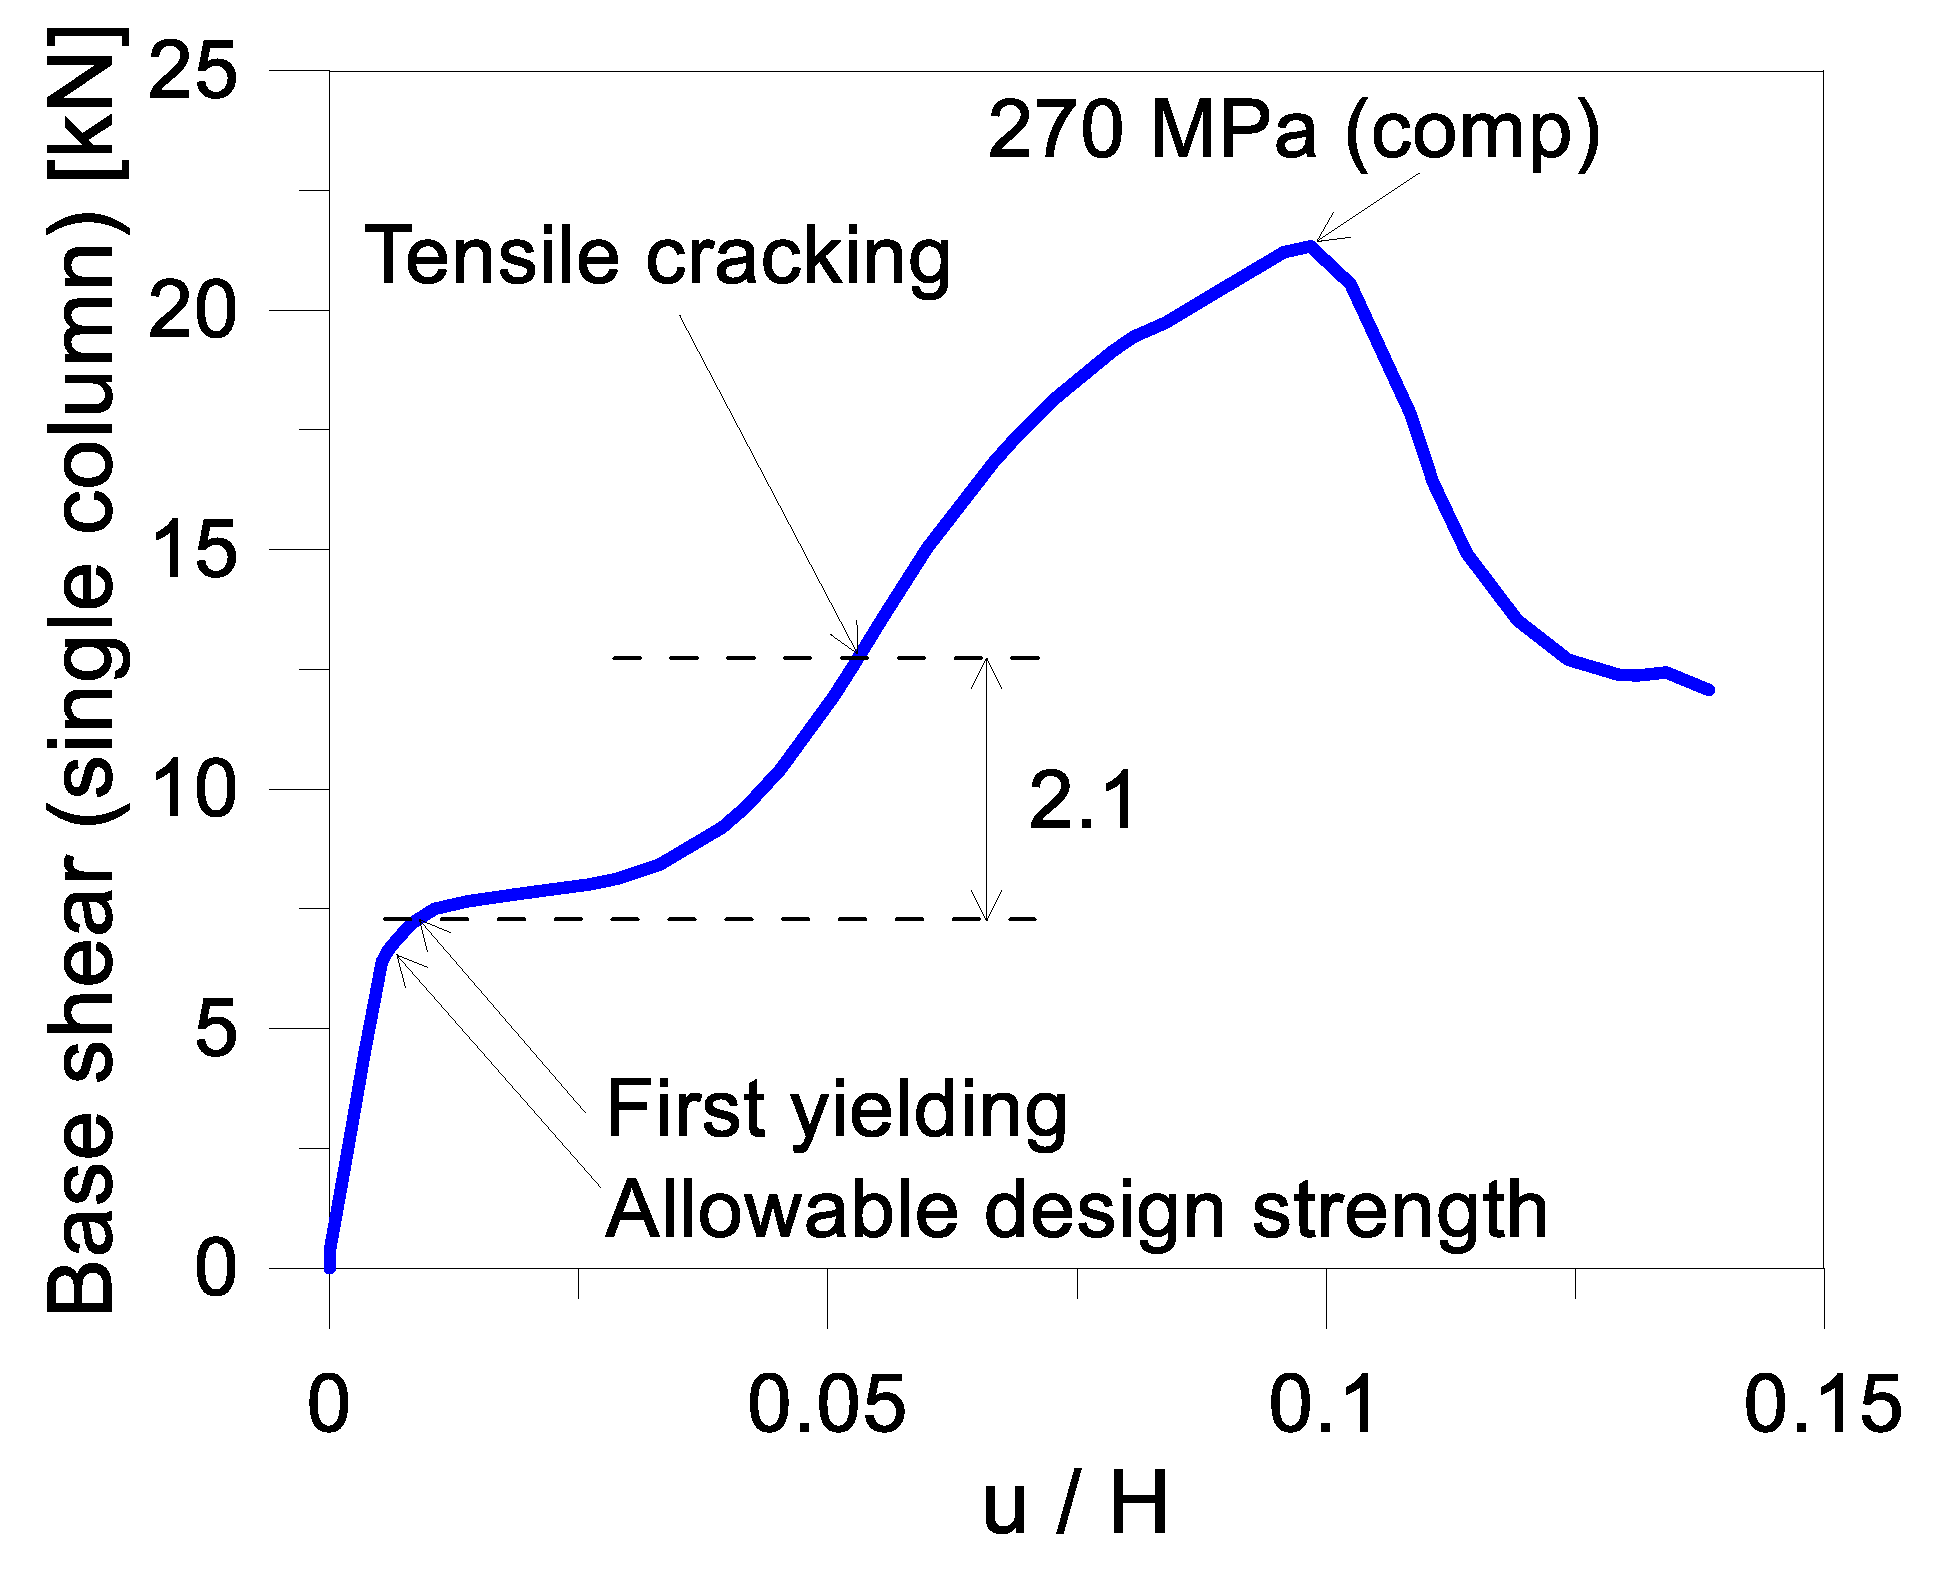
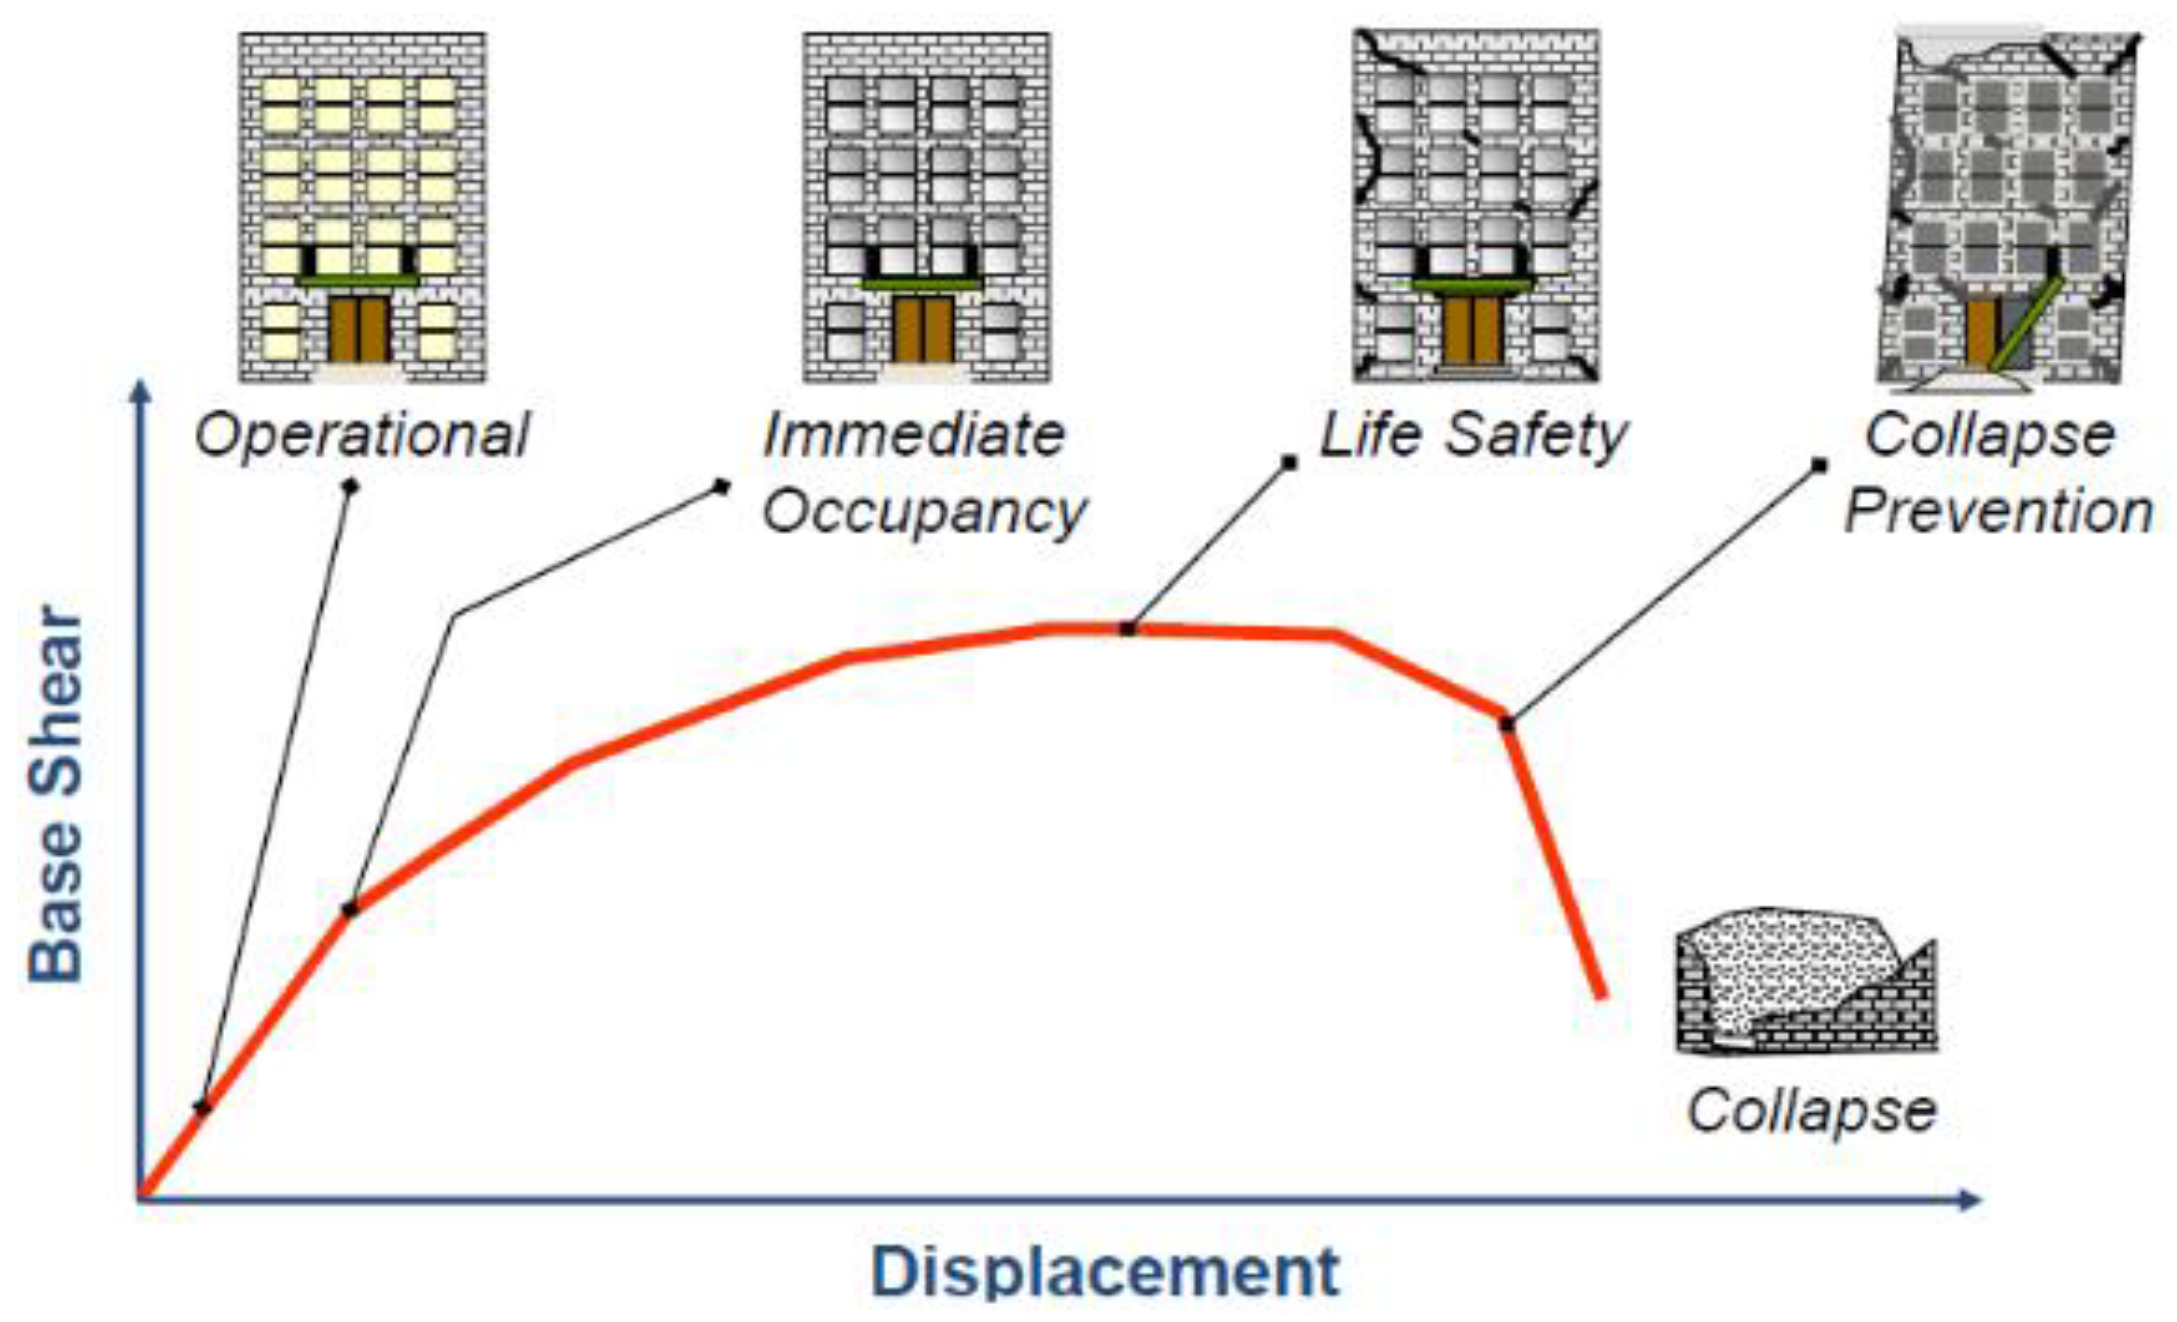
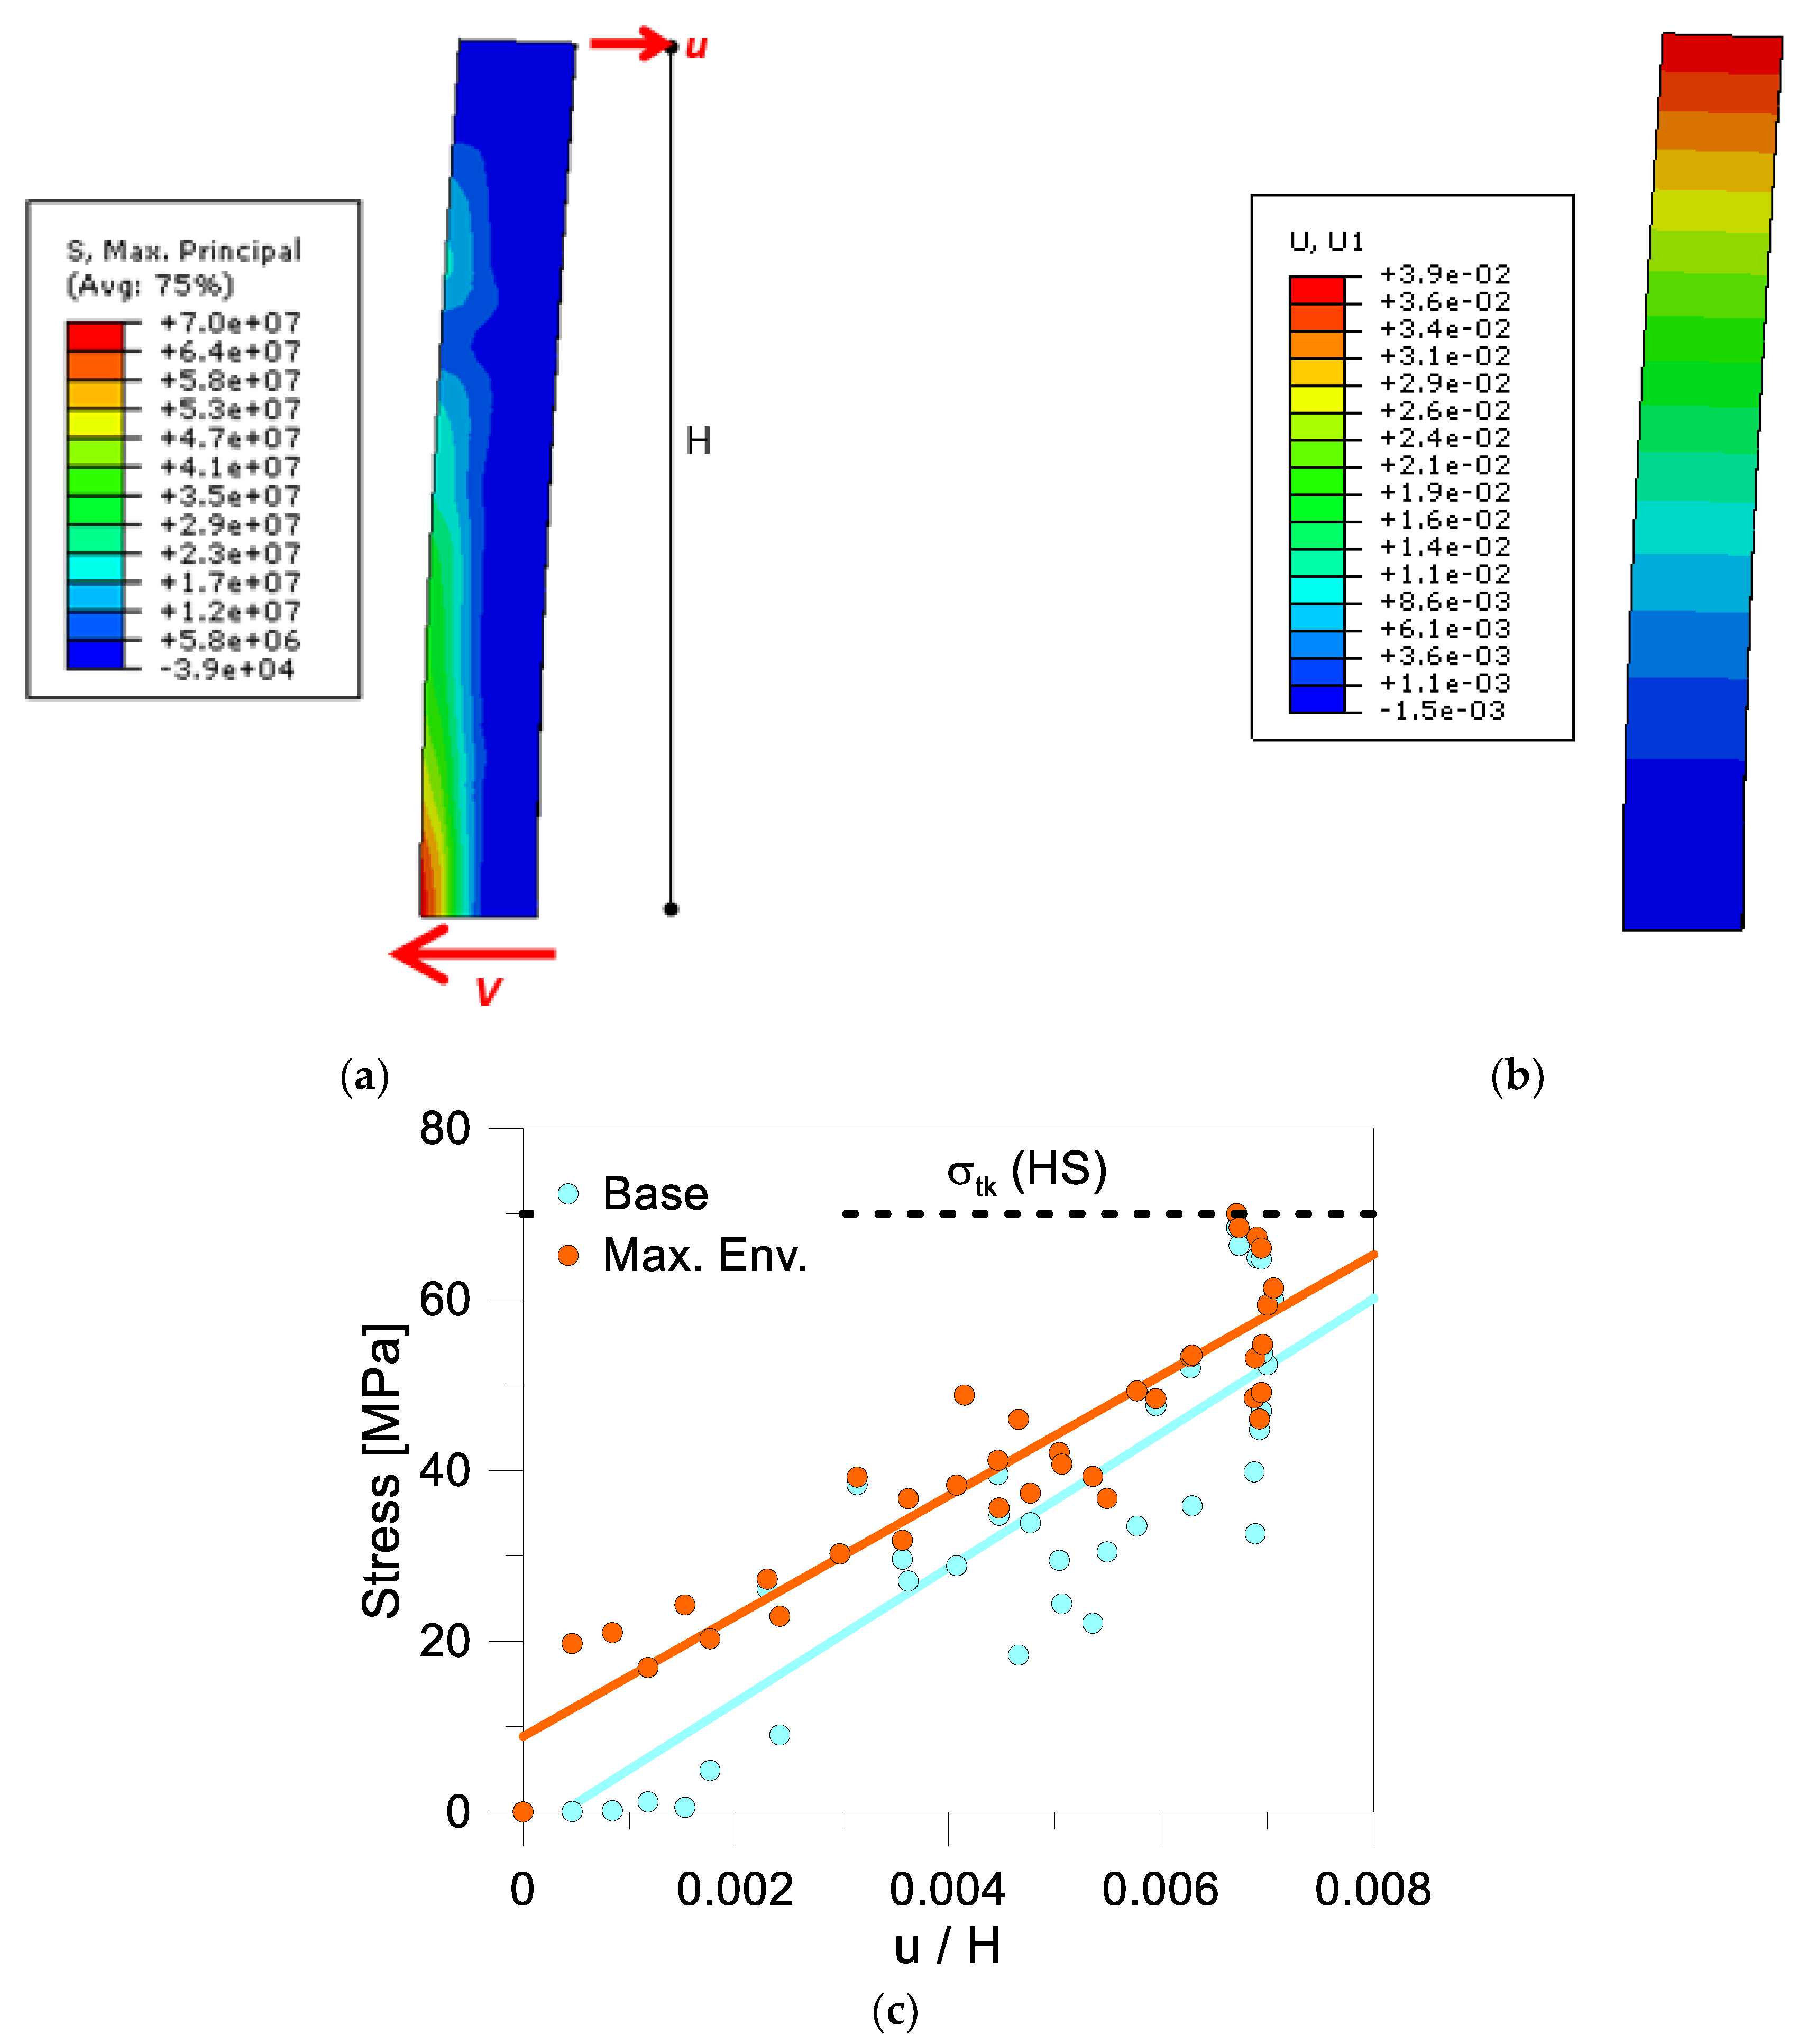
6.1. Detection of First Yielding, Collapse, and Allowable Strength Parameters

Given the general definitions of calculation approaches in Section 4.1 and Section 4.2 and the structural system object of study, special care must be taken for the definition of the key design configurations. Major design challenges derive from the lack of explicit recommendations for glass structures in current design standards for seismic resistant buildings. On the other hand, the in-plane seismic response of the frame is strongly affected by the intrinsic mechanical properties of its basic components, namely:
  • brittle elastic glass panels (with holes), and
  • flexible angle brackets at the base of the frame.
In other words, the “first yielding” condition of the system of Figure 6 was defined in this project as the first plastic deformation of angle brackets in tension (with σs,y = 235 MPa the reference strength and δy = 0.677 mm the corresponding vertical deformation [19]). Regarding the “collapse” damage state for the frame, maximum drift amplitudes (or column rotations, or even vertical deformations of the steel angle brackets) should be checked. Globally, for the parametric investigation herein summarized, the control of local and global critical conditions for the frame was primarily based on local stress and displacement controls, namely representing a potential:
  • (C1) Tensile cracking of glass, close to the column base (region of holes),
  • (C2) Compressive fracture of glass, close to the column base (region of holes),
  • (C3) Ultimate deformation for steel angle brackets (plastic strain and vertical deformation, with δu =54.10 mm based on [19]),
  • (C4) Possible yielding of steel bolts for the base connection.
In addition, for comparative purposes, conventional deformation limits available in design standards were also taken into account. For the case study frame, as far as the glass holes are properly protected from potential local damage, the seismic analysis could take advantage of the intrinsic flexibility and dissipative capacity of angle brackets. In this sense, the reliability of limit values of Table 1 from FEMA 356 [56], Vision 2000 [57], UBC 1997 [58], EC8 [17], and NTC2018 [50] documents and their applicability to the examined frame were taken into account in this study.
Finally, the “allowable strength” condition required by the M2 approach should also be defined. As far as the brackets are assumed responsible of the overall in-plane seismic performance of the frame, the yielding stress of steel suggests that:
V d = f ( σ s , a d m ) = σ s , y   γ M = 235 1.05 = 223   M P a
with γM the partial safety factor, thus a minimum:
V y   V d = γ M = 1.05
to account in Equation (2).
Figure 8 shows the base shear-lateral deformation of the frame from PO analysis. It is clear that the above assumption can strongly penalize the frame response, and the critical glass members prove to offer a safety factor in the order of ≈2.1 against potential tensile cracks. Moreover, it is possible to see that the compressive limit in glass holes is not achieved, neither under large displacements. This results from the high deformation capacity of the frame, thanks to detailing of base connections explored in [19].

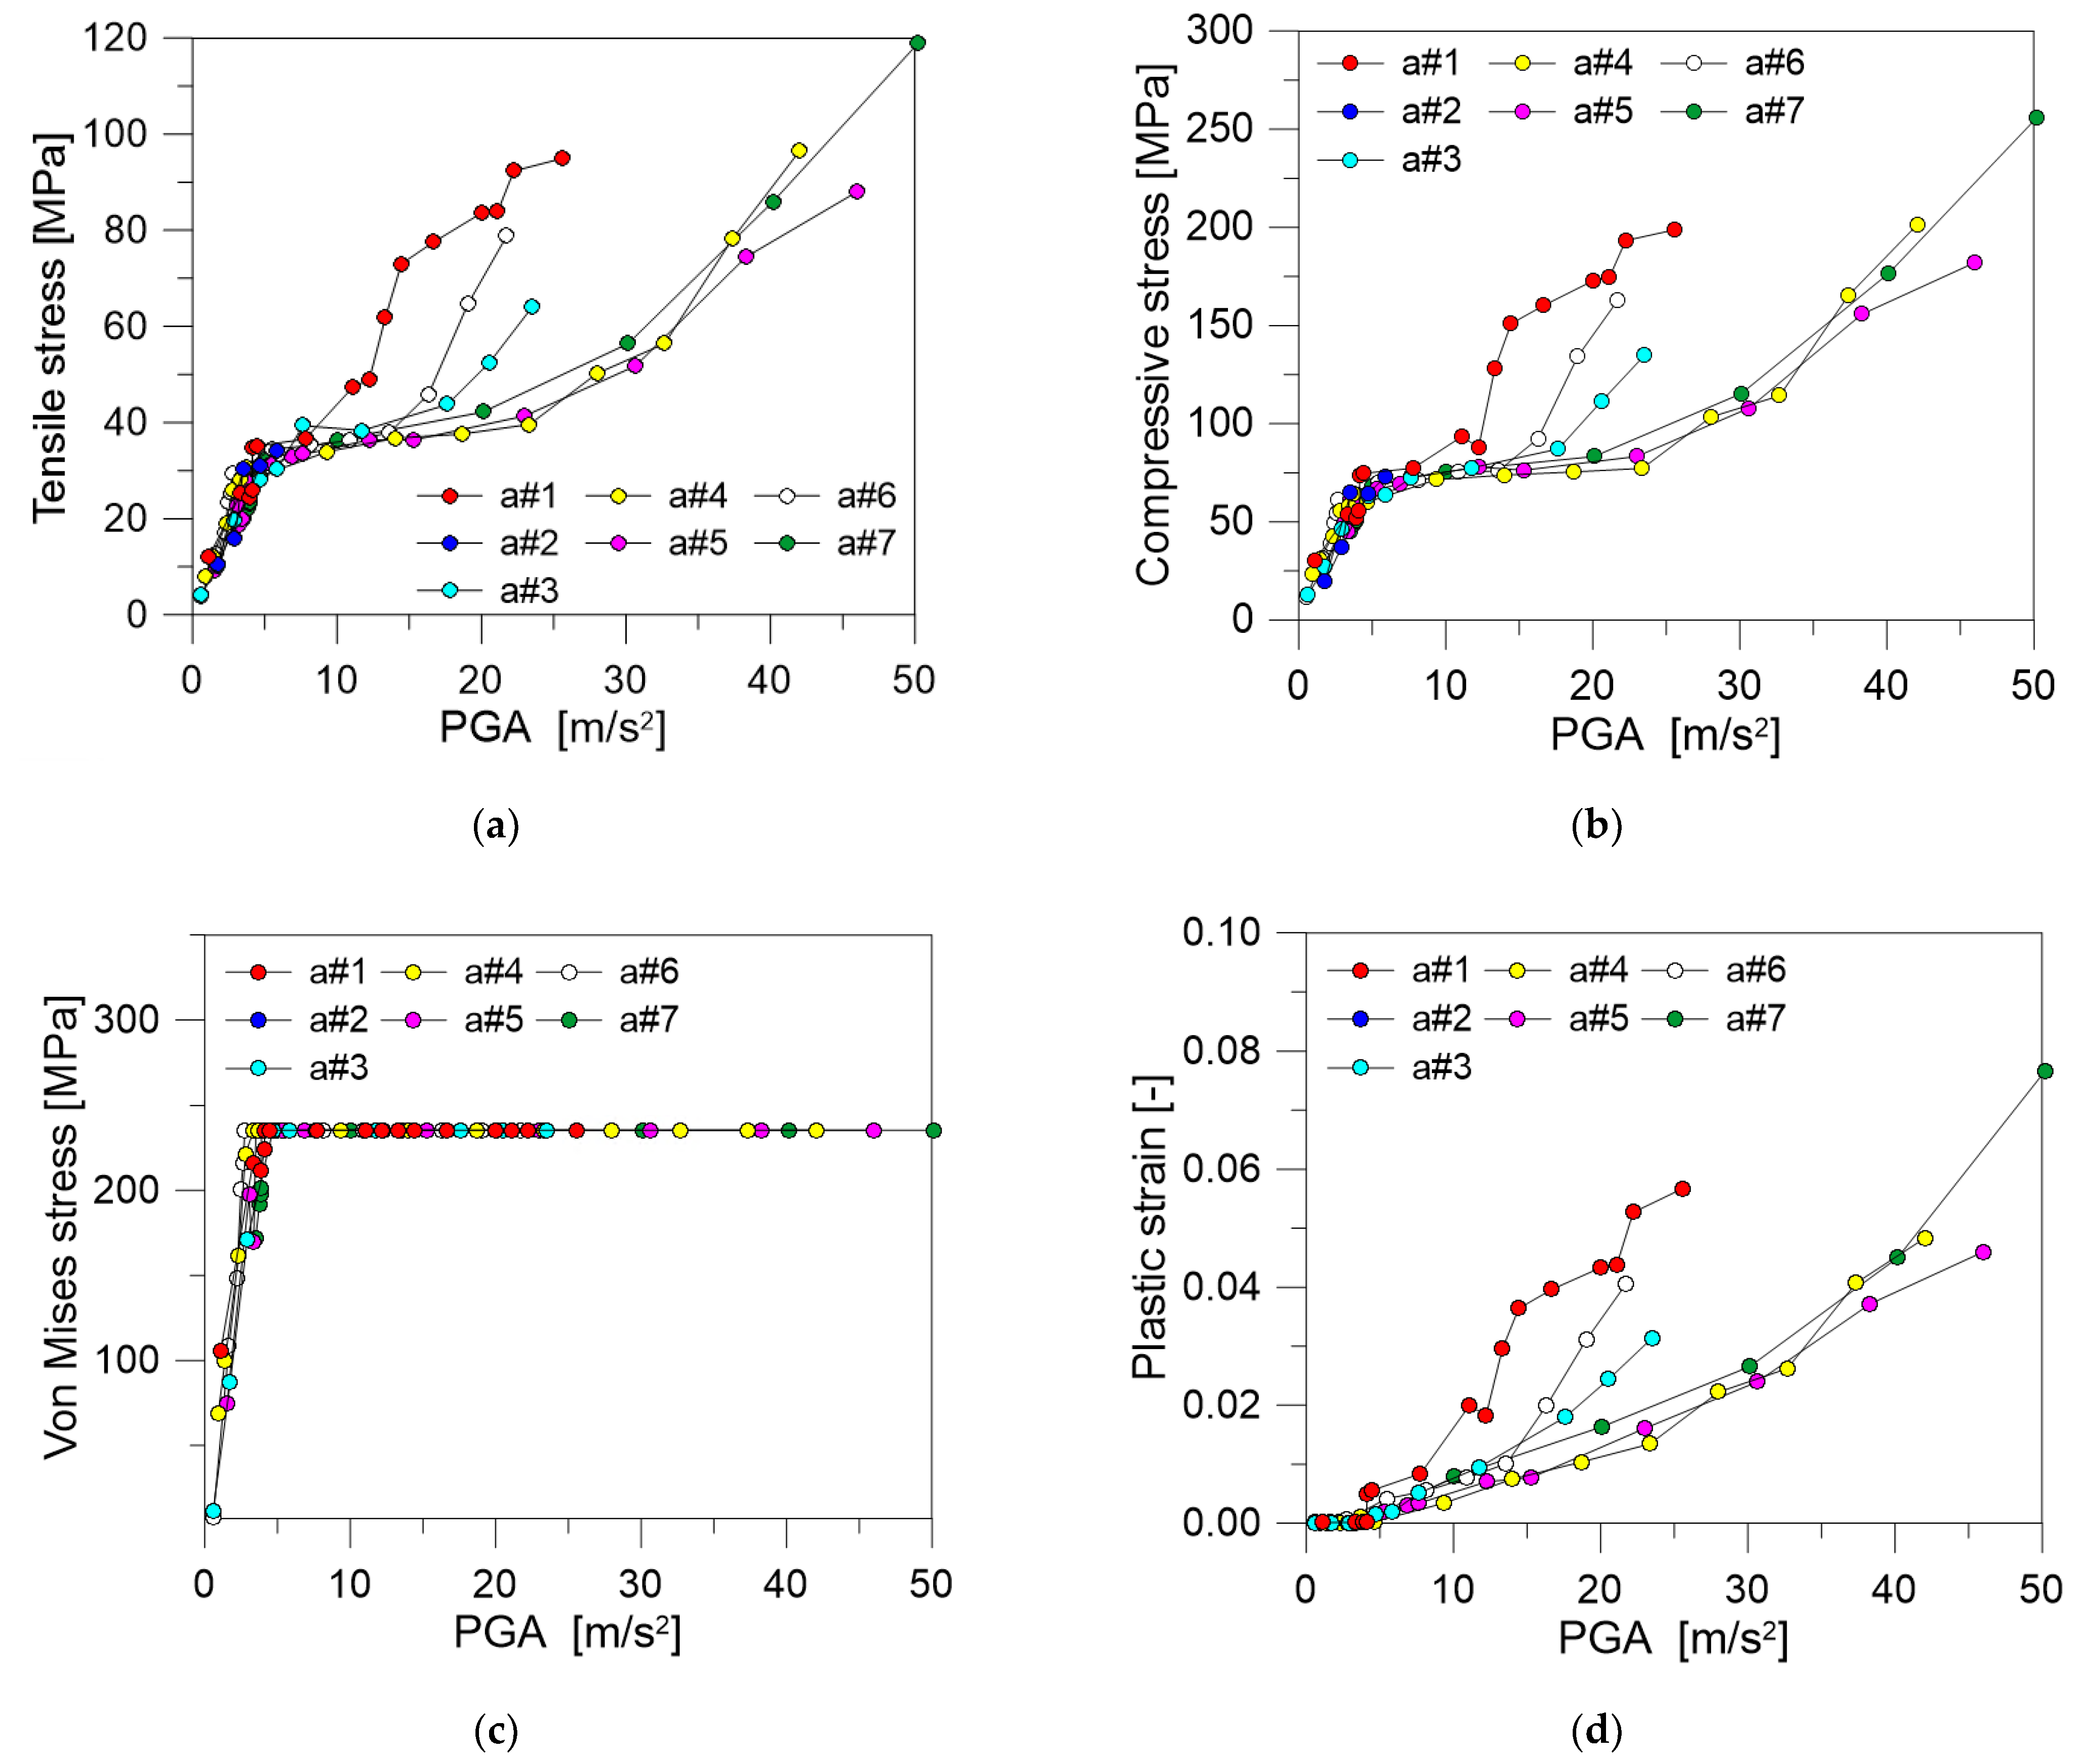
6.2. Seismic Performance Assessment

The seismic response of the frame was found to agree with Figure 9, where the typical IDA deformed shape (detail) is proposed for brackets under large in-plane lateral displacements.
A total of 140 non-linear analyses was carried out with the imposed scaled accelerograms from Figure 7 (with an average of ≈20 differently scaled simulations for each accelerogram). The IDA results still confirmed the close correlation with PO results in Figure 8, with a qualitative agreement of damage phenomena and maximum effects due to the imposed design loads. Figure 9b, in this regard, presents the evolution of maximum stress peaks in the region of holes, while Figure 9c,d focus on the bracket and frame responses, respectively.
A more detailed analysis of IDA results can be found in Figure 10 and Figure 11, in terms of relevant EDPs, as a function of the imposed PGA for each one of the input scaled signals. It is worth noting that the parametric analysis was carried out in the ideal PGA range of 0–50 m/s2 to address the performance of structural components. In this regard, typical PGA values can be seen as associated to limited stress levels in the structure, as is expected due to the limited structural mass and high flexibility of the system. Key benefits derive also from gaps in the region of glass holes to prevent premature stress peaks at the edges. Such an approach is also in line with other studies on the seismic performance of structural systems with flexible joints (see for example [59]).
As shown in Figure 10a,b, the compressive stress peaks were mostly observed to double the corresponding tensile peaks in glass, due to a combination of in-plane lateral and vertical loads. Otherwise, it is also interesting to notice that the LG members can sustain relatively strong earthquake motions, before glass could fracture. A relevant aspect is hence represented, in both figures, by the non-linear evolution of stress peaks with the imposed PGA. A first linear trend of the charts can be observed for PGA up to ≈6 m/s2, and such a slope change coincides with first yielding (and progressive plastic deformation) of angle brackets. This limit condition was generally achieved for PGA in the order of ≈4 m/s2 (Figure 10c,d).
Compared to the stress evolution in the holes region, similar trends can also be observed for the deformations of the frame in Figure 11.
The vertical displacement δ, in-plane lateral drift u / H and base rotation θ are proposed, as obtained from IDA and maximum envelopes of selected EDPs. Under the input assumptions of this study, the collapse condition is never achieved on the side of angle brackets (Figure 11a). The limit drift of 2% or 5% is exceeded for PGA in the order of ≈10 m/s2 and 20 m/s2 (average value), see Figure 11b. The 2% drift, finally, is mostly in line with the 0.03 rad rotation of the frame (Figure 11c).

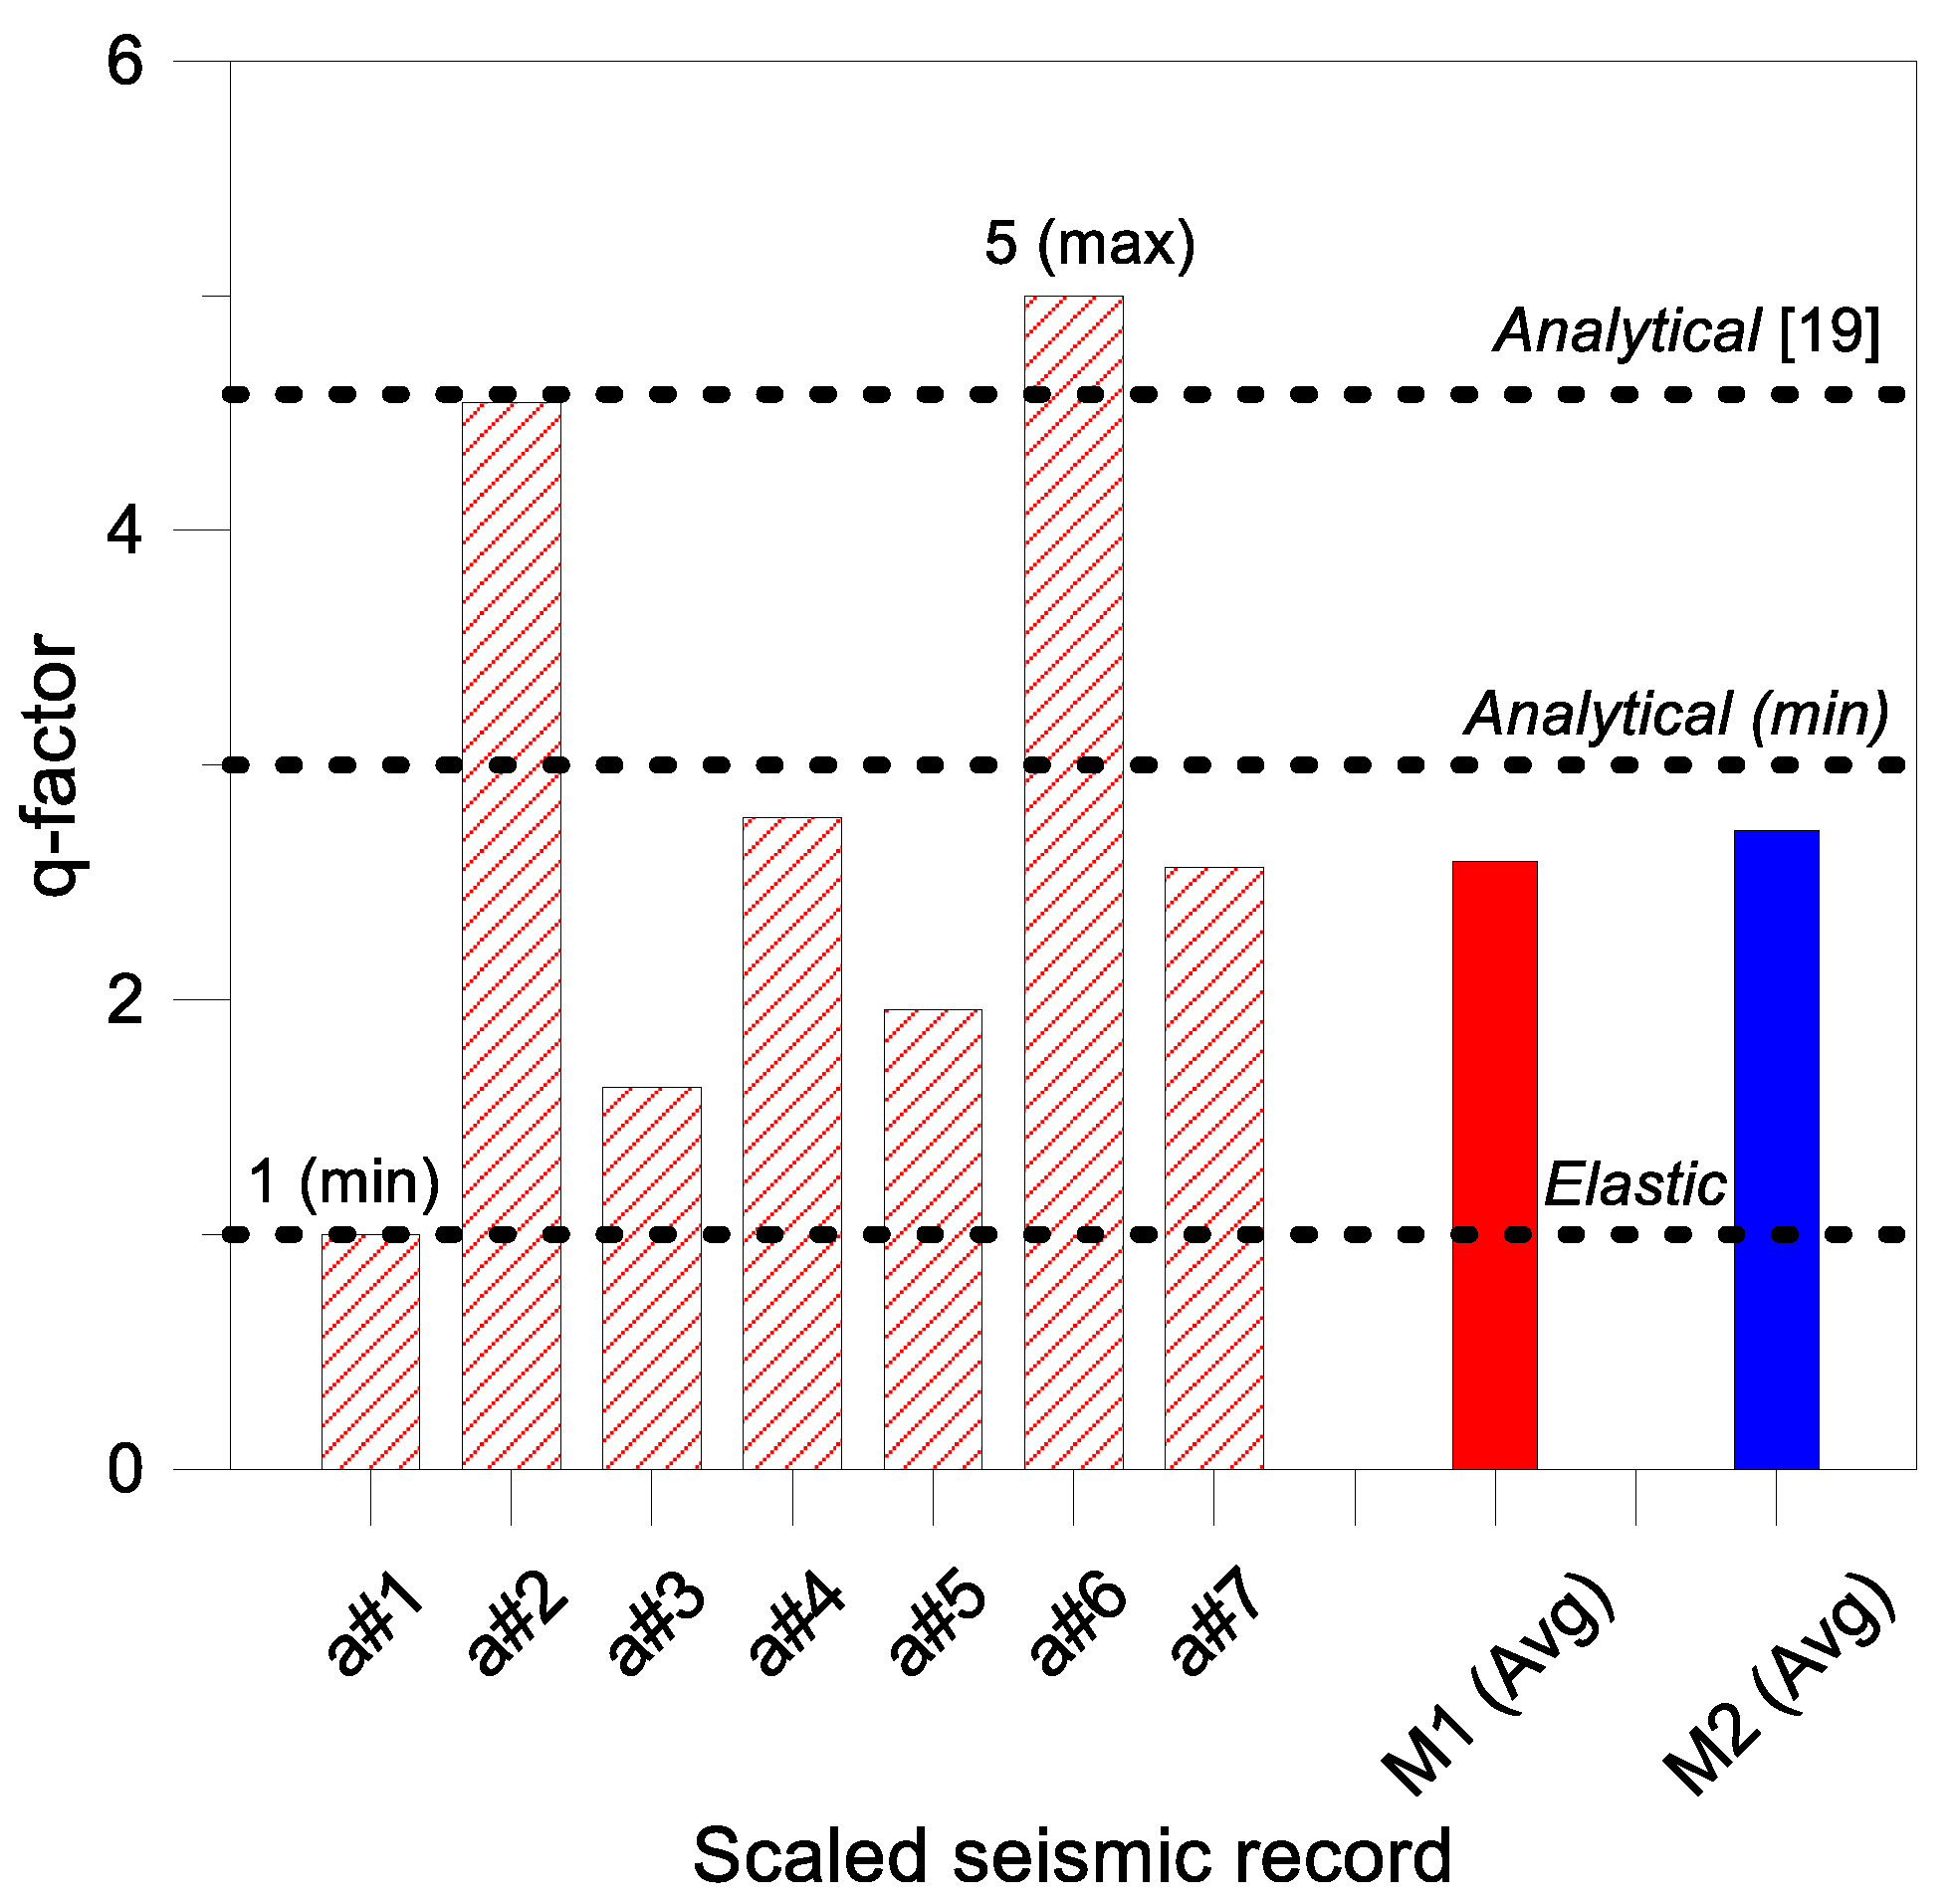
6.3. q-factor Estimates
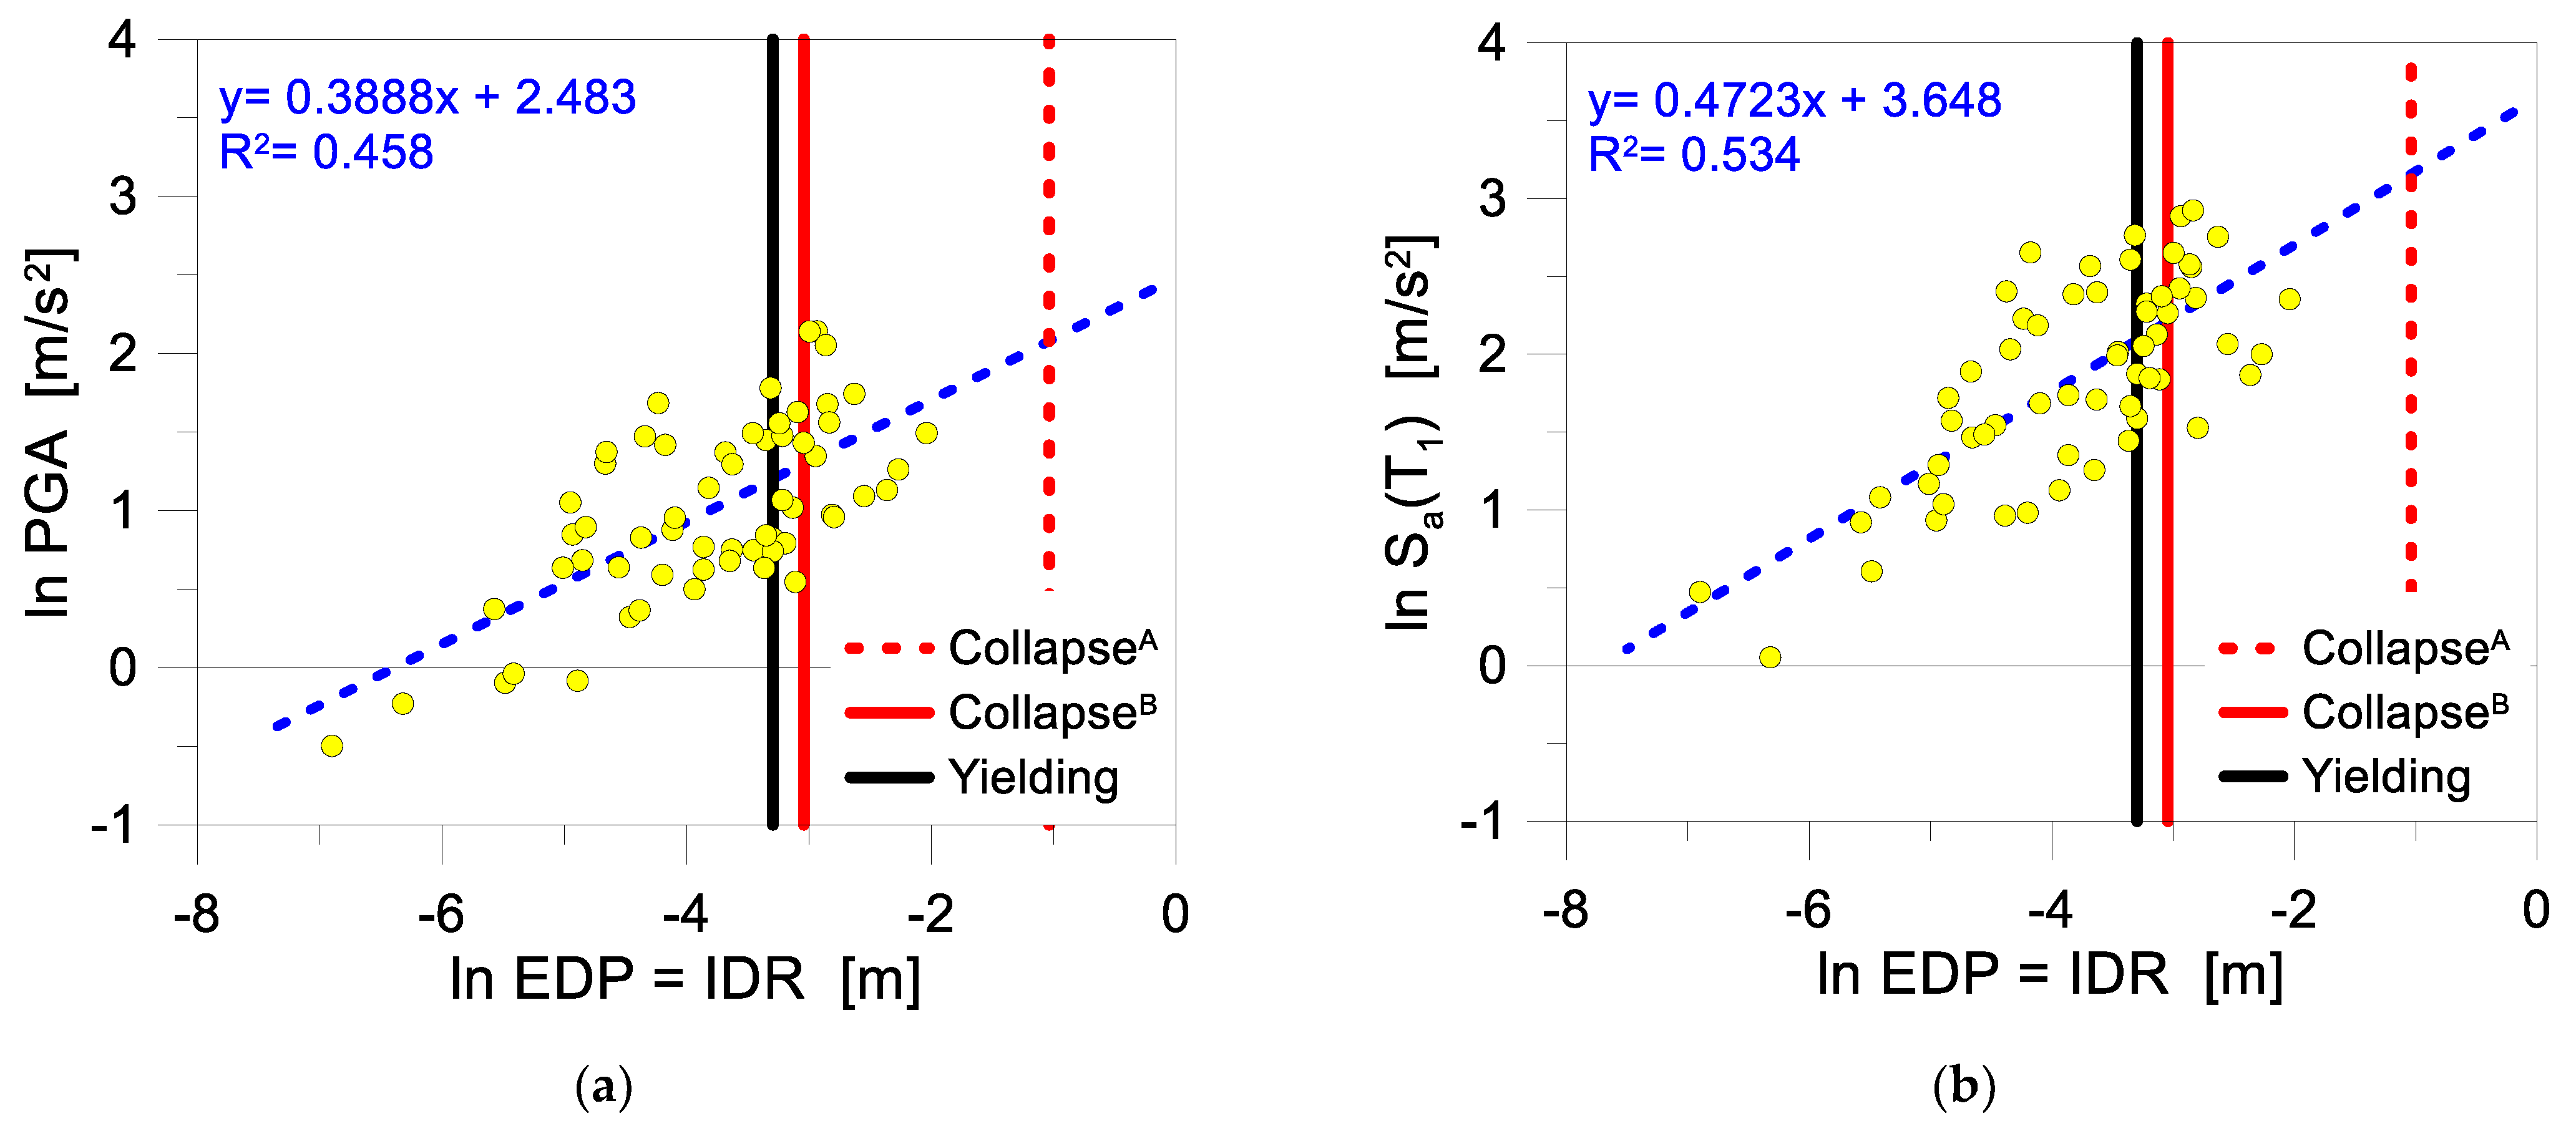
The analysis was first focused on the so-called M1 method. For the M2 case, the M1 value was adapted with the magnification factor in Equation (14). The so-calculated IDA results are proposed in Figure 12.
Note that the attention was focused on the most unfavorable collapse mechanism for the frame as a whole. This was generally observed to coincide with tensile glass cracking (“glass”), while in two cases, only the deformability of the base joint allowed to reach a lateral drift of 2% (“Drift 2%”). The corresponding q-factor values are presented for the M1 method (Equation (1)), in the range from 1 (a#1) to 5 (a#6). The average value of q = 2.59 is compared with the corresponding M2 estimate from Equation (2), q = 2.72. The preliminary analytical requirement (Equations (7)–(12) combined with Equation (6)) is also highlighted (qmin = 3), while the analytical value based on local analysis (q = 4.58 from [19]) gives evidence of intrinsic limits due to simple predictions carried out for the base connection only (with collapse governed by stress peaks in the region of glass holes).

7. Cloud Analysis

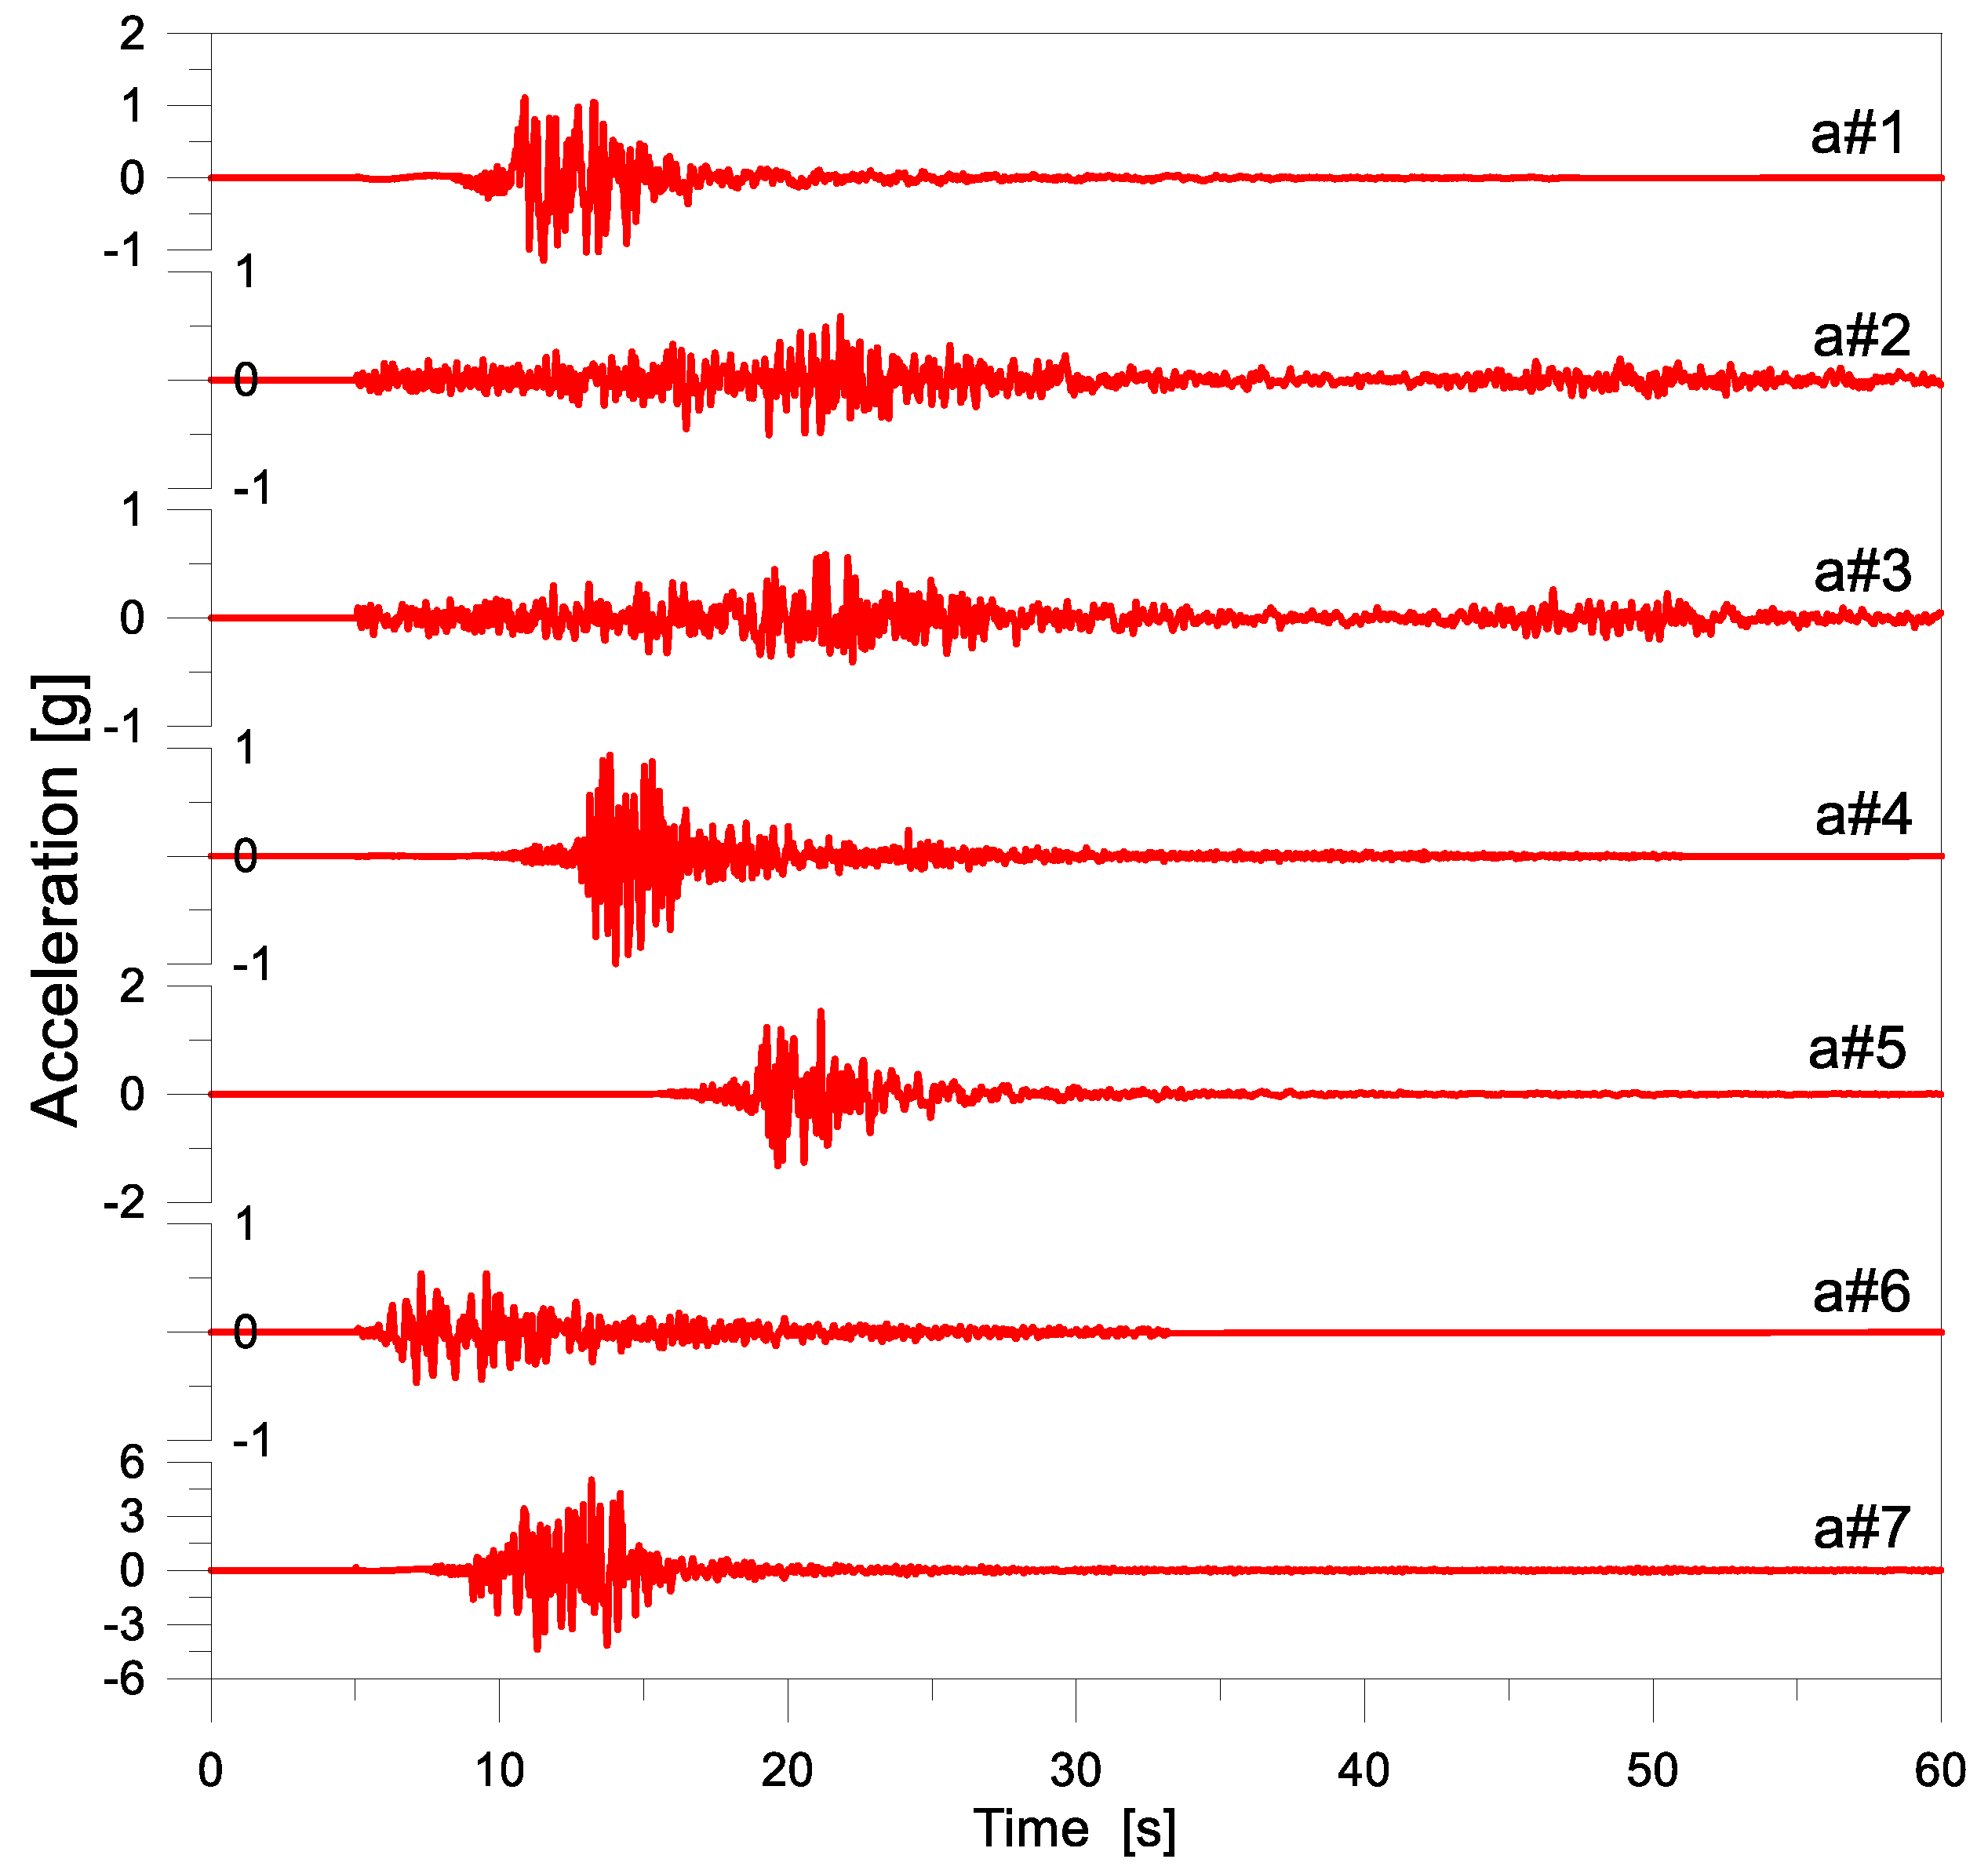
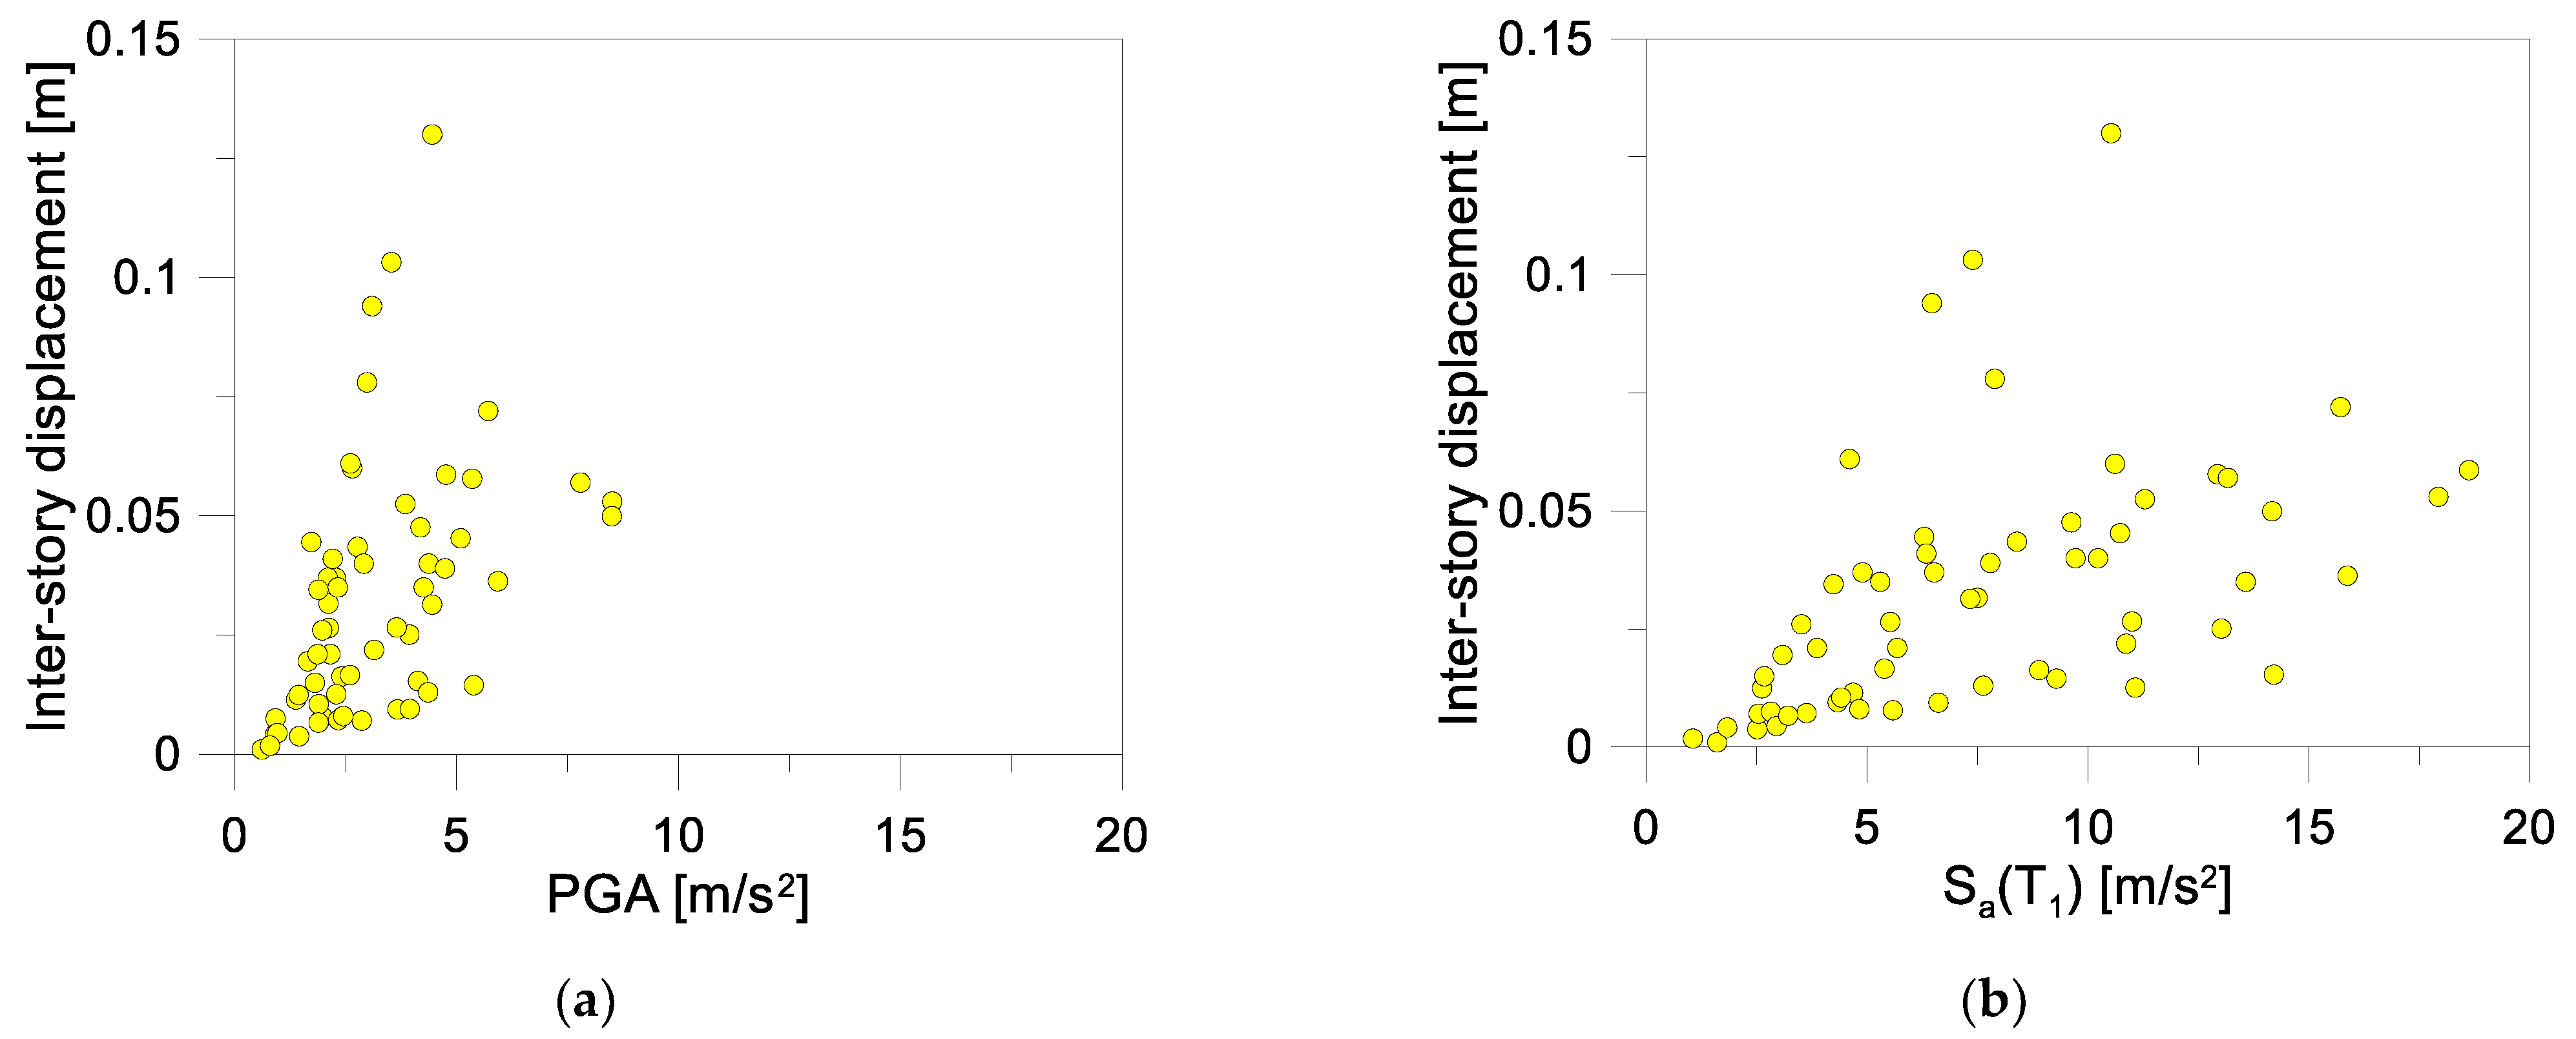
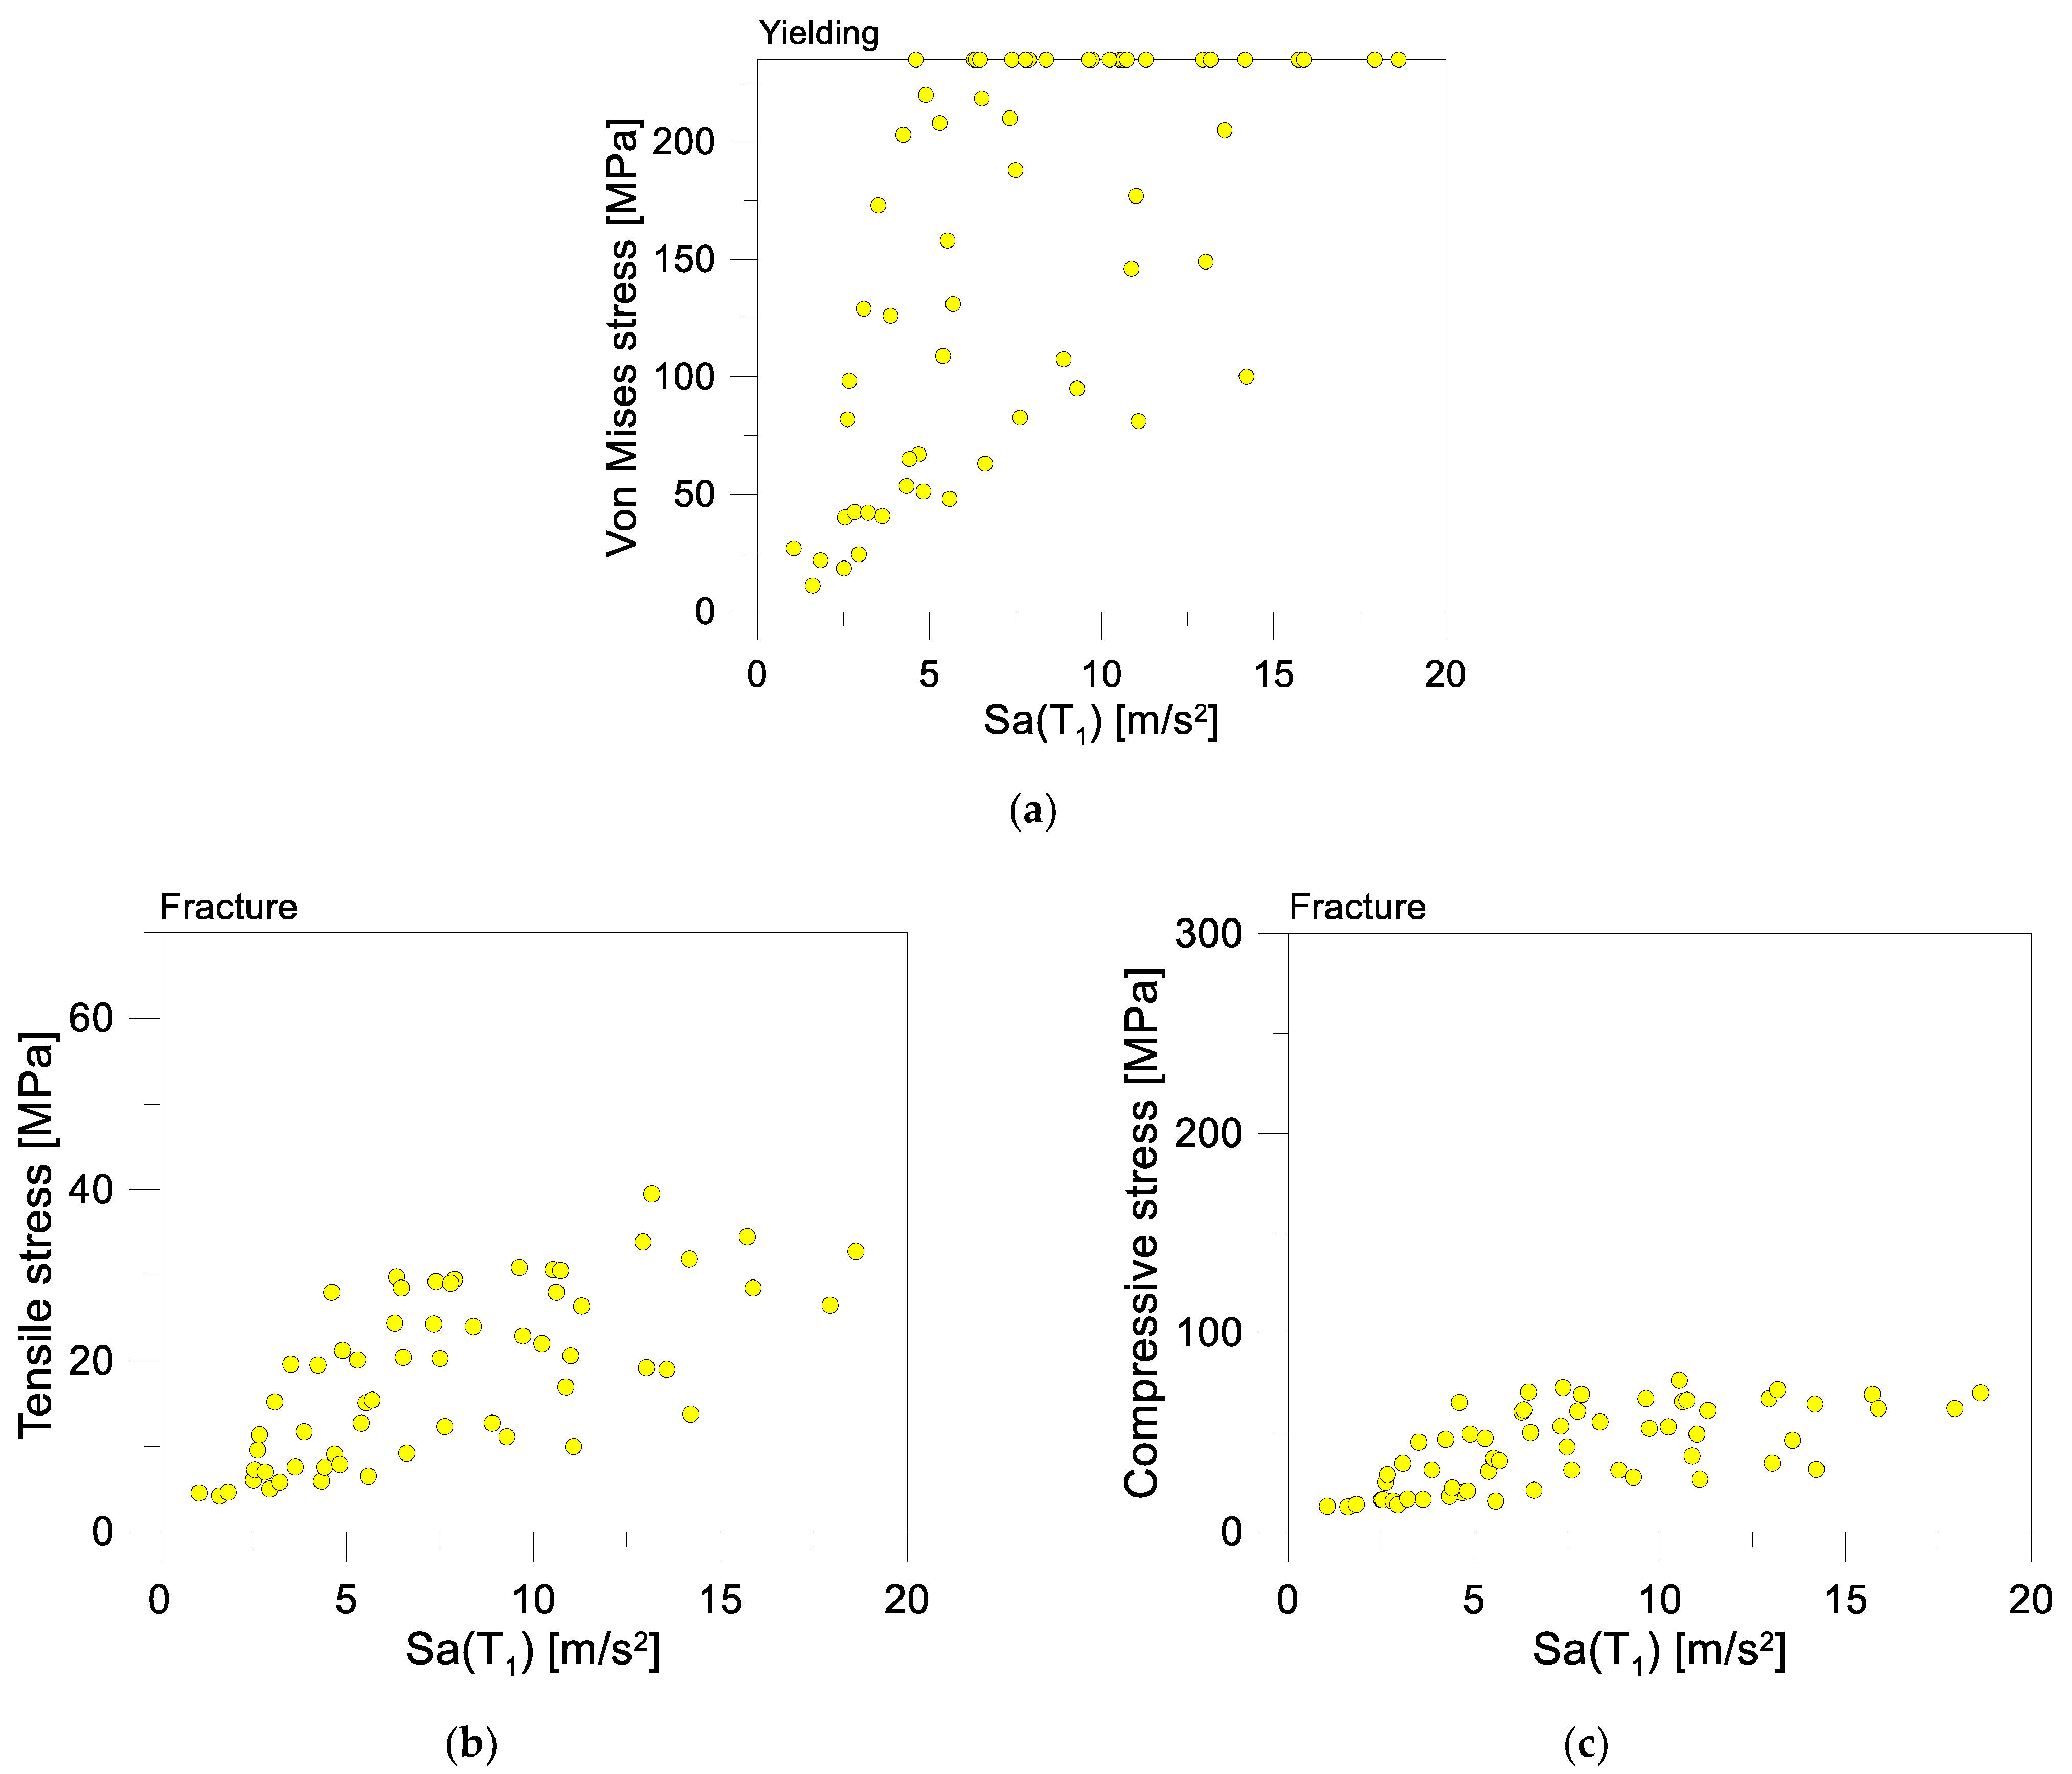
7.1. Input Records and EDPs

The maximum inter-story drift (IDR) was chosen as reference EDP for the frame (T1 = 0.3 s), with PGA and pseudo-spectral acceleration Sa(T1) being selected as IM parameters. While the PGA value is only related to the seismic ground motion, the Sa value depends on the dynamic behavior of the structure; therefore, the performance to different IMs depends on the type of structure and the governing failure mechanism.
The preliminary analysis was focused on the distribution of tensile stress peaks in a glass column (with nominal height H) deprived of the angle brackets (rigid base connection). Given the characteristic tensile resistance of HS glass (σtk = 70 MPa), an inter-story displacement uu= 0.048 m was calculated as in Figure 13. The reference EDP corresponds to contour plots in Figure 13a,b), while Figure 13c shows the data trend obtained at the column base and in terms of maximum envelope.
It is worthy of interest that the so-calculated value corresponds to u/H ≈ 0.007 and is in close correlation with consolidated limit values for constructional materials characterized by typical brittle behavior in tension, such as, for example, masonry [50]. At the same time, the calculated value significantly minimizes the expected seismic capacity of the frame, thus confirming the key role of its base connections.
The total set of 60 unscaled ground motion records in Table A1 were chosen from [40], depending on the possible collapse mechanism of the frame. According to procedures for general buildings, special attention was paid to cover a wide range of spectral accelerations, but also to respect the consistency between the characteristics of selected records and the supposed classification for the site of interest. As a result, the selected accelerograms were characterized by a moment magnitude (Mw) between 5.6 and 7.6, an epicentral distances (R) ranging between 3.5 km and 62.9 km, and a soil class type A or B (EC8 classification).

7.2. Analysis of M3 Results with Linear Regression

The results of the cloud analysis method related to PGA and Sa(T1) are separately collected in Figure 14, with attention to the measured inter-story displacement.
Differing from IDA, one of the potential intrinsic limits of the M3 method can manifest in the availability of natural seismic records that possess sufficiently high accelerations to reach the desired EDPs.
In this regard, Figure 15 gives evidence of the typical observed response for the case study frame. As shown, the imposed records are able to lead the angle brackets to yielding (Figure 15a), but still relatively smooth stress peaks are achieved in glass (holes), with tensile and compressive stress peaks in Figure 15b,c. In the same way, the measured in-plane deformations of the frame are still lower than the % limit values earlier discussed for IDA.
By considering the entire set of available data from the cloud analysis of the frame, an ordinary least-square linear regression was thus performed. The analysis was carried out in the logarithmic space, given that the use of logarithm of variables improves the fit of the model by transforming the distribution of the features to a more normally shaped bell curve. In order to control the skew and counter problems in heteroskedasticity, both the dependent variable (IM) and the independent variable (EDP) were log-transformed. The final result is proposed in Figure 16, where the linear fits of cloud data are obtained from the least squares method.
The thresholds of “yielding” (EDPY,50 = 0.037 m) and “collapse” (EDPCP,50) performance levels are indicated in Figure 16 by vertical lines. Two different thresholds (noted as “A” and “B”) were used to identify the collapse prevention limit and to quantify further the influence of the base steel connection in the seismic response of the frame, namely:
  • (A) E D P C P , 50 = 0.048 m (u / H≈ 0.007), as calculated by the preliminary PO analysis of the glass column with rigid base connection (Figure 13), and
  • (B) E D P C P , 50 = 0.35 m (u / H≈0.05), representative of IDR value corresponding to first glass cracking in the PO curve of the frame (Figure 8).
In this regard, it should be noted that the regression line was assumed to be valid for “B” collapse value of displacement even if it is outside the available data cloud. Once the regression line is found, the IM characterizing yielding and collapse prevention were obtained in Figure 16 using the following relations:
I M C P , 50 = exp ( a + b   ln ( E D P C P , 50 ) )
I M Y , 50 = exp ( a + b   ln ( E D P Y , 50 ) )
The q-factor estimation can thus be based on Figure 16, for PGA and Sa(T1), respectively.
Certainly, the obtained results are affected by base steel joints and thus by EDPCP,50. As such, the above outcome should be taken into account as a general approach for basic design considerations of similar structures, given that the resistance and stiffness of joints are strictly responsible for the final ductility of the frame, and thus for the possible fracture initiation in glass.

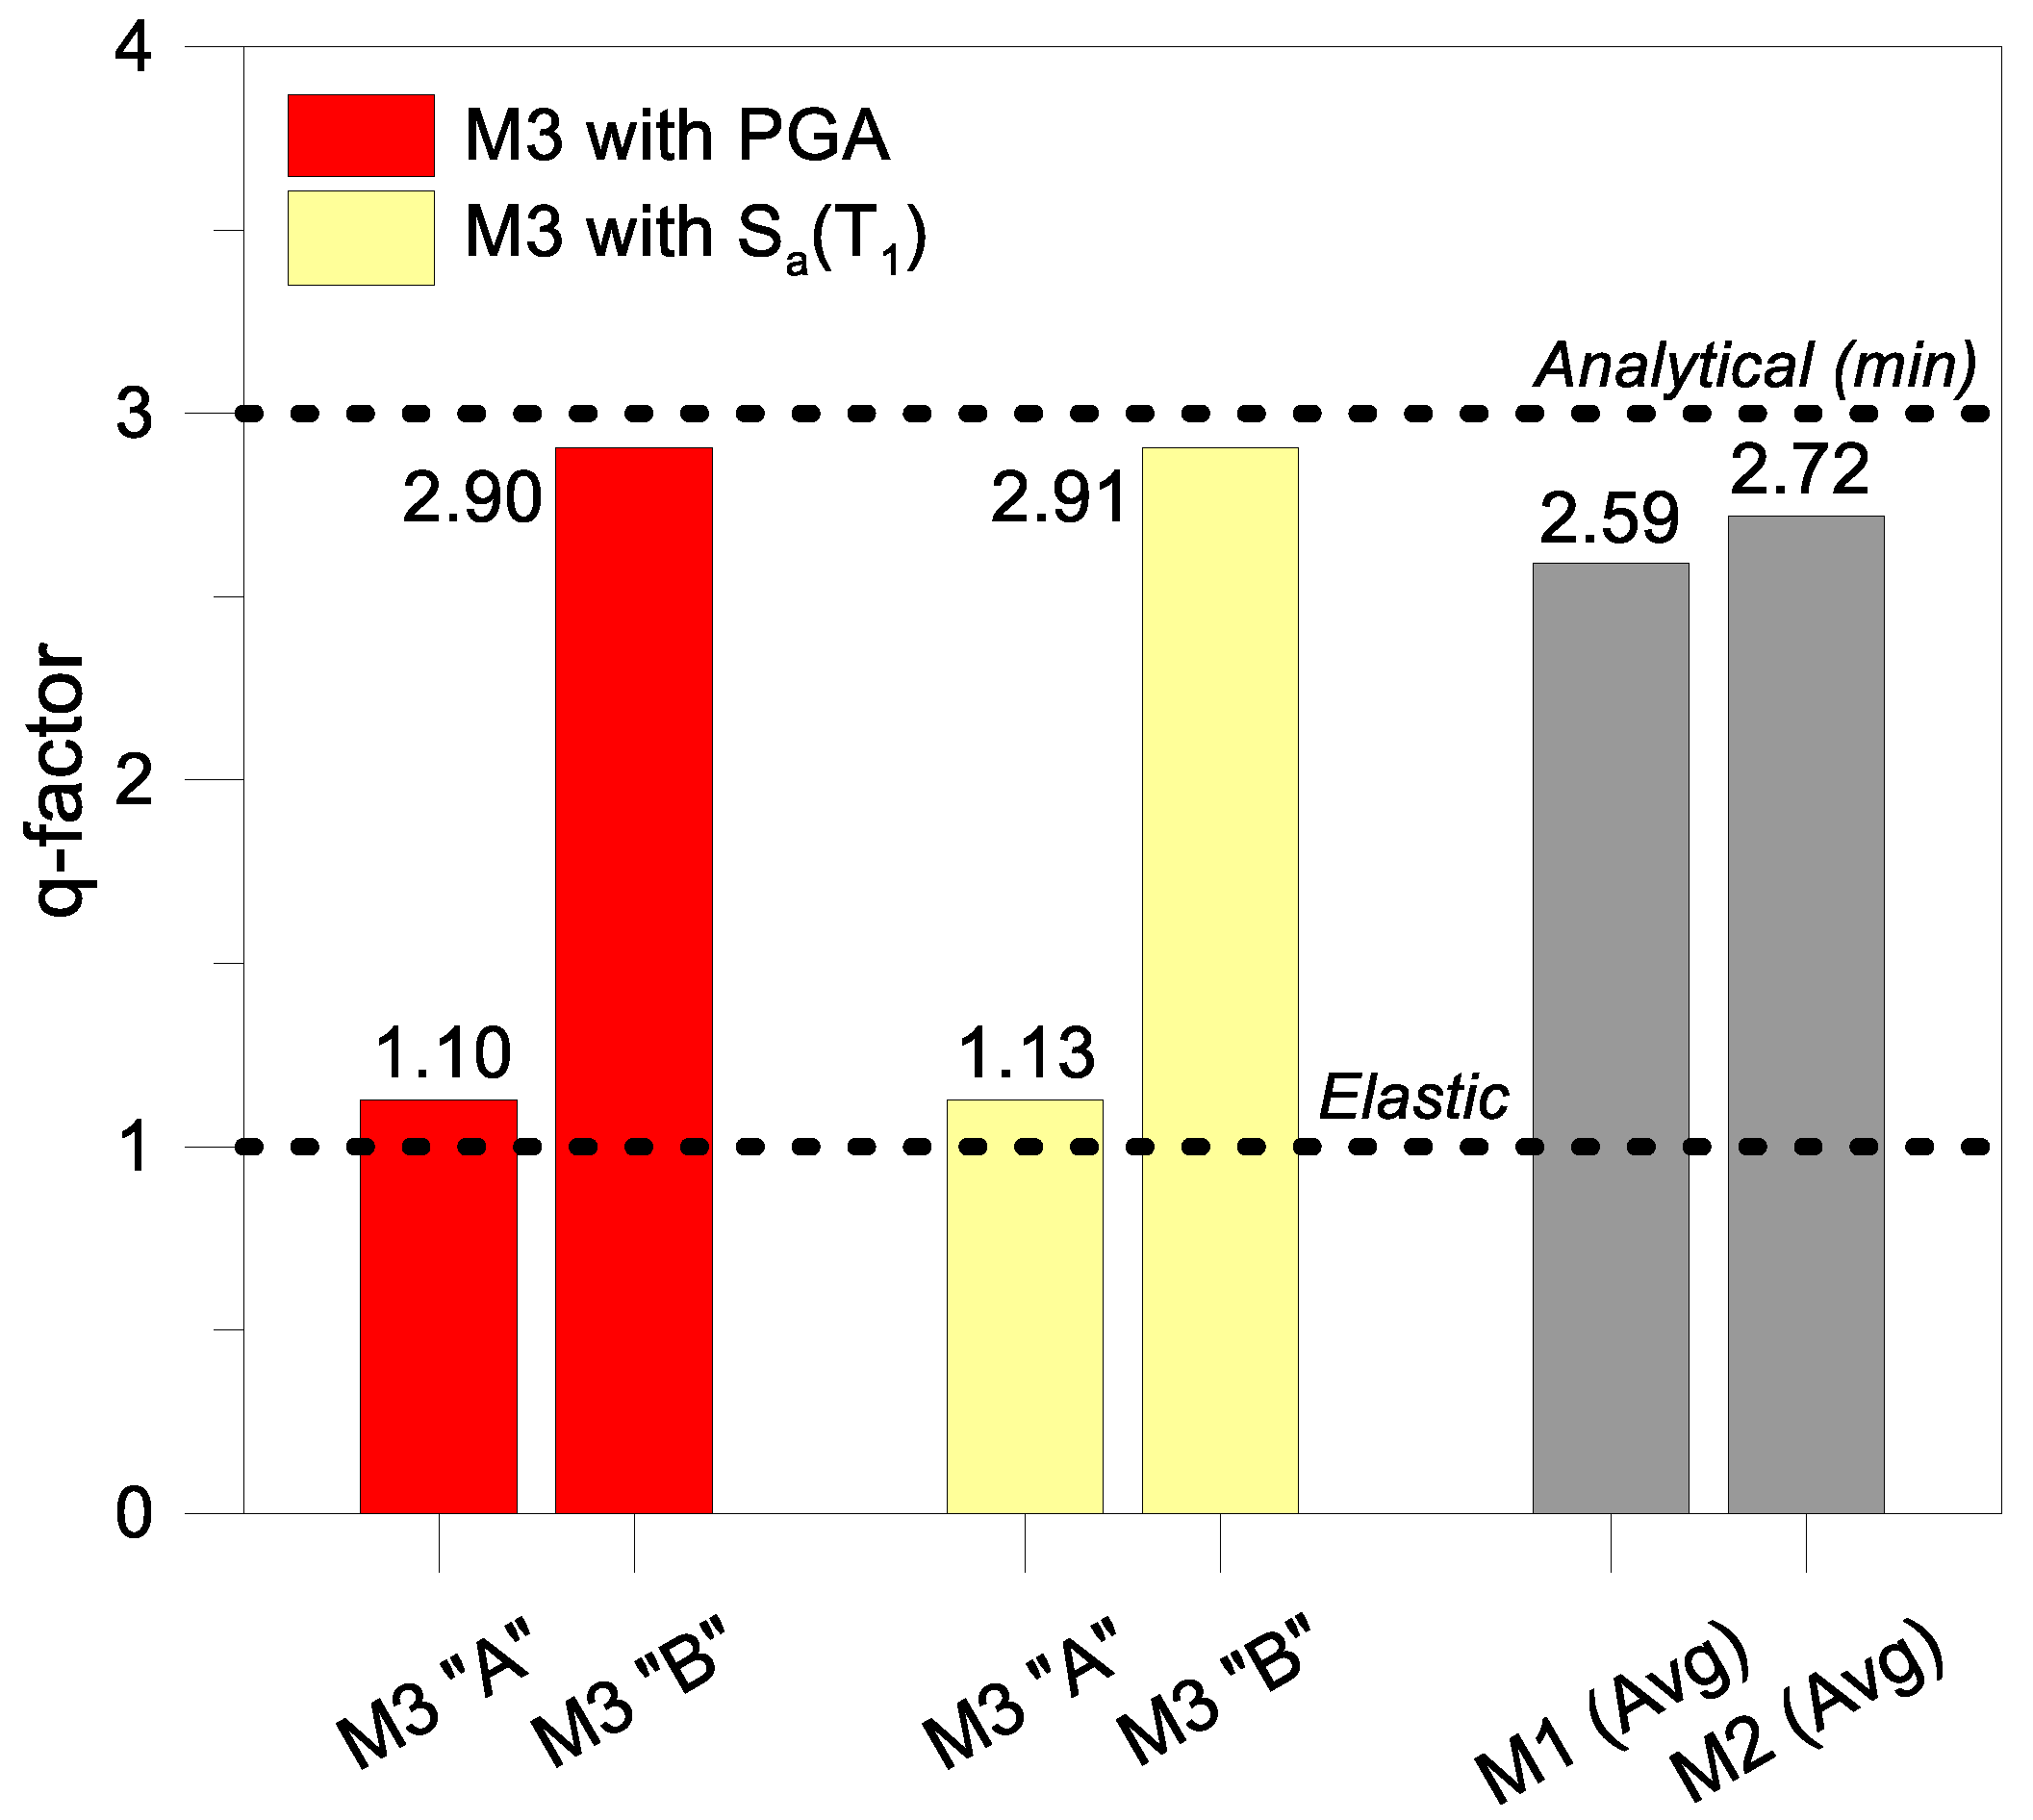
7.3. Comparative q-factor Predictions

In conclusion, Figure 17 shows the M3 calculated q-factor and a comparison of selected methods (average). As expected, q significantly decreases as far as the M3 approach at collapse disregards the beneficial effect of brackets in the post-yielded stage (collapse “A”). At the same time, as far as the real ultimate inter-story displacement is considered for the tensile fracture of the column (collapse “B”), Figure 17 proves a stable q-factor estimation from M3 or M1–M2 methods.
The positive outcome is confirmation of intrinsic ductility and post-yielding capacity for the frame as a whole. This is in line with preliminary results from [19]. Moreover, the local analysis of angle bracket ductility and stress peak estimation in the region of glass holes was quantified in [19] up to q = 4.58 for the frame (collapse governed by tensile fracture of glass). The present study, consequently, confirms the need for full-size structural analyses for special structures and joint details.
Comparative data in Figure 17 are also a confirmation of simple analytical expectations about the minimum plastic capacity of the frame from Section 4.2 (with qmin ≈ 3 from Equations (7)–(12) combined with Equation (6)), so as to preserve the glass columns from fracture. At the same time, it is necessary to highlight the relatively stable trend for the q-factor numerical estimates from the M1 to M3 selected approaches. Most importantly, this finding seems to confirm the potential of linear regression method based on cloud analysis, thanks to the computational efficiency of the M3 method. The M1 and M2 procedures, while limited in number of signals, are univocal in EDPs detection but could require major calculation efforts compared to M3 (140 scaled simulations, in the present study). Furthermore, the IDA calculated average q-factor can be highly sensitive to input signals (7 minimum). While the present investigation suggests a very good correlation of M1 to M3 average q-factor predictions, this could not be the case of different structural members, thus requiring even more pronounced calculation efforts from IDA (M1 or M2). Finally, compared to simple analytical estimates that are not able to account for complex mechanical phenomena of the frame as a whole (i.e., q = 4.58 from [19]), all the numerical estimates in Figure 17 are on the conservative side, thus confirming the need for refined models and non-linear dynamic procedures in support of seismic design.

8. Conclusions

Available design standards for seismic-resistant buildings provide various recommendations in support of analysis and safe design of several structures subjected to earthquakes, but no specific details are given for glass systems. Among others, major uncertainties derive from the reliable calculation of the seismic performance and dissipation capacity of glass structures, thus their q-factor.
In this paper, attention was focused on the local/global seismic analysis of a structural glass frames under in-plane lateral seismic loads. Careful consideration was paid for the development of efficient finite element (FE) numerical models in support of extended parametric non-linear dynamic analyses that could be used to adapt/assess for glass some consolidated procedures in use for structural systems composed of ordinary materials. For most traditional materials and systems, reference engineering demand parameters (EDPs) are recommended by standards or literature documents. On the other hand, reliable EDPs are still lacking for the methods’ adaptation to glass structures.
Three numerical calculation methods were taken into account for q-factor estimates, based on the parametric incremental dynamic analysis (IDA; dynamic “M1” and mixed “M2” methods), and the cloud analysis based on linear regression (“M3”). Numerical calculations were also compared to simple analytical estimates.
From the FE parametric outcomes, more in detail, it was proven that the metal joints in use for structural glass applications were the major source of possible critical failure mechanisms, but also a key source of enhanced ductility performances for glass members. Such a finding was confirmed in line with ductility and flexibility capacities discussed in [19], based on local analysis of the base connection of the frame. In addition, the present study also confirmed the need of full-size FE models and non-linear dynamic procedures.
In terms of calculated q-factor values, more in detail, it was shown that:
  • IDA-based approaches (M1 or M2) are univocal in damage detection, thus in the corresponding estimation of reliable EDPs;
  • Both M1 and M2 procedures are indeed strongly expensive in computational cost. The present study, for example, was based on a minimum of 7 accelerograms and required up to 140 non-linear dynamic analyses; and
  • High sensitivity was observed for the predicted average q-values from M1 or M2, thus recommending a careful selection of input signals, but also the possible use of largest sets of scaled records.
At the same time, the adaptation of M3 method with linear regression to structural glass frames:
  • Confirmed the reduced computational cost of the approach, compared to M1 or M2 methods (60 unscaled signals and analyses in total for the present study, compared to 140 simulations); and
  • Confirmed that reliable EDPs for special structures should be properly calculated, with the support of refined numerical models or even experimental tests. Existing consolidated EDPs of literature and standards for seismic-resistant structures can hardly adapt to special glass systems and members.
  • However, the M3 procedure also gave evidence of some difficulties of dataset interpretation (due to limited stress/deformation levels in the load-bearing members, for some simulations). The reason was found in the set of unscaled input accelerograms that sometimes (when applied to structures characterized by limited self-weight and high flexibility as in the present study) can hardly achieve the desired EDPs at collapse; and
  • Furthermore, the FE parametric study proved that—once EDPs and damage mechanisms for relevant limit states are established—the M3 approach can offer rather accurate predictions for glass structures under seismic loads, and thus support as an efficient tool the estimation of q-factor for the seismic design of similar structural systems. For the present case-study frame, the calculated q-factor was in fact in line, but on the conservative side compared to simple analytical predictions from [19], based on the local analysis of bracket ductility and stress peaks in the region of glass holes. Such a finding also confirms the need for complex numerical models able to capture dynamic mechanical phenomena in similar systems, as a more detailed investigation to combine with simplified analytical procedures.

Author Contributions

Conceptualization, C.B.; methodology, S.M., M.F. and C.B.; validation, C.B.; formal analysis, S.M. and M.F.; data curation, S.M. and M.F.; writing-original, S.M., M.F. and C.B.; writing-review, S.M., M.F. and C.B.; supervision C.B.; project administration, C.B. All authors have read and agreed to the published version of the manuscript.

Funding

This research received no external funding.

Institutional Review Board Statement

Not applicable.

Informed Consent Statement

Not applicable.

Data Availability Statement

Data will be made available upon request.

Conflicts of Interest

The authors declare no conflict of interest.

Appendix A

Table A1. Reference parameters for the selected ground motions records.
Event IDDateSoil TypeMwR
(km)
PGA
(m/s2)
Sa(T1)
(m/s2)
ME-1979-000315/04/1979B6.96.83.537.39
ME-1979-000315/04/1979A6.962.92.117.50
ME-1979-000315/04/1979B6.919.72.987.89
ME-1979-000315/04/1979B6.919.74.4510.52
ME-1979-000315/04/1979A6.919.71.736.29
ME-1979-000315/04/1979B6.9222.778.39
GR-1986-000613/09/1986B5.96.62.286.52
GR-1986-000613/09/1986B5.96.62.6510.61
GR-1986-000613/09/1986B5.95.52.9110.23
EMSC-20161030_000002930/10/2016A6.518.64.2613.57
EMSC-20161030_000002930/10/2016A6.518.63.8511.29
EMSC-20160824_000000624/08/2016B68.58.5117.94
EMSC-20161030_000002930/10/2016B6.526.43.9413.02
IT-2009-000906/04/2009B6.154.379.72
IT-2009-000906/04/2009B6.14.95.3512.93
EMSC-20161030_000002930/10/2016A6.57.84.199.63
EMSC-20161030_000002930/10/2016A6.57.85.7115.72
EMSC-20161026_000009526/10/2016B5.9145.399.29
EMSC-20161026_000009526/10/2016B5.939.12.408.90
EMSC-20161030_000002930/10/2016B6.54.64.7618.63
EMSC-20160824_000000624/08/2016B615.33.676.61
EMSC-20161030_000002930/10/2016B6.54.63.6511.00
IT-1980-001223/11/1980B6.933.33.1410.87
IT-1980-001223/11/1980B6.933.32.216.34
EMSC-20161030_000002930/10/2016B6.522.64.747.79
EMSC-20161030_000002930/10/2016A6.5127.7913.17
EMSC-20161030_000002930/10/2016A6.5128.5014.17
EMSC-20161030_000002930/10/2016B6.511.45.9315.88
EMSC-20161030_000002930/10/2016B6.511.44.1314.21
EMSC-20161030_000002930/10/2016B6.59.92.605.39
EMSC-20161030_000002930/10/2016B6.526.14.457.34
EMSC-20161030_000002930/10/2016B6.526.14.367.63
TK-2003-003801/05/2003B6.3311.85.0910.73
TK-1999-007717/08/1999A7.63.52.2911.07
ME-1979-001224/05/1979B6.28.32.614.60
ME-1979-000315/04/1979A6.919.72.104.90
ME-1979-000315/04/1979B6.9222.325.30
GR-1986-001115/09/1986B-14.21.384.68
GR-1993-002714/07/1993B5.64.93.954.33
GR-1990-000217/05/1990B-231.985.58
GR-1986-000613/09/1986B5.95.52.125.52
IT-1976-000206/05/1976B6.427.73.106.47
EMSC-20160903_000006303/09/2016A4.33.61.452.51
EMSC-20161030_000002930/10/2016B6.5202.862.54
EMSC-20161101_000006001/11/2016A4.818.70.611.60
EMSC-20161030_000002930/10/2016B6.539.20.922.82
EMSC-20161030_000002930/10/2016B6.539.20.911.83
EMSC-20161030_000002930/10/2016B6.539.20.962.95
EMSC-20161026_000007726/10/2016B5.47.72.333.63
EMSC-20161026_000009526/10/2016B5.99.22.163.87
EMSC-20161030_000002930/10/2016B6.517.41.894.24
ME-1979-001224/05/1979B6.233.31.973.51
IT-2009-010207/04/2009B5.514.31.442.62
EMSC-20161026_000009526/10/2016A5.910.81.894.41
EMSC-20161026_000009526/10/2016A5.916.21.653.08
EMSC-20161030_000002930/10/2016B6.58.22.454.82
IT-1977-000816/09/1977B5.37.10.801.05
IT-1976-002411/09/1976B5.26.11.875.68
EMSC-20161026_000007726/10/2016B5.48.91.812.67
EMSC-20161026_000013326/10/2016A4.55.61.893.21

References

  1. Haldimann, M.; Luible, A.; Overend, M. Structural Use of Glass; IABSE: Zurich (CH), Switzerland, 2008; ISBN 978-3-85748-119-2. [Google Scholar]
  2. Feldmann, M.; Kasper, R.; Abeln, B.; Cruz, P.; Belis, J.; Beyer, J.; Colvin, J.; Ensslen, F.; Eliasova, M.; Galuppi, L.; et al. Guidance for European Structural Design of Glass Components—Support to the Imple-Mentation, Harmonization and Further Development of the Eurocodes; Pinto, D., Denton, F., Eds.; Report EUR 26439-Joint Research Centre-Institute for the Protection and Security of the Citizen: Ispra, Italy, 2014. [Google Scholar] [CrossRef]
  3. Bedon, C.; Amadio, C.; Noé, S. Noé Safety Issues in the Seismic Design of Secondary Frameless Glass Structures. Safety 2019, 5, 80. [Google Scholar] [CrossRef] [Green Version]
  4. Sucuoglu, H.; Vallabhan, C.V.G. Behaviour of window glass panels during earthquakes. Eng. Struct. 1997, 19, 685–694. [Google Scholar] [CrossRef]
  5. Lago, A.; Sullivan, T.J. A Review of Glass Facade Systems and Research into the Seismic Design of Frameless Glass Facades; ROSE Research Report 2011/11; IUSS Press: Pavia, Italy, 2011; ISBN 978-88-6198-059-4. [Google Scholar]
  6. Baniotopoulos, C.C.; Chatzinikos, K.T. Glass facades of mid-rise steel buildings under seismic excitation. In Research in Architectural Engineering Series, Volume 1: EU COST C13 Glass and Interactive Building Envelopes; IOS Press: Amsterdam, The Netherlands, 2007; pp. 239–246. ISBN 978-1-58603-709-3. [Google Scholar]
  7. Sivanerupan, S.; Wilson, J.L.; Gad, E.F.; Lam, N.T.K. Drift performance of point fixed glass façade systems. Adv. Struct. Eng. 2014, 17, 1481–1495. [Google Scholar] [CrossRef]
  8. Martins, L.; Delgado, R.; Camposinhos, R.; Silva, T. Seismic behaviour of point supported glass panels. In Proceedings of the Challenging Glass 3. Bos, Delft, The Netherlands, 28–29 June 2012; Veer Louter, N., Ed.; IOS Press: Amsterdam, The Netherlands, 2012. [Google Scholar]
  9. Casagrande, L.; Bonati, A.; Occhiuzzi, A.; Caterino, N.; Auricchio, F. Numerical investigation on the seismic dissipation of glazed curtain wall equipped on high-rise buildings. Eng. Struct. 2019, 179, 225–245. [Google Scholar] [CrossRef]
  10. Bellamy, L.; Palermo, A.; Sullivan, T. Developing innovative facades with improved seismic and sustainability performance. In Proceedings of the 12th Conference on Advanced Building Skins, Bern, Switzerland, 2–3 October 2017. [Google Scholar]
  11. Bedon, C.; Amadio, C. Numerical assessment of vibration control systems for multi-hazard design and mitigation of glass curtain walls. J. Build. Eng. 2018, 15, 1–13. [Google Scholar] [CrossRef] [Green Version]
  12. Bukieda, P.; Engelmann, M.; Stelzer, I.; Weller, B. Examination of Laminated Glass with Stiff Interlayers—Numerical and Experimental Research. Int. J. Struct. Glas. Adv. Mater. Res. 2019, 3, 1–14. [Google Scholar] [CrossRef] [Green Version]
  13. Zhao, C.; Yang, J.; Wang, X.; Azim, I. Experimental investigation into the post-breakage performance of pre-cracked laminated glass plates. Constr. Build. Mater. 2019, 224, 996–1006. [Google Scholar] [CrossRef]
  14. Kuntsche, J.; Schuster, M.; Schneider, J. Engineering design of laminated safety glass considering the shear coupling: A review. Glas. Struct. Eng. 2019, 4, 209–228. [Google Scholar] [CrossRef]
  15. D’Ambrosio, G.; Galuppi, L.; Royer-Carfagni, G. Post-breakage in-plane stiffness of laminated glass: An engineering approach. Glas. Struct. Eng. 2019, 4, 421–432. [Google Scholar] [CrossRef]
  16. Bedon, C.; Zhang, X.; dos Santos, F.A.; Honfi, D.; Kozłowski, M.; Arrigoni, M.; Figuli, L.; Lange, D. Performance of structural glass facades under extreme loads—Design methods, existing research, current issues and trends. Constr. Build. Mater. 2018, 163, 921–937. [Google Scholar] [CrossRef]
  17. Eurocode 8: Design of Structures for Earthquake Resistance—Part 1: General Rules, Seismic Actions and Rules for Buildings; European Committee for Standardisation: Brussels, Belgium, 1998.
  18. Eurocode 3: Design of Steel Structures—Part 1–5: Plated Structural Elements; European Committee for Standardisation: Brussels, Belgium, 1993.
  19. Santarsiero, M.; Bedon, C.; Moupagitsoglou, K. Energy-based considerations for the seismic design of ductile and dissipative glass frames. Soil Dyn. Earthq. Eng. 2019, 125, 105710. [Google Scholar] [CrossRef]
  20. ATC3-06. Tentative Provisions for the Development of Seismic Regulations for Buildings; Applied Technology Council: Redwood City, CA, USA, 1978. [Google Scholar]
  21. Macedo, L.; Silva, A.; Castro, J.M. A more rational selection of the behaviour factor for seismic design according to Eurocode 8. Eng. Struct. 2019, 188, 69–86. [Google Scholar] [CrossRef]
  22. Costanzo, S.; Tartaglia, R.; DI Lorenzo, G.; De Martino, A. Seismic Behaviour of EC8-Compliant Moment Resisting and Concentrically Braced Frames. Buildings 2019, 9, 196. [Google Scholar] [CrossRef] [Green Version]
  23. Kappos, A. Evaluation of behaviour factors on the basis of ductility and overstrength studies. Eng. Struct. 1999, 21, 823–835. [Google Scholar] [CrossRef]
  24. Borzi, B.; Elnashai, A. Refined force reduction factors for seismic design. Eng. Struct. 2000, 22, 1244–1260. [Google Scholar] [CrossRef]
  25. Chryssanthopoulos, M.K.; Dymiotis, C.; Kappos, A. Probabilistic evaluation of behaviour factors in EC8-designed R/C frames. Eng. Struct. 2000, 22, 1028–1041. [Google Scholar] [CrossRef]
  26. Newmark, N.M.; Hall, W. Procedures and criteria for earthquake-resistant design. In Part of: Selected Papers By Nathan M. Newmark: Civil Engineering Classics; Reprinted from Building Practices for Disaster Mitigation; Building Science Series, No. 46,1973; Natl. Bureau of Standards: Gaithersburg, MD, USA, 1973; Volume 1, pp. 209–236. [Google Scholar]
  27. Megalooikonomou, K.G.; Parolai, S.; Pittore, M. Toward performance-driven seismic risk monitoring for geothermal platforms: Development of ad hoc fragility curves. Geotherm. Energy 2018, 6, 1–17. [Google Scholar] [CrossRef] [Green Version]
  28. Terrenzi, M.; Spacone, E.; Camata, G. Collapse limit state definition for seismic assessment of code-conforming RC buildings. Int. J. Adv. Struct. Eng. 2018, 10, 325–337. [Google Scholar] [CrossRef]
  29. D’Aragona, M.G.; Polese, M.; Prota, A. Stick-IT: A simplified model for rapid estimation of IDR and PFA for existing low-rise symmetric infilled RC building typologies. Eng. Struct. 2020, 223, 111182. [Google Scholar] [CrossRef]
  30. Follesa, M.; Fragiacomo, M.; Casagrande, D.; Tomasi, R.; Piazza, M.; Vassallo, D.; Canetti, D.; Rossi, S. The new provisions for the seismic design of timber buildings in Europe. Eng. Struct. 2018, 168, 736–747. [Google Scholar] [CrossRef]
  31. Pozza, L.; Scotta, R.; Trutalli, D.; Polastri, A.; Smith, I. Experimentally based q-factor estimation of cross-laminated timber walls. Struct. Build. 2016, 169, 492–507. [Google Scholar] [CrossRef] [Green Version]
  32. Magenes, G.; Modena, C.; da Porto, F.; Morandi, P. Seismic Behaviour and Design of New Masonry Buildings: Recent Developments and Consequent Effects of Design Codes. In Proceedings of the Eurocode 8 Perspectives from the Italian Standpoint Workshop; Edoardo, C., Ed.; CRC Press: Boca Raton, Florida, USA, 2009; pp. 199–212. [Google Scholar]
  33. Zonta, D.; Zanardo, G.; Modena, C. Experimental evaluation of the ductility of a reduced-scale reinforced masonry building. Mater. Struct. 2001, 34, 636–644. [Google Scholar] [CrossRef]
  34. Casalegno, C.; Russo, S.; Sciarretta, F. Numerical Analysis of a Masonry Panel Reinforced with Pultruded FRP Frames. Mech. Compos. Mater. 2018, 54, 207–220. [Google Scholar] [CrossRef]
  35. Mazzolani, F.M.; Della Corte, G.; D’Aniello, M. Experimental analysis of steel dissipative bracing systems for seismic upgrading. J. Civ. Eng. Manag. 2009, 15, 7–19. [Google Scholar] [CrossRef] [Green Version]
  36. D’Ayala, D.; Meslem, A.; Vamvatsikos, D.; Porter, K.; Rossetto, T.; Silva, V. Guidelines for Analytical Vulnerability Assessment of Low/Mid-Rise Buildings, Vulnerability Global Component Project; GEM Foundation: Dubai, United Arab Emirates, 2015. [Google Scholar] [CrossRef]
  37. Jalayer, F.; De Risi, R.; Manfredi, G. Bayesian Cloud Analysis: Efficient structural fragility assessment using linear regression. Bull. Earthq. Eng. 2015, 13, 1183–1203. [Google Scholar] [CrossRef]
  38. Zentner, I.; Gündel, M.; Bonfils, N. Fragility analysis methods: Review of existing approaches and application. Nucl. Eng. Des. 2017, 323, 245–258. [Google Scholar] [CrossRef] [Green Version]
  39. Bakalis, K.; Vamvatsikos, D. Seismic Fragility Functions via Nonlinear Response History Analysis. J. Struct. Eng. 2018, 144, 04018181. [Google Scholar] [CrossRef]
  40. Luzi, L.; Lanzano, G.; Felicetta, C.; D’Amico, M.C.; Russo, E.; Sgobba, S.; Pacor, F.; ORFEUSWorking Group, 5. Engineering Strong Motion Database (ESM) (Version 2.0). Ist. Naz. Geofis. Vulcanol. (INGV) 2020. [Google Scholar] [CrossRef]
  41. Kiani, J.; Camp, C.; Pezeshk, S. On the number of required response history analyses. Bull. Earthq. Eng. 2018, 16, 5195–5226. [Google Scholar] [CrossRef]
  42. Baltzopoulos, G.; Baraschino, R.; Iervolino, I. On the number of records for structural risk estimation in PBEE. Earthq. Eng. Struct. Dyn. 2018, 48, 489–506. [Google Scholar] [CrossRef]
  43. Bradley, B.A.; Pettinga, D.; Baker, J.W.; Fraser, J. Guidance on the Utilization of Earthquake-Induced Ground Motion Simulations in Engineering Practice. Earthq. Spectra 2017, 33, 809–835. [Google Scholar] [CrossRef] [Green Version]
  44. Evangelista, L.; Del Gaudio, S.; Smerzini, C.; D’Onofrio, A.; Festa, G.; Iervolino, I.; Landolfi, L.; Paolucci, R.; Santo, A.; Silvestri, F. Physics-based seismic input for engineering applications: A case study in the Aterno river valley, Central Italy. Bull. Earthq. Eng. 2017, 15, 2645–2671. [Google Scholar] [CrossRef]
  45. Hassan, H.M.; Fasan, M.; Sayed, M.A.; Romanelli, F.; ElGabry, M.N.; Vaccari, F.; Hamed, A. Site-specific ground motion modeling for a historical Cairo site as a step towards computation of seismic input at cultural heritage sites. Eng. Geol. 2020, 268, 105524. [Google Scholar] [CrossRef]
  46. Bedon, C.; Amadio, C. Design buckling curves for glass columns and beams. Proc. Inst. Civ. Eng. Struct. Build. 2015, 168, 514–526. [Google Scholar] [CrossRef]
  47. Santo, D.; Mattei, S.; Bedon, C. Elastic Critical Moment for the Lateral–Torsional Buckling (LTB) Analysis of Structural Glass Beams with Discrete Mechanical Lateral Restraints. Materials 2020, 13, 2492. [Google Scholar] [CrossRef]
  48. Amadio, C.; Bedon, C. A buckling verification approach for monolithic and laminated glass elements under combined in-plane compression and bending. Eng. Struct. 2013, 52, 220–229. [Google Scholar] [CrossRef]
  49. CNR-DT 210/2013. Istruzioni per la Progettazione, L’esecuzione ed il Controllo di Costruzioni con Elementi Strutturali di vetro [Guide for the Design, Construction and Control of Buildings with Structural Glass Elements]; National Research Council of Italy (CNR): Roma, Italy, 2013; (Italian Version); Available online: www.cnr.it/it/node/2630 (accessed on 17 August 2021).
  50. NTC2018. Norme Tecniche Per Le Costruzioni; Design Standard for Buildings; Ministero delle Infrastrutture e dei Trasporti: Roma, Italy. 17 Gennaio 2018 (In Italian)
  51. Pilkey, W.D. Peterson’s Stress Concentration Factors, 2nd ed.; John Wiley & Sons, Inc.: Hoboken, NJ, USA, 1997. [Google Scholar]
  52. Coker, E.G.; Filon, L.N.G. Photo-Elasticity; Cambridge University Press: London, UK, 1931. [Google Scholar]
  53. Frocht, M.M. Photoelasticity; Wiley: New York, NY, USA, 1949; Volume 1. [Google Scholar]
  54. Simulia. ABAQUS Computer Software; Dassault Systèmes: Providence, RI, USA, 2020. [Google Scholar]
  55. Iervolino, I.; Galasso, C.; Cosenza, E. REXEL: Computer aided record selection for code-based seismic structural analysis. Bull. Earthq. Eng. 2010, 8, 339–362. [Google Scholar] [CrossRef]
  56. FEMA 356. Prestandard and Commentary for the Seismic Rehabilitation of Buildings; FEMA Publication No. 356; American Society of Civil Engineers for the Federal Emergency Management Agency: Washington, DC, USA, 2000. [Google Scholar]
  57. SEAOC. Vision 2000: Performance Based Seismic Engineering of Buildings; Structural Engineers Association of California: Sacramento, CA, USA, 1995. [Google Scholar]
  58. UBC. Uniform Building Code; International Conference of Building Officials: Whittier, CA, USA, 1997. [Google Scholar]
  59. Bedon, C.; Rinaldin, G.; Fragiacomo, M.; Noè, S. q-factor estimation for 3D log-house timber buildings via Finite Element analyses. Soil Dyn. Earthq. Eng. 2019, 116, 215–229. [Google Scholar] [CrossRef]
Figure 1. Examples of design spectra calculated for two different q-factor values.
Sustainability 13 09291 g001
Figure 2. Expected building response and damage under seismic events. In evidence, the reference limit states and EDPs for design.
Sustainability 13 09291 g002
Figure 3. Reference flowchart for the seismic assessment of novel structural systems/materials.
Sustainability 13 09291 g003
Figure 4. Reference structural glass frame (adapted from [19]) for the q-factor estimation, based on (a) non-linear incremental dynamic analyses (IDA) or (b) push-over (PO) numerical procedures.
Sustainability 13 09291 g004
Figure 5. Schematic representation of the case study frame: (a) design concept (axonometry), with (b) static scheme of the structural glass frame object of analysis and (c) detail view of a typical push-pull moment connection at the base of the columns (adapted from [19]).
Sustainability 13 09291 g005
Figure 6. Numerical model of the case study structural glass frame under in-plane seismic loads (detail of the base region and beam/column connection, ABAQUS).
Sustainability 13 09291 g006
Figure 7. Reference set of time-acceleration histories, as derived from REXEL [55] for the non-linear incremental dynamic analysis (IDA) of the case study glass frame.
Sustainability 13 09291 g007
Figure 8. PO analysis of the frame, with evidence of relevant EDPs (ABAQUS).
Sustainability 13 09291 g008
Figure 9. Example of IDA results (ABAQUS): (a) deformed shape (extruded axonometric detail, scale factor = 300, at a total time of 15 s); (b) stress envelope in the glass holes; (c) Von Mises stress in the angle brackets; and (d) in-plane lateral deformation. Results for the seismic record a#7 (×1, PGA = 5 m/s2).
Sustainability 13 09291 g009
Figure 10. Selected IDA numerical results, as a function of the maximum imposed PGA (ABAQUS): (a) tensile and (b) compressive stress in glass holes, with (c) Von Mises stresses and (d) plastic strain in the steel angle brackets.
Sustainability 13 09291 g010
Figure 11. Selected IDA numerical results, as a function of the maximum imposed PGA (ABAQUS): (a) vertical displacement; (b) lateral drift, and (c) base rotation of the frame.
Sustainability 13 09291 g011
Figure 12. M1 and M2 calculated q-factor from IDA (ABAQUS).
Sustainability 13 09291 g012
Figure 13. Definition of the reference inter-story drift, based on the distribution of tensile stress peaks in glass (ABAQUS): (a) stress analysis at collapse (legend values in Pa) and (b) corresponding in-plane lateral deformation (legend values in m), with (c) calculated trends at the column base or from maximum envelope data.
Sustainability 13 09291 g013
Figure 14. Cloud analysis results (M3) in the form of inter-story lateral displacement, as a function of (a) PGA and (b) Sa(T1).
Sustainability 13 09291 g014
Figure 15. Cloud analysis results (M3) in the form of (a) Von Mises stress in the angle brackets, (b) tensile stress, and (c) compressive stress in glass (hole region), as a function of Sa(T1).
Sustainability 13 09291 g015
Figure 16. Cloud analysis results (M3) in the form of lateral displacement of the frame, as a function of (a) PGA and (b) Sa(T1).
Sustainability 13 09291 g016
Figure 17. Calculated q-factor for the examined frame, based on M1 to M3 methods and EDPs.
Sustainability 13 09291 g017
Table 1. Recommended limit configurations for the collapse prevention of steel structures, according to selected international design standards.
Limit Drift Value
(u/H)
Column Rotation
(rad)
Structural systemFEMA 356
[56]
Vision 2000
[57]
UBC 1997
[58]
EC8, NTC2018
[17,50]
Steel braced frames0.020.0250.020.03
Steel moment frames0.05
Publisher’s Note: MDPI stays neutral with regard to jurisdictional claims in published maps and institutional affiliations.

