Abstract
Empirically, official multidimensional measures of poverty often show children to be the poorest age group. Such poverty measures and their analysis can be used to directly inform policies to reduce children’s multiple deprivations. This paper introduces methods to produce official national statistics on multidimensional poverty that inform child-focused anti-poverty policies. In doing so, it recognises the importance of parsimonious, consistent measures, given practical constraints such as policy makers’ time. The paper does not recommend constructing several disjoint poverty measures which cannot be straightforwardly interpreted and used alongside one another, as these may create confusion or dilute policy attention. To create a compact and high-information measurement platform, the paper introduces four measurement strategies that have been used to directly uncover policy-relevant data on children’s experience of multidimensional poverty, and that are consistent with official population-level statistics. The four are as follows: (1) Include children’s deprivations as indicators of multidimensional poverty in national measures. (2) Disaggregate multidimensional poverty indices and their associated information platform to compare children and adults. (3) Analyse individual child deprivations and explore gendered and intra-household inequalities. (4) Construct an individual measure of child multidimensional poverty that is directly linked to the official national measure, but contains additional indicators across the life course of children. The paper illustrates these four strategies and the child-relevant statistics they yield, using examples from official poverty measures and previous research. It discusses the strengths and challenges of each method from conceptual, policy, and technical perspectives, and examines how they can be used for descriptive and prescriptive purposes in line with the Sustainable Development Goals.
1. Introduction
The Sustainable Development Goals (SDGs) call for the global community to “By 2030, reduce at least by half the proportion of men, women and children of all ages living in poverty in all its dimensions according to national definitions.” (SDG 1.2) [1]. A frequently taken approach of tracking progress against, and informing policy pathways towards, this goal is to make use of multidimensional poverty indices that summarise information about the multiple, overlapping deprivations that poor people are simultaneously affected by.
Across the world, children are among the most vulnerable members of their societies, and frequently bear the greatest burden of poverty. According to the global multidimensional poverty index (global MPI), for example, half of the world’s multidimensionally poor people are children below the age of 18, and a third are younger than 10 years of age [2,3,4,5]. Deprivations that children experience now may continue to affect them, and those around them, for the rest of their lives. Special priority to the young and vulnerable is both a child’s right and a crucial component of sustainable multidimensional poverty reduction. In line with international conventions, ‘child’ here refers to anyone below the age of 18 [6].
This paper synthesises the existing literature and outlines four technically rigorous and policy-actionable, synergetic measurement approaches, in which assessments of child poverty are built into, and analysed in tandem with, official all-population multidimensional poverty statistics. The approaches outlined in this paper either capture deprivations of the entire population and then zoom in on children and child indicators, or directly link child-focused and official multidimensional poverty indices (MPIs). Such synergetic approaches stand in contrast to proliferation approaches, which produce disjoint measures for different population subgroups—such as young children, school-aged children, youth, and adults. By disjoint we mean multiple measures that do not have a clear relationship to each other, and yet are each advocated by one group or another claiming that each is essential for policy. Disjoint measurement systems can be labour-intensive to use and may overwhelm the capacity of statisticians and policy actors alike. Each measure must first be constructed and computed, then separately understood and analysed—including its policy implications—in order to, then, be combined back into an integrated policy strategy. Disjoint measures are also difficult to interpret and integrate into coherent policies alongside one another, because they do not allow for interpersonal comparisons across separate measurement structures. They thus do not allow for a coherent identification of who are the worst-off.
The paper compares all four strategies in terms of their policy salience and technical (as well as normative) advantages or challenges, alongside their data requirements, and the child-relevant measures they yield. The overview and discussion here focus on multidimensional poverty measures and associated analyses based on the Alkire–Foster method. These are also referred to as multidimensional poverty indices (MPIs) and are focused on here because they are currently the most widely used family of measures for official multidimensional poverty measures. In line with SDG 1.2, the term national MPI is used here to signify official, permanent, all-population MPIs that reflect national definitions of poverty. For the purpose of this paper, national MPI is used interchangeably with ‘all-population’, ‘overall’, and sometimes ‘household-level’ MPI. The latter terms are, in principle, somewhat broader and can generalise implications from official statistics (national MPIs) to any overall population-level multidimensional poverty index.
The four child-relevant measurement and analyses approaches are:
- Integrating child indicators into national MPIs (Section 4);
- Age-disaggregating national MPIs to analyse levels and trends of child and adult poverty (Section 5);
- Analysing individual child indicators within the national MPI to illuminate gendered and age-wise intra- and across-household inequalities, and to study the cross-dimensional deprivation profiles of children who experience specific deprivations (Section 6); and
- Constructing an individual child MPI that is directly linked to a household-level national MPI (Section 7) and that augments the age-disaggregated national MPI with individual child dimensions and age-appropriate indicators.
These four approaches will be described in turn, after a concise introduction to the Alkire–Foster Method that is used to construct MPIs (Section 2), and a brief section that discusses in more detail the literature on concepts and measures of child poverty as well as the motivation of synergetic measurement approaches (Section 3). Each approach is illustrated with country examples from existing MPIs. The penultimate section compares the four approaches vis-à-vis one another (Section 8), whilst the final section concludes (Section 9).
2. The Alkire–Foster Method
Multidimensional poverty measures constructed using the Alkire–Foster method are also referred to as multidimensional poverty indices (MPIs). The Alkire–Foster method is currently the most widely used methodology for official statistics of multidimensional poverty (national MPIs)—all of which include children and child indicators (see Section 3 and Section 4; moreover, see resources by the Multidimensional Poverty Peer Network [7] for an overview of some existing official national MPIs).
As part of the Alkire–Foster method, a deprivation profile is constructed for each household, person, or child (henceforth, described as person). This deprivation profile summarises the indicators of poverty in which a person is deprived. Binary deprivation/non-deprivation status for each poverty indicator is identified by a deprivation cut-off. Deprivations are then aggregated into a weighted deprivation score. Deprivation weights reflect normative judgements that accord each indicator its respective importance for the measurement of multidimensional poverty.
A person is then identified as poor or non-poor, depending on whether or not their overall deprivation score is less than a multidimensional poverty cut-off (non-poor), or meets or exceeds the cut-off (poor), by comparing their deprivation score to the multidimensional poverty cut-off.
Information on the poor is then aggregated into the adjusted headcount ratio or MPI. The MPI combines two aspects of poverty:
- Incidence—the percentage of people who are poor, or the poverty rate or headcount ratio: H.
- Intensity—the average percentage of dimensions in which poor people are deprived, or the average deprivation score of poor persons: A.
The MPI can be equivalently expressed as the weighted sum of censored headcount ratios for each indicator. Censored headcount ratios show the percentage of people who are identified as poor, and are deprived in an indicator. Due to this feature, MPIs can also be broken apart by indicator to show the composition of poverty. In addition, any MPI can be disaggregated by population subgroups to analyse which group of people (or where) are disproportionately deprived or poor. Taken together, these properties (dimensional breakdown and subgroup decomposability) make visible which deprivations comprise poverty across different population subgroups, including geographic regions, social groups, and—of particular focus in this paper—age cohorts. This can inform, for example, integrated cross-sectoral policies that prioritise the least advantaged. For more extensive and formal discussions of the Alkire–Foster method, including axioms and applications, see Alkire and Foster [8] and Alkire et al. [9]. For policy-applications, see also UNDP and OPHI [10].
3. Concepts and Methods of Child Poverty Measurement
Numerous studies in recent years have sought to refine the conceptualisation of child multidimensional poverty, and to propose methodological improvements for its measurement. See, for example [11,12,13,14,15,16,17,18,19,20,21,22,23,24,25,26,27,28,29,30,31].
For example, there was a broader shift towards an understanding of poverty as a multidimensional phenomenon. This was, inter alia, characterised by the recognition that child poverty should not be measured by looking at mere (unidimensional) means of human development and well-being, such as money. Rather, it should be thought of and—as far as empirically possibly—measured multidimensionally, in terms of child rights, or the capabilities (or real freedoms) that people have to lead lives they have reason to value. A second shift can be summarised as the appreciation of the empirical evidence that children experience poverty differently from adults. Children are affected by age-, gender-, and otherwise context-specific deprivations that need to be captured in order to adequately measure, and act upon, child poverty. This turn meant a move away from the idea of children as ‘mini adults’ or partial adult equivalents for minimum consumption baskets and other monetary poverty measures, and a call to scrutinise child-specific deprivations. Going beyond single deprivations, an academic literature has emerged that explores multidimensional child poverty at the individual level [32].
In accord with the proposal by Trani, Biggeri, and Mauro [33], many among this emerging set of child-specific, individual-level measures of multidimensional poverty or well-being are constructed using the Alkire–Foster method, which is focused on in this paper (see, for example: [18,34,35,36,37,38,39,40,41,42,43,44,45,46]). Due to UNICEF funding and advocacy, there also exist Multiple Overlapping Deprivation Analysis (MODA) for a number of countries, measuring child multidimensional poverty, based on a children’s rights conceptual framework (de Neubourg et al. [21]; Hjelm et al. [28]; UNICEF [47]). Strictly speaking, MODA is a parametrically restricted application of the Alkire–Foster method (see also [48]).
MODAs and child MPIs commonly produce multiple separate statistics of child multidimensional poverty for different age cohorts—so a policy actor might need to use one measure for children 0-5 and then turn to scrutinise another measure for children 6-14, for example. Furthermore, these usually are neither directly related to all-population, household-level official national MPIs. From a policy perspective, an important question thus is which measurement approach is most likely not only to produce a statistic, but also to be used as a policy tool to reduce (child) multidimensional poverty and coherently identify and prioritise the worst-off. The practical relationship between measures of child multidimensional poverty, such as a MODA or a child MPI, and an overall statistic used to measure and alleviate multidimensional poverty across the entire population (including children) is a question of prominent policy-relevance, not least in the context of SDG 1.2.2 (see Section 7). This paper focuses on that question.
The emphasis on synergetic approaches proposed in this paper has been informed by country experiences, which showed that, from a policy-perspective, there are clear reasons not to develop multiple disjoint poverty measures for adults and children if it is possible to synergise. Disjoint individual child MPIs were developed in Bhutan, Panama, and Thailand [49,50,51], and generated awareness of the accompanying policy challenges. Cuesta et al. [52], too, point out the relatively scarce use of child MPIs as policy-tools. Most countries age-disaggregate their national MPI results, rather than devising separate measures of child multidimensional poverty—but they use those data to guide action [53,54]. Measures which are consistent with each other have a certain advantage. For example, if both the child and national MPI include water and sanitation indicators, and if both MPIs aim to shape budget allocation, they are likely to each provide proposals as to how to adjust budget allocations in water and sanitation—but their proposals may differ, and compete with each other, creating confusion.
Indeed, as the following sections show, all national MPIs that are, per se, all-population MPIs, always include child deprivations, so are somewhat child-inclusive. An entirely separate child measure thus risks competing with an official national and child-inclusive MPI whilst at the same time being ambiguous in how its results relate to, and can inform policy together with, national MPIs.
The only way to avoid confusion between the measures would be to altogether exclude children from national MPIs and, thus, to always consider adult and child poverty entirely separately. However, if the rationale for a separate measure of child poverty is their special situation, it is not at all clear where to draw the line of societal stratification and differentiation. Other advocacy groups may thus recommend disjoint measures for older generations, migrants, indigenous groups, unemployed youth, women, and differently abled people, to name just a few. Thus, distinct MPIs could likewise be developed to very precisely capture priority deprivations for every one of these population subgroups. However, separate measures for each subgroup are neither empirically and computationally feasible, nor necessarily desirable. The reason is that separate measures, with different structures (indicators and dimensions of poverty) do not permit direct comparisons of poverty across population subgroups. They can also not be straightforwardly aggregated into an overall population measure and headline national poverty statistic. Yet, any policy framework will have to balance and make trade-offs between different groups. Designing overall measures that are disaggregated by these groups ensures interpersonal comparisons as well as policy relevance. To be clear, for other contexts and purposes—including advocacy and research—separate and group-specific measures can provide important insights for policy.
As an alternative to the potentially emerging confusion of separate measures, this paper outlines synergetic approaches to multidimensional poverty measurement and monitoring including children. Each section briefly describes the method, the data requirements, the ensuing child statistics, and country examples before summarising advantages and challenges of each approach.
4. Child Indicators in Official National MPIs
4.1. Method
A first approach to ensuring that multidimensional poverty measurement and monitoring includes, and is relevant for, children is to integrate child-specific and/or child-inclusive indicators into the national MPI. National MPIs aim to capture deprivations among the entire population and there is currently no national MPI that does not capture at least some indicators pertaining to deprivations experienced directly by children within the household. Some even include a dimension specifically aimed at capturing childhood and youth conditions. Figure 1 below summarises child-specific or child-inclusive indicators included in existing national MPIs.
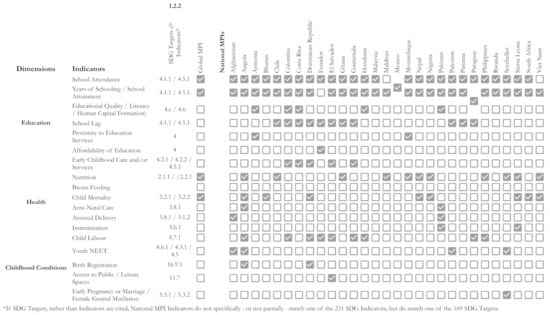
Figure 1.
Child-relevant indicators included some national MPIs. Source: own elaborations based on Dirksen [71].
Child-specific indicators are those that capture deprivations exclusively based on indicators referring to children. Indicators of school attendance, for example, frequently capture whether or not there is a school-aged child in the household that is not currently attending school. If this is the case, then the household and all of its members are commonly considered deprived in the indicator of school attendance.
Child-inclusive indicators are those that capture individual deprivations that are often, but may not always be, referring to deprivations experienced directly by children. Information on malnutrition, for example, is frequently collected for children and adults. So a household may be considered deprived in an indicator of nutrition, either due to nutritional deprivations among children, or because of an adult’s low body mass index (BMI) (for example). Such indicators do not exclusively pertain to children, but do include conditions that relate to children directly.
The choice between these two types of child indicators will often be made by underlying concepts of poverty, as well by data availability or limitations. For example, if the measurement goal is to capture deprivations of as many eligible persons as possible for an all-population measure, then, rather than limiting a nutritional indicator (for example) to children, it is sensible to use child-inclusive indicators that consider the deprivation status of as many persons as possible to obtain the most comprehensive and accurate all-population picture of deprivation and multidimensional poverty. On the other hand, some deprivations are best captured using child-specific indicators, and some datasets only have nutritional information for children below the age of five.
4.1.1. Household Indicators Relevant to Children
Even if indicators are not directly child-specific, or child-inclusive, there are frequently all-household indicators that are relevant for all members of a household at the same time, including children. Such indicators include access the clean drinking water, improved sanitation facilities, electricity as well as housing materials, for example. A well-known challenge to such all-household indicators is that there is rarely information on intra-household inequalities—for example in asset use or ownership. Implicit assumptions of equal sharing of benefits across household members may be erroneous. There is extensive literature on the issue of intra-household inequalities. See, e.g., [55,56,57,58,59,60,61]. Methods to redress the problem of overlooked intra-household inequalities in multidimensional poverty measures are presented in Section 6.
4.1.2. Indicators with Externalities for Children
In addition, there are also non-child-specific indicators for which it is often reasonable to assume effects on children, based on empirical evidence on their interlinkage. One example of such an indicator, with clearly documented externalities, is educational attainment among adults. Although most immediately this is a deprivation experienced at the individual level of the respective adult, it is well-known that parental educational attainment is strongly associated with a range of positive externalities for other household members, including children. These include better health outcomes, educational opportunities, and achievements, as well as material living standards and employment and other opportunities for children (See e.g., [62,63,64,65,66,67,68,69,70]). If no adult in the household is in decent employment, a potentially resulting livelihood vulnerability is likely to affect children in the household. Such indicators are imprecise approximations of children’s actual deprivations and rely on the association between children and others’ deprivations or achievements. However, as this example shows, the claim that such adult-specific indicators are entirely irrelevant when considering child multidimensional poverty is inaccurate.
4.2. Data
For all MPIs considered, a key aspect to consider in selecting indicators is the purpose(s) that the MPI seeks to serve. If an MPI is primarily meant to be a policy-tool, policy-responsive indicators should receive priority. In most cases, measurement purpose, data requirements and (quality) data availability will thus organically limit the number of feasible and justifiable (child) poverty indicators. See also Alkire et al. [9], and UNDP and OPHI [10].
The data requirements for including child indicators into a national MPI are comparatively modest. As with all household-level MPIs, in order to make visible overlapping deprivations at the household level, it is usually indispensable that all data come from the same household survey. Thus, usually only child indicators included in such surveys will be candidate indicators for an MPI. Furthermore, in order to have relevance as indicators that are generalised across all members of the household—including all children—indicators should usually capture key child deprivations and be applicable for a sufficiently large proportion of the population. For example, whilst it may, in principle, be desirable to capture whether or not children have been vaccinated—as an insightful indicator of vulnerability-to-disease—vaccination indicators are often available only for a very narrow age-range, such as children 12–23 months of age. However, a large percentage of households might not include a child in this age range and thus impossibly be considered deprived in this health-related indicator, although older children, for example, might be present and actually be suffering health-related deprivations. Choosing indicators that are directly relevant for a large share of all households in a country is thus important. A frequently used indicator is school attendance, because it considers as indicator-specific reference population all school-aged children. Since this is usually a considerably wider age-range, this indicator is more likely applicable for a larger majority of households. If nearly all children attend school, this indicator may be further qualified, e.g., in terms of educational quality, in order to ensure policy-relevance.
4.3. Child-Relevant Statistics
An MPI including child indicators produces the core MPI indices and associated information platform: a headline multidimensional poverty index, as well as its partial indices—poverty incidence (H) and average intensity (A)—at all-population level. The information platform also includes the censored and uncensored headcount ratios for each indicator, i.e., the percentage of people deprived in a particular indicator (uncensored) and the percentage of people poor and deprived in a particular indicator (censored). These can be particularly insightful to identify key priorities, and to see how the composition of poverty differs across age cohorts.
4.4. Country Example(s)
Figure 1 summarises information on child-specific and child-inclusive indicators that have been used in national MPIs. As the Figure shows, there is no national MPI without such child-specific and/or inclusive indicators. Especially popular indicators are school attendance—a child-specific indicator that considers whether or not school-aged children attend school—and years of schooling—a child-inclusive indicator that considers whether household members of a certain age, including older children, have completed a minimum number of years of schooling. Other popular child-specific indicators include school lag, child labour, child mortality, and early childhood care, whilst undernutrition is another either child-specific or child-inclusive deprivation commonly used.
Table 1 shows the key statistics of the Sierra Leone national MPI, an official statistic and policy tool with one of the largest number of child-inclusive and child-specific deprivations (see also Figure 1). The all population-statistics shown here are based, inter alia, on child indicators included in the national MPI. Figure 2 shows, in a way, the same results (because the weighted sum of censored headcount ratios is the MPI), but it shows them broken down by deprivation, summarising what percentage of people in Sierra Leone were poor and deprived in each of these indicators. This simple exercise can yield insightful results for policy and an understanding of multidimensional poverty. Deprivations related to material living standard, housing, and public services that, arguably, affect all household members were most prevalent among the multidimensionally poor in Sierra Leone in 2017. However, the child-inclusive indicator of years of schooling and the child-specific indicators of school attendance, nutrition, child mortality, and vaccination, too, affect at least 15.2% (child mortality) and up to 46.3% (years of schooling) of people in multidimensionally poor households in Sierra Leone.

Table 1.
Sierra Leone national MPI results, 2017.
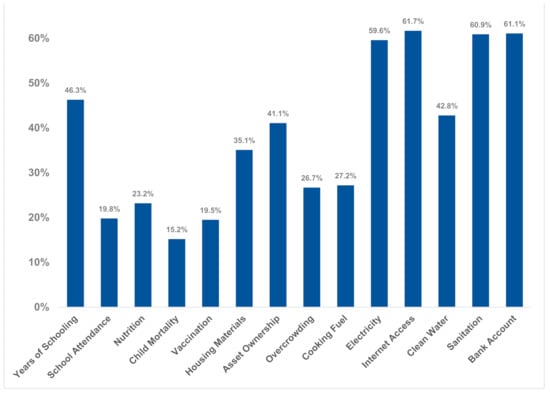
Figure 2.
Censored headcount ratios, Sierra Leone national MPI, 2017. Source: Statistics Sierra Leone, OPHI, and UNDP [72].
4.5. Advantages and Disadvantages
4.5.1. Advantages
- The definition of poverty considers adult and child conditions together.
A clear advantage of integrated multidimensional poverty measurement, including child indicators, is that the resulting measure captures adults and children together and provides an all-population summary statistic of poverty. This is not the case if two disjoint, either entirely separate, or confusingly overlapping measures are used for adults versus children or adults + children versus children. Disjoint measures, since they are comprised of different dimensions and indicators, bear the additional disadvantage that poverty levels cannot be compared across adults and children.
- The all-population MPI itself draws attention to child deprivations.
Furthermore, including child deprivations into an all-population MPI ensures that children’s disadvantages prominently feature in main results, rather than being left to a separate and perhaps less prominent measure.
- To reduce poverty, attention to child deprivations is essential.
Looking to policy, there is another clear benefit of such integrated measurement. Since children do frequently make up a large proportion of the overall population in demographically ‘young’ countries where MPIs are mostly utilised as official statistics and policy tools, reducing children’s deprivations is key to reduce multidimensional poverty overall. Including child indicators in any all-population MPI will, thus, increase the policy incentive to tackle children’s deprivations specifically. Whilst the particulars depend on how much weight child indicators receive in any given national MPI, child deprivations are frequently prevalent and strong contributors to overall poverty levels (see also the country examples provided below). Figure 3 visualises the breakdown of Sierra Leone’s national MPI (using MICS 2017 data) to consider each indicator’s contribution to overall MPI levels. It is clearly visible how child-inclusive indicators, such as years of schooling, and child-specific indicators, such as nutrition (which here captures anthropometric failure for children 0–59 months of age), and school attendance contribute to MPI. Overall, the directly child-related indicators in the dimensions of education and health here contribute some 28% to overall MPI, whilst the remaining indicators, arguably, affect household members across all ages—including children.

Figure 3.
Relative contributions of indicators to national MPI, Sierra Leone, 2017. Source: Statistics Sierra Leone, OPHI, and UNDP [72].
- The child indicators of the national MPI can be further assessed in terms of gendered and intra-household patterns.
As the following sections will further demonstrate, the approach of including child indicators into national MPIs does also lend itself to further policy-instructive analyses, including age disaggregation and analyses of gendered and (other) intra-household-inequalities.
- The national MPI considers indicators that a Child MPI usually also does, like water and sanitation.
To reiterate, there are household-level indicators, such as access to safe drinking water and improved sanitation, that affect all household members simultaneously. Because of this, they usually also feature in separate measures of child poverty. A separate child poverty measure would here thus overlap with an all-population MPI, which could create confusion in how to use both together.
- A synergetic national MPI is computationally and labour-wise cost-effective.
Lastly, having only one measure to compute can be advantageous, because statistical and human resource capacities may be limited. Any official multidimensional poverty measure will require regular updating to remain relevant, and a separate child poverty measure would involve twice the labour and computational burden. One synergetic national MPI including children is thus also computationally cost-effective.
4.5.2. Disadvantages
- The number of child indicators that can be included is limited.
Disadvantages of this approach include the fact that the number of child indicators that such an all-population MPI can include are necessarily limited. This is a limitation that does not apply only for children, but in fact for any population subgroup—age-wise and other. A poverty measure that is meant to be a monitoring and analytical tool for multidimensional poverty countrywide and for the overall population cannot be overtly biased towards any one particular population subgroup in the indicators that it considers. At the same time, in order to maintain both its comprehensiveness and its informational power and structural and communicative simplicity, a national MPI cannot comprise too many indicators overall. Reaching population-level accuracy and inclusiveness thus comes at the price of compromise of perfect accuracy for each population subgroup and indicators that might be particularly relevant for any one of them, including children.
- It is not only relevant to children, but has broader coverage to include adults.
Although comprehensive all-population MPIs are child-inclusive, most measure poverty at the household level and may include some indicators that are not directly relevant to children. MPIs with the household as the unit of identification thus identify children living in multidimensionally poor households. However, the necessary deprivation count to exceed the multidimensional poverty cut-off may well be reached without any, or without many, child deprivations being ‘activated’.
- Indicators that pertain to a narrow age range may be left out because many households will not have a child in that age range.
As discussed above, although a household survey may have information on an indicator that is insightful for a very narrow population subgroup, say (exclusive) breastfeeding among children 0–6 months as indicator of infant health [73,74,75,76,77,78], it is not usually advisable to include such indicators in national MPIs. Indicators such as this one would not be able to capture deprivations among the many households that lack a child aged 0–6 months at the time of the survey. Not all available and prima facie insightful child indicators will thus be desirable as indicators for a national MPI.
- Insensitivity to intra-household inequalities.
As long as an MPI’s unit of identification is the household, the measure, per se, is insensitive to distributional within the household. This is also the case for (other) individual indicators generally. Hence, changes in the within-household deprivation patterns that do not affect the overall household deprivation status will not change the measure. This is analogous to the weak monotonicity axiom [8,9].
- Summary
Due to all of the above-mentioned advantages (see also Table 2), integrating child indicators into a national MPI is the perhaps unsurprisingly most commonly taken route to official multidimensional poverty measurement and monitoring including—explicitly—children.
Table 2.
Advantages and disadvantages of incorporating child indicators in household-level national MPIs.
5. Age Disaggregation of National MPIs
5.1. Method
The second method, directly following from the first, is to disaggregate national MPIs by age cohorts in order to make visible how poor different age cohorts are, and how they are poor (i.e., which deprivations they are particularly frequently affected by), and to compare these results across age cohorts. It relies on the properties of subgroup consistency and subgroup decomposability (see, e.g., Foster, Greer, and Thorbecke [79]) that is satisfied by all measures belonging to the Alkire–Foster class. Given the additively separable form of any MPI, overall poverty is the weighted average of subgroup poverty.
Disaggregation is a very powerful tool to zero in on a population subgroup of particular interest, e.g., children, and to take advantage of the fact that an all-population measure also allows for direct comparative analyses of multidimensional poverty across different population subgroups, such as adults versus children or more refined age cohorts.
5.2. Data
The data demands for any disaggregation, including age disaggregation, are simply that the data are representative by age groups, so that generalisations can be drawn from sampled values, including consideration of sample weights. If the sample size is insufficient, or also if the sampling framework is not representative by the desired subgroups, disaggregations are not necessarily meaningfully interpretable. However, countrywide household surveys are commonly designed to be representative of children versus adults at country-level, by urban-rural areas, and frequently also by subnational regions. Computationally, disaggregating existing MPI results by age-cohorts is straightforward, especially if the aim of age disaggregation has been considered in the structure and data preparation for the national MPI. Such age disaggregations are now standardly performed and streamlined into national MPI technical procedures.
5.3. Child-Relevant Statistics
The child-relevant statistics obtained from an age disaggregation are exactly the same as for the all-population MPI itself—but focus on individual children living in MPI-poor households. All headline statistics and associated information can be profiled age-specifically: MPI, H, A, censored, and uncensored headcount ratios among children vis-à-vis adults, for example, and the (weighted) percentage contributions of each indicator.
5.4. Country Example(s)
Table 3 shows that in all countries for which national MPI age disaggregations have been performed and reported, the findings suggest that children live, on average, more frequently in poor households than adults. Similarly, in at least 84 out of 107 countries included in the 2020 global MPI, multidimensional poverty incidence among children was unambiguously higher (non-overlapping 95%-level confidence intervals) than among adults and in no country were adults significantly more frequently at home in multidimensionally poor households than children [80]. Findings of age disaggregation thus clearly support the prioritisation of children’s deprivations when these are being considered as part of all-population MPIs, reinforcing the advantage of integrated measurement that does allow for such straightforward juxtapositions by disaggregation.
Table 3.
Age-disaggregated national MPIs and results.
Below are tables and figures from some of these country reports, showing how children are, generally, poorer than adults and how it is often the youngest children, who bear the greatest burden.
- Afghanistan
For the case of Afghanistan, results show that poverty levels for children were higher than for adults (Table 4) (these results do indeed hold for each indicator of poverty included in the Afghanistan-MPI [81]). They also show that the poorest age cohort, children 0–17, is at the same time the largest age cohort—with children making up more than half (54.3%) of the country’s population. This adds further policy priority to alleviating child poverty. Furthermore, Figure 4 visualises that that it was indeed the youngest (children 0–9) among whom both multidimensional poverty intensity and incidence was highest, followed by children aged 10–17.
Table 4.
MPI, H, and A by age group in Afghanistan’s national MPI 2016/2017.
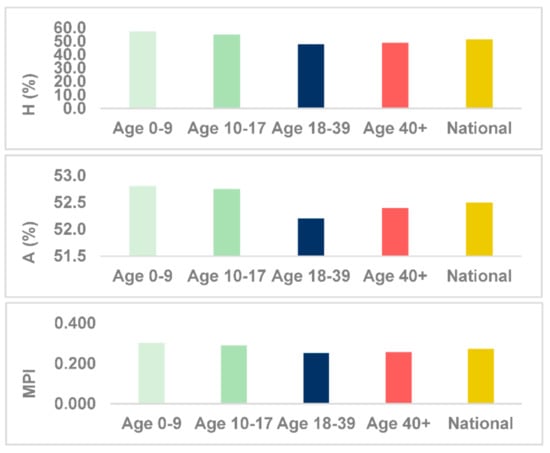
Figure 4.
MPI, H, and A by age group in Afghanistan 2016/2017. Source: NSIA [82].
- Nepal
A similar case is evident for Nepal, where, as Figure 5 shows, MPI is clearly highest among the youngest age cohort (0–9). As in the case of Afghanistan above, attention to population shares reveals that children (0–17) make up four out of ten people in Nepal, whilst only one in ten people are older than 57. For policy prioritisations, this adds valuable information on how much a subgroup’s poverty levels impact overall poverty and which subgroup, beyond MPI levels, comprises more poor people and might accordingly be in focus for policy interventions.
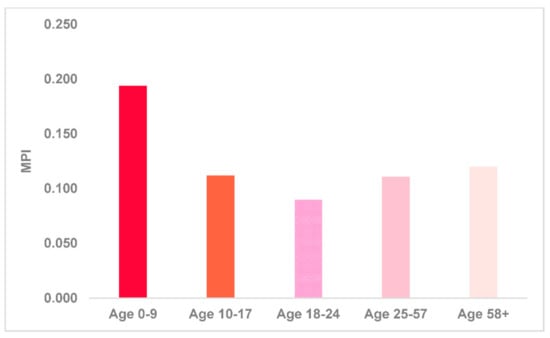
Figure 5.
Multidimensional poverty by age group in Nepal 2014. Source: National Planning Commission and OPHI [81]: 17. Children up to 10 years of age represent 21% of the population, while the population share of the age groups 10–17, 18–24, 25–57, and 57+ are equal to 19%, 12%, 37%, and 10%, respectively.
5.5. Advantages and Disadvantages
5.5.1. Advantages
- The national MPI itself draws attention to child deprivations; child disaggregation then focuses on children.
National MPIs do commonly include and draw attention to child deprivations. Age-disaggregating national MPIs takes advantage first of the fact that all-population national MPIs are already child-inclusive, because they always and prominently include child-inclusive and child-specific indicators. What is more, age disaggregations then, secondly, allow analytical focus specifically on the deprivations that children are most frequently affected by in their households.
- Child disaggregation often profiles the empirical fact that children are poorer than adults by the national MPI. It also provides the number of children who are MPI-poor, and where they are.
It also allows the juxtaposition of poverty incidence, intensity, and composition for children versus adults and by age-cohort. Disaggregation thus facilitates the identification and analysis of inequalities that may exist and persist between age cohorts, for example by uncovering the unequally larger burden of poverty that is being experienced by the youngest—which is the finding that age disaggregations usually yield (see Table 3 above). Furthermore, by considering the population shares and absolute numbers of age-disaggregated subgroups, it can make visible how many poor children there are vis-à-vis poor adults.
- Interpretation, policy implications, and communication are straightforward.
Disaggregating an MPI by subgroups, such as age cohorts and, e.g., by adults versus children has, again, the strong advantage—compared to separate child poverty measures—that there is just one measure. When the same measure is used to compare multidimensional poverty, it is straightforward to show and problematise that children are poorer than adults. This is not straightforwardly possible if different measures are used for child and adult poverty, because different measures do not allow for direct comparisons of poverty incidence and intensity, as they do not measure the same thing.
5.5.2. Disadvantages
- A child could be identified as poor although they and their household are not affected by deprivations measured directly at the level of the individual child.
Since the unit of identification is the household, all children living in households that exceed the multidimensional poverty cut-off will be considered multidimensionally poor, also in age disaggregations. However, it is possible that the household is not deprived in any of the included child indicators, but exceeds the multidimensional poverty cut-offs solely based on all-household or adult-specific indicators, some of which may have little relevance for children. However, though conceptually counterintuitive, this may be both rare and often unproblematic when occurring, because deprivation profiles then still include many deprivations that are equally relevant for adults and children.
- Child disaggregation does not show whether a child living in a poor household is individually deprived in certain child indicators.
Moreover, even if child indicators are triggered, what is being measured is whether a child lives in an MPI-poor household, and not whether or not a child is individually, multidimensionally poor and deprived—i.e., deprivation and multidimensional poverty identification function are usually specified with the household as unit of identification. For example, national MPIs frequently consider as deprived all members of a household in which at least one member is individually malnourished. A household may thus be considered nutritionally deprived because one child is malnourished. However, it may be the case that this very child lives in a household together with seven other children, all of whom are well nourished. They will still be considered poor and deprived by household-level MPI definition, even though an individual-level deprivation profile may render them neither nutritionally deprived nor multidimensionally poor
- Sensitivity to demographic structure and household size and composition.
Furthermore, household size and composition, as well as broader demographic makeup, might have an effect on the results of household-level multidimensional poverty measures and disaggregated results, and so might the available and utilised indicators integrated for all-population measurement. Since some indicators are child-specific, households that are home to a larger number of children eligible for such indicators may be more likely to be deprived. Results of age disaggregations are thus best compared against demographic profiles and household sizes and composition across subregions and groups. Table 5 summarises these advantages and disadvantages.
Table 5.
Advantages and disadvantages of age disaggregation.
6. Gendered and Intra-Household Analyses of Child Indicators
6.1. Method
An additional step towards more nuanced measurement is to analyse inequalities across child indicators in order to consider deprivations across children living in the same household or along gendered lines, e.g., among which age-group school absenteeism is most prevalent? Are girls more frequently out-of-school or malnourished than boys? Such analyses can be performed both within and across households.
This step of analysis first selects individual child indicators in national MPIs and then considers the individual deprivation status of children alongside the household MPI. This allows for the identification of (groups of) children who are disproportionately frequently poor and individually deprived.
The following example from South Asia exemplifies in more detail what kind of results a more detailed analysis of child indicators, including their intra- and inter-household distribution in terms of deprivation and non-deprivation, can yield and how it can be useful for policy.
6.2. Data
So long as individual deprivation indicators are available for all children in a household (for example, without subsampling issues), there are, in principle, no ‘additional’ data requirements, on top of the ones discussed in Section 4 and Section 5, to uncover patterns of individual child deprivations. As with disaggregation taking into consideration, the aim and requirements of gendered and age-wise intra- and inter-household analyses of child indicators for the process of data preparation and data management of any MPI can facilitate a streamlined and integrated process of such analyses. They can then immediately add insights to the MPI information platform (Box 1). In addition, in order for this additional analysis of child indicators to provide meaningful statistics, it is important to ensure that results for any disaggregation performed—i.e., by gender and age sub-cohort—are representative at the respective subgroups’ level.
6.3. Child-Relevant Statistics
Since this computational and analytical step focuses on individual child indicators, the child-relevant statistics here are, immediately, results for these child specific indicators by age and/or gender. These can be complemented with multidimensional poverty status and analysed to uncover within and across household inequalities. Child-relevant statistics that the exercise yields include:
- (1)
- Poverty status: what proportion of deprived children are poor according to the MPI (MPI poor);
- (2)
- Gender: what proportion of deprived (and poor) children are girls, boys, or other categories; and
- (3)
- Intra-household inequality: what proportion of deprived (and poor) children live in households where other eligible children are present but are not deprived in that same indicator.
- (4)
- Complex categories: what households contain one group of individuals (e.g., adults) who are deprived in an indicator, and another group (e.g., children) who are not?
- (5)
- Composition: the composition of MPI by indicator experienced by children who themselves are deprived in a particular indicator (and poor), compared with children who are not deprived.
- (6)
- Integrated analysis: what proportion of people live in households where children who are eligible for different individual indicators are concurrently deprived [83].
6.4. Country Example(s)
South Asia
Table 7ߝ9 below summarise the results of such an analysis of gendered and age-wise patterns across child poverty indicators in the global MPI for seven countries in South Asia, conducted by Alkire, ul Haq, and Alim [84]. These seven countries are Afghanistan, Bangladesh, Bhutan, India, Maldives, Nepal, and Pakistan. This study is here also cited in its extension by Alkire and ul Haq [83]. These tables and figures present the results of an exercise that focused in particular on the indicators school attendance and nutrition in the global MPI.
Table 6, for example, presents the results of a gendered analysis of child indicators across South Asia. It reveals that, on average, MPI-poor girls are more frequently out of school and malnourished than boys. However, it also shows that patterns differ across countries. In Afghanistan and Pakistan, more girls than boys are out of school (44.0% girls vs. 24.8% boys in Afghanistan and 27.2% vs. 19.7% in Pakistan). In Bangladesh, the opposite is the case: fewer girls than boys (7.2% vs. 12.1%) are multidimensionally poor and out-of-school, whereas in Bhutan, India, and the Maldives, these figures are about the same for girls and boys. Gender differences in nutrition are not statistically significant—a positive sign. Such results can be immensely helpful to determine whether gendered inequalities exist and persist, and who might require special policy attention.
Table 6.
Children who are MPI poor and deprived in school attendance and nutrition in South Asia, by gender (%).
Table 7 summarises the results for the prevalence of intra-household inequalities for both school attendance and nutrition, by country. The bottom-half summarises the extent of intra-household inequalities in school attendance—that is, the proportion of school-aged children who live in a household where at least one school-aged child is attending school whilst another school-aged child is not, and associated statistics. School attendance is here measured in terms of whether or not school-aged children attend school up to the age where they would be expected to have completed 8th grade. The global MPI defines out-of-school children using the country-specific ages for starting school: a child is deprived in school attendance if they are not attending school, starting from the age at which they should start school according to local conventions, until the age at which they should complete class 8. In Bangladesh, Bhutan, India, Maldives, and Nepal, children are to begin school at six years of age, whereas in Pakistan it is five years of age, and seven years of age in Afghanistan. Evidently, across the region, one in nine (11.2%) school-aged children are affected by poverty and such intra-household inequalities, with prevalence ratios ranging of less than 1 in 100 children (0.3%) in Maldives to more than one in three children (34.3%) in Afghanistan. For nutrition, the prevalence of intra-household inequalities is even higher. About one in seven (14.1%) children under the age of five in South Asia are MPI-poor and live in a household where at least one child in this age cohort is undernourished, whilst at least one is not.
Table 7.
Percent of children experiencing intra-household (in)equality and multidimensional poverty in South Asia.
These results, at least partially, are a function of data quality, household size, and demographic profiles. Since they rely on multiple disaggregation, issues of sample design and representativeness must also be carefully considered and transparently documented. When done well, such analyses offer more nuanced policy-insights as to the extent and patterns of child deprivations than a household-level measurement. In the above case of nutrition and school attendance, intra-household inequalities point to some overestimation of child deprivations, because the deprivations are generalised across non-deprived individuals. This is so because the deprivation threshold here is what has been called a restrictive threshold. A household is only then non-deprived if no household member is deprived. In other cases, such as school attendance (see also below), it is an achievement that is being generalised across all household members. That is, the requirement is that only one member of the household needs to be non-deprived for all household members not to be deprived either. This may underestimate individual poverty to a certain extent, as it, too, will hide the extent of intra-household inequality that may exist in terms of educational attainment. This is so because the deprivation threshold here is what has been called an expansive threshold. If only one member of the household is non-deprived, then this achievement is considered as expanding across all household members. On intra-household inequalities and expansive and restrictive thresholds in MPIs (see Klasen and Lahoti [60] and Espinoza-Delgado and Klasen [61]).
The method used here also allows for the creation of somewhat more complex indicators that combine deprivation information on different groups. One example are so-called ‘pioneer children’, defined as children between 10 and 17 years of age who have completed six years of education but live in a household in which none of the adult members of their households (people above 17 years of age) have completed six years of schooling. Thus, the only ‘educated person(s)’ in that household (according to the years of schooling indicator considered in this example) is a child. Table 8 shows that there are 37.5 million such pioneer children in South Asia. They live with 135 million adults and children 10–17 who have not enjoyed six years of schooling. Again, results show that patterns vary by country: one in 20 are pioneer children in Pakistan, whereas in Bangladesh and India one in seven and in Nepal one in five are. An additional, gendered analysis reveals that more than half of all pioneer children are girls. In Afghanistan and Pakistan, the relative frequency of pioneer girls is lower than that of pioneer boys, but in Nepal, Bangladesh, and India, a higher percentage and number of girls are pioneer children than boys, which promises to bring intergenerational changes of other kinds as well (see, in addition to studies cited in Section 4.1, [85,86,87]). Of the 37.5 million pioneer children in South Asia 10.5 million (28.4%) are MPI poor, so despite their educational achievements their household is still affected by a critical, weighted deprivation count. At the same time, the existence of a pioneer child in the household does not mean that all children in that household are in school or have had six years of schooling. For instance, 31.5% of pioneer children in Afghanistan live with at least one other child aged 10–17 who has not completed six years of schooling and is out of school, in Pakistan this figure is 34.2%. In Bhutan, India, Maldives, and Nepal this figure is lower than 10%.
Table 8.
Pioneer children in South Asia. Their MPI poor status, gender, and the intra-household inequality.
As these results show, using a multidimensional and intra-household lens on individual child indicators yields additionally policy-relevant information based on the very microdata underlying an all-population MPI, including who is at risk of being left behind.
How any of these four strategies are best implemented will vary with context and purpose of measurement, but common experiences and successful strategies may emerge, particularly where the motivation is the one underlying this study: synergetic rather than disjoint measurement approaches of (child) multidimensional poverty, allowing governments to identify and prioritise the worst-off across all age cohorts, to reduce poverty in all its dimensions, and according to national definitions, in line with SDG 1.2.2.
6.5. Advantages and Disadvantages
6.5.1. Advantages
- Is linked to the national MPI directly, yet brings additional aspects of child poverty into view.
A clear advantage of this method, i.e., analytical focus on intra- and inter-household distributions of deprivations, is that it can be performed directly on any national MPI that contains appropriate individual-level indicators. Rather than requiring a separate measure, it is directly linked to, and focuses on subsequent analyses of, an existing measure.
- Shows whether all eligible children in a household are deprived or only some of them.
In particular, it can identify whether or not all eligible children are deprived in a certain indicator, or if some are and others are not.
- Allows for the analysis of gendered patterns of deprivation.
Furthermore, this approach lends itself for gendered analyses of child indicators, both within and across households. For nutritional indicators, for example, the analysis can uncover whether or not girls are disproportionately frequently malnourished, compared to boys, and whether there exist gendered inequalities between girls and boys within the same households.
- Allows for the analysis of age-wise patterns of deprivation.
Because focus on child-specific indicators will also consider who exactly triggered a deprivation in their household, if the underlying sample design permits, the analysis may consider the age of deprived children to uncover age-wise patterns of deprivation.
- Shows what percentage of children who are deprived in an indicator live in MPI poor households.
Separate analysis of child indicators also facilitates an analysis of child deprivations by poverty status. This shows what proportion of children are affected not only by the single indicator under consideration, but in a greater share of other indicators, too.
- Shows the composition and intensity of MPI among children deprived in that indicator.
Individual indicator analyses differ from dashboards that look at child deprivations one by one. In addition to poverty status, this method also allows for a joint analysis of composition and average intensity of MPI for all children who are poor and deprived in a particular child indicator.
6.5.2. Disadvantages
- Individual child indicators can often only be examined one by one. Joint deprivations commonly require analysis based on household-level deprivations.
Analysis of child indicators is an exercise usually focused on indicators one by one, whilst the joint distribution of indicators is most commonly considered at the household level. This is partly due to age factors, as the coincidence of individual-level deprivations only applies where several individual-level indicators apply to the same (or overlapping) age cohorts.
In addition, since this method always directly relies on the former, general limitations and disadvantages from there do (at least partially) carry over. Table 9 summarises these advantages and disadvantages.
Table 9.
Advantages and disadvantages of gendered and age-wise disaggregation and analyses.
7. Individual Child MPI Linked to Household-Level All-Population MPI
7.1. Method
The final approach links an individual-level child MPI to an all-population household-level MPI by adding one or more child-specific dimensions. It augments the age disaggregation of an overall population measure with additional child-specific indicators that provide a more nuanced measurement and analyses of children’s deprivations [48]. This has been referred to as the ‘drawer’ approach, because, in addition to the national MPI data at the individual level, the additional indicators and dimension(s) are similar to additional ‘drawer(s)’ that can be pulled out for a more detailed analysis of children’s conditions. As already mentioned in Section 3, all existing national MPIs already include a number of child-specific and child-inclusive indicators to begin with. Thus, the drawer approach does not ‘add’ child-relevant information where there was previously none. Rather, it adds another set of child-specific indicators to enable a more nuanced identification of multidimensional poor children at the individual level, without neglecting the information gained through child indicators and all-household deprivations included in an all-population MPI.
Unit of identification in this method is the individual child. The drawer approach is a coherent measurement framework because it includes all existing indicators from the original MPI, which captures all children living in multidimensionally poor households, and augments this with new indicator(s) or ‘drawer(s)’ of individual, child-specific deprivations.
In order to ensure consistency and avoid confusion, this approach thus fully retains the original MPI identification function. In other words, all children who are poor according to the national MPI are poor according to this linked child MPI. Consistency is achieved by re-adjusting dimensional and deprivational weights and the multidimensional poverty cut-off so that the additional child indicators may increase the incidence or intensity of poverty, but cannot decrease it [88,89].
7.2. Data
The data requirements for a linked child MPI, as for any individual-level measure, are fairly high. In order to measure child multidimensional poverty including at least one child-specific dimension with age-appropriate child deprivations, the indicators in the survey must cover the entire cycle of childhood—that is, from birth until the 18th birthday. However, most child-specific indicators cover only certain age ranges. In order to make a linked child MPI relevant for all children (or as many as possible) it is thus necessary to define various age-specific indicators. The examples from Punjab, Pakistan and Nepal, below, show what this may look like in practice.
7.3. Child-Relevant Statistics
The linked child MPI provides the same kind of headline statistics and associated information as a household-level MPI, but for each individual child: incidence and intensity of multidimensional poverty across children 0–17, as well as their product, the MPI. Similarly, the results can be broken down into censored and uncensored headcount ratios, and can be disaggregated and analysed by dimensional breakdown, just as the all-population MPI itself (as discussed above). The drawer approach results do also allow straightforward comparisons between the headcount ratio of the ‘original’ all-population MPI, its age disaggregation, and the new, linked child MPI along results of further analyses.
7.4. Country Example(s)
Table 10 and Table 11 exemplify the structural move from all-population MPI to linked ‘drawer’ child MPI for Punjab province in Pakistan and for Nepal. In both cases, the original MPI had a three-dimensional structure with a multidimensional poverty cut-off k = 1/3. That means a household and all of its members are considered as multidimensionally poor if their deprivation score equals 1/3 or more of the weighted MPI indicators. In both cases, a fourth dimension was introduced that contained a set of indicators. As children’s deprivations change across the lifecycle of childhood, the new dimension indicators are age-specific but cover all children aged 0–17.
Table 10.
Dimensions, indicators, and weights of national and child MPI for Nepal.
Table 11.
Structure of the Punjab child MPI for Punjab, Pakistan—dimensions, indicators, deprivation cut-offs, and weights.
To consistently retain the original identification function, two steps are necessary. First, the original indicators within their dimensions have to be re-weighted or scaled proportionately, so that their relative importance is retained whilst another (here one, equally weighted) dimension with a set of child-specific indicators is introduced. Thus, if there are four dimensions instead of three, each weighs ¼ instead of 1/3. Secondly, the poverty cut-off is re-scaled equivalently to k = ¼. These steps guarantee that those children who live in multidimensionally poor households according to the original MPI will still be identified as multidimensionally poor in the extended child MPI. Some of them will ’still’ be poor but considered additionally deprived, because they also experience one or more of the child-specific deprivations that have been added to the measure. Others will newly be identified as poor. Their households are non-poor, but their deprivation score (now) exceeds the multidimensional poverty cut-off, because they are deprived in at least one of the child-specific indicators. It also affects poverty intensity (A). However, since A is mechanically affected not only by additionally captured deprivations, but also by the simple presence of additional indicators and the associated re-weighting, A and MPI cannot be straightforwardly compared across child MPI and age-disaggregated overall MPI. More on this below.
7.4.1. Nepal
Vaz and Alkire [89] was the first study to employ a ‘drawer approach’ to measure multidimensional child poverty. Their study augmented the age-disaggregated national MPI of Nepal with a child-specific dimension and identified children individually deprived in these indicators as well as those living in multidimensionally poor households. As Table 10 shows, three age cohorts (0–4; 5–13; 14–17) were defined and age-specific indicators selected to measure age-appropriate deprivations covering the cycle of childhood.
7.4.2. Punjab
In Punjab, as Table 11 shows, the age disaggregation of a ‘proxy Pakistan-national MPI’. was augmented by an additional, child-specific dimensions. Here, the construction of the child-specific indicators did not follow the identification of three separate age-cohorts, as it did in Nepal. Instead, due to data constraints, it first defined childhood conditions and then included the best possible (available) sub-indicator for each child-age-cohort to measure individual-level deprivations across the cycle of childhood. This proxy-MPI was constructed to mimic as closely as possible the original MPI for Pakistan, using a different dataset for Punjab (MICS data), which did not include all indicators comprising the Pakistan national MPI (PSLM data). Results should thus not be directly compared to Punjab regional results and age disaggregations of Pakistan’s official national MPI. See also OPHI [90] and Planning Commission of Pakistan [91].
The cases from Nepal and Punjab provide two examples of structuring the additional child-specific dimensions by which an individual child MPI augments the age disaggregation of a household-level, all-population MPI.
As Table 12 shows, the results of such a linked child MPI, too, can be disaggregated to make visible disproportionately affected population subgroups. In this case (Punjab), there were overall no clear gendered patterns, with boys being slightly more frequently poor than girls and girls being, on average, slightly more intensely poor than boys.
Table 12.
Child MPI by gender in Punjab, Pakistan.
7.5. Advantages and Disadvantages
7.5.1. Advantages
- The child MPI that captures individual children’s deprivations directly links to the national MPI.
A linked child MPI captures additional child-specific and age-appropriate deprivations without the need of an entirely separate measure. By adding one or more additional ‘drawer(s)’ (additional dimensions) to a familiar official measure, the child MPI is inherently linked to, rather than separate from the official MPI and its age disaggregation.
- All children who are identified as poor by the household-level MPI are poor by the child MPI. In addition, the child MPI identifies poor children in non-poor households.
Moreover, a linked child MPI identifies identify all children living in multidimensionally poor households as poor, so is consistent with overall MPI. However, it makes visible the unequally heavier burden experienced by some of them—due to individual age-specific deprivations. It thus refines the diagnostic accuracy of child multidimensional poverty for children already living in multidimensionally poor households, and identifies as poor an additional set of children whose poverty was not apparent using the original household-level identification function. But see the caveats on A and MPI comparisons when looking at age disaggregation vs. drawer–child MPI.
- Population-level policy implications can be derived from the national MPI, but additional information is offered for child policies.
Since the original household-level identification is retained in its entirety and because the child MPI is linked to, but not separate from, the household-level MPI, population-level policy implications can be straightforwardly derived from the all-population measure. The additional information that the child MPI offers is useful on top of that and can inform child-specific policies without contradicting (on the contrary: refining) the poverty identification function and policy implications of the original and linked all-population measure.
- It allows for the inclusion of child-specific indicators covering the cycle of childhood.
At the same time, a core requirement of MPIs with the individual child as a unit of identification, this is also a key advantage of a linked child MPI. Child-specific indicators covering the entire cycle of childhood can capture deprivations that are relevant for the measurement of child multidimensional poverty, but may have been excluded from a household-level MPI, because they apply to a narrow age-range (see also Section 3).
- It is easy to compute, interpret, and use alongside the national MPI.
By directly linking an overall MPI and a child-specific multidimensional poverty measure, this approach also avoids the heavy computational burden of an entirely separate measure. It also avoids the paradoxical policy and communication effects of having two separate MPIs: a household-level MPI for the overall population (importantly, including children and including child-specific indicators) and an entirely separate measure, possibly with an entirely different measurement structure (dimensions, indicators, weights, cut-offs) of child poverty. Because two such measures cannot be directly compared or integrated, they may confuse and hence decrease rather than increase policy use. A key advantage of this approach thus is that it avoids the problems that might be associated with having two entirely dissociated or confusingly overlapping measures of multidimensional poverty.
7.5.2. Disadvantages
- There are strong data requirements in order to cover the entire cycle of childhood.
In order to cover all children, an individual-level child MPI requires indicators that cover the entire cycle of childhood (0–17), which few surveys include. As the examples from Nepal and Punjab show, there are different approaches to ensuring that this requirement is satisfied, but it may be the case that covering all age-cohorts comes at the price of excluding some of the most age-appropriate deprivations for one or more child-sub-cohorts. However, surveys may need to be modified in order to include rigorous indicators for each stage of childhood.
- Child deprivation sub-indicators do not allow for straightforward comparisons across age-cohorts.
Because child MPIs may use age-appropriate indicators that cover the cycle of childhood (and possibly to a certain extent due to data limitations) comparisons across child age-cohorts are not straightforward. This is a key constraint for any individual-level measure that relies on qualitatively distinct indicators for mutually exclusive and collectively exhaustive population subgroups, such as age-cohorts. Thus, it is a problem that arises by no means specifically when using a linked child MPI, but with any such individual-level measure of multidimensional poverty (or well-being, etc.). Ideally, age-appropriate indicators would refer to deprivations that are strictly comparable across stages of childhood. Although the indicators are mutually exclusive and equally weighted for each age cohort as they feed into individual deprivation profiles, they may refer to qualitatively different deprivations for each child age-cohort.
- Disaggregation may be more difficult if sample sizes are small.
Given the sample size limitations, it may not be possible to disaggregate child age cohorts further by urban-rural area, subnational region, household size, or social groups.
- The structure of the national MPI limits parametric options for the Child MPI.
The simplicity and intuitiveness of the drawer approach relies on the fact that it adds one or more dimensions to an already existing measure and then changes indicator and dimensional weights and poverty cut-off to retain its identification. However, this also means that the parametric choices for the child MPI is somewhat limited by the given structure of the national MPI. For example, if the national MPI has three dimensions with equal weights, the most straightforward application of a linked child MPI with one additional dimension would pre-determine its weight at 1/4 (or 1/5 if there were two dimensions). If an all-population MPI has four equally weighted dimensions, a single additional child dimension would then receive a weight of 1/5, or two of 1/6 each, etc. Table 13 summarises these advantages and disadvantages.
Table 13.
Advantages and disadvantages of linked child MPIs.
8. Joint Analysis of Household MPIs, Age Disaggregation, and Linked Child MPIs
What are the differences, empirically, between a household-level national MPI, its age disaggregation, and an individual child-focused measure of multidimensional poverty following the drawer approach? How can all be used—together or separately—to generate coherent high-impact policies?
The following tables and figures from Nepal and Punjab province in Pakistan present the results of a comparative analysis between the national MPI and the linked Child MPI, and—for Punjab—its age disaggregation for children 0–17 years old.
8.1. Nepal
In Nepal, as Table 14 (and Table 10 above) shows, the child MPI adds two deprivations to the poverty identification function. Thus, there are two additional uncensored headcount ratios—child development and childhood conditions. All other headcount ratios remain unchanged when moving from the national MPI to a linked child MPI using the drawer approach. The uncensored headcount ratios summarise the proportion of people who are deprived in one of these indicators, relative to the age-specific indicator specifications and deprivation cut-offs outlined above (Table 10). To reiterate, the difference between ‘censored’ and ‘uncensored’ headcount ratios per indicator is that ‘censored’ headcount ratios consider only those who are multidimensionally poor and deprived in a particular indicator. That is, the censored headcount ratio ‘censors’ the deprivations of all those non-poor, i.e., those whose weighted deprivation score does not exceed the multidimensional poverty cut-off. As the right-hand columns of Table 14 show, the Nepal child MPI yields higher censored deprivation scores across all MPI indicators, albeit higher to varying degree. The additional percentage points refer to children who have been additionally identified as poor and deprived in each of these indicators in the move from the national MPI to the linked child MPI, because they are also identified as deprived in one or more of the ‘new’ child- and age-specific indicators. A clear policy advantage of this approach is thus that it allows focus on poor children in non-poor households and on poor(er) children also deprived in individual child indicators.
Table 14.
Censored and uncensored headcount ratios, national MPI, and child MPI, Nepal.
As can be seen in Table 15, the child MPI thereby added an identification gain of 7.2% to the incidence of multidimensional poverty in Nepal, compared to the household-level national MPI.
Table 15.
Child deprivations prevalence by child poverty status in Nepal.
Accordingly, as Table 16 shows, the headcount ratio of multidimensional poverty among children is higher when measured with the child MPI, compared to Nepal’s national MPI. The intensity of multidimensional poverty (A), on the other hand is higher among children in multidimensionally poor households. This may seem counterintuitive, but it can be a logical, mechanical result of the way the child MPI refines the identification function of the original MPI. It proportionately rescales and reweights the weights of all indicators vis-à-vis one another. If a child in Nepal lives in a household that was poor and deprived in exactly two-thirds (2/3) of the weighted deprivations, as per national MPI, for example, but does not experience any of the additional child-specific deprivations, the summed counting vector of weighted deprivations for this child will no longer be at 66%, but at 50%, since what was 2/3 in the original MPI is now 2/4 in the augmented drawer–child MPI. In order to make A and MPI somewhat reverse-comparable—in addition to H, which is directly comparable in any case—one can also rescale the multidimensional poverty intensity of the linked child MPI by exactly the factor of proportionate re-scaling that was applied in the move from the original to child MPI, e.g., by 4/3 in the case of Nepal. See Vaz and Alkire [89] for an exemplification.
Table 16.
Identifying children via MPI and child MPI in Nepal.
8.2. Punjab
In the case of Punjab, as Figure 6 shows, the rank correlations across districts by H do not drastically depend on the choice of the measure. Note, again, that the national MPI and its age disaggregation are here approximated through a proxy-MPI based on MICS rather than PSLM data used for the official MPI of Pakistan. Though specifics will depend on the case in question, these results may here confirm that the child MPI does indeed not create an entirely separate and distinct measure, but simply a refined child-focused identification function. However, Figure 6 also shows that there are clear differences in the absolute poverty levels measured for each of the Punjabi districts and for the province as a whole, depending on the measure applied. Indeed, the figure clearly visualises how the additional drawer that adds to the identification function yields a consistently higher multidimensional poverty headcount ratio (H) in all districts, with non-overlapping 95% confidence intervals in all but six districts. This is a perfectly expectable result, because, as discussed above, a linked child MPI retains the original national identification function by 100% and adds those children who are individually multidimensionally poor, but household-level non-poor, to those counted as poor.
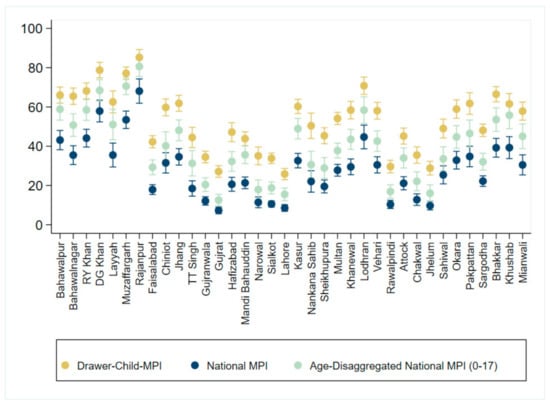
Figure 6.
H, age-disaggregated H and drawer-H with 95% confidence intervals, Punjab 2017/2018. Source: Own elaborations based on OPHI [90] (with thanks to Hector Moreno).
Secondly, confirming results of age disaggregations from other countries (Section 5), the Figure shows that age-disaggregated poverty levels are higher than all-population poverty levels in all districts of the Punjab province—with, again, non-overlapping 95% confidence intervals in all but seven districts. Thus, again, age disaggregation makes visible the unequally larger burden of poverty carried by children.
The high rank correlation between the measures is a finding that provides food for future research, such as tests of outcomes for different indicator and parameter specifications of linked child MPIs. If, in general, child MPIs and age-disaggregated MPI rankings (and values for H—or rescaled values for A and MPI) should be similar across countries and time periods, then it would be possible, for example, to consider the most efficient data collection mechanisms, to have frequent MPI data that are age-disaggregated, and occasional in-depth child MPI data, for which indicator definitions are considerably more precise.
9. Concluding Remarks
To support efficient and clear policy responses to end (child) poverty in all its forms and dimensions, this paper summarised, juxtaposed, and comparatively analysed four methods through which governments can—and already are—using multidimensional poverty indices (MPIs) of the Alkire–Foster class of measures to profile, analyse, and alleviate, children’s deprivations. The paper contributed a first examination and discussion of synergetic measurement strategies going beyond a generation of disjoint multidimensional poverty measures that are difficult to interpret and act upon alongside one another. More specifically, the paper profiled a suite of analyses that build off a household-level all-population MPI, as an official permanent poverty statistic, and add nuance and detail to our understanding of the ways that children’s lives are detrimentally affected by overlapping deprivations.
The four are, each with their own advantages and disadvantages:
- Integrating child indicators into national MPIs;
- Age-disaggregating national MPIs to analyse levels and trends of child poverty;
- Analysing individual child indicators within the national MPI to illuminate gendered and age-wise intra- and across-household inequalities, and to study the cross-dimensional deprivation profiles of children who experience specific deprivations; and
- Constructing an individual child MPI that is directly linked to a household-level national MPI, but adds to the age disaggregation of that MPI individual child dimensions with age-appropriate indicators.
To summarise:
- Strategy 1 ensures that child indicators feature prominently in national MPIs and that population-level measurement outcomes rely on children’s deprivations or achievements. The number of indicators that can be considered is, however, limited and the identification of poverty and deprivation remains at the household-level.
- Strategy 2 moves on from strategy 1, to directly juxtapose the deprivation and multidimensional poverty burden experienced by various age groups (including adults versus children) in their households. This allows direct comparisons and the identification of worse-off population subgroups, even if remaining at the level of children or adults in poor and/or deprived households.
- Strategy 3 allows for measurement and analyses at the level of individual children, including within and across household inequalities in deprivation and achievements, as well as age-wise and gendered patterns. This step involves additional computational burden and commonly relies on multiple disaggregation that put strong demands on the underlying sample, in terms of sample and representativeness, to be able to derive meaningful results.
- Strategy 4 takes up the motivation and intuition of measuring (overlapping) deprivations and multidimensional poverty at the level of the individual child by using age-appropriate deprivational indicators covering the entire cycle of childhood. It operationalises this intuition by adding child-specific indicators and dimension(s) to the child age disaggregation of a national MPI.
As with all individual-level multidimensional measures, data demands are high and may often not be able to be sufficiently met to guarantee an appropriate measure. Aggregation across, and interpersonal comparisons between, age groups for whom different indicators and, hence, technically speaking, measurement structures apply must be done carefully, taking into consideration the comparability and degree of equivalence of the indicators included. Country results profiled above do, first and foremost, indicate that these approaches are complementary to one another. Indeed, data permitting, the first three methodologies progressively illuminate children’s deprivations, based on a population-level measure of multidimensional poverty. Then, provided statistical capacity, data, and contextual measurement and policy requirements and priorities, an individual-level child MPI can be constructed. The child MPI augments the age-disaggregation of the national MPI with at least one child-specific dimension comprising age-appropriate indicators covering the cycle of childhood. This child MPI is not entirely separated from, but directly extends the set of children identified as poor by a household-level official statistic to children who face additional deprivations and who can thus be newly identified as poor—or as poorer. In this way, the first three methods, and possibly the fourth, facilitate a gradually more nuanced and policy-salient measurement of multidimensional child poverty.
Two key limitations are worth mentioning.
First: the specific focus of this paper are poverty measures as permanent official statistics or policy tools, e.g., as used to identify and target those worst-off and also reported against SDG Indicator 1.2.2. To be clear, there are many purposes for which there are good reasons to construct child-specific multidimensional poverty measures in order to achieve more contextual focus and accurate measurement. Population-level poverty measurement as an official statistic and policy-tool is not one of them. To identify those who are worst-off, analysts and policy-makers need to be able to make interpersonal comparisons. These require a common yardstick, that is an equivalent measurement structure or poverty identification function, against which people of all ages (and other population subgroups)—or the lives they are leading—can be evaluated and compared. Creating separate child-poverty measures for this purpose obscures clean comparisons of the worst-off, especially as national MPIs already include children, and so do separate measures for all mutually exclusive and collectively exhaustive population subgroups. For other purposes, including child-focused policies and more nuanced analyses, measures of child multidimensional poverty can nevertheless be insightful—including a linked child MPI. However, a common criticism that gave rise to much of the proliferation of poverty measures in the first place was their inability to deliver accurate and policy-salient measures of children’s deprivations. Following strategies 1–3, as described above, and possibly IV, may obviate much of that criticism.
Second: the above-specified illustrations, discussions of (dis)advantages are based on a review of existing applications and research papers—including, but not limited to, the country cases profiled. This paper was able to summarise some of the key descriptive and prescriptive child-relevant statistics based on this existing body of materials. But it was by no means able to do justice to all applications that MPIs, their age disaggregation, and further child-relevant analyses have found all around the world. The number of countries using MPIs as official statistics and policy-tools is growing every year, and so are the ways in which they are being used for the alleviation of child multidimensional poverty. Thus, whilst this paper contributes a first examination of four synergetic measurement strategies, actual uses and policy applications all around the world may well add additional insights, nuance, and case studies to the herein mentioned.
How any of these four strategies are best implemented will vary with context and purpose of measurement, but common experiences and successful strategies may emerge, particularly where the motivation is the one underlying this study: synergetic rather than disjoint measurement approaches of (child) multidimensional poverty, allowing governments to identify and prioritise the worst-off across all age cohorts, to reduce poverty in all its dimensions, and according to national definitions, in line with SDG 1.2.2.
Author Contributions
Conceptualization, S.A. and J.D.; writing—original draft preparation, J.D.; writing—review and editing, S.A. and J.D.; visualization, J.D. All authors have read and agreed to the published version of the manuscript.
Funding
This research was funded by the United Nations Children’s Fund (UNICEF) Office in China.
Institutional Review Board Statement
Not applicable.
Informed Consent Statement
Not applicable.
Data Availability Statement
Not applicable.
Acknowledgments
We are very grateful to Christina Popivanova, Weilin Shi, Tingting Chen, Shahin Yaqub, and Mengming Yu from UNICEF China, who envisioned this paper and whose intellectual input greatly improved its structure and content, and to Shi Li and Yangyang Shen for their expertise on issues of data and measurement. We are also grateful to our colleagues who co-developed and/or implemented the four strategies that are summarised or referenced here—particularly Ana Vaz, Jose Manuel Roche, Usha Kanagaratnam, Nicolai Suppa, Monica Pinilla-Roncancio, Corinne Mitchell, Rizwan Ul Haq, Abdul Alim, Martin Evans, Christian Oldiges, Adriana Conconi, Gisela Robles Aguilar, and Hector Moreno. We thank ESRC-FCDO, FCDO, SIDA, UNICEF, and UNDP colleagues for the support of much of the work referenced here, as well as colleagues in governments around the world, whose experiences guide or improve our own, especially Alejandra Candia, Gonzalo Hernandez Licona, and Michelle Muschett for their passionate and perceptive policy guidance. We gratefully acknowledge comments received from two anonymous referees and participants of the UNICEF-IPRCC Technical Consultation Meeting on Poverty Reduction for Children in China after 2020, as well as discussions with James Foster and Ana Vaz during a HDRO-IIEP-OPHI seminar on multidimensional poverty measurement. All errors remain our own.
Conflicts of Interest
The authors declare no conflict of interest.
References
- United Nations. Global Indicator Framework for the Sustainable Development Goals and Targets of the 2030 Agenda for Sustainable Development; A/RES/71/313. E/CN.3/2021/2 United Nations: New York, NY, USA, 2021; p. 1. [Google Scholar]
- Oxford Poverty and Human Development Initiative. Global Multidimensional Poverty Index 2017. In OPHI Briefing; University of Oxford: Oxford, UK, 2017; p. 47. [Google Scholar]
- Oxford Poverty and Human Development Initiative. The Global Multidimensional Poverty Index 2018. In The Most Detailed Picture to Date of the World’s Poorest People; Oxford Poverty and Human Development Initiative, University of Oxford: Oxford, UK, 2018; ISBN 978-1-912291-12-0. [Google Scholar]
- United Nations Development Programme; Oxford Poverty and Human Development Initiative. The Global Multidimensional Poverty Index 2019. Illuminating Inequalities; United Nations Development Programme: New York, NY, USA, 2019. [Google Scholar]
- United Nations Development Programme; Oxford Poverty and Human Development Initiative. The Global Multidimensional Poverty Index 2020. Charting Pathways out of Multidimensional Poverty: Achieving the SDGs; United Nations Development Programme: New York, NY, USA, 2020. [Google Scholar]
- United Nations General Assembly. Convention on the Rights of the Child; Document A/RES/44/25; United Nations: New York, NY, USA, 1989. [Google Scholar]
- Multidimensional Poverty Peer Network. Some National Measures. Available online: https://mppn.org/applications/national-measures/ (accessed on 24 May 2021).
- Alkire, S.; Foster, J. Counting and multidimensional poverty measurement. J. Public Econ. 2011, 95, 476–487. [Google Scholar] [CrossRef]
- Alkire, S.; Foster, J.E.; Seth, S.; Santos, M.E.; Roche, J.M.; Ballon, P. Multidimensional Poverty Measurement and Analysis; Oxford University Press: Oxford, UK, 2015; ISBN 978-01-996-8949-1. [Google Scholar]
- United Nations Development Programme; Oxford Poverty and Human Development Initiative. How to Build a National Multidimensional Poverty Index. Using the MPI to Inform the SDGs; United Nations Development Programme: New York, NY, USA, 2019. [Google Scholar]
- Gordon, D.; Nandy, S.; Pantazis, C.; Pemberton, S.; Townsend, P. Child Poverty in the Developing World; Policy Press: Bristol, UK, 2003; ISBN 978-18-613-4559-2. [Google Scholar]
- White, H.; Leavy, J.; Masters, A. Comparative Perspectives on Child Poverty: A review of poverty measures. J. Hum. Dev. 2003, 4, 379–396. [Google Scholar] [CrossRef]
- Bastos, A.; Fernandes, G.L.; Passos, J. Child income poverty and child deprivation: An essay on measurement. Int. J. Soc. Econ. 2004, 31, 1050–1060. [Google Scholar] [CrossRef]
- Noble, M.; Wright, G.; Cluver, L. Developing a child-focused and multidimensional model of child poverty for South Africa. J. Child. Poverty 2006, 12, 39–53. [Google Scholar] [CrossRef]
- Minujin, A.; Delamonica, E.; Davidziuk, A.; Gonzalez, E.D. The definition of child poverty: A discussion of concepts and measurements. Environ. Urban. 2006, 18, 481–500. [Google Scholar] [CrossRef]
- Roelen, K.; Gassmann, F. Measuring Child Poverty and Well-Being. A Literature Review. Maastricht Graduate School of Governance Working Paper 1 2008; Maastricht University: Maastricht, The Netherlands.
- Roelen, K.; Gassmann, F.; De Neubourg, C. The Importance of Choice and Definition for the Measurement of Child Poverty—the case of Vietnam. Child Indic. Res. 2009, 2, 245–263. [Google Scholar] [CrossRef] [PubMed]
- Roelen, K.; Gassmann, F.; De Neubourg, C. False positives or hidden dimensions: What can monetary and multidimensional measurement tell us about child poverty in Vietnam? Int. J. Soc. Welf. 2011, 21, 393–407. [Google Scholar] [CrossRef]
- Biggeri, M.; Ballet, J.; Comim, F. Children and the Capability Approach; Palgrave Macmillan: London, UK, 2011; ISBN 978-0-230-30837-4. [Google Scholar]
- Biggeri, M.; Ballet, J.; Comim, F. The Capability Approach and Research on Children: Capability Approach and Children’s Issues. In Children and the Good Life. New Challenges for Research on Children; Andresen, S., Diehm, I., Sander, U., Ziegler, H., Eds.; Springer: New York, NY, USA, 2011; pp. 75–89. ISBN 978-90-481-9219-9. [Google Scholar]
- De Neubourg, C.; Chai, J.; de Milliano, M.; Plavgo, I.; Wei, Z. Step-by-Step Guidelines to the Multiple Overlapping Deprivation Analysis (MODA). In Innocenti Working Paper; UNICEF Office of Research: Florence, Italy, 2012. [Google Scholar]
- Notten, G.; Roelen, K. A New Tool for Monitoring (Child) Poverty: Measures of Cumulative Deprivation. Child Indic. Res. 2011, 5, 335–355. [Google Scholar] [CrossRef]
- Minujin, A.; Nandy, S. Global Child Poverty and Well-Being; Policy Press: Bristol, UK, 2012; ISBN 978-18-474-2481-5. [Google Scholar]
- Redmond, G. Poverty and Social Exclusion. In Handbook of Child Well-Being. Theories, Methods and Policies in Global Perspective; Ben-Arieh, A., Casas, F., Frønes, I., Korbin, J.E., Eds.; Springer: Dordrecht, The Netherlands, 2014; ISBN 978-90-481-9064-5. [Google Scholar]
- Roelen, K. Multidimensional Child Poverty in Vietnam from a Longitudinal Perspective—Improved Lives or Impoverished Conditions? Child Indic. Res. 2013, 7, 487–516. [Google Scholar] [CrossRef]
- Stoecklin, D.; Bonvin, J.M. Children’s Rights and the Capability Approach: Challenges and Prospects; Springer: Dordrecht, The Netherlands, 2014; ISBN 978-94-017-9091-8. [Google Scholar]
- Hannum, E.; Liu, R.; Alvarado-Urbina, A. Evolving approaches to the study of childhood poverty and education. Comp. Educ. 2016, 53, 81–114. [Google Scholar] [CrossRef]
- Hjelm, L.; Ferrone, L.; Handa, S.; Chzhen, Y. Comparing Approaches to the Measurement of Multidimensional Child Poverty; UNICEF Office of Research–Innocenti Research Paper UNICEF Office of Research: Florence, Italy, 2016. [Google Scholar]
- Roelen, K. Monetary and Multidimensional Child Poverty: A Contradiction in Terms? Dev. Chang. 2017, 48, 502–533. [Google Scholar] [CrossRef]
- Abdu, M.; Delamonica, E. Multidimensional Child Poverty: From Complex Weighting to Simple Representation. Soc. Indic. Res. 2018, 136, 881–905. [Google Scholar] [CrossRef]
- Evans, M.C.; Abdurazakov, A. The Measurement Properties of Multidimensional Poverty Indices for Children: Lessons and Ways Forward. In OPHI Working Paper; Oxford Poverty and Human Development Initiative, University of Oxford: Oxford, UK, 2018; p. 115. [Google Scholar]
- United Nations General Assembly. Rights of the Child. Resolution adopted by the General Assembly on 19 December 2006; United Nations General Assembly: New York, NY, USA, 2007. [Google Scholar]
- Trani, J.-F.; Biggeri, M.; Mauro, V. The Multidimensionality of Child Poverty: Evidence from Afghanistan. Soc. Indic. Res. 2013, 112, 391–416. [Google Scholar] [CrossRef]
- Alkire, S.; Roche, J.M. Beyond Headcount: Measures that Reflect the Breadth and Components of Child Poverty. Global Child Poverty and Well-Being; Minujin, A., Nandy, S., Eds.; Policy Press: Bristol, UK, 2012; ISBN 978-18-474-2481-5. [Google Scholar]
- Callander, E.J.; Schofield, D.J.; Shrestha, R.N. Capacity for Freedom—A New Way of Measuring Poverty Amongst Australian Children. Child Indic. Res. 2012, 5, 179–198. [Google Scholar] [CrossRef]
- Roelen, K.; Camfield, L. A Mixed-Method Taxonomy of Child Poverty–the Case of Ethiopia. Appl. Res. Qual. Life 2013, 8, 319–337. [Google Scholar] [CrossRef]
- Azevedo, V.; Robles, M. Multidimensional Targeting: Identifying Beneficiaries of Conditional Cash Transfer Programs. Soc. Indic. Res. 2013, 112, 447–475. [Google Scholar] [CrossRef]
- Roche, J.M. Monitoring Progress in Child Poverty Reduction: Methodological Insights and Illustration to the Case Study of Bangladesh. Soc. Indic. Res. 2013, 112, 363–390. [Google Scholar] [CrossRef]
- Roelen, K.; Gassmann, F. Beyond averages: Child well-being in Kazakhstan. J. Child. Poverty 2014, 20, 91–110. [Google Scholar] [CrossRef]
- Trani, J.-F.; Cannings, T.I. Child Poverty in an Emergency and Conflict Context: A Multidimensional Profile and an Identification of the Poorest Children in Western Darfur. World Dev. 2013, 48, 48–70. [Google Scholar] [CrossRef]
- Singh, R.; Sarkar, S. Children’s experience of multidimensional deprivation: Relationship with household monetary poverty. Q. Rev. Econ. Financ. 2015, 56, 43–56. [Google Scholar] [CrossRef]
- García, S.; Ritterbusch, A. Child Poverty in Colombia: Construction of a Multidimensional Measure Using a Mixed-Method Approach. Child Indic. Res. 2014, 8, 801–823. [Google Scholar] [CrossRef]
- Dickerson, A.; Popli, G. The Many Dimensions of Child Poverty: Evidence from the UK Millennium Cohort Study*. Fisc. Stud. 2018, 39, 265–298. [Google Scholar] [CrossRef]
- Omotoso, K.O.; Koch, S.F. Exploring child poverty and inequality in post-apartheid South Africa: A multidimensional perspective. J. Poverty Soc. Justice 2018, 26, 417–437. [Google Scholar] [CrossRef]
- Leturcq, M.; Panico, L. The Long-Term Effects of Parental Separation on Childhood Multidimensional Deprivation: A Lifecourse Approach. Soc. Indic. Res. 2019, 144, 921–954. [Google Scholar] [CrossRef]
- Chen, C.-N.; Lin, Y.-W. Well-being dynamics among poor children and young people in Taiwan: Capability approach-based investigation. Child. Youth Serv. Rev. 2020, 108, 104592. [Google Scholar] [CrossRef]
- UNICEF. Multidimensional Child Poverty. Available online: https://www.unicef-irc.org/research/multidimensional-child-poverty/ (accessed on 26 May 2021).
- Vaz, A.; Oldiges, C.; Alkire, S. MPI and MODA. Disentangling the Differences between a Policy Tool and an Advocacy Instrument. Dimensions 2019, 7, 23–24. [Google Scholar]
- Alkire, S.; Dorji, L.; Gyeltshen, S.; Minten, T. Child Poverty in Bhutan: Insights from Multidimensional Child Poverty Index (C-MPI) and Qualitative Interviews with Poor Children; National Bureau of Statistics Bhutan: Thimphu, Bhutan, 2016. [Google Scholar]
- MIDES; MEF; INEC. Índice de Pobreza Multidimensional de Niños, Niñas y Adolescentes; UNICEF: Panamá, Panama, 2019; ISBN 978-9962-9053-2-5. [Google Scholar]
- OPHI; NESDC. Child Multidimensional Poverty in Thailand; UNICEF: Bangkok, Thailand, 2019. [Google Scholar]
- Cuesta, J.; Biggeri, M.; Hernandez-Licona, G.; Aparicio, R.; Guillén-Fernández, Y. The political economy of multidimensional child poverty measurement: A comparative analysis of Mexico and Uganda. Oxf. Dev. Stud. 2020, 48, 117–134. [Google Scholar] [CrossRef]
- Hernández Licona, G.; Aparicio, R.; Villagómez, P. Child and Adolescent Poverty and Social Rights in Mexico. A Multidimensional Measurement Approach. Dimensions 2019, 7, 12–17. [Google Scholar]
- Candia, A. Child multidimensional Poverty. Chilean measurement. In Proceedings of the MPPN Conference on Child Poverty, Washinghton, DC, USA, 2 March 2019. [Google Scholar]
- Haddad, L.J.; Kanbur, S.R. How Serious Is the Neglect of Intra-Household Inequality? In Policy Research and Planning Working Paper; World Bank Publications: Washington, DC, USA, 1989; p. 95. [Google Scholar]
- Haddad, L.J.; Kanbur, S.R. Intrahousehold Inequality and the Theory of Targeting. In Policy Research and External Affairs Working Papers; World Bank Publications: Washington, DC, USA, 1991; p. 789. [Google Scholar]
- Kanbur, R. Children and Intra-Household Inequality. A Theoretical Analysis. Policy Research Working Paper; World Bank: Washington, DC, USA, 1991; p. 685. [Google Scholar]
- Lise, J.; Seitz, S. Consumption Inequality and Intra-household Allocations. Rev. Econ. Stud. 2011, 78, 328–355. [Google Scholar] [CrossRef]
- Kanbur, R. Intra-Household Inequality and Overall Inequality. In CEPR Discussion Paper; Centre for Economic Policy Research, Cornell University: Ithaca, NY, USA, 2016; p. 11719. [Google Scholar]
- Klasen, S.; Lahoti, R. How Serious is the Neglect of Intra-Household Inequality in Multidimensional Poverty and Inequality Analyses? Evidence from India. Rev. Income Wealth 2020. [Google Scholar] [CrossRef]
- Espinoza-Delgado, J.; Klasen, S. Gender and multidimensional poverty in Nicaragua: An individual based approach. World Dev. 2018, 110, 466–491. [Google Scholar] [CrossRef]
- Chevalier, A. Parental Education and Child’s Education. A Natural Experiment. In IZA Discussion Paper; Institute for the Study of Labour: Bonn, Germany, 2004; p. 1153. [Google Scholar]
- Black, S.E.; Devereux, P.J.; Salvanes, K.G. Why the Apple Doesn’t Fall Far: Understanding Intergenerational Transmission of Human Capital. Am. Econ. Rev. 2005, 95, 437–449. [Google Scholar] [CrossRef]
- Hatt, L.E.; Waters, H.R. Determinants of child morbidity in Latin America: A pooled analysis of interactions between parental education and economic status. Soc. Sci. Med. 2006, 62, 375–386. [Google Scholar] [CrossRef] [PubMed]
- Mukherjee, D.; Das, S. Role of Parental Education in Schooling and Child Labour Decision: Urban India in the Last Decade. Soc. Indic. Res. 2008, 89, 305–322. [Google Scholar] [CrossRef]
- Daouli, J.; Demoussis, M.; Giannakopoulos, N. Mothers, fathers and daughters: Intergenerational transmission of education in Greece. Econ. Educ. Rev. 2010, 29, 83–93. [Google Scholar] [CrossRef]
- Schlechter, M.; Milevsky, A. Parental level of education: Associations with psychological well-being, academic achievement and reasons for pursuing higher education in adolescence. Educ. Psychol. 2009, 30, 1–10. [Google Scholar] [CrossRef]
- Sonego, M.; Llácer, A.; Galán, I.; Simón, F. The influence of parental education on child mental health in Spain. Qual. Life Res. 2013, 22, 203–211. [Google Scholar] [CrossRef]
- Noble, K.; Houston, S.M.; Brito, N.; Bartsch, H.; Kan, E.; Kuperman, J.M.; Akshoomoff, N.; Amaral, D.G.; Bloss, C.; Libiger, O.; et al. Family income, parental education and brain structure in children and adolescents. Nat. Neurosci. 2015, 18, 773–778. [Google Scholar] [CrossRef] [PubMed]
- Erola, J.; Jalonen, S.; Lehti, H. Parental education, class and income over early life course and children’s achievement. Res. Soc. Strat. Mobil. 2016, 44, 33–43. [Google Scholar] [CrossRef]
- Dirksen, J. Which Are the Dimensions and Indicators Most Commonly Used to Measure Multidimensional Poverty Around the World? Dimensions 2020, 11, 14–22. [Google Scholar]
- Statistics Sierra Leone; OPHI; UNDP. Sierra Leone Multidimensional Poverty Index; UNDP Sierra Leone: Freetown, Sierra Leone, 2019. [Google Scholar]
- Arifeen, S.; Black, R.E.; Antelman, G.; Baqui, A.; Caulfield, L.; Becker, S. Exclusive breastfeeding reduces acute respiratory infection and diarrhea deaths among infants in Dhaka slums. Pediatrics 2001, 108, e67. [Google Scholar] [CrossRef]
- Kramer, M.S.; Kakuma, R. The Optimal Duration of Exclusive Breastfeeding; World Health Organization: Geneva, Switzerland, 2002. [Google Scholar]
- Kramer, M.S.; Kakuma, R. Optimal duration of exclusive breastfeeding. Cochrane Database Syst. Rev. 2012, CD003517. [Google Scholar] [CrossRef]
- Kramer, M.S.; Guo, T.; Platt, R.; Sevkovskaya, Z.; Dzikovich, I.; Collet, J.-P.; Shapiro, S.; Chalmers, B.; Hodnett, E.; Vanilovich, I.; et al. Infant growth and health outcomes associated with 3 compared with 6 mo of exclusive breastfeeding. Am. J. Clin. Nutr. 2003, 78, 291–295. [Google Scholar] [CrossRef] [PubMed]
- Iliff, P.J.; Piwoz, E.G.; Tavengwa, N.V.; Zunguza, C.D.; Marinda, E.T.; Nathoo, K.J.; Moulton, L.; Ward, B.J.; Humphrey, J.H. Early exclusive breastfeeding reduces the risk of postnatal HIV-1 transmission and increases HIV-free survival. AIDS 2005, 19, 699–708. [Google Scholar] [CrossRef] [PubMed]
- Duijts, L.; Jaddoe, V.W.V.; Hofman, A.; Moll, H.A. Prolonged and Exclusive Breastfeeding Reduces the Risk of Infectious Diseases in Infancy. Pediatrics 2010, 126, e18–e25. [Google Scholar] [CrossRef] [PubMed]
- Foster, J.; Greer, J.; Thorbecke, E. A Class of Decomposable Poverty Measures. Econometrica 1984, 52, 761. [Google Scholar] [CrossRef]
- Alkire, S.; Kanagaratnam, U.; Suppa, N. The Global Multidimensional Poverty Index (MPI) 2020; OPHI MPI Methodological Note Oxford Poverty and Human Development Initiative; University of Oxford: Oxford, UK, 2020; p. 49. [Google Scholar]
- National Planning Commission; OPHI. Nepal Multidimensional Poverty Index 2018. Analysis towards Action; National Planning Commission, Government of Nepal: Kathmandu, Nepal, 2018. [Google Scholar]
- NSIA. Afghanistan Multidimensional Poverty Index 2016–2017; National Statistics and Information Authority: Kabul, Afghanistan, 2019. [Google Scholar]
- Alkire, S.; Haq, R. Analyzing Individual Deprivations alongside Household Poverty. Possibilities for Gendered, Intrahousehold, and Multidimensional Analyses; Oxford Poverty and Human Development Initiative; University of Oxford: Oxford, UK, 2021. [Google Scholar]
- Alkire, S.; ul Haq, R.; Alim, A. The State of Multidimensional Child Poverty in South Asia: A Con-textual and Gendered View; OPHI Working Paper 2019, 127; Oxford Poverty and Human Development Initiative; University of Oxford: Oxford, UK, 2019. [Google Scholar]
- Currie, J.; Moretti, E. Mother’s Education and the Intergenerational Transmission of Human Capital: Evidence from College Openings. Q. J. Econ. 2003, 118, 1495–1532. [Google Scholar] [CrossRef]
- Mare, R.D.; Maralani, V. The Intergenerational Effects of Changes in Women’s Educational Attainments. Am. Sociol. Rev. 2006, 71, 542–564. [Google Scholar] [CrossRef]
- Hong, G.; Kim, S.; Park, G.; Sim, S.-G. Female Education Externality and Inclusive Growth. Sustainability 2019, 11, 3344. [Google Scholar] [CrossRef]
- Vaz, A.; Oldiges, C.; Alkire, S. Building a Child Poverty Measure to Inform Policy. Dimensions 2019, 7, 18–21. [Google Scholar]
- Vaz, A.; Alkire, S. Multidimensional Child Poverty: Building a Measure to Inform Policy; Oxford Poverty and Human Development Initiative; University of Oxford: Oxford, UK, 2021. [Google Scholar]
- Oxford Poverty and Human Development Initiative. Study of Multidimensional Poverty and Children in Punjab, Pakistan; Oxford Poverty and Human Development Initiative; University of Oxford: Oxford, UK, 2020. [Google Scholar]
- Planning Commission of Pakistan. Multidimensional Poverty in Pakistan; Planning Commission of Pakistan, Ministry of Planning, Development and Reform: Islamabad, Pakistan, 2016. [Google Scholar]


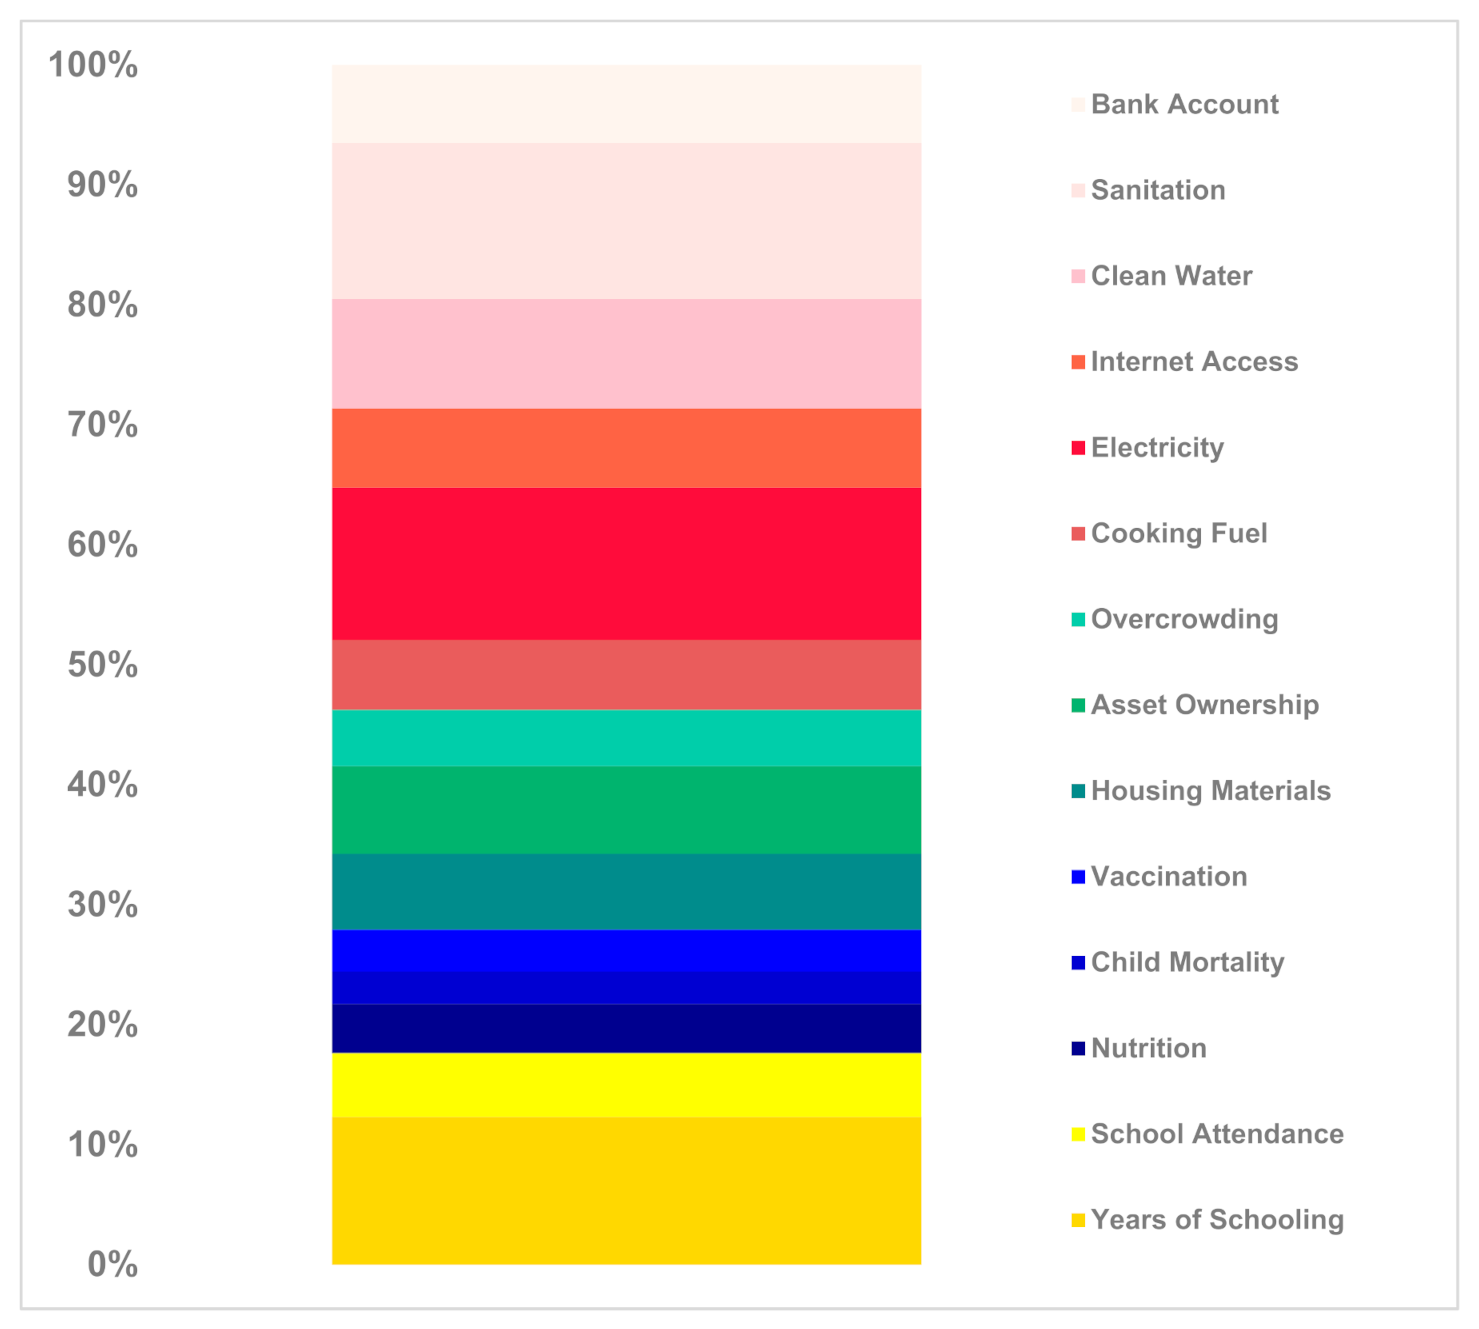


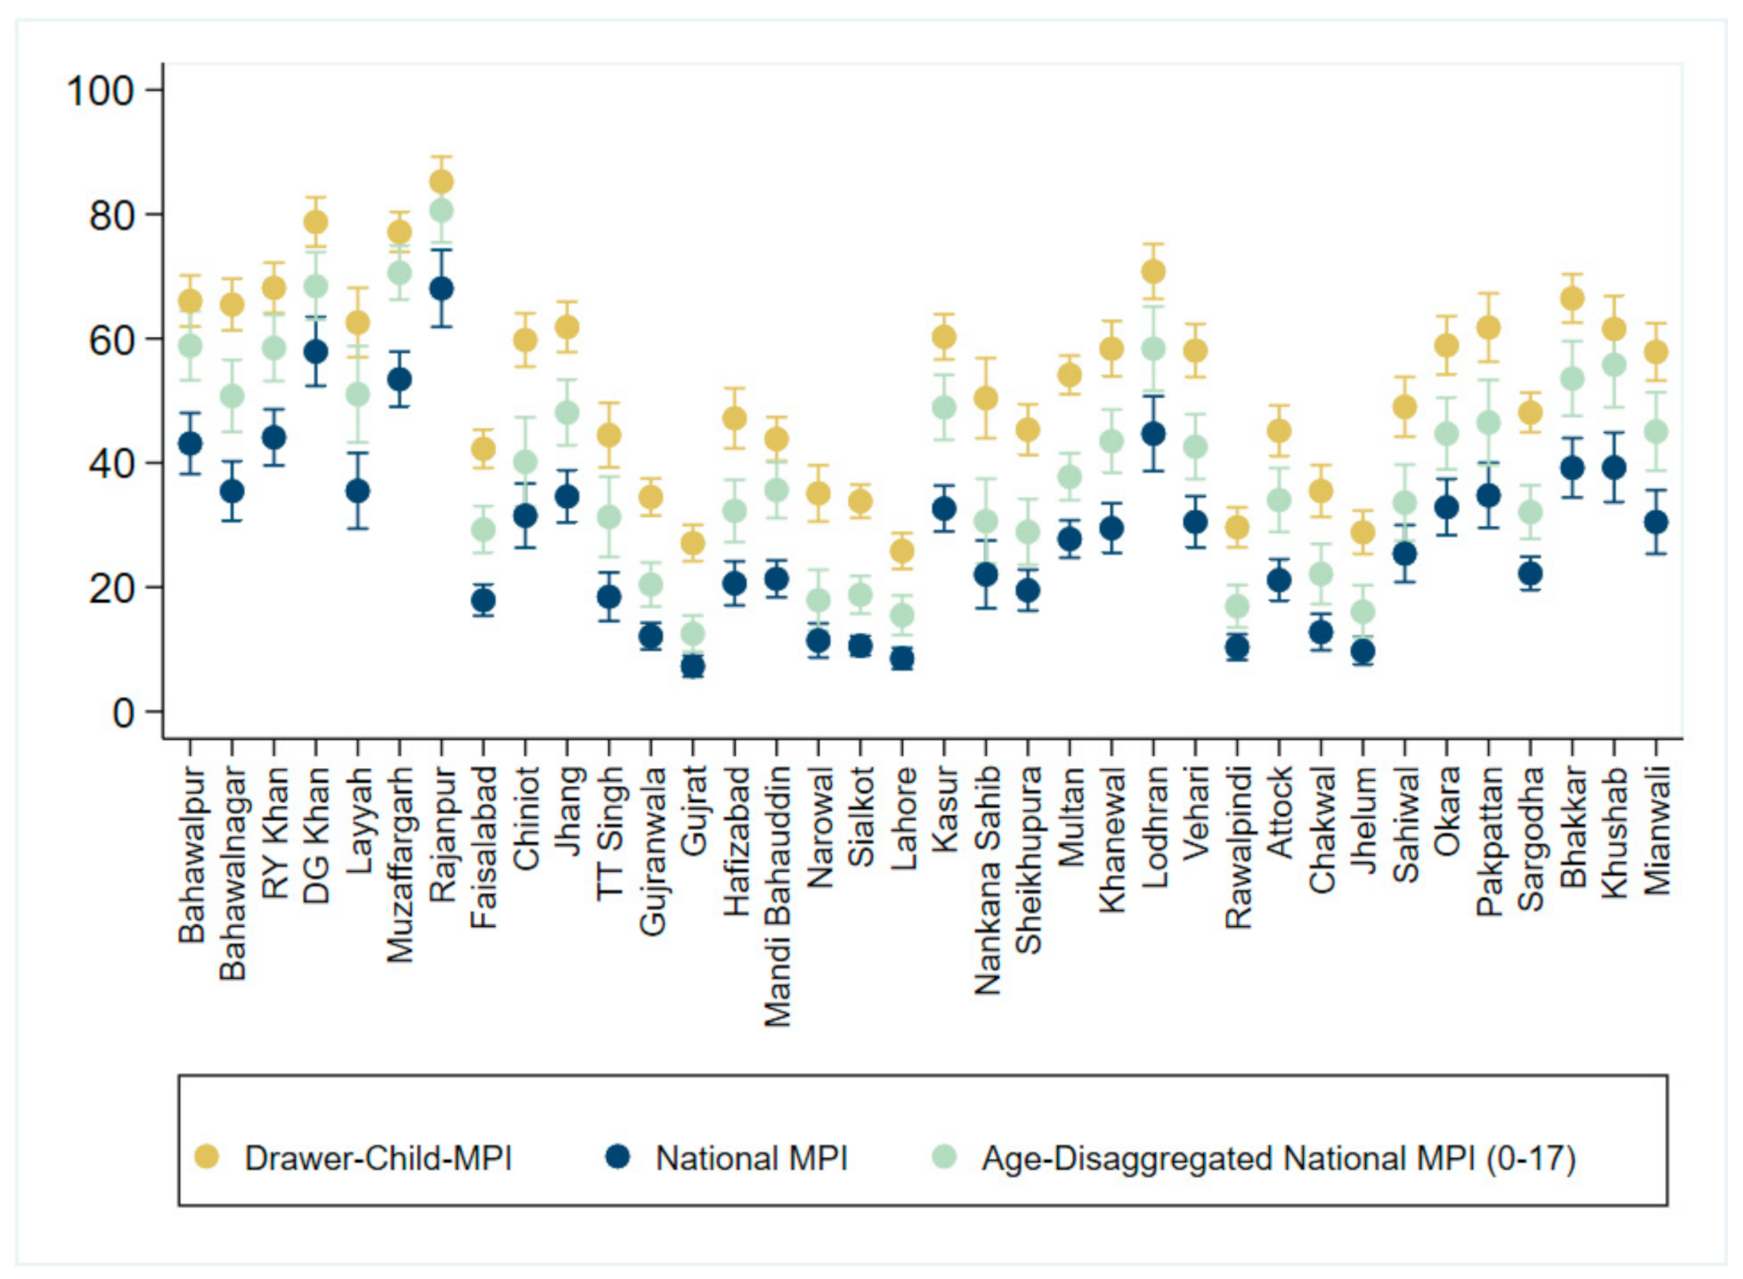
Publisher’s Note: MDPI stays neutral with regard to jurisdictional claims in published maps and institutional affiliations. |
© 2021 by the authors. Licensee MDPI, Basel, Switzerland. This article is an open access article distributed under the terms and conditions of the Creative Commons Attribution (CC BY) license (https://creativecommons.org/licenses/by/4.0/).