Abstract
Child multidimensional deprivation and poverty is a key challenge to achieving sustainable development. The aim of this paper is to present and apply a new composite index for evaluating the progress towards eradicating child poverty: the Child Multidimensional Deprivation Index (CMDI). This index stems from the foundational literature on multidimensional child poverty that is rooted in the work started by UNICEF and based on the seven core dimensions of multidimensional child deprivation, while considering two additional dimensions of environmental sustainability. The CMDI applies a novel method of aggregation that allows for flexibility of substitution between dimensions, therefore overcoming some of the limitations of conventional indices. Results for 24 countries show that most countries experienced a decrease in multidimensional deprivation in the years between 2010 and 2016, but some of the poorest countries saw an increase in deprivation. Additionally, in several countries, the decrease in child deprivation was small. Results also show that investment in social spending is associated with a lower level of deprivation. Investment in the social sector is crucial to achieving this goal and preventing the negative effects of economic and other types of crisis.
1. Introduction
Sustainable development is the driving force of the 2030 agenda, and all of its global goals are relevant for children, including those that indirectly influence children’s multidimensional wellbeing [1,2].
Reducing child multidimensional poverty is a prerequisite for the future of sustainable development, as defined in the Agenda 2030 [2]. Sustainable Development Goal 1 (SDG 1) of the agenda aims at “reducing at least by half the proportion of children of all ages living in poverty in all its dimensions” (Target 1.2).
The multidimensionality of poverty and child wellbeing has long been recognized, and both academia and UN agencies have increasingly adopted a multidimensional perspective in analyzing and addressing poverty and wellbeing. The multidimensional nature of child poverty is explicitly recognized in the Convention on the Rights of the Child (CRC) [3], which was signed by all countries and ratified by almost all.
In the last decade, studies on multidimensional child poverty and deprivation have proliferated, and part of the reason has been the efforts of UNICEF in promoting the measurement and analysis of child poverty in its multidimensional definition. In 2005, UNICEF released a report analyzing severe deprivation of children in different countries using microdata and looking at seven specific material dimensions [4]. The analysis was based on a straightforward dual cut-off approach as defined by Gordon et al. [5]. Years later again, UNICEF introduced the Multidimensional Overlapping Deprivation Analysis (MODA) in the analysis of child poverty [6], which uses a triple cut-off method and incorporates elements derived from the Alkire and Foster [7] methodology. Most of the studies promoted by UNICEF adopt a human rights approach, rooted in the CRC. However, in their Report Card series, which focuses on country-level analysis of OECD countries, UNICEF has used different frameworks, such as the bioecological framework [8,9] and the SDGs [10]. Other studies of child poverty adopt different theoretical frameworks and methodologies: some adopt the Alkire and Foster methodology and the Multidimensional Poverty Index to the measurement of multidimensional child poverty, for example Trani et al. [11], and Roche [12].
Among country-level analyses, UNICEF regularly publishes its studies on children-relevant issues in high-income countries in the Report Card series. Other studies that use indicators at the country level and develop indices for international comparison have also been launched by several institutions and NGOs, for example the OECD [13], and Save the Children [14], among others.
The main two questions this work addresses are as follows:
(1) Can we move from a micro- to a macro-measure of multidimensional child deprivation?
(2) How can environmental sustainability be included in such measures, moving forward from the ‘classic’ measurement of child deprivation, to include a broader understanding of deprivation, more in line with the Sustainable Development Goals?
There are three main contributions of this study to the current literature and empirical analysis. First, deprivation is measured in a continuum at country level, using aggregated data (although micro-funded). Secondly, we develop a new composite index, the Child Multidimensional Deprivation Index (CMDI), using the Multidimensional Synthesis of Indicators (MSI) as an aggregation method to take into account the heterogeneity of outcomes. Finally, the seven dimensions selected by UNICEF in the severe deprivations approach [4,5] and in MODA [6] are complemented by two other material dimensions. The latter capture the environmental dimensions of sustainability, which is much more relevant in the Agenda 2030, therefore addressing the multi-faceted nature of child deprivation mentioned in SDG1.
The paper is structured into five sections. In the next section, the second, the backbone of the literature on child poverty and deprivation is recalled. In Section 3, the CMDI and the data selected are presented. In Section 4, the main results for 24 countries are showcased. These countries were selected according to their location by continent and their main development characteristics. In Section 5, the main findings are discussed and policy implications and the main conclusions are given.
2. Background: Literature Review on Child Poverty and Deprivation Measurement
The focus on children’s wellbeing had already started in the 1980s, when UNICEF launched the State of the World Children (SotWC) [15], a publication that has now reached its 40th edition. Each year, the new issue focuses on one particular aspect of children’s wellbeing across the globe, while also reporting on several elements and trends of children’s lives. The very first issue was indeed devoted to poverty and its effects on children, as it called for a strong commitment by the global community and governments to eradicate all the worst forms of poverty: hunger, disease, and illiteracy. The proposed concept of poverty was already multidimensional at the time and rooted not in a monetary approach, but in a more holistic and human perspective and based on a scoreboard approach.
Child multidimensional poverty analysis and measurement has been one of the major concerns and objectives of UNICEF for several years. In 2005, the SotWC reported the first global estimates of child deprivation [4]. It was the first study to conceptualize and measure multidimensional child poverty in the developing world and it was based on the methodology that has come to be known as ‘the Bristol methodology’, based on the work of Gordon, Nandy, Pantazis, Pemberton, and Townsend [5]. The methodology defines seven dimensions of material deprivation that uphold the principal rights of children through the dimensions of adequate nutrition, clean water, acceptable sanitation services, health, housing, education, and information [16]. The Bristol methodology uses two thresholds to measure both moderate and severe deprivation for each indicator. It then uses a counting approach to aggregate dimensions, therefore considering how many deprivations each child suffers, and it defines children experiencing three or more simultaneous deprivations as “multidimensionally poor”. This method is designed to be applicable at a global scale, as it is standardized and internationally comparable. Moreover, it uses standardized household surveys collecting data on children’s conditions, such as the Demographic and Health surveys (DHS), and the Multiple Indicators Cluster Surveys (MICS).
Since then, multidimensional child poverty has received increasing attention. In 2007, UNICEF launched the Global Study on Child Poverty and Disparities [17]: an effort that spanned over 50 countries with the aim to mobilize national resources and discussion around the critical issue of child poverty. The Global Study used the same Bristol methodology. Subsequent studies operationalizing the MDCP from the child rights approach include that of Roelen, Gassmann, and de Neubourg [18] in Vietnam.
Building on this literature, UNICEF further developed its multidimensional child poverty approach, which continued to be based on the child rights approach in the domains of child survival, development, protection, and participation. The resulting measure, the Multiple Overlapping Deprivation Analysis (MODA) [6], as with the Bristol methodology, focuses on the type and number of deprivations experienced simultaneously by each child. Moreover, MODA uses a combination of the Bristol and the Alkire and Forster [7,19] methods. In fact, the definition of dimensions is rooted in the child rights approach, as with the Bristol methodology, but placing more focus on the life cycle, hence defining five dimensions for children below the age of five, and five dimensions for children aged 5 to 17. Since three dimensions are common to both age groups, the resulting dimensions are still seven: health, nutrition, education, information, water, sanitation, and housing. MODA defines also an eighth dimension: protection from violence, which is added whenever the data allow for taking it into account. This is a substantial deviation from the more material deprivation approach used by the Bristol methodology, but still rooted in the child rights approach. In subsequent national studies using the MODA approach, dimensions of deprivation related to the area of protection are often introduced, such as child labor and exploitation, child neglect, and violent discipline [20]. The other important discontinuity of MODA is that it introduces two indicators per dimension, while losing the double threshold (severe and moderate), and it uses the union approach to aggregate indicators into dimensions (which means a child is deprived if they are deprived in either one of the indicators.). This decision has important consequences, since it introduces an element of non-substitutability between indicators, which is consistent with a human rights approach, but it results in violating the monotonicity property, which requires that if an individual becomes non-deprived in any indicator, the resulting poverty headcount should fall. With the union approach, this depends on the initial status of the two indicators. This feature makes MODA less sensitive to random changes in indicators, partially balancing the problem of discontinuity and ‘jumps’ in status. However, it also results in a measure that is harder to influence and loses the possibility to conduct, for example, decomposition analysis by indicator. MODA also incorporates elements of the Alkire and Foster methodology by producing not only the headcount of deprived children, but also the intensity of deprivation and the adjusted headcount.
Other studies of multidimensional child poverty can be found in literature that have not followed the child rights approach, such as Trani et al. [11]. The latter adopts, instead, a capability approach, akin to the multidimensional poverty index (MPI) in considering deprivations—conceptualized as a lack of freedom to do and be what the children themselves value—which go beyond children’s rights exclusively, namely health, care and love, material deprivation, food security, social inclusion, education, freedom from economic and non-economic exploitation, shelter and environment, autonomy, and mobility. In addition, the Global MPI estimates have started to include a count of the number of children in households defined as multidimensionally poor, and some recent efforts have attempted to sharpen the focus on children, such as Roche for Bangladesh, and Alkire et al. in Bhutan [12,21].
Studies based on a child rights framework have a more structured framework, and are easier to communicate for advocacy purposes, while defining capabilities for children may be more complicated. On the other hand, the MPI methodology is widely used and tested. However, all these studies agree on a set of ‘core’ dimensions of child deprivation.
The other common denominator of all these measures is that they are based on the definition of a dual (or triple, in the case of MODA) cut-off, which first defines deprivation in each sub-domain as a binary status (i.e., deprived or non-deprived) and then defines poverty in the multidimensional space according to a poverty cut-off (i.e., a poverty line). The dual cut-off method is rooted in the study by Chakravarty and D’Ambrosio [22], who were the first to provide a comprehensive analysis of the indices that count the number of attributes (dimensions) below a poverty threshold. Although the dual cut-off is a useful tool in many respects, it lacks a more nuanced and granular analysis of multidimensional deprivation, which is more useful to monitor trends, similarly to the measures used for consumption or income-based analyses [23].
Other studies have moved away from micro-founded indexes, and, instead, focused on producing aggregate composite indices at the country level, therefore shifting the focus from the overlap of multiple deprivation to the aggregate level of children’s outcomes. For example, Bradshaw and Richardson [24] elaborated an index of wellbeing for children in the European Union on 23 domains and 51 indicators, including material and subjective wellbeing. Similarly, in 2009, the OECD launched the Better Life Index: an interactive tool to compare OECD countries on several indicators of wellbeing (http://www.oecdbetterlifeindex.org/about/better-life-initiative/, accessed on 18 January 2021), including immaterial aspects such as civic engagement and life satisfaction. Following the example set by UNDP with the Human Development Index (HDI), Save the Children proposed the Child Development Index (CDI), which measured child development in three main areas, namely health, nutrition, and education, using the under-five mortality rate, underweight, and primary enrollment as proxies for the dimensions [14]. The CDI was followed by the End of Childhood index [25], which aims at measuring the factors that contribute to childhood deprivation. This index uses eight indicators, with a primary focus on children’s abuse, neglect, and negative outcomes, namely: under-five mortality, malnutrition, out-of-school children, child labor, early marriage, adolescent births, displacement by conflict, and child homicide. Both indices have mainly advocacy purposes. Other indices have recently been proposed. These analyze child development from a country level perspective using macro-data [26,27].
In this work, we follow the strand of composite indices of child-wellbeing while using the dimensions previously identified to measure multidimensional child poverty to construct and index at macrolevel. The aim is to look at countries’ progress on what have been recognized as the foundational dimensions of children’s rights and wellbeing, with the addition of two dimensions related to environmental sustainability. Constructing a measure of deprivation at macrolevel, we lose the ability to measure the overlap of deprivation, however, in turn, we gain the possibility to measure child deprivation for a wide array of countries with different level of economic and social development. We adopt the Multidimensional Synthesis of Indicators approach as a viable alternative to the arithmetic mean and the geometric mean typically used in existing composite indices. Moreover, we additionally introduce the novelty of applying this approach also to the ‘negative’ space of deprivation.
We herein adopt the framework of children’s rights, as it has been widely recognized at an international and national level, to measure child deprivation, and the dimensions of deprivation defined with this approach have been widely tested. They can also be easily linked to basic needs and capabilities, therefore incorporating a wider theoretical framework [23]. The opportunity and the right of every child to be healthy, have adequate nutrition, education, access to clean water, etc. are also part of the sustainable development agenda. In addition, we propose the inclusion of two dimensions related to environmental sustainability; environmental sustainability is, as a matter of fact, a prerequisite for the realization of children’s rights and for their full development, any effort to reduce and eliminate child poverty and deprivation cannot ignore the dimension of environmental sustainability. Therefore, we propose that it should be incorporated into any measure of child deprivation.
The selection of dimensions and indicators, as well as the aggregation method, is discussed in detail in the next section.
3. Child Multidimensional Deprivation Index (CMDI)
3.1. Selection of Dimensions
The selection of dimensions and indicators for the CMDI closely follows the dimensions of child deprivation defined by UNICEF with Bristol methodology and MODA [4,5,6]: nutrition, health, education, information, shelter (or housing), water, and sanitation. Both methodologies are considered to be international standards for the measurement of multidimensional child poverty and use standardized household surveys, ensuring the comparability of the estimates of multidimensional deprivation across countries and time.
Here, we follow the same approach while moving to the macrolevel: we consider the same dimensions and, to the extent possible, we select the same indicators used by UNICEF to represent each dimension, with the only exception of housing/shelter. Indicators on overcrowding or shelter quality are not widely available at an international level, therefore we decided to drop this dimension and use economic resources as a proxy for the material conditions of the family. Household assets and quality are, in fact, generally highly correlated with economic means [28,29].
These core dimensions were then integrated by two additional ones to represent environmental sustainability: environment, measured by CO2 emissions, and shelter environment, measured by the quality of fuel used in the household. The former incorporates the element of sustainability for future generations, evaluating countries on their climate action [30]. The latter reflects the quality of the proximate environment of the child, and it incorporates an element of long-term sustainability [31].
Our final list therefore includes nine dimensions (see Table 1): economic resources, health, nutrition, education, information, water, sanitation, environment, and shelter environment.

Table 1.
CMDI dimensions, Bristol and MODA dimensions.
While following previous approaches to multidimensional material deprivation, it should be acknowledged that this index, as well as its predecessors, still lacks material dimensions that are relevant for children’s rights, such as mobility and accessibility, as well as non-material dimensions, such as friends and leisure, love and care, and identity, among others. Some of these dimensions could be measured with adequate data/data coverage, while others are difficult to be understood and conceptualized at the country level.
3.2. Aggregation Method
One of the main concerns related to the conventional measures of multidimensional poverty is that they are not usually very precise in monitoring child poverty and deprivation. The reason for this is that they are based on a binary method and not on a continuum space, which, instead, would allow a more nuanced understanding of trends and heterogeneity, similarly to what we can observe for monetary aggregates. Another problem common to all micro-funded measures arises from the fact that microdata availability is still scarce, despite strong efforts and improvements in recent years, especially for high- and middle-high-income countries. Moreover, for most countries, there are time gaps between household surveys of four, five, or even more years. One way to compensate for these shortcomings is to move to the macrolevel, hence analyzing indicators at the country-level.
A weakness common to most multidimensional measures and composite indices is the problem of the substitutability of outcomes: dimensions are generally either a perfect substitute for each other, or weights are arbitrarily attributed.
The aggregation method selected for the CMDI to capture children’s deprivation at the country level is the Multidimensional Synthesis of Indicators (MSI) [32], a new method of aggregation. This method considers both the level of the outcomes as well as their degree of heterogeneity. One of the main departures for conventional composite indices is that its functional form allows for flexibility in substitution among dimensions [33]. In other words, the degree of substitutability between dimensions in an MSI-style index is defined by a function of each observation’s characteristics, such as, in this case, the country’s average outcomes. This means that the higher a country scores in the average of dimensions, the higher degree of substitutability between them is allowed, and vice versa. This flexibility avoids both the perfect substitutability among dimensions, as with the arithmetic mean, and the likely collapse to zero of the geometric mean [34]. The geometric mean and the MSI are quite similar in the outcome, as they both penalize heterogeneity of outcomes. However, the MSI is linked to the general mean. This is an advantage compared to the geometric mean because it is less affected by outcomes close to zero, and it is therefore more stable. While the geometric mean treats any decrease or increase in indicators as the same, the MSI places a higher weight when a decrease happens in an indicator at a higher level, since the average is reduced more.
The continuity property of the index implies that a small change in any dimension will be associated with a small change in the overall index, thus escaping from jumps or discontinuities that are typical in binary measures of deprivation. This full sensitivity implies strict monotonicity of the aggregation function, so that each improvement (or deterioration) in any unidimensional indicator of deprivation results in an increase (or decrease) in the overall index.
The general formulation of the MSI uses a standard data matrix, with n observations and k variables for a generic observation i.
where the generic entry is the achievement of individual i in dimension j. Indicator is bound between 0 and 1, where 0 corresponds to the lowest level of unidimensional wellbeing, and 1 to the highest level. It follows, that corresponds to the complete inability to compensate for wellbeing in one dimension by drawing on others, and corresponds to a perfect substitutability of wellbeing among dimensions for individual i.
The aggregation of these indicators into a single index involves a function , set at the individual level, indicating to what extent individual i can substitute different dimensions to compensate for low wellbeing in one dimension relative to others.
The functional form of permits a high degree of flexibility in terms of appropriate substitution rates as described in Equation (2):
where is the arithmetic mean of , and and are the thresholds above or below which achievements are aggregated under the assumption of almost perfect substitution (above β) or near perfect complementarity (below α).
The CMDI is a measure derived from the standard MSI method with a simple linear transformation, where the function g is evaluated at , the average level of the nine dimensions of the country, and the parameters are set as . The CMDI therefore is equal to 1—MSI, and it aggregates, for each country, the outcomes of k = 9 unidimensional achievements using the following equation:
where dij is the achievement in the jth-dimension of country i. The CMDI varies between 0, full achievement, to 1, complete deprivation.
To construct dimensions, indicators were first standardized using the same approach used to construct the Human Development Index, according to Equation (4).
where each dimension dij is composed by one standardized indicator x for the country i, xmin is the minimum value of x, and xmax the maximum value (see next section).
Some indicators were transformed using a simple linear transformation to move to the positive space (0 deprivation, 1 absence of deprivation); this was necessary to construct the index as defined previously.
3.3. Data Selection
Data availability and accessibility has considerably increased in the last two decades. The data selection entailed careful consideration of almost all available data. Necessary considerations were data availability over time and countries, statistical correlations between indicators and their significance, and the statistical logic of formative vs. reflective indicators [35].
The data were selected according to four main criteria. First, coherence with the theoretical framework was pursued; as much as possible, we selected the same indicators as the one used in the multidimensional child poverty methodology. Second, dimensions and indicators needed to be relevant for child wellbeing (see previous section) and child rights, as well as, to the extent possible, responding to the SDGs. To this end, we referred also to the UNICEF framework that assigns all the 44 child-related indicators of the SDGs to five main areas of child development, namely: survive and thrive, learn, protection, environment, and fair chance [2]. Third, we used objective data, which are usually preferred over subjective assessment of wellbeing. Comparable subjective assessments are rare, and they do not cover all countries or child populations (see, for example, the World Value Survey (http://www.worldvaluessurvey.org/wvs.jsp, accessed on 18 January 2021). Finally, data should be comparable, consistent, and of high quality. For this reason, we selected indicators based on data availability, comparability, and providing a satisfactory coverage both in terms of number of countries and time span (preferably data from 2000 or, at least, covering the last decade).
Indicators for the core dimensions were chosen as the most representative for each dimension and for their availability, for example, MODA uses young child feeding as an indicator for the nutrition of under-five children, but this indicator is not available at aggregate and internationally comparable levels. We also used indicators that have already been validated by other indices: we used the gross national income (GNI) per capita expressed in constant purchasing power parity (PPP) dollars (2017) instead of the GDP, as this is also the indicator used for the Human Development Index. For the same reason, we use expected years of schooling as an indicator of education. For drinking water, we used access to basic drinking water, since this indicator is more widely available than the SDG indicator of safely managed water. The same is true for sanitation, where we use the indicator of access to basic sanitation for rural areas: this allows for a higher country coverage and is a better proxy, since, in many countries, the issue of access to sanitation is mostly a rural problem. For access to information, we chose to use the level of access to the internet over other indicators; in fact, the massive shift towards online communication makes access to the internet a priority in order to allow children to be informed, educated, and participate in society. The recent shift to online teaching caused by the coronavirus pandemic has shown how much the digital divide can impact children’s lives [36].
The process resulted in nine dimensions defined by nine indicators (see Table 2). For this application, we tested the index on 24 countries, selected to represent a variety of geographical as well as socio-economic contexts: Australia, Belarus, Bolivia, Brazil, Central African Republic, China, Colombia, Egypt, Ghana, India, Indonesia, Italy, Jordan, Liberia, Madagascar, Norway, Pakistan, Russia, Senegal, South Africa, Uganda, United Kingdom, Unites States of America, and Zimbabwe.
Table 2.
Dimensions, Indicators, and reference values.
The data used were collected from several international sources. The main data source used is the World Bank Open Data repository, and their sustainable development indicators database. Other sources include WHO, UNICEF, and FAO. The indicator of CO2 was transformed in relative terms, for 1000 people, to allow for comparability across countries. It was also transformed from kilotons into tons, to make the order of magnitude more comparable. CO2 data for Italy for the years 2015 and 2016 have been acquired from the National Institute for Environment Research and Protection: https://www.isprambiente.gov.it/it, accessed on 10 February 2021.
Not all indicators go back before 2010, and only a handful are available for the pre-2000 period, while most indicators, however, have good time and country coverage after 2010. Our main focus and empirical analysis in this study is related to the latest year available, which is 2016, since environmental indicators are not available for 2017, and many indicators are missing for 2018. For the analysis of trends, we focused on the post-2009 period, representing the latest decade of development.
Table 2 summarizes the indicators, their coverage in terms of time and countries, and their source. The table also reports the mean value of each indicator and their reference minimum and maximum values; these are the values used to standardize the indicators. We decided to use the plausible theoretical minimum and maximum grounded either in the literature or theory, or, if not possible, in the historical series of the indicator. This allows a better comparability among countries and it reduces the effect of variance among the different indicators used, producing a better alignment. It also allows the CMDI comparability across years so that the index can be used in both time series and cross section analyses.
The CMDI is constructed for each country aggregating the nine domains following Section 3 as shown in Equation (3).
The next table (Table 3) presents the raw indicators for the selected countries in 2016, while the following table (Table 4) reports the single dimensions of deprivation for each country in 2016, where 0 is absence of deprivation and 1 is deprivation. Richer countries show, as expected, lower level of deprivation in dimensions such as water, sanitation, and resources. However, they clearly show higher levels of deprivation in the environment dimension.
Table 3.
Raw indicators by country, 2016.
Table 4.
Dimensions by country, 2016.
The next section illustrates the aggregate results for this group of countries.
4. Results
The next figure illustrates the level and ranking of deprivation for the selected 24 countries: countries with higher deprivation are showcased on the right-end side of the graph.
The five most deprived countries, Central African Republic, Madagascar, Liberia, Uganda, and Zimbabwe, all present very high levels of deprivation: from 0.67 of Zimbabwe to 0.84 of the Central African Republic. The middle of the distribution presents values between 0.25 and 0.55, while the countries with the lowest deprivation have values under 0.22. The results are in line with those of other aggregate indicators: countries in the lower part of the rank are among the poorest countries, and countries in the higher rank are all high-income countries. Still, countries such as the USA, Australia, and Italy, all have a CMDI value over 0.1, and among the ten countries with the lowest deprivation, we find countries like Belarus, Colombia, and Jordan. Among African countries, Senegal and Ghana both have a score slightly higher than 0.5, similar to Pakistan, but quite a bit lower than Zimbabwe and Uganda (Figure 1).
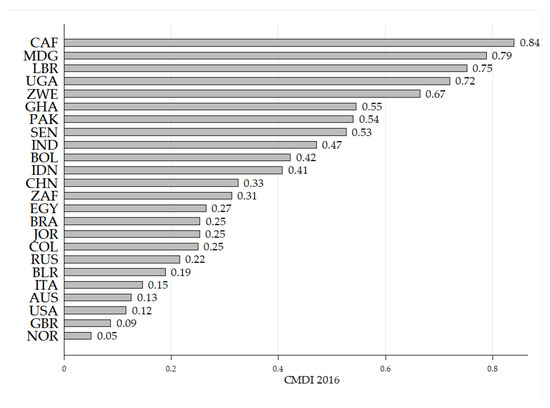
Figure 1.
CMDI value, 2016. Source: authors’ elaboration.
As the aggregation method allows for less substitutability between dimensions for higher levels of overall deprivation, countries with a higher deprivation level are more heavily penalized by the CMDI than they would be by a simple average of deprivations. This is illustrated in the next figure (Figure 2), which shows how the distance between the arithmetic mean and the CMDI score becomes larger the higher the overall level of deprivation.
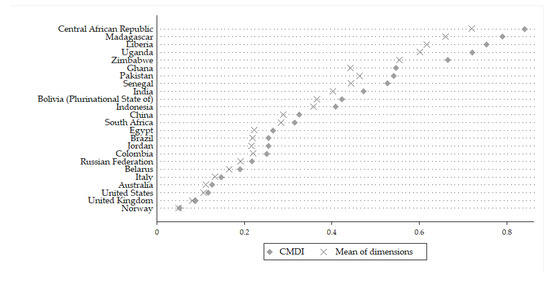
Figure 2.
CMDI and average deprivation level. Source: authors’ elaboration.
While many of the most deprived countries are also poor countries, the relationship with the monetary aggregate is not linear. The next table (Table 5) compares the ranking in CMDI and deprivation in gross national income. We can see that the ranking is not so different, given the low number of countries. However, there are some relevant discrepancies: for example, Jordan would rank 11th if accounting only for deprivation in income, while it results as 16th in the CMDI, showing a better performance in preventing child deprivation than what would be predicted by monetary metrics alone.
Table 5.
Rank by CMDI and GNI deprivation 2016.
This becomes clear in Figure 3; the relationship between the CMDI and income deprivation is clearly non-linear. First, all the points fall below the 45° line, meaning that all countries have a level of deprivation that is lower than that predicted by their income. Second, it is clear that the relationship is very elastic for low levels of income (the right-hand side of the graph), while it becomes almost flat after a certain level of income (i.e., moving towards the origin). This implies that, at low levels of national income, even a small increase can make a substantial difference in child deprivation, while the relationship quickly becomes less relevant (almost non-significant) as national resources increase.
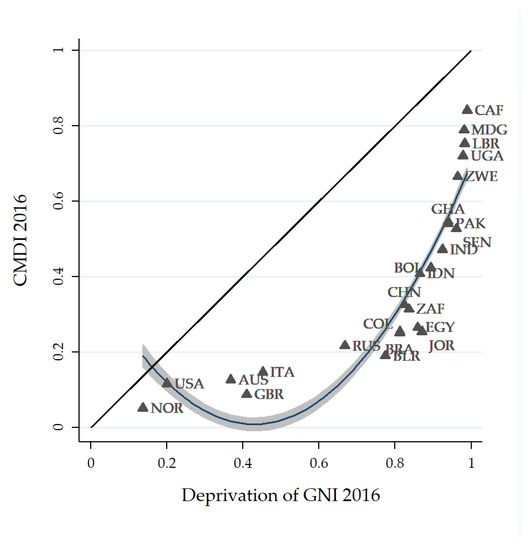
Figure 3.
Correlation between CMDI and deprivation in income. Source: authors’ elaboration.
This reflects both a higher level of general development, but also an increase of national resources that can be allocated to social investments and programs.
The next graph illustrates the relationship between the CMDI in 2016 and the average change in national expenditures in health, education, and social protection between 2010 and 2016. Expenditures are expressed as a percentage of GDP, and the average value of the change calculated on annual basis was considered.
This shows a clear negative relationship between expenditures in the social domain and the level of deprivation (Figure 4); countries that see an increase in social spending have lower level of CMDI in 2016. This is partially obvious and expected; however, many of the indicators in the CMDI are tied to infrastructure investment, which is not accounted for in social spending. While not a causal link, it is undeniable that social spending in key sectors such as education, health, and social protection is crucial for child wellbeing. It is also interesting to note that many countries, while enjoying low levels of deprivation, have also invested very little in social spending in the period between 2010 and 2016. This could result in increasing levels of child deprivation in the future. In fact, evidence shows that the austerity ensuing after the 2007–2008 financial crisis has had a detrimental effect on children [37].
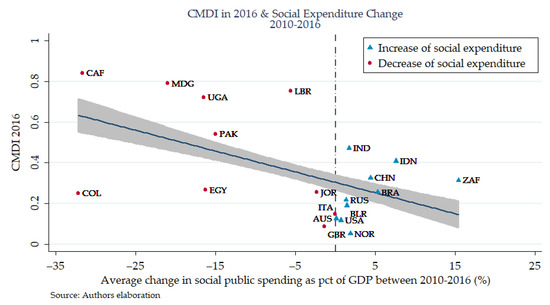
Figure 4.
CMDI and social spending.
Finally, the next figure (Figure 5) showcases the trends and change in child deprivation over time. We can see that most countries exhibit a decrease, albeit small, in deprivation between 2010 and 2016, with the exceptions of the Central African Republic, Zimbabwe, and Madagascar. Some countries, such as China, Indonesia, and Bolivia, show a marked downward trend in deprivation, while, for many others, the line is almost flat, especially for higher income countries such as Italy, the USA, and Australia. This is worrying as these are mostly the countries that also did not increase social spending in the time between 2010 and 2010, and the lack of improvement could turn into a worsening of child deprivation.
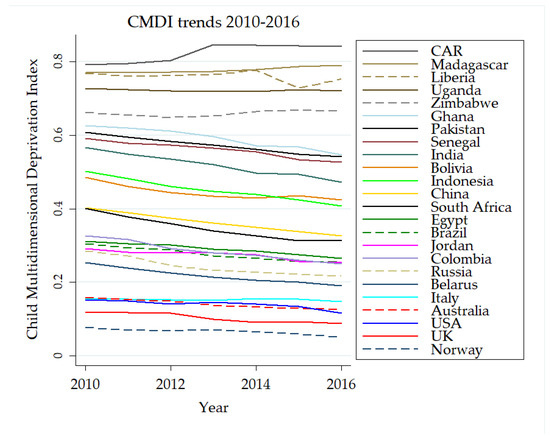
Figure 5.
Trends of child deprivation between 2010 and 2016. Source: authors’ elaboration.
The different trends between countries become clearer when we compare the level of the CMDI in 2016 and the change between 2010 and 2016, as illustrated in Figure 6. The graph is divided in four ‘quadrants’ by two lines representing, respectively, positive and negative change (vertical line on the 0), and high vs. low level of child deprivation, corresponding to a level of 0.30.
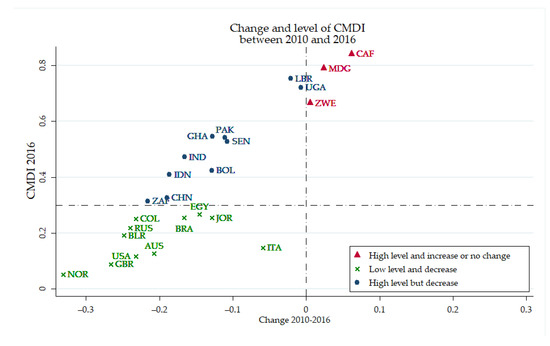
Figure 6.
Change and level in child deprivation between 2010 and 2016. Source: authors’ elaboration.
Countries in the first quadrant, in red, are countries with high level of deprivation of the CMDI, and which have also experienced an increase in the level of deprivation between 2010 and 2016; Central African Republic, Madagascar, and Zimbabwe all fall in this quadrant. This is very problematic when we consider the already poor resources of these countries.
Countries in the fourth quadrant, in dark blue, are countries with high level of deprivation in 2016, which, however, have witnessed a decrease in child deprivation. Finally, the third quadrant showcases the ‘best performers’: countries with a low level of deprivation that have seen a decrease in recent years. However, it should be noted that the decrease in deprivation is quite small for all countries, not surpassing −0.32 of Norway. Moreover, it can be noted that for some countries, the decrease in the value of the CMDI is quite small: Liberia and Uganda, for example, are very close to the vertical line, as well as Italy (even if at a low level of deprivation).
5. Conclusions
This paper presents and applies a novel composite index to measure child multidimensional deprivation, the Child Multidimensional Deprivation Index (CMDI). The aim of the index is to measure and track progress towards the reduction of child deprivation and poverty. The CMDI uses the core dimensions of child deprivation as defined by UNICEF [4,5] and then used in the subsequent measures of multidimensional child poverty [6]. We can highlight three main contributions and novelties of our study. Firstly, deprivation is measured in a continuum at the country level, starting from aggregated data. We move from a definition of child deprivation rooted in individual microdata, to a broader assessment at the country level. We also shift from classic poverty measures, such as poverty headcount derived from a poverty line to a continuous index of deprivation, which allows for a more nuanced understanding and monitoring of child deprivation. Secondly, the CMDI is derived from the Multidimensional Synthesis of Indicators (MSI) as a method of aggregation, which takes into account the heterogeneity of outcomes, thus allowing for overcoming some of the main limitations of conventional aggregation functions such as the arithmetic and geometric means. The use of the MSI implies that the substitutability of dimensions depends on the overall level of achievement. Finally, the seven dimensions selected by UNICEF in the severe deprivations approach are complemented by two other dimensions also capturing the environmental dimensions of sustainability, which are, indeed, much more relevant in the Agenda 2030 and address the multi-faceted nature of child deprivation mentioned in SDG1. The selected dimensions are: economic resources, health, nutrition, education, information, water, sanitation, environment, and shelter environment. The main difference with the core dimensions of child deprivation is in the use of economic resources as a proxy for household resources, instead of shelter quality. The two dimensions of environmental sustainability are measured by the level of CO2 emissions of a country, and the percentage of the population having access to clean fuels. Data were collected from different international sources and aggregated in a dataset covering the years from 2010 to 2016 for 24 selected countries: Australia, Belarus, Bolivia, Brazil, the Central African Republic, China, Colombia, Egypt, Ghana, India, Indonesia, Italy, Jordan, Liberia, Madagascar, Norway, Pakistan, Russia, Senegal, South Africa, Uganda, the United Kingdom, the USA, and Zimbabwe. The dimensions can already be used as a scoreboard to assess the level of countries in each different area; however, the CMDI gives an overview of the level and progress towards the reduction and elimination of child poverty and deprivation, including the fundamental components of environmental sustainability, while taking into account heterogeneity between dimensions. This implies that if two dimensions have a strong degree of trade-off, resulting in different outcomes, this is reflected in the final score. Given the particular method of aggregation, the CMDI also highlights trade-offs between dimensions, and can also increase transparency and readability. Finally, as with other composite indices, it can rank countries’ performance, and benchmark countries’ progress along each dimension.
Results demonstrate that, using CMDI, we can monitor countries’ development (economic, social, and environmental), centered on child wellbeing. The majority of the selected countries experienced a decrease in child deprivation between 2010 and 2016. However, in many cases, the change was small for countries with both high and low levels of deprivation, while for three countries (the Central African Republic, Madagascar, and Zimbabwe) there was actually an increase in child deprivation. This is particularly worrying since these countries are already experiencing a very high level of poverty and child deprivation, as well as internal political struggles in the case of the CAR and Zimbabwe. The results also show a negative relationship between child deprivation and social spending; however, many countries saw a reduction or a very small average increase of social spending in the years post 2010. This is particularly worrying since, in the long-term, it could result in rising levels of child deprivation, especially since many of these countries show virtually no change in child deprivation in the last decade.
While some progress has been made, we are still far from substantially reducing child deprivation and promoting sustainable development. The fact that the CMDI has decreased slowly or even increased in vulnerable and poor countries is worrying. This holds true especially in the face of the current pandemic and its inevitable consequences in terms of loss of national income and, therefore, ability to invest in human development, as well as in the prospect of future challenges related to climate change. Even as the response to the current crisis has been almost overwhelmingly one of increased social support from countries [38], worsening economic conditions induced by the pandemic are likely to result in shrinking economic resources. This is particularly worrying in the light of our findings, and countries should make a substantial effort to prevent a worsening of children’s wellbeing. The progress made so far risks being reversed if action is not taken to contrast the negative effect of the current and foreseeable future crisis.
Author Contributions
Conceptualization, M.B. and L.F.; methodology, M.B. and L.F.; data analysis M.B. and L.F.; writing—original draft preparation, M.B. and L.F.; writing—review and editing, M.B. and L.F. Both authors have read and agreed to the published version of the manuscript.
Funding
This research received no external funding.
Institutional Review Board Statement
Not applicable.
Informed Consent Statement
Not applicable.
Data Availability Statement
Publicly available datasets were analyzed in this study. This data can be found here: [https://data.worldbank.org/, accessed on 10 February 2021; http://www.fao.org/faostat/en/#data, accessed on 10 February 2021; https://unstats.un.org/sdgs/indicators/database/, accessed on 10 February 2021].
Conflicts of Interest
The authors declare no conflict of interest.
References
- Wernham, M. Mapping the Global Goals for Sustainable Development and the Convention on the Rights of the Child; UNICEF: New York, NY, USA, 2016. [Google Scholar]
- UNICEF. Are We on Track to Achieve the SDGs for Children? The Situation in 2019. Progress for Every Child in the SDG Era; UNICEF: New York, NY, USA, 2019; Available online: https://data.unicef.org/resources/progress-for-every-child-in-the-sdg-era-2019/ (accessed on 15 January 2021).
- United Nations. Convention on the Rights of the Child; Ratification and Accession by General Assembly Resolution 44/25 of 20 November 1989; United Nations: New York, NY, USA, 1989. [Google Scholar]
- UNICEF. The State of the World’s Children 2005. Childhood under Threat; UNICEF: New York, NY, USA, 2004. [Google Scholar]
- Gordon, D.; Nandy, S.; Pantazis, C.; Pemberton, S.; Townsend, P. Child Poverty in the Developing World; The Policy Press University of Bristol: Bristol, UK, 2003. [Google Scholar]
- De Neubourg, C.; Chai, J.; de Milliano, M.; Plavgo, I. Cross-Country MODA Study: Multiple Overlapping Deprivation Analysis (MODA): Technical Note; Innocenti Working Paper, UNICEF Office of Research Innocenti: Florence, Italy, 2013. [Google Scholar]
- Alkire, S.; Foster, J. Counting and multidimensional poverty measurement. J. Public Econ. 2011, 95, 476–487. [Google Scholar] [CrossRef]
- UNICEF Office of Research. Worlds of Influence: Undestanding What Shapes Child Well-Being in Rich Countries; Innocenti Report Card 16; UNICEF Office of Research: Florence, Italy, 2020. [Google Scholar]
- Bronfenbrenner, U.; Ceci, S.J. Nature-nurture reconceptualized in developmental perspective: A bioecological model. Psychol. Rev. 1994, 101, 568–586. [Google Scholar] [CrossRef]
- UNICEF Office of Research. Building the Future: Children and the Sustainable Development Goals in Rich Countries; Innocenti Report Card 14; UNICEF Office of Research–Innocenti: Florence, Italy, 2017. [Google Scholar]
- Trani, J.-F.; Biggeri, M.; Mauro, V. The multidimensionality of child poverty: Evidence from Afghanistan. Soc. Indic. Res. 2013, 112, 391–416. [Google Scholar] [CrossRef]
- Roche, J.M. Monitoring progress in child poverty reduction: Methodological insights and illustration to the case study of Bangladesh. Soc. Indic. Res. 2013, 112, 363–390. [Google Scholar] [CrossRef]
- OECD. Doing Better for Children; OECD: Paris, France, 2009. [Google Scholar]
- Save the Children. The Child Development Index: Holding Governments in Account for Children’s Well-Being; Save the Children: Fairfied, CT, USA, 2008. [Google Scholar]
- UNICEF. The State of the World’s Children 1980–1981; United Nations Children’s Fund: New York, NY, USA, 1980. [Google Scholar]
- Minujín, A.; Delamonica, E.; Davidziuk, A.; Gonzalez, E.D. The definition of child poverty: A discussion of concepts and measurements. Environ. Urban. 2006, 18, 481–500. [Google Scholar] [CrossRef]
- UNICEF. Global Study on Child Poverty and Disparities; Global Policy Section Division of Policy and Planning, UNICEF: New York, NY, USA, 2007. [Google Scholar]
- Roelen, K.; Gassmann, F.; De Neubourg, C. Child poverty in Vietnam: Providing insights using a country-specific and multidimensional model. Soc. Indic. Res. 2010, 98, 129–145. [Google Scholar] [CrossRef] [PubMed][Green Version]
- Alkire, S. Measuring Acute Poverty in the Developing World. Robustness and Scope of the Multidimensional Poverty Index. World Dev. 2014, 99, 251–274. [Google Scholar] [CrossRef]
- Ferrone, L.; de Milliano, M. Multidimensional Child Poverty in three Countries in Sub-Saharan Africa. Child Indic. Res. 2018, 11, 755–781. [Google Scholar] [CrossRef] [PubMed]
- Alkire, S.; Dorji, L.; Gyeltshen, S.; Minten, T. Child Poverty in Bhutan: Insights from Multidimensional Child Poverty Index and Qualitative Interviews with Poor Children; OPHI Research in Progress 46a; Univeristy of Oxford: Oxford, UK, 2016. [Google Scholar]
- Chakravarty, S.R.; D’Ambrosio, C. The Measurement of Social Exclusion. Rev. Income Wealth 2006, 52, 377–398. [Google Scholar] [CrossRef]
- Biggeri, M.; Cuesta, J. An Integrated Framework for Child Poverty and Well-being Measurement: Reconciling Theories. Child Ind. Res. 2021, 14, 821–846. [Google Scholar] [CrossRef]
- Bradshaw, J.; Richardson, D. An index of child well-being in Europe. Child Indic. Res. 2009, 2, 319–351. [Google Scholar] [CrossRef]
- Save the Children. Stolen Childhoods. End of Childhood Report 2017; Save the Children: Fairfield, CT, USA, 2017. [Google Scholar]
- Chang, Y.-J.; Lehmann, A.; Winter, L.; Finkbeiner, M. The Sustainable Child Development Index (SCDI) for Countries. Sustainability 2018, 10, 1563. [Google Scholar] [CrossRef]
- Clark, H.; Coll-Seck, A.; Banerjee, A.; Peterson, S.; Dalglish, S.L.; Ameratu, S. A future for the world’s children? A WHO–UNICEF–Lancet Commission. Lancet Comm. 2020, 395, 605–658. [Google Scholar] [CrossRef]
- Klasen, S. Measuring Poverty and Deprivation in South Africa. Rev. Income Wealth 2000, 46, 33–58. [Google Scholar] [CrossRef]
- Morris, S.S.; Carletto, C.; Hoddinott, J.; Christiaensen, L.J. Validity of rapid estimates of household wealth and income for health surveys in rural Africa. J. Epidemiol. Community Health 2000, 54, 381–387. [Google Scholar] [CrossRef] [PubMed]
- Biggeri, M.; Mauro, V. Towards a more ‘Sustainable’ Human Development Index: Integrating the environment and freedom. Ecol. Indic. 2018, 91, 220–231. [Google Scholar] [CrossRef]
- Rosenthal, J.; Quinn, A.; Grieshop, A.P.; Pillarisetti, A.; Glass, R.I. Clean cooking and the SDGs: Integrated analytical approaches to guide energy interventions for health and environment goals. Energy Sustain. Dev. 2018, 42, 152–159. [Google Scholar] [CrossRef] [PubMed]
- Mauro, V.; Biggeri, M.; Maggino, F. Measuring and monitoring poverty and well-being: A new approach for the synthesis of multidimensionality. Soc. Indic. Res. 2018, 135, 75–89. [Google Scholar] [CrossRef]
- Bourguignon, F.; Chakravarty, S.R. The measurement of multidimensional poverty. J. Econ. Inequal. 2003, 1, 25–49. [Google Scholar] [CrossRef]
- Klugman, J.; Rodriguez, F.; Choi, H.-J. The HDI 2010: New controversies, old critiques. J. Econ. Inequal. 2011, 9, 249–288. [Google Scholar] [CrossRef]
- Maggino, F. Indicator Development and Construction. In Encyclopedia of Quality of Life and Well-Being Research; Michalos, A.C., Ed.; Springer: Dordrecht, The Netherlands, 2014; pp. 3190–3197. [Google Scholar]
- UNESCO; UNICEF; The World Bank. What Have We Learnt? Overview of Findings from a Survey of Ministries of Education on National Responses to COVID-19; UNESCO: Paris, France; New York, NY, USA; UNICEF: Florence, Italy; The World Bank: Washington, DC, USA, 2020. [Google Scholar]
- Chzhen, Y.; Handa, S.; Nolan, B.; Cantillon, B. (Eds.) Children of Austerity: Impact of the Great Recession on Child Poverty in Rich Countries; Oxford University Press: Oxford, UK, 2017. [Google Scholar]
- Gentilini, U.; Almenfi, M.; Dale, P. Social Protection and Jobs Responses to COVID-19: A Real-Time Review of Country Measures; World Bank Working Paper Series; The World Bank: Washington, DC, USA, 2020. [Google Scholar]


Publisher’s Note: MDPI stays neutral with regard to jurisdictional claims in published maps and institutional affiliations. |
© 2021 by the authors. Licensee MDPI, Basel, Switzerland. This article is an open access article distributed under the terms and conditions of the Creative Commons Attribution (CC BY) license (https://creativecommons.org/licenses/by/4.0/).