Article

Understanding Hazardous Waste Exports for Disposal in Europe: A Contribution to Sustainable Development

by
Carmen Callao
1,*,
M. Pilar Latorre
2 and
Margarita Martinez-Núñez
3
1
Legal Department, Universidad San Jorge, 50830 Zaragoza, Spain
2
Department of Business & Administration, Facultad de Ciencias Sociales y del Trabajo, University of Zaragoza, 50009 Zaragoza, Spain
3
Department of Management Engineering, Business Administration and Statistics, ETSI Sistemas de Telecomunicación, Technical University of Madrid, 28040 Madrid, Spain
*
Author to whom correspondence should be addressed.
Sustainability 2021, 13(16), 8905; https://doi.org/10.3390/su13168905
Submission received: 7 June 2021 / Revised: 29 July 2021 / Accepted: 31 July 2021 / Published: 9 August 2021

Abstract

:
The concept of sustainable development was introduced in Europe by the Treaty of Amsterdam (1997) and was extended to waste management in the Waste Framework Directive. In order to achieve sustainable development, hazardous waste (HW) must be managed safely and in accordance with regulations. This also applies to worldwide HW transport, especially when HW is shipped for disposal. The United Nations, through the Basel Convention, aims to prevent the export of HW from developed countries to developing countries for disposal. In Europe, HW shipments are regulated by Regulation (EC) No. 1013/2006 of the European Parliament and by the Council of 14 June 2006 on shipments of waste. Additionally, all HW shipments must be in accordance with two principles contained in the Waste Framework Directive: proximity and self-sufficiency. Using data from 2014 and network analysis methodology, this paper fills the gaps in the scientific literature by looking at how shipments of HW travel for disposal in Europe, how the regulations affect these shipments and how GDP per capita influences the shipment of waste. The results show that countries with a high GDP per capita play an important role in the network (having the highest in-degree) and that the absence of landfill taxes for HW does not influence HW shipments for disposal. Therefore, countries in the EU act in accordance with the proximity and self-sufficiency principles.

1. Introduction

Sustainable development is a fundamental objective of the EU and was included in the 1997 Treaty of Amsterdam [1]. Since then, the Sustainable Development Strategy has gone through a great revolution.
Sustainable development includes waste management as the Waste Framework Directive (WFD) urges Member States to “promote and support sustainable production and consumption models” and introduces the United Nations Sustainable Development Goals in its objectives, showing the relation between waste management and sustainability.
Although sustainability is an aim of the European Union, the European waste management industry shows a weak model of sustainability [2].
The study of efficient hazardous waste (HW) management in relation to legislation can be a driving force towards the achievement of sustainable development [3]. It should be noted that, in order to achieve sustainability, certain regulations and directives must be met and fulfilled to ensure safe and environmentally sound practices are implemented. The implementation of the two environmental principles included in the WFD, proximity and self-sufficiency, affect HW exports in Europe. However, HW is not only a European concern but also a worldwide concern, especially regarding its disposal. HW disposal must be carried out safely and controlling HW shipments is essential to determine where and how such disposal takes place.
In the analysis of HW shipments transported for disposal, one must take into account how they affect sustainability. On the one hand, shipments of HW affect sustainability through carbon emissions, as road transport has a great impact on greenhouse gas (GHG) emissions [4,5,6]. However, an analysis of the regulations applying to the shipment of waste is also important, as transboundary waste shipments contribute to efficient waste management [7], and trade policies also affect environmental quality [8] and shipments.
Understanding these regulations and policy implications is key to achieving the Sustainable Development Goals [9].
Finally, disposal in landfill sites or in incineration facilities has a great impact on the environment and therefore on sustainability [10,11,12,13,14].
The main research problem is the lack of information on how HW is transported and disposed of in Europe, and the relationship between HW disposal shipments and compliance with European environmental laws. This article analyses different aspects of sustainability related to HW management and HW shipments and contributes by: (1) deepening the analysis of waste shipments in Europe and the way in which landfill taxes affect waste shipments; (2) analysing HW regulations and the adherence to the principles of proximity and self-sufficiency, and; (3) presenting a qualitative analysis of HW shipments for disposal using different variables – GDP, HW generation and the amount of HW shipped for disposal. To fulfil these aims, network analysis is used to display the importance of networks, giving us a picture of HW shipments, and showing the communities which arise in relation to HW exports for disposal.
Before the methodology is set out, there is a review of key aspects of HW shipments for disposal: a legislative review, including logistics, and a brief analysis of costs and capacity as they relate to the disposal of HW.

2. Objectives and Scope to Present Legislative and Literature Review

2.1. Objectives

Research literature shows how hazardous waste travels worldwide for disposal from rich countries to poor countries [15], making GDP an important element in HW shipments. European countries cannot export HW for disposal to countries outside the Organization for Economic Co-operation and Development. In order to achieve their objectives and fulfill regulations, countries can use different policies and landfill taxes.
In this research we answer the following questions, not yet analyzed by researchers:
-
Does HW travel within Europe for disposal to countries with a low or high GDP?
-
How do countries interact to fulfill self-sufficiency and proximity principles?
With these questions we try to fill the gap in the research literature about how HW travels and the relationship between HW shipments and legal compliance with European environmental laws.

2.2. Scope

The geographical scope of the research is Europe.
Regarding waste management the scope is Hazardous Waste exports for disposal. The year analyzed is 2014.
It must be pointed out that the scope of this research has several limitations. Firstly, due the research time, only 2014 data of hazardous waste shipments for disposal have been used in the network analysis. Secondly, not all European countries are studied, as Eurostat only has data for the countries included in the table. Thirdly, no data on number of landfills in each country have been used. Finally, the network is made from legal and official data from Eurostat, even if data from illegal shipments are important to understand the impact on sustainability.

2.3. Literature Review: The Origin of the Restriction of HW Exports

The Basel Convention controls HW transport for disposal worldwide. The EU, as part of the Basel Convention, has incorporated its provisions through the European Waste Shipment Regulation (EWSR) [16].
The EWSR was modified in 2014 by Regulation (EU) No 660/2014 of the European Parliament and by the Council of 15 May 2014, amending Regulation (EC) No 1013/2006 on shipments of waste and aiming to strengthen inspections of waste shipments, in order to discourage illegal shipping. Even after this amendment, loopholes in the legislation have been found [17].
Recently, and after China’s plastic waste ban, the EWSR has been modified by the Commission Delegated Regulation (EU) 2020/2174 of 19 October 2020 amending Annexes IC, III, IIIA, IV, V, VII and VIII of Regulation (EC) No 1013/2006 of the European Parliament and of the Council on shipments of waste. China’s ban was caused by plastic pollution [18] and will affect the plastic waste trade networks which have been hereto established [19], as well as the global circular economy [20].
Besides the Basel Convention and the EWSR, Directive 2008/98/EC on waste management includes two principles connected with waste shipments, as described in Article 16 of the WFD: self-sufficiency and proximity. The self-sufficiency principle indicates that “Member States shall take appropriate measures, in cooperation with other Member States where this is necessary or advisable, to establish an integrated and adequate network of waste disposal installation. The network shall be designed to enable the Community as a whole to become self-sufficient in waste disposal.” The proximity principle states that “the network shall enable waste to be disposed of or recovered in one of the nearest appropriate installations by means of the most appropriate methods and technologies to ensure a high level of protection for the environment and public health.”
The proximity and self-sufficiency principles can increase the market power of local disposers [21], as Reggiani and Silvestri state, but these principles are also analyzed because of their legal importance [22,23].
Compliance with both sets of regulations, the EWSR and the WFD and its principles, should lead to fewer exports of HW for disposal, and better control the illegal traffic in waste to poor countries [17,18,24,25].
The application of the proximity principle decreases the dangers in the transport of HW [26,27,28] and the GHG emissions caused by the transport of waste by road, and the self-sufficiency principle can lead countries and companies to innovate in order to comply with the regulations [29,30,31,32].

2.4. HW Management: Costs and GDP

Waste management costs have been indicated as one of the reasons for illegal shipments [33,34] and a barrier to a circular economy in which recovery is prioritized over disposal [35,36].
GDP is an important variable in this analysis for two reasons: on the one hand, there is a link between GDP and waste generation [37,38], and, on the other, as HW travel worldwide from rich countries to poor countries, it is important to know how GDP affects the export of waste in Europe, and if HW is disposed in countries with a high or a low GDP.

2.5. HW Shipment for Disposal and Disposal Taxes

Disposal operations are classified by the WFD into 15 categories, identified with the codes D1 to D15. In research on disposal taxes and their effects, not all papers distinguish between different disposal operations [39,40,41]. Instead, they discuss disposal in general. However, Sigman’s analysis of HW taxes [42] establishes a difference between landfill disposal and incineration. Dinan [39] proposed the taxation of disposal and the establishment of a reuse subsidy. Levinson [40] studied the effect of disposal taxes on HW shipments for disposal, finding that HW disposal taxes increase the decentralisation of HW disposal. The literature on this topic has developed widely, studying not only the impact of landfill and disposal taxes [43,44,45] but also the impact of environmental taxes [46,47,48].
It is important to determine what kind of disposal operations should be taxed if the right effect is to be achieved and there is to be sustainable development. Incineration (D10) increases in countries with landfill taxes, which causes landfills (D1) to decrease [49,50,51]. Taxes and regulations that ban the landfill disposal of some types of waste have allowed the Netherlands to reduce its number of landfills [52]. Interestingly, Scharff (2014) points out that “underground storage” in Germany is in a grey area between disposal and recovery, while others recognise underground storage as a common disposal practice [53].
According to a study on landfill taxes in Europe [54], landfill prices vary among and within European countries according to waste classification (e.g. HW, non-HW and municipal solid waste). Bulgaria, Finland and Norway have no landfill taxes for HW, while in the Belgian region of Wallonia, HW is partially banned. In other countries HW is taxed, with rates ranging from less than 10 euros/tonne (Portugal) to more than 60 euros/tonne (UK, Ireland, Denmark, Czech Republic and Estonia), which may be one of the causes of the shipment of waste for disposal. Some of these countries have also established taxes on incineration to promote waste recycling (Austria, Denmark, France, The Netherlands and Norway), whereas in countries where only landfill disposal is taxed, incineration has increased.
The variation of landfill taxes is also verified by the information provided by the Confederation of European Waste-to-Energy Plants (CEWEP) [55], updated to December 2017.

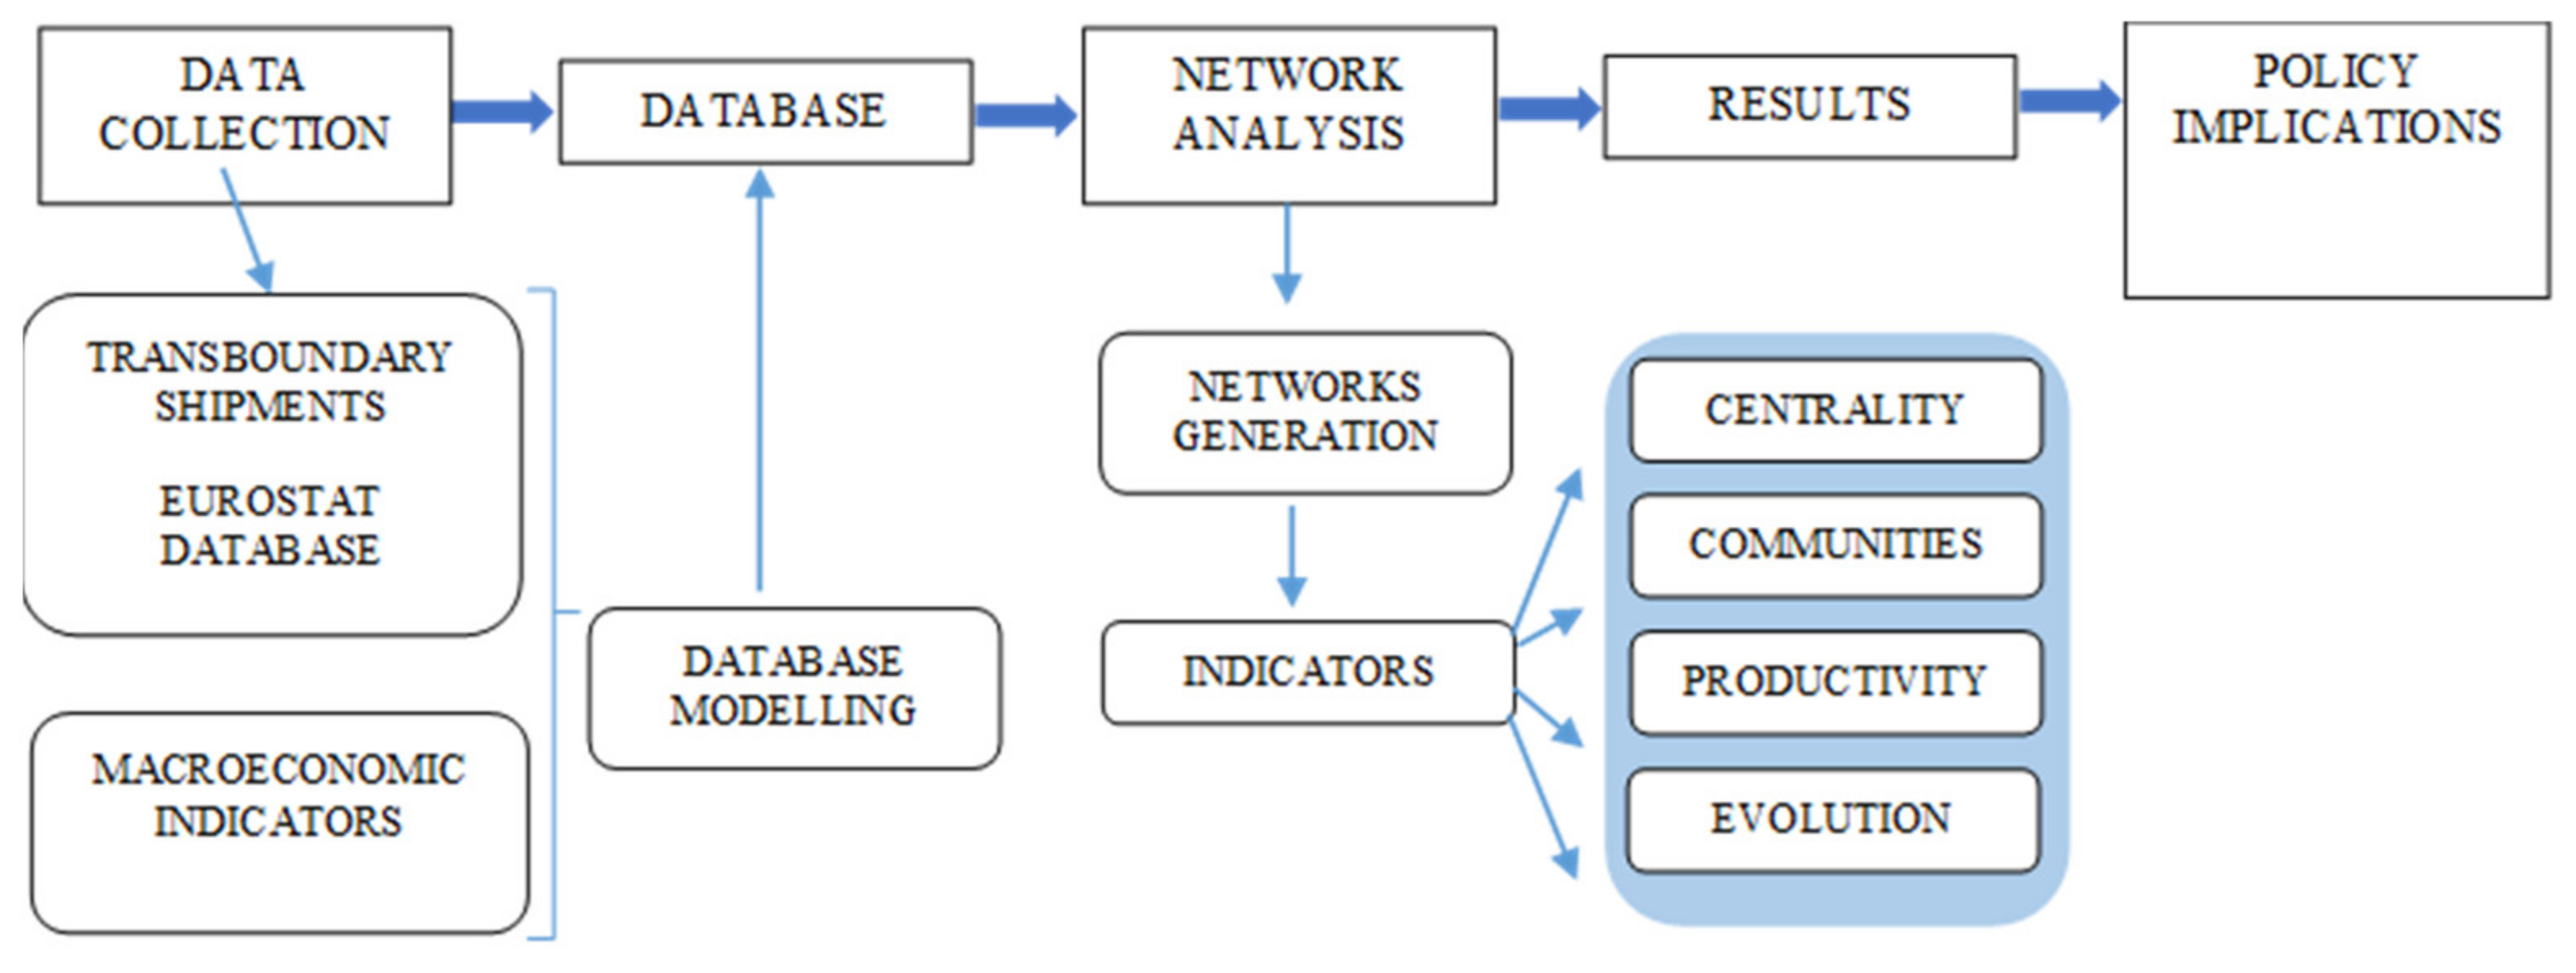
3. Materials and Methods

3.1. Network Analysis for HW Shipment for Disposal in Europe

This research uses network analysis to determine the relationships among nodes (countries) and uses Gephi to show the relevance of these nodes in the network or the communities formed by the countries, in the framework of HW exports for disposal among EU Member States. Gephi is used not only to create a trade network to discover whether the self-sufficiency and proximity principles are being adhered to, but also to relate trade/shipments to GDP per capita and HW production. This paper analyzes how these variables affect HW shipments for disposal in Europe.
The stages of this research are presented in the following diagram (Figure 1):
Gephi is a piece of software designed to explore networks and has previously been used in scientific studies related to waste management. Lepawsky [56,57] used Gephi to evaluate e-waste trade and to determine its evolution and patterns. In his research he used e-waste data import transactions reported by territories and available from United Nations Comtrade. Chen et al. [58] and Wang et al. [59] used Gephi in an analysis of the literature related to waste. While the former used data from the WoS Collection Database on the most cited publications on construction and demolition waste, the latter used data on the literature on incinerating waste to produce energy.

3.2. Network Model

Different metrics, like degree centrality, eigenvector centrality and modularity, are used to analyze how European countries are linked to HW shipments for disposal. In the networks with origins in European countries in 2014, V represents the set of countries from Europe and E represents the shipments for disposal. Let (v_i,v_j )∈E, with v_i,v_j ∈V as an edge (i.e., export) in G, representing HW shipments among countries v_i and v_j. This analysis assumes that countries’ relationships are unidirectional—that is, from exporter to importer—and, therefore, the graph is directed.

3.2.1. Centrality Network Metrics

Centrality metrics measure how important a country is in the European network. In this analysis, centrality shows the importance and the role of a given country in HW exports for disposal. Centrality includes ‘micro’ measures that show how a given node relates to the overall network [60,61]. Knowing the importance of countries (i.e., nodes) in the generated network indicates the relationships between these countries in the shipment of HW for disposal.

Degree Centrality

Degree centrality [62] represents the number of links each country/node has in the network, using the following formula:
D C v i = d v i V 1
where d(vi) denotes the degree centrality (DC) of node vi in the network. This metric counts the direct links of each country in the network.

Eigenvector Centrality

Eigenvector centrality was proposed by Bonacich [63], as follows:
λ ·   E C v i G = v j g i j E C v j G
in which gij takes the value 1 if (vi, vj) ∈ E and 0 otherwise (retrievable if G is represented using an adjacency matrix) and λ is a proportional factor (i.e., the eigenvalue).
Eigenvector centrality measures the influence of a node on a network. In other words, nodes that have high values of this measurement are well connected. Also, in this sense, they are good connectors as waste exporters and importers from a large number of countries and in large amounts. When the degree of centrality of the eigenvectors is greater, the cohesion of the group is greater.

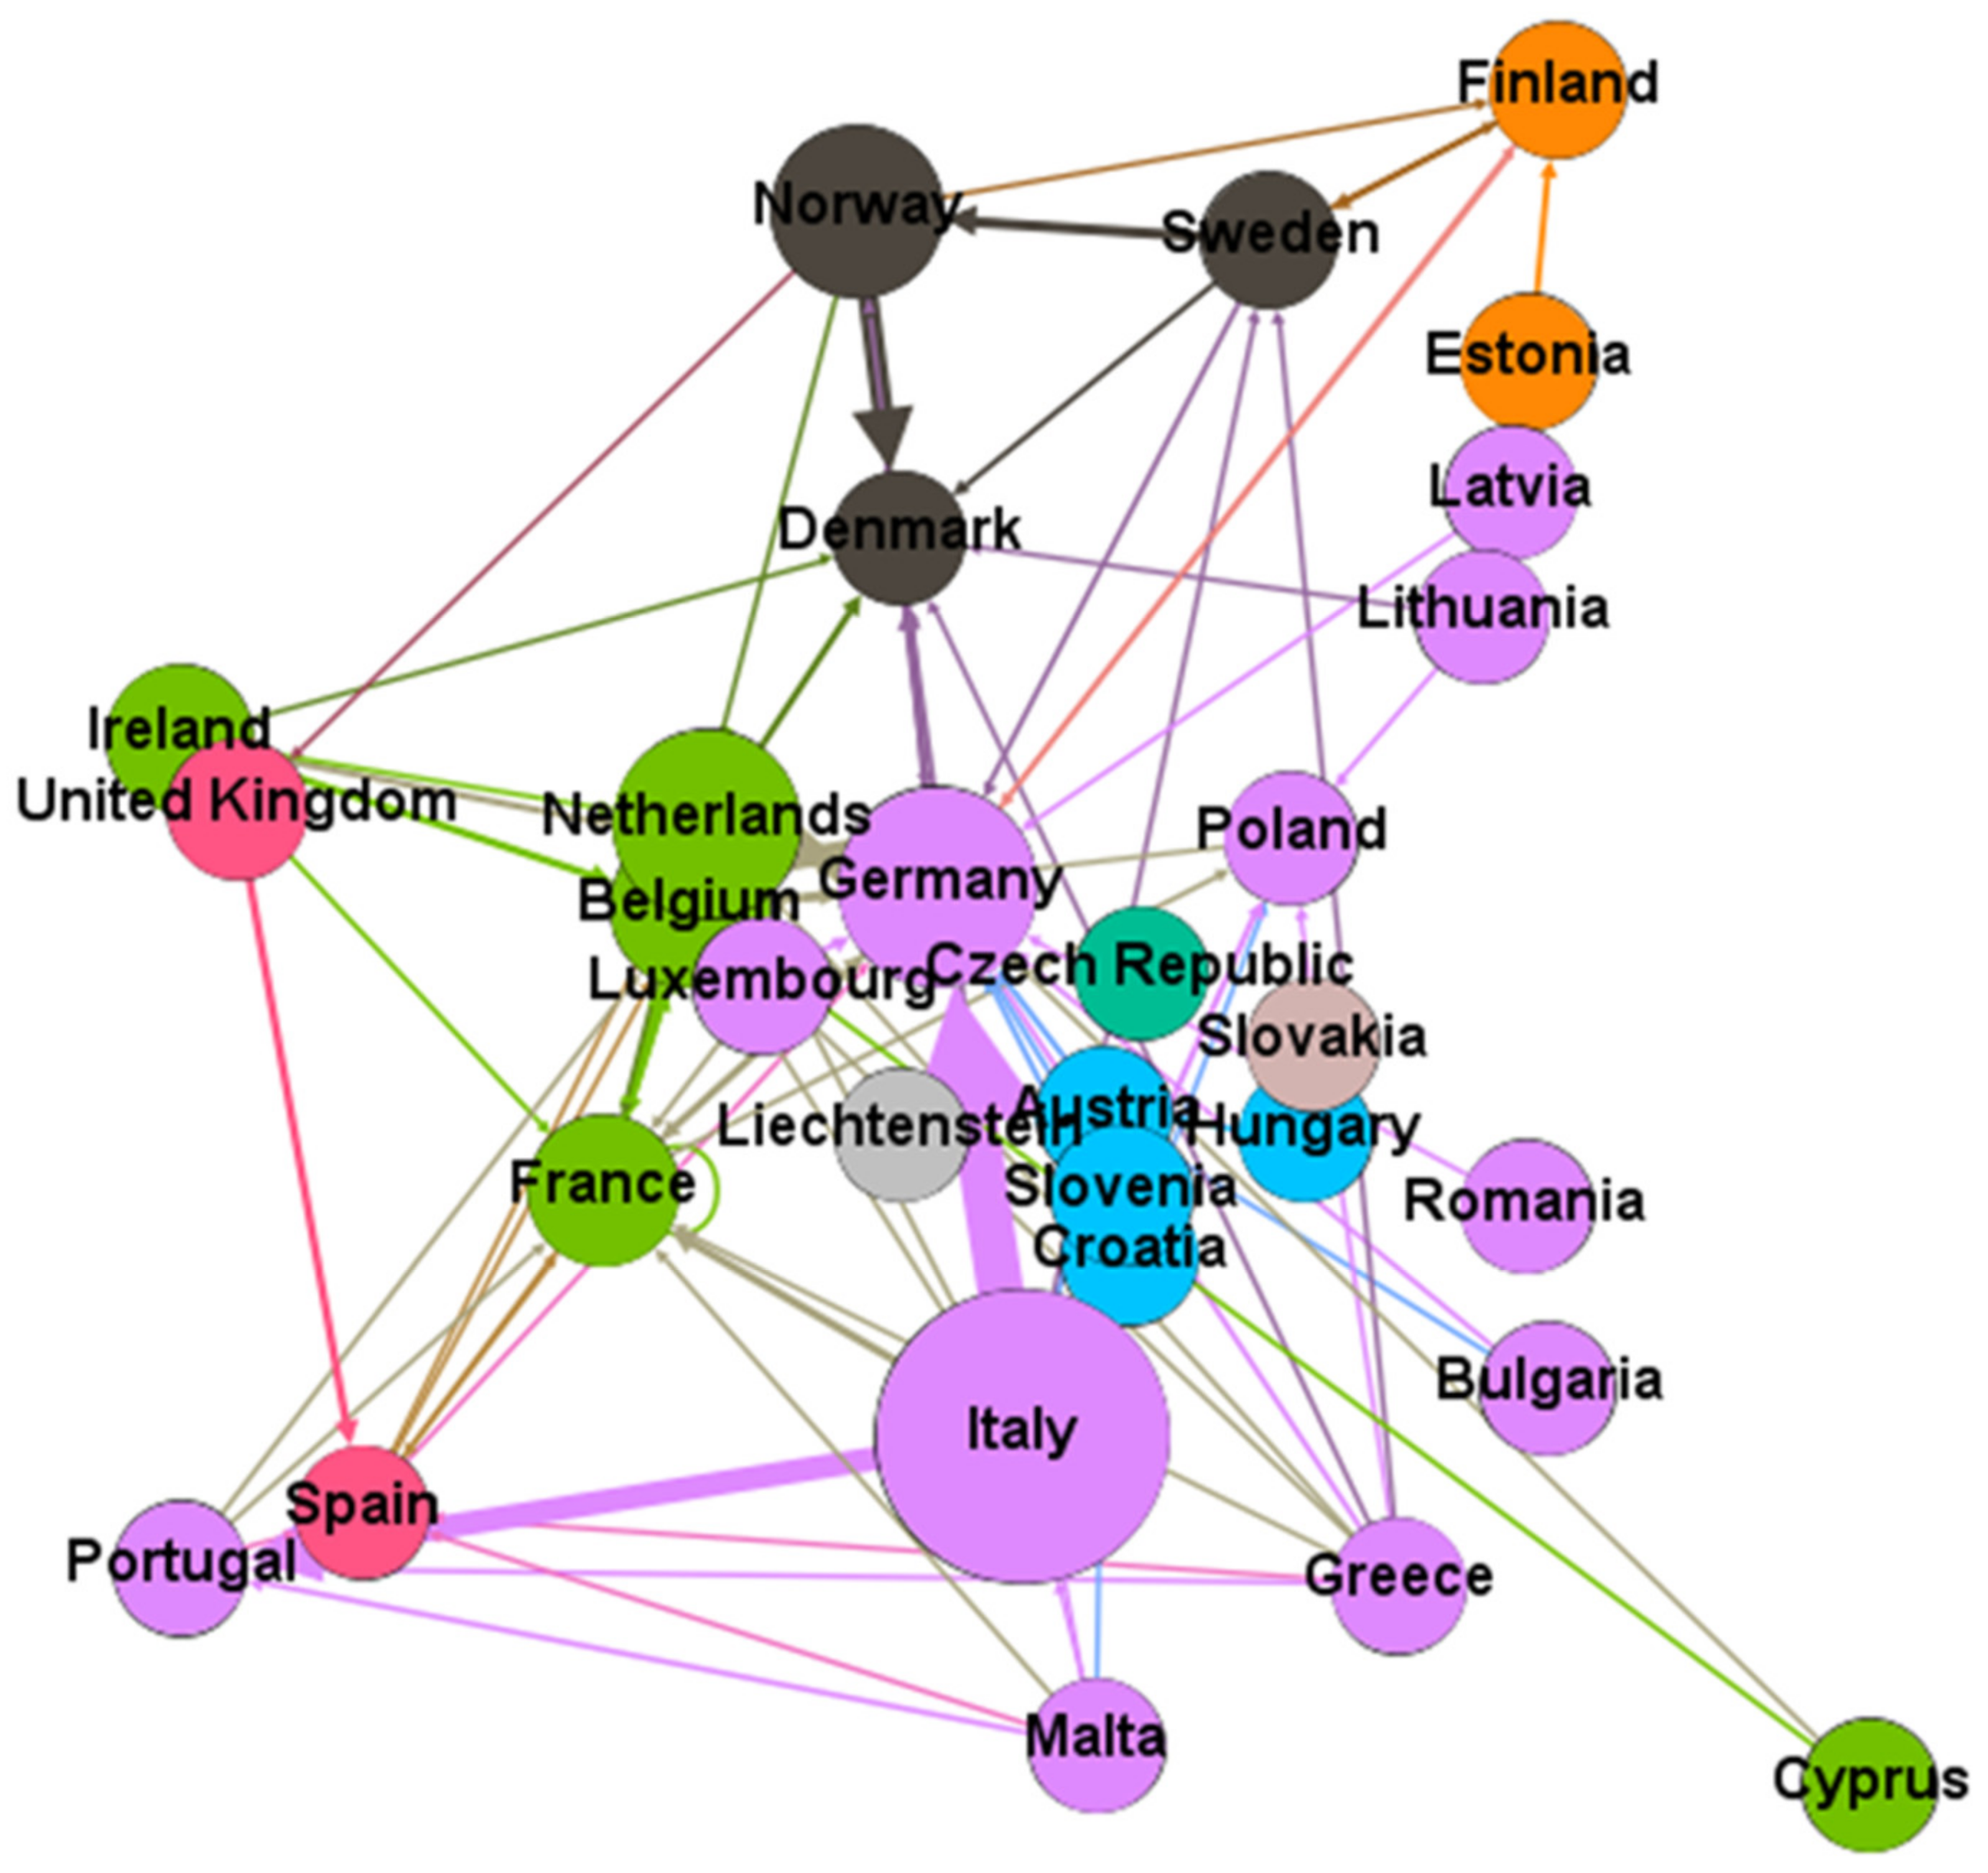
3.2.2. Structural Analysis of the Network through Modularity

Modularity is another technique used to observe the relationships of HW shipments among European countries. This notion of community partition using modularity was first proposed by Newman and Girvan in [64]. The vertices in networks create groups or communities, which means that some countries in the analyzed network have many edges (exports) while other countries have few edges. Countries in the same community are better connected, while those in different communities are less likely to be connected.
M Π , G = π Π e π π G π Π ,   π Π , π Π e π π G e π π G
where Π represents any community structure andeππ (G) represents the fraction of all edges in the network that connect nodes in π to nodes in π’.

4. Results

The network analysis was performed with the disposal data obtained through Eurostat for the year 2014. As established in Regulation (EC) No. 2150/2002 of the European Parliament and the council of 25 November 2002 on waste statistics, Member States are obliged to provide data to Eurostat. The main reasons for analyzing the year 2014 are that in 2014 (1) the Circular Economy Package was presented and (2) the EWSR was modified. The Circular Economy Package was the starting point for legislative modifications in the Directives to regulate different waste streams and try to increase recovery and recycling. It is a key year to give a picture of HW shipments before the implementation of new recycling targets and new regulatory changes.
Table 1 shows tonnes exported for disposal from 2011 to 2015.
In 2015, a decrease in the quantities exported can be observed. The reason for this may be the change in landfill tax policies in some Member States, as CEWEP shows [55]. The Netherlands reintroduced its landfill tax, Norway repealed its landfill tax and Sweden established a fee in 2015. These changes in landfill taxes may have affected the exports of HW for disposal.
This study analyzes the shipments made in 2014 on the basis of the following scientific assumptions: countries are adhering to the proximity and self-sufficiency principles; as has been shown in research, there are difficulties in finding sites for HW facilities for disposal in the case of landfills and incinerators [65,66,67] because these must meet environmental, economic and social criteria; and countries must find the best routing model for their exports to minimize transportation costs and risks [26].

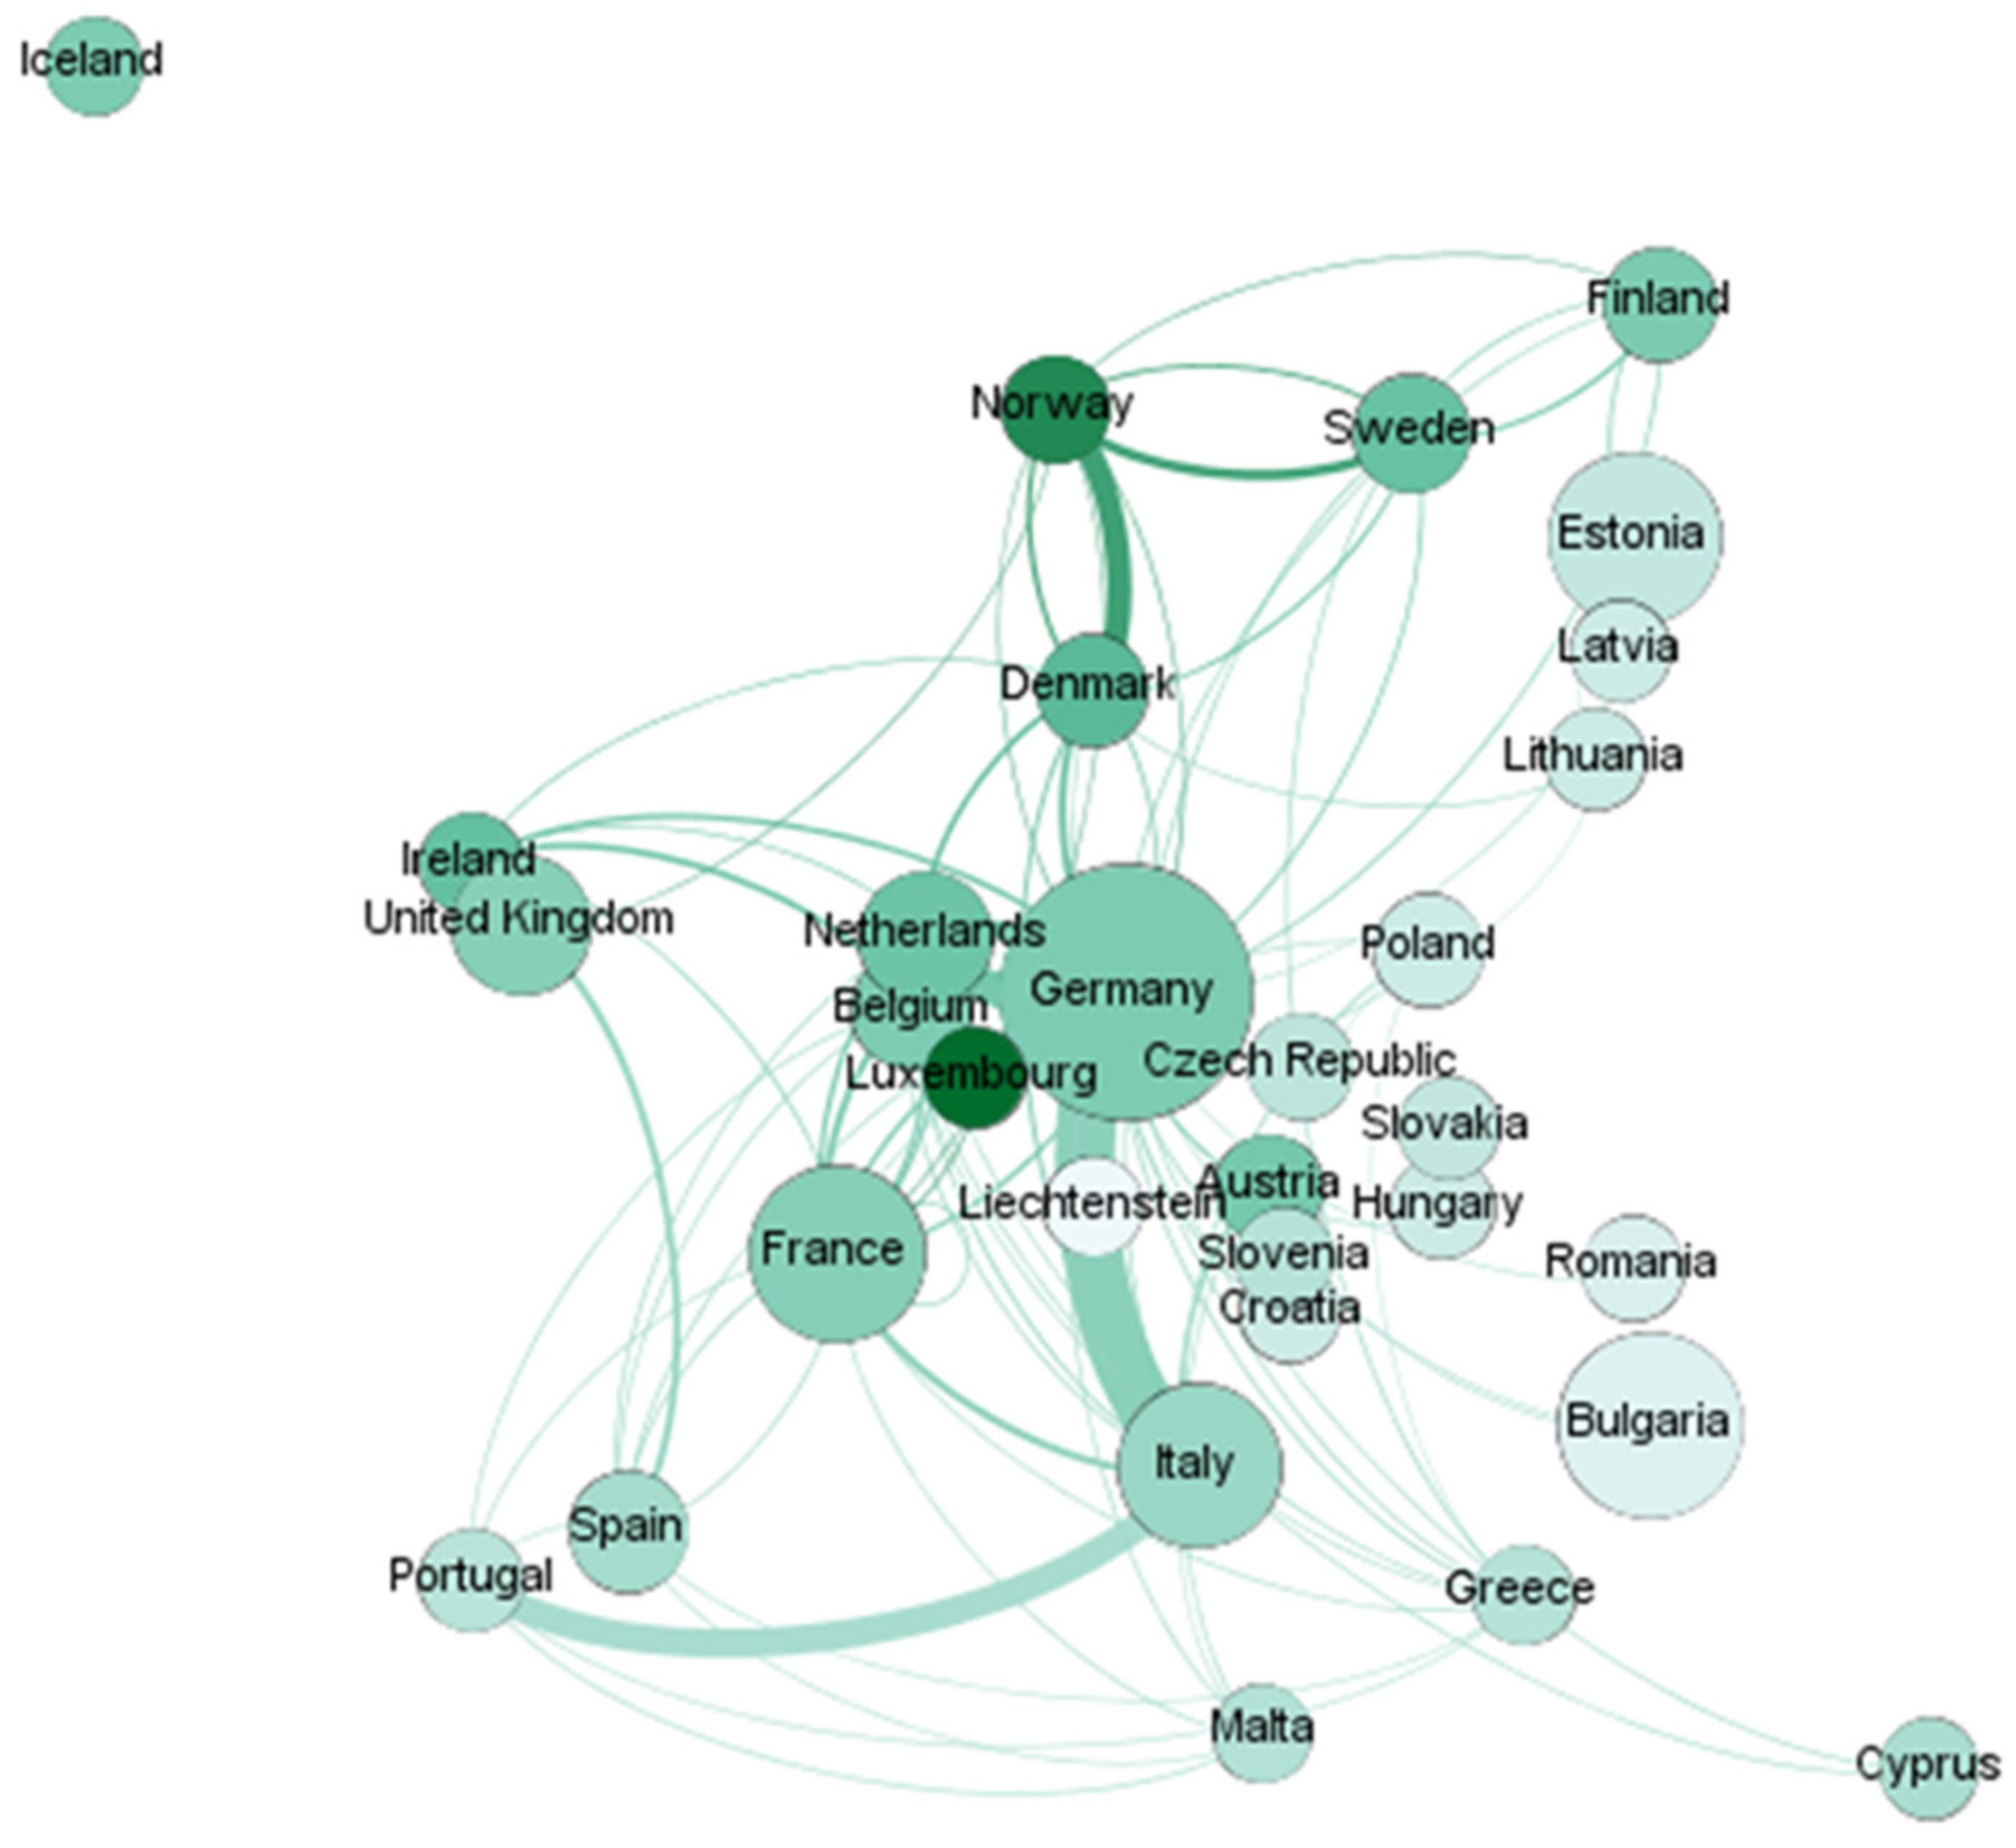
4.1. From Data to Network Generation

Taking the current network model (Section 4.1), let G = (V,E) be the graph representing the network for European waste disposal analysis, in which V is the set of operating countries and E is the set of existing shipments among them.
The figures show two different networks. Figure 2 shows the network based on the effective shipments of waste and the GDP per capita and Figure 3 shows the communities formed in the network.
In the export analysis, Italy (573,614 tonnes), Germany (237,777 tonnes) and the Netherlands (195,969 tonnes) were the countries with the greatest amounts of HW exported for disposal. The countries that generated the most HW were Germany (21,812,660 tonnes), Bulgaria (12,206,169 tonnes) and France (10,783,405 tonnes).
Table 2 shows that countries with the highest GDP per capita or with a GDP per capita above 40,000 euros in 2014, according to Eurostat, exported the most HW for disposal to other countries with a high GDP per capita.
The countries with the lowest GDP per capita or with GDP per capita lower than 15,000 euros did not receive HW for disposal, except Lithuania, which received HW for disposal from Latvia. Only two countries exported as much as 19% of the HW they produced (Malta and Slovenia), while the countries with the next highest exports exported under 10% of the waste they produced.
No data for HW landfill taxes were found from 2014. It is therefore not possible to assess whether these influenced HW shipments. However, in 2012, only three countries (Bulgaria, Finland and Norway) did not have landfill taxes for HW, and this did not appear to affect waste shipments—that is, European countries did not look to export to countries with no landfill taxes.
For degree centrality, three main nodes were considered (Germany with 26 relationships, France with 18 relationships and Belgium with 15 relationships). These countries are in central Europe, and, following the proximity principle, the logistics connectivity for these countries may have been greater. Furthermore, these three countries correspond to the highest in-degree values.
The results are shown in Table 3 and Table 4 and Figure 2 and Figure 3. Table 3 shows the amount of HW produced, the GDP per capita, the amount of HW exported, the in-degree (from how many countries waste is received or imported), the out-degree (to how many countries HW is exported), the degree (in-degree + out-degree) and the ratio of exports to generation.
Figure 2 highlights the waste tonnage generated by each node (i.e., the node size corresponds to the tonnage generated). The nodes are green, with their shades varying according to GDP per capita (a darker color corresponds to a higher GDP per capita). Finally, the thickness of the line corresponds to the amount of export flow between the countries.
Figure 3 shows the network displayed by modularity; each color represents a different community.
The node size is proportional to the waste tonnage that the country exports. The thickness of the line corresponds to the size of the export flow between the countries.
The modularity shows groups/communities in the network. These groups account for GDP per capita and show how the European countries apply the proximity and self-sufficiency principles.
Table 4 shows the communities formed in the network. The reasons for these communities are discussed in Section 6.
The largest community is the third (purple), which is composed of 10 countries: Bulgaria, Germany, Greece, Italy, Latvia, Lithuania, Luxembourg, Malta, Poland, Portugal and Romania. Germany has the highest eigencentrality score but the other members of this community have a score of nearly 0. Germany is also the country with the highest in-degree, which indicates that it receives the highest volume of HW. The second most important community is the first (green), which is composed of five countries: Belgium, Ireland, France, Cyprus and the Netherlands. Community six (blue) consists of Croatia, Hungary, Austria and Slovenia. The other communities are small.

5. Discussion

This paper analyses HW shipments for disposal, the effect of the regulations on the shipment of waste, the application of the two principles contained in the Waste Framework Directive—proximity and self-sufficiency—and the way in which GDP affects these shipments.
The adherence to these principles shows a low density network, while HW for recovery in the same year shows a high density network [68]. The density of the networks represents the links between the nodes, showing there are many fewer shipments for disposal than shipments for recovery.
The communities formed by some of the countries show that there is one country with a higher eigencentrality value [63], that is, a country that has a bigger relevance to the network.
The centrality shown by Germany can also be seen in the literature, as there has been a thorough analysis of waste treatment facilities in this country [69].
The countries with the highest in-degree (Germany 20, France 12, Belgium 15 and the Netherlands 12) are, except Belgium, countries with a high incineration capacity. These countries also have a GDP per capita above 30,000 euros.
In contrast with the “Pollution Havens” described in the research literature, in which waste travels from rich to poor countries [70,71], in Europe, HW is sent to be disposed of in countries with a high GDP.
This shows that high GDP makes these countries more able to use the best available techniques for wastes incineration [13].
The countries with high incineration capacity (France, Germany, Sweden, Denmark, the Netherlands, Austria and Finland) have a GDP per capita above 30,000 euros. These countries also have an important value for in-degree. It must be taken into account that, Sora [72] states that the opening of the incineration market threatens the application of the proximity principle.

6. Conclusions

One of the novelties of this study was the use of network analysis to fill in the gaps in the research literature about how HW travels for disposal in Europe and the relationship between HW shipments and legal compliance with environmental laws in relation to sustainability and sustainable development in Europe.
Network analysis is a useful tool to answer these research questions and to find out if HW travels for disposal to European countries with a low or high GDP and how countries interact to fulfil the principles of self-sufficiency and proximity.
HW is shipped for disposal to countries with a high GDP and high incineration capacities, which means that when countries must apply proximity and self-sufficiency principles, waste is shipped to countries with a high GDP, because these countries have better treatment facilities. This demonstrates how GDP is a determining factor in the export of waste.
Countries with a high GDP per capita have more incineration facilities; they are better prepared for the disposal of HW.
Good practices for the environment and for sustainable development are demonstrated by networks, showing coherence in the fulfilment of the principles of self-sufficiency and proximity, and the adherence to legal regulations.
The absence of a landfill tax does not affect the export of waste; countries with no landfill tax did not have higher in-degrees than countries that applied a landfill tax.
The network analysis demonstrated the relationships between countries when HW is shipped for disposal, and the association between countries generated from the adherence to the proximity and self-sufficiency principles.
Degree centrality demonstrated that countries in central Europe (Germany, France and Belgium) were the main nodes. Following the proximity principle, this may be because of better logistics connectivity. The application of these principles helps to improve efficiency in HW management systems, since it minimizes emissions from HW transport and indicates that countries have sufficient capacity for the disposal of the HW they generate.
Further research should be undertaken to establish the quantities of HW exported and imported for landfill and incineration in each country. Additionally, two circumstances may affect HW shipments: (1) the exit of the UK from the EU may affect waste shipments to and from this country and (2) the plastic waste ban imposed by China. New data may show how these circumstances affect waste trade and the stability of the communities.
The control of compliance with the analyzed regulations will be fundamental to avoid illegal waste trafficking and to protect the environment and citizens’ health.
The capacities for waste management in Europe (i.e., landfill and incineration capacities) should also be determined. In future, Europe should establish appropriate regulations that take into account all these circumstances, in order to make a better contribution to sustainable development.

Author Contributions

Conceptualization, C.C., M.P.L.; methodology, M.P.L.; software, M.P.L.; validation, M.M.-N. and M.P.L.; formal analysis, M.P.L., M.M.-N., C.C.; investigation, C.C.; resources, C.C.; data curation, C.C.; writing—original draft preparation, C.C.; writing—review and editing, M.P.L., M.M.-N. All authors have read and agreed to the published version of the manuscript.

Funding

This research received no external funding.

Institutional Review Board Statement

Not applicable.

Informed Consent Statement

Not applicable.

Data Availability Statement

The data presented in this study are openly available in https://ec.europa.eu/eurostat/cache/metadata/en/env_wasship_esms.htm (accessed on 25 June 2019).

Conflicts of Interest

The authors declare no conflict of interest.

References

  1. EUR-Lex-11997D/TXT-EN-EUR-Lex. Available online: https://eur-lex.europa.eu/legal-content/EN/TXT/?uri=CELEX:11997D/TXT (accessed on 10 July 2021).
  2. Peter, J.; Daphne, C. Sustainability and the European Waste Management Industry. Adv. Environ. Stud. 2019, 3, 198–208. [Google Scholar] [CrossRef]
  3. Callao, C.; Martinez-Nuñez, M.; Latorre, M.P. European Countries: Does common legislation guarantee better hazardous waste performance for European Union member states? Waste Manag. 2019, 84, 147–157. [Google Scholar] [CrossRef]
  4. Enzmann, J.; Ringel, M. Reducing road transport emissions in Europe: Investigating a demand side driven approach †. Sustainability 2020, 12, 7594. [Google Scholar] [CrossRef]
  5. Kazancoglu, Y.; Ozbiltekin-Pala, M.; Ozkan-Ozen, Y.D. Prediction and evaluation of greenhouse gas emissions for sustainable road transport within Europe. Sustain. Cities Soc. 2021, 70, 102924. [Google Scholar] [CrossRef]
  6. Santos, G. Road transport and CO2 emissions: What are the challenges? Transp. Policy 2017, 59, 71–74. [Google Scholar] [CrossRef]
  7. Parajuly, K.; Fitzpatrick, C. Understanding the impacts of transboundary waste shipment policies: The case of plastic and electronic waste. Sustainability 2020, 12, 2412. [Google Scholar] [CrossRef] [Green Version]
  8. Alola, A.A.; Bekun, F.V.; Sarkodie, S.A. Dynamic impact of trade policy, economic growth, fertility rate, renewable and non-renewable energy consumption on ecological footprint in Europe. Sci. Total Environ. 2019, 685, 702–709. [Google Scholar] [CrossRef] [PubMed]
  9. Adedoyin, F.F.; Alola, A.A.; Bekun, F.V. An assessment of environmental sustainability corridor: The role of economic expansion and research and development in EU countries. Sci. Total Environ. 2020, 713, 136726. [Google Scholar] [CrossRef]
  10. Sauve, G.; van Acker, K. The environmental impacts of municipal solid waste landfills in Europe: A life cycle assessment of proper reference cases to support decision making. J. Environ. Manag. 2020, 261, 110216. [Google Scholar] [CrossRef]
  11. Duan, Z.; Scheutz, C.; Kjeldsen, P. Trace gas emissions from municipal solid waste landfills: A review. Waste Manag. 2021, 119, 39–62. [Google Scholar] [CrossRef]
  12. Wang, D.; Tang, Y.T.; Long, G.; Higgitt, D.; He, J.; Robinson, D. Future improvements on performance of an EU landfill directive driven municipal solid waste management for a city in England. Waste Manag. 2020, 102, 452–463. [Google Scholar] [CrossRef] [PubMed]
  13. Best Available Techniques (BAT) Reference Document for Waste Incineration-Publications Office of the EU. Available online: https://op.europa.eu/en/publication-detail/-/publication/075477b7-329a-11ea-ba6e-01aa75ed71a1/language-en (accessed on 10 July 2021).
  14. Eriksson, O.; Finnveden, G. Energy recovery from waste incineration—The importance of technology data and system boundaries on CO2 emissions. Energies 2017, 10, 539. [Google Scholar] [CrossRef] [Green Version]
  15. Bernard, S. North–south trade in reusable goods: Green design meets illegal shipments of waste. J. Environ. Econ. Manag. 2015, 69, 22–35. [Google Scholar] [CrossRef]
  16. European Parliament, REGULATION (EC) No 1013/2006 OF THE EUROPEAN PARLIAMENT AND OF THE COUNCIL, EURLEX. 2007. Available online: https://eur-lex.europa.eu/legal-content/EN/TXT/PDF/?uri=CELEX:02006R1013-20160101&qid=1454069470717&from=EN (accessed on 3 March 2019).
  17. Morganti, M.; Favarin, S.; Andreatta, D. Illicit waste trafficking and loopholes in the European and Italian legislation. Eur. J. Crim. Policy Res. 2020, 26, 105–133. [Google Scholar] [CrossRef]
  18. Khan, S.A. Symposium on global plastic pollution. Clearly hazardous, obscurely regulated: Lessons from the basel convention on waste trade. AJIL Unbound 2020, 114, 200–205. [Google Scholar] [CrossRef]
  19. Wang, C.; Zhao, L.; Lim, M.K.; Chen, W.Q.; Sutherland, J.W. Structure of the global plastic waste trade network and the impact of China′s import Ban. Resour. Conserv. Recycl. 2020, 153, 104591. [Google Scholar] [CrossRef]
  20. Qu, S.; Guo, Y.; Ma, Z.; Chen, W.-Q.; Liu, J.; Liu, G.; Wang, Y.; Xu, M. Implications of China’s foreign waste ban on the global circular economy. Resour. Conserv. Recycl. 2019, 144, 252–255. [Google Scholar] [CrossRef]
  21. Reggiani, C.; Silvestri, F. Municipal solid waste, market competition and the EU Policy. Environ. Resour. Econ. 2017, 71, 457–474. [Google Scholar] [CrossRef] [Green Version]
  22. Jans, J.H. The Status of the Self-sufficiency and Proximity Principles with regard to the Disposal and Recovery of Waste in the European Community. J. Environ. Law 1999, 11, 121–156. [Google Scholar] [CrossRef]
  23. Reese, M. The Proximity Principle; Edward Elgar Publishing Limited: Cheltenham, UK, 2018; Chapter VI.17; pp. 219–233. [Google Scholar]
  24. Bisschop, L. Crime, Law, and Social Change; Kluwer Academic Publishers: New York, NY, USA, 2012. [Google Scholar]
  25. Reganati, F.; Pittiglio, R.; Toschi, L. How to detect illegal waste shipments? The case of the international trade in polyethylene waste. Econ. Bull. 2017, 37, 2625–2640. [Google Scholar]
  26. Yilmaz, O.; Kara, Y.; Yetis, U. Hazardous waste management system design under population and environmental impact considerations. J. Environ. Manag. 2017, 203, 720–731. [Google Scholar] [CrossRef] [PubMed] [Green Version]
  27. ReVelle, C.; Cohon, J.; Shobrys, D. Simultaneous siting and routing in the disposal of hazardous wastes. Transp. Sci. 1991, 25, 138–145. [Google Scholar] [CrossRef]
  28. Alumur, S.; Kara, B.Y. A new model for the hazardous waste location-routing problem. Comput. Oper. Res. 2007, 34, 1406–1423. [Google Scholar] [CrossRef] [Green Version]
  29. Stoever, J.; Weche, J.P. Environmental regulation and sustainable competitiveness: Evaluating the role of firm-level green investments in the context of the porter hypothesis. Environ. Resour. Econ. 2017, 702, 429–455. [Google Scholar] [CrossRef] [Green Version]
  30. Cecere, G.; Corrocher, N. Stringency of regulation and innovation in waste management: An empirical analysis on EU countries. Ind. Innov. 2016, 23, 625–646. [Google Scholar] [CrossRef]
  31. Porter, M.E.; van der Linde, C. Toward a new conception of the environment-competitiveness relationship. In Economic Costs and Consequences of Environmental Regulation; Taylor and Francis, 2018; pp. 413–434. Available online: https://www.aeaweb.org/articles?id=10.1257/jep.9.4.97 (accessed on 18 June 2020).
  32. Porter, M.E.; Advantage, C. Creating and sustaining superior performance. Compet. Advant. 1985, 167, 167–206. [Google Scholar]
  33. Bernard, S. Transboundary Movement of Waste: Second-Hand Markets and Illegal Shipments; SSRN Electron. J; 2012; Available online: https://ssrn.com/abstract=1999005 or http://dx.doi.org/10.2139/ssrn.1999005; (accessed on 25 June 2020). [Google Scholar]
  34. Boudier, F.; Bensebaa, F. Hazardous waste management and corporate social responsibility: Illegal trade of electrical and electronic waste. Bus. Soc. Rev. 2011, 116, 29–53. [Google Scholar] [CrossRef]
  35. Chen, R.; Chen, R.J.C. An integrated sustainable business and development system: Thoughts and opinions. Sustainability 2014, 6, 6862–6871. [Google Scholar] [CrossRef] [Green Version]
  36. Golev, A.; Corder, G.D.; Giurco, D.P. Barriers to industrial symbiosis: Insights from the use of a maturity grid. J. Ind. Ecol. 2015, 19, 141–153. [Google Scholar] [CrossRef]
  37. Kusch, S.; Hills, C.D. The link between e-waste and GDP—New insights from data from the pan-European region. Resources 2017, 6, 15. [Google Scholar] [CrossRef]
  38. Awasthi, A.K.; Cucchiella, F.; D’Adamo, I.; Li, J.; Rosa, P.; Terzi, S.; Wei, G.; Zeng, X. Modelling the correlations of e-waste quantity with economic increase. Sci. Total Environ. 2018, 613–614, 46–53. [Google Scholar] [CrossRef]
  39. Dinan, T.M. Economic efficiency effects of alternative policies for reducing waste disposal. J. Environ. Econ. Manag. 1993, 25, 242–256. [Google Scholar] [CrossRef]
  40. Levinson, A. NIMBY taxes matter: The case of state hazardous waste disposal taxes. J. Public Econ. 1999, 74, 31–51. [Google Scholar] [CrossRef]
  41. Palmer, K.; Walls, M. Optimal policies for solid waste disposal Taxes, subsidies, and standards. J. Public Econ. 1997, 65, 193–205. [Google Scholar] [CrossRef]
  42. Sigman, H. The effects of hazardous waste taxes on waste generation and disposal. J. Environ. Econ. Manag. 1996, 30, 199–217. [Google Scholar] [CrossRef] [Green Version]
  43. Heijnen, P.; Elhorst, J.P. The diffusion of local differentiated waste disposal taxes in the Netherlands. De Econ. 2018, 166, 239–258. [Google Scholar] [CrossRef] [Green Version]
  44. Nicolli, F.; Mazzanti, M. Landfill diversion in a decentralized setting: A dynamic assessment of landfill taxes. Resour. Conserv. Recycl. 2013, 81, 17–23. [Google Scholar] [CrossRef]
  45. Hoogmartens, R.; Eyckmans, J.; van Passel, S. Landfill taxes and Enhanced Waste Management: Combining valuable practices with respect to future waste streams. Waste Manag. 2016, 55, 345–354. [Google Scholar] [CrossRef]
  46. Hoerner, J.A.; Bosquet, B.; Andrew Hoerner-Director, J. Environmental tax reform: The European experience about the authors. The European Experience. 2001. Available online: https://citeseerx.ist.psu.edu/viewdoc/download?doi=10.1.1.474.2253&rep=rep1&type=pdf (accessed on 20 June 2020).
  47. Chiroleu-Assouline, M.; Fodha, M. From regressive pollution taxes to progressive environmental tax reforms. Eur. Econ. Rev. 2014, 69, 126–142. [Google Scholar] [CrossRef] [Green Version]
  48. Bosquet, B. Environmental tax reform: Does it work? A survey of the empirical evidence. Ecol. Econ. 2000, 34, 19–32. [Google Scholar] [CrossRef]
  49. Bartelings, H.; Linderhof, V. Effective Landfill Taxation: A Case Study for the Netherlands; 2006; pp. 1–25. Available online: https://citeseerx.ist.psu.edu/viewdoc/download?doi=10.1.1.400.3598&rep=rep1&type=pdf. (accessed on 20 June 2020).
  50. Bartelings, H.; van Beukering, P.; Kuik, O.; Linderhof, V.; Oosterhuis, F. Effectiveness of Landfill Taxation. 2005. Available online: https://www.osti.gov/etdeweb/biblio/20755664 (accessed on 20 June 2020).
  51. Olofsson, M.; Sahlin, J.; Ekvall, T.; Sundberg, J. Driving forces for import of waste for energy recovery in Sweden. Waste Manag. Res. 2005, 23, 3–12. [Google Scholar] [CrossRef] [PubMed]
  52. Scharff, H. Landfill reduction experience in The Netherlands. Waste Manag. 2014, 34, 2218–2224. [Google Scholar] [CrossRef] [PubMed]
  53. Yaramanci, U. Geoelectric exploration and monitoring in rock salt for the safety assessment of underground waste disposal sites. J. Appl. Geophys. 2000, 44, 181–196. [Google Scholar] [CrossRef]
  54. Fischer, C.; Lehner, M.; Mckinnon, D.L. Overview of the use of landfill taxes in Europe. ETC/SCP 2012, 96. Available online: http://www.embopar.pt/folder/documento/99_Landfill%20taxes%20in%20Europe.pdf (accessed on 15 December 2019).
  55. CEWEP, Landfill Taxes and Bans Overview. Available online: https://www.cewep.eu/wp-content/uploads/2017/12/Landfill-taxes-and-bans-overview.pdf (accessed on 4 July 2020).
  56. Lepawsky, J. Are we living in a post-Basel world? Area 2015, 47, 7–15. [Google Scholar] [CrossRef]
  57. Lepawsky, J. The changing geography of global trade in electronic discards: Time to rethink the e-waste problem. Geogr. J. 2015, 181, 147–159. [Google Scholar] [CrossRef]
  58. Chen, J.; Su, Y.; Si, H.; Chen, J. Managerial Areas of Construction and Demolition Waste: A Scientometric Review. Int. J. Environ. Res. Public Health 2018, 15, 2350. [Google Scholar] [CrossRef] [PubMed] [Green Version]
  59. Wang, Y.; Lai, N.; Zuo, J.; Chen, G.; Du, H. Characteristics and trends of research on waste-to-energy incineration: A bibliometric analysis, 1999–2015. Renew. Sustain. Energy Rev. 2016, 66, 95–104. [Google Scholar] [CrossRef]
  60. Freeman, L.C. A set of measures of centrality based on betweenness. Sociometry 1977, 40, 35–41. [Google Scholar] [CrossRef]
  61. Jackson, M.O. Social and Economic Networks; Princeton University Press: Princeton, NJ, USA, 2008. [Google Scholar]
  62. Clark, R.A.; McGuire, C. Sociographic Analysis of Sociometric Valuations. Child. Dev. 1952, 23, 129. [Google Scholar] [CrossRef]
  63. Bonacich, P. Power and centrality: A family of measures. Am. J. Sociol. 1987, 92, 1170–1182. [Google Scholar] [CrossRef]
  64. Newman, M.E.J.; Girvan, M. Finding and evaluating community structure in networks. Phys. Rev. 2004, 69, 026113. [Google Scholar] [CrossRef] [PubMed] [Green Version]
  65. De Feo, G.; de Gisi, S. Using MCDA and GIS for hazardous waste landfill siting considering land scarcity for waste disposal. Waste Manag. 2014, 34, 2225–2238. [Google Scholar] [CrossRef]
  66. Hariz, H.A.; Dönmez, C.Ç.; Sennaroglu, B. Siting of a central healthcare waste incinerator using GIS-based Multi-Criteria Decision Analysis. J. Clean. Prod. 2017, 166, 1031–1042. [Google Scholar] [CrossRef] [Green Version]
  67. Zakaria, B.; Abdullah, R.; Ramli, M.F.; Latif, P.A. Selection criteria using the Delphi method for siting an integrated hazardous waste disposal facility in Malaysia. J. Environ. Plan. Manag. 2013, 56, 512–530. [Google Scholar] [CrossRef] [Green Version]
  68. Latorre, M.P.; Martinez-Nuñez, M.; Callao, C. Modelling and analysing the relationship between innovation and the European Regulations on hazardous waste shipments. Int. Environ. Agreem. Polit. Law Econ. 2021, 1–20. Available online: https://link.springer.com/article/10.1007/s10784-021-09536-5 (accessed on 5 June 2020).
  69. Weber, K.; Quicker, P.; Hanewinkel, J.; Flamme, S. Status of waste-to-energy in Germany, Part I–Waste treatment facilities. Waste Manag. Res. 2020, 38 (Suppl. 1), 23–44. [Google Scholar] [CrossRef]
  70. Cotta, B. What goes around, comes around? Access and allocation problems in Global North–South waste trade. Int. Environ. Agreem. Polit. Law Econ. 2020, 20, 255–269. [Google Scholar] [CrossRef]
  71. Walters, R.; Loureiro, M.A.F. Waste crime and the global transference of hazardous substances: A Southern Green perspective. Crit. Criminol. 2020, 28, 463–480. [Google Scholar] [CrossRef]
  72. Sora, M.J.; Ventosa, I.P. Fiscalidad Ambiental E Instrumentos De Financiación De La Economía Verde; Fundación Forum Ambiental: Barcelona, Spain, 2014. [Google Scholar]
Figure 1. Block diagram.
Sustainability 13 08905 g001
Figure 2. Network of HW shipments for disposal in Europe.
Sustainability 13 08905 g002
Figure 3. Network for HW shipments for disposal in Europe (2014), displayed by modularity.
Sustainability 13 08905 g003
Table 1. Tonnes exported for disposal 2010–2015.
YearTonnes Exported for Disposal
20111,712,608
20121,509,190
20131,480,184
20141,528,391
20151,025,445
Table 2. HW exports from high-income countries.
Exporting CountriesImporting Countries
DenmarkGermany
Norway
IrelandBelgium
Germany
France
Denmark
The Netherlands
UK
LuxembourgBelgium
Germany
France
The Netherlands
SwedenDenmark
Germany
Finland
NorwayDenmark
Germany
France
Finland
Sweden
UK
Table 3. Results from the Network Analysis for HW Shipments for Disposal in Europe in 2014.
LabelExportGDP per CapitaGeneratedRatio Exp/Gen (%)IndegreeOutdegreeDegree
Belgium98,39133,8002,946,1953.3411415
Bulgaria1157550012,206,1690.01022
Czech Republic10015,4001,162,3420.01000
Denmark263744,9001,718,3940.158210
Germany237,77734,00021,812,6601.0920626
Estonia11,50413,20010,410,3210.11112
Ireland50,73841,300482,90710.51066
Greece10,75917,000221,0414.87099
Spain298422,3002,984,5180.10549
France69,38631,30010,783,4050.6412618
Croatia12,39310,300130,2399.52033
Italy573,61425,4008,923,5486.431910
Cyprus6720,400173,3770.04022
Latvia10710,300104,1420.10022
Lithuania76511,300165,4770.46134
Luxembourg14,93480,600237,1806.30145
Hungary17410,700596,5540.03011
Malta699717,90036,65419.09066
The Netherlands195,96938,6004,830,4954.068412
Austria785436,2001,272,2880.62617
Poland2110,5001,679,0510.00516
Portugal159616,300701,2280.23336
Romania697000590,3000.01011
Slovenia29,62817,500155,22919.09022
Slovakia10013,600371,2140.03000
Finland15,03634,2001,998,6930.75426
Sweden11,50340,5002,568,1540.45448
United Kingdom29,59731,0005,755,2580.51213
Iceland10033,800100010.00000
Liechtenstein100100012048.31000
Norway142,73467,4001,368,04910.43369
Table 4. Communities in the European Disposal Network.
Modularity ClassCountries (Eigencentrality)
0Belgium (0.764), Ireland (0), France (0.968), Cyprus (0), The Netherlands (0.715)
1Czech Republic (0)
2Denmark (0.524), Norway (0.388), Sweden (0.173)
3Bulgaria (0), Germany (1), Greece (0), Italy (0.002), Latvia (0), Lithuania (0.002), Luxembourg (0.170), Malta (0), Poland (0.224), Portugal (0.008), Romania (0.008)
4Estonia (0.004), Finland (0.360)
5Spain (0.246), United Kingdom (0.087)
6Croatia (0), Hungary (0), Austria (0.015), Slovenia (0)
7Slovakia (0)
8Iceland (0)
9Liechtenstein (0)
Publisher’s Note: MDPI stays neutral with regard to jurisdictional claims in published maps and institutional affiliations.

