Article

Remote Detection of Cyanobacterial Blooms and Chlorophyll-a Analysis in a Eutrophic Reservoir Using Sentinel-2

1
School of Forestry Engineering, University of Vigo, Campus A Xunqueira s/n., 36005 Pontevedra, Spain
2
CINTECX, GeoTECH Research Group, Universidade de Vigo, 36310 Vigo, Spain
*
Author to whom correspondence should be addressed.
Sustainability 2021, 13(15), 8570; https://doi.org/10.3390/su13158570
Submission received: 13 May 2021 / Revised: 20 July 2021 / Accepted: 29 July 2021 / Published: 31 July 2021
(This article belongs to the Special Issue Sustainable Water Quality Management in the Changing Environment)

Abstract

:
Harmful cyanobacterial blooms have been one of the most challenging ecological problems faced by freshwater bodies for more than a century. The use of satellite images as a tool to analyze these blooms is an innovative technology that will facilitate water governance and help develop measures to guarantee water security. To assess the viability of Sentinel-2 for identifying cyanobacterial blooms and chlorophyl-a, different bands of the Sentinel-2 satellite were considered, and those most consistent with cyanobacteria analysis were analyzed. This analysis was supplemented by an assessment of different indices and their respective correlations with the field data. The indices assessed were the following: Normalized Difference Water Index (NDWI), Normalized Differences Vegetation Index (NDVI), green Normalized Difference Vegetation Index (gNDVI), Normalized Soil Moisture Index (NSMI), and Toming’s Index. The green band (B3) obtained the best correlating results for both chlorophyll (R2 = 0.678) and cyanobacteria (R2 = 0.931). The study by bands of cyanobacteria composition can be a powerful tool for assessing the physiology of strains. NDWI gave an R2 value of 0.849 for the downstream point with the concentration of cyanobacteria. Toming’s Index obtained a high R2 of 0.859 with chlorophyll-a and 0.721 for the concentration of cyanobacteria. Notable differences in correlation for the upstream and downstream points were obtained with the indices. These results show that Sentinel-2 will be a valuable tool for lake monitoring and research, especially considering that the data will be routinely available for many years and the images will be frequent and free.

1. Introduction

Reservoirs are important freshwater reserves that have undergone highly negative impacts resulting in qualitative and quantitative changes in their physicochemical composition and impacts on fauna and flora. As a result, their ecosystems undergo a process called eutrophication, which poses a major ecological challenge for freshwater bodies [1]. With the development of industry and agriculture, large amounts of nutrients have been discharged into rivers and lakes, resulting in increased eutrophication of water bodies [2]. Cyanobacteria are a key group responsible for environmental problems associated with eutrophication processes [3]. In the past few decades, the world’s freshwater ecosystems have suffered a steady increase in cyanobacteria blooms, which have multiplied rapidly as a result of eutrophication [4,5]. These are photosynthetic prokaryote organisms [6] that can produce a wide variety of toxic secondary metabolites known as cyanotoxins [7]. The proliferation of cyanobacteria depends mainly on the availability of nutrients [8], though they are also affected by several other factors such as water temperature [9,10], pH [11,12], and light [13,14]. Harmful cyanobacterial blooms pose a serious risk to freshwater quality, affecting human and animal health [15]. Their proliferation affects water quality and thus supplies of drinking water, fishing activities and recreation [16]. Consequently, the water security of basins decreases.
In the past few decades, monitoring and quality control of water bodies as required by the Water Framework Directive have led to the emergence of new techniques and methods that can facilitate the monitoring of water quality. Water quality indicators, such as chlorophyll-a (Chl-a), total suspended matter, turbidity, depth of the secchi disc, and colored dissolved organic matter (CDOM) can be measured using remote sensing techniques. Satellite-borne spectrometric sensors are capable of detecting phytoplankton growth and composition, and especially the presence of cyanobacteria [17]. In the past, most water-quality monitoring studies were based on remote sensing employed satellite data from MERIS (Medium Resolution Imagining Spectrometer) [18], MODIS (Moderate Resolution Imaging Spectroradiometer) [19], and Landsat [20]. However, few studies focused on the recognition and monitoring of water color anomalies, due to long observation time or high spatial resolution [21]. The new series of Copernicus satellites from the European Union’s Earth Observation Program called Sentinel have now brought the Sentinel-2 (S2-A and B) into service with an MSI (Multispectral Instrument) sensor. The imagery features a spatial resolution of 10 m, 20 m, and 60 m, meaning that even small lakes can be studied [22]. Data are acquired in 13 spectral bands and radiometric resolution of the sensor is 12-bit [23]. These measurement bands have interesting applications in the estimation of phytoplankton [24] and cyanobacteria based on the measuring of their major pigments: Chl-a [25] and phycocyanin [26].
The early detection of these toxic substances produced by cyanobacteria is of interest for assessing potential risks to human health [27]. The development of a technology to obtain the concentration of cyanobacteria would facilitate the water security and help to achieve the sustainable development of ecosystems. In addition, it would provide information that could ensure good water governance. In this sense, the main objective of this research is to assess a method of continuous spatial monitoring of cyanobacteria based on multispectral images (MSI) generated by the Sentinel-2 satellite. Conventional water quality measurements are tedious and costly, in addition to complicating continuous monitoring of water status. The use of satellite imagery provides a complementary monitoring tool, supplies high spatial and temporal resolution water quality data, and greatly improves our understanding of variations in water quality in the reservoir, which generates highly relevant information for managers. In addition, this need for monitoring is increased by events such as pandemics or disasters [28]. On the one hand, ordinary but frequent sensors like Terra/Aqua MODIS provide daily observations but with coarse spatial resolutions (e.g., 250 ma 1000 m) that cannot reveal spatial details of CyanoHABs in small reservoirs. On the other hand, fine but sparse sensors such as Landsat-8 OLI can provide more spatial details of algal blooms with their fine resolution pixels, but their long revisit cycle (16 days) makes them insufficient to capture the temporal dynamics of algal blooms [29]. Sentinel-2, with a 10-day pass over Europe [30], is a promising satellite for detecting cyanobacteria, as shown by some of the most recent studies [17,31]. Most studies of this type focus on finding the bands that correlate most closely with the presence of cyanobacteria, while others analyze photosynthetic pigments. Previous studies [32,33] of other areas with similar environmental problems reveal that bands 3 and 4 (wavelength 500–650) are the most commonly used to detect cyanobacteria. For photosynthetic compounds, band 5 (705 nm) seems to be the most suitable for chlorophyll detection. Other studies focus on other pigments that could be indicative of its presence such as phycocyanin (PC) (620 nm) [34] and phycoerythrin (PE) (560 nm) [35]. However, more research is needed for near real-time operational protocols to address the different spatio-temporal variability of cyanoHABs [36]. In the study reported here, correlation analyses of concentrations of cyanobacteria and chlorophyll with the main relevant bands of Sentinel-2 were performed. Finally, the use of different indices was assessed to gauge their usefulness in the study area. Specifically, two indices established to highlight pixels in a satellite image that contains vegetation—NDVI (Normalized Difference Vegetation Index) and gNDVI (green Normalized Difference Vegetation Index) were selected and calculated with the different bands generated by Sentinel-2. These vegetation indices were supplemented by others that analyze suspended solids (NSMI-Normalized Soil Moisture Index), water quality (NDWI-Normalized Difference Water Index), and indices for analyzing Chl-a (Toming’s Index [37]). Finally, the efficacy of this methodology is assessed by performing a correlation analysis between the data collected from the reservoir in the study area. The main objective is to perform a correlation and regression analysis, from which to explore or establish relationships between the variables studied, indices and bands from Sentinel-2 images, and cyanobacteria and chlorophyll-a concentration. All this with the aim of using satellite images to help monitor eutrophied waters.

2. Materials and Methods

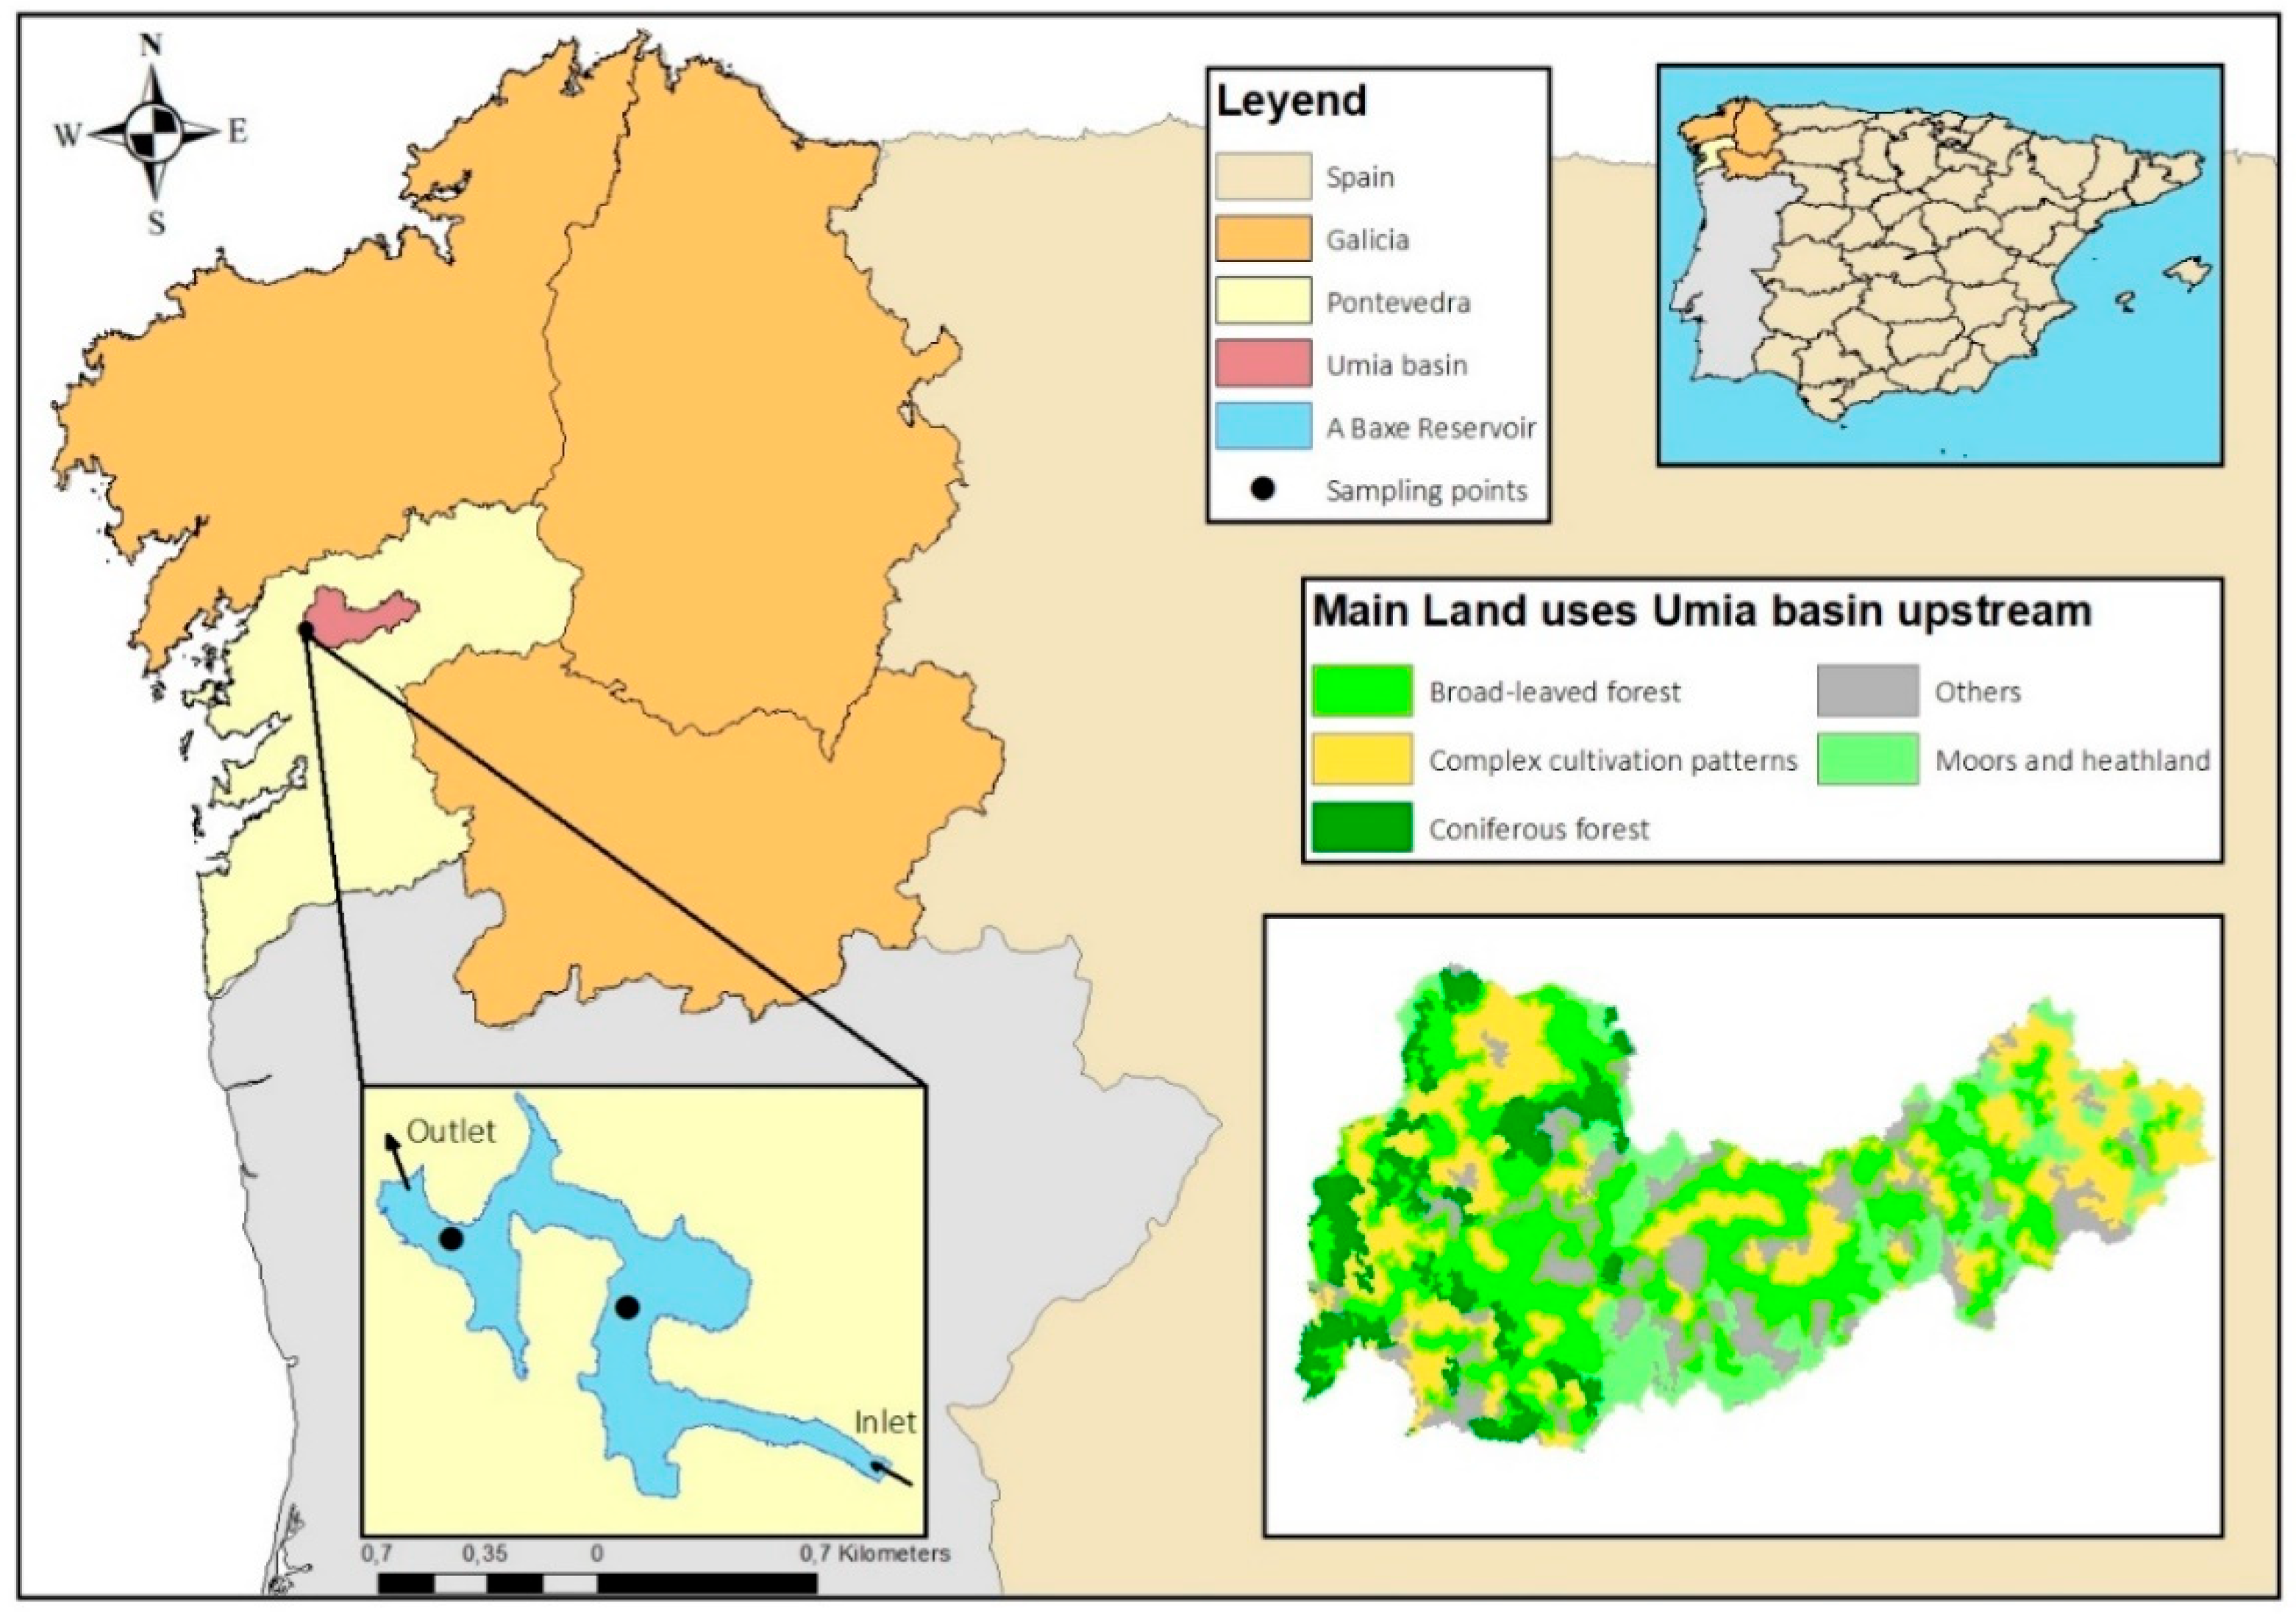
2.1. Study Area and Dataset

According to Bermúdez et al. [38], blooms of cyanobacteria (Microcystis aeruginosa) are becoming increasingly recurrent in the A Baxe reservoir in Galicia (northwestern Spain, Figure 1) as a result of increasing levels of different anthropogenic pressures in the Umia catchment basin [39]. The main land uses in the basin are shown in Figure 1: 35% broad-leaved forest, 24.8% complex cultivation patterns, 15.6% moors and heathland, 10% coniferous forest, and 15% other land uses [40]. The Umia reservoir was built in 2000 with a capacity (maximum normal level) of 8.05 hm3. The total area of the river basin upstream of the reservoir is 440.4 km2 and the average flow rate is 16.2 m3/s−1. The main tributary of the Umia is the Gallo River, which has a sub-basin area of 44.3 km2. Average rainfall in the region is almost 282 hm3/year (2018), and temperatures vary from 7.3 °C in January to 19.5 °C in July–August (2018). The watershed altitudes range from 99 m.a.s.l. in the reservoir area to 798 m in the Umia River headwaters.
Harmful algal blooms have become a persistent problem in the A Baxe reservoir. To deal with the problem, the regional government has implemented a water quality monitoring program with a network of sampling stations [41], plus an alarm system for the proliferation of cyanobacteria. According to a study by regional water authority Augas de Galicia [42], the main causes of the eutrophication process in the reservoir are: (1) the contributions of nutrients from agro-livestock activities to the river ecosystem; (2) discharges; (3) insufficient sanitation in rural areas; and (4) the elimination of riverside forest.
There were two sampling points: upstream and downstream in the reservoir (Figure 1). The following parameters were used at both sampling points throughout 2018: Chl-a concentration (mg/L) and concentration of potentially toxic cyanobacteria (cell/mL) (Appendix A). Cyanobacteria were identified microscopically and cells were counted in a Neubauer chamber using optical microscopes Kyowa Optical Medilux 12 ((Kyowa Optical Company Ltd, Tokyo, Japan) and Binocular ZUZI 122/147 (ZUZI, Nikon, Japan) connected to a Moticam 5 MP( Motic, Japan).

2.2. Remote-Sensing Datasets

The dataset used in this study is the standard Sentinel-2 Level-1C product, produced by radiometric and geometric corrections, provides spatial registration on a global reference system with sub-pixel accuracy. The Sentinel-2 Level-1C product comprises 100 km × 100 km tiles in the UTM/WGS84 projection and provides the Top-Of-Atmosphere (TOA) reflectance. The Sentinel-2 Level-1C images were downloaded from the ESA Sentinel-2 Pre-Operations Hub (https://scihub.copernicus.eu/ (accessed on 29 January 2018)). The images were processed with the free software QGIS 3.8.2, using the SCP (Semi-automatic classification) tool. All satellite data processing was performed using the Sentinel Application Platform (SNAP). Sentinel-2 is composed of bands with a spatial resolution of 10 m (band 2, band 3, band 4, and band 8), 20 m (band 5, band 6, band 7, band 11, and band 12) and 60 m (band 1, band 9, and band 10). Before processing, all bands were rescaled to 10 m resolution, using the resampling algorithm available in SNAP. To recognize water color anomalies by extracting the hue angle of a water body from a Sentinel-2 image, it is necessary to conduct pre-processing, such as atmospheric correction, band resampling, and water body extraction [21]. These 13 spectral bands that compose the satellite range from visible and near-infrared wavelengths (VNIR) to short-wave infrared (SWIR) along a 290 km orbital strip. In this case, bands 3 (560 nm), 4(665 nm) and 5 (705 nm) were analyzed. These bands were chosen because the reflectance peak between 700 and 720 nm has been used for estimating the Chl-a concentration in lake waters [43]. In addition, cyanobacteria have a wavelength range of 500 to 650 nm (bands 3–4), phycocyanin (PC) (620 nm), or phycoerythrin (PE) (560 nm) [32].
Then, an internal buffer of 10 m was set up to eliminate the edges of the reservoir and thus reduce the distortion caused by riparian vegetation. The images were downloaded for each day of the study (Appendix A) and the atmospheric correction was carried out using the Dark-Object Subtraction (DOS) methodology proposed by Chavez [44]. This process was applied to ensure that differences in reflectance are due to water and not to radiometric distortions [45]. Before extracting the reflectance, a multiple raster clipping was made with the shape file of the reservoir created earlier. This was done so that the images of all the bands could be cut in a single action. The result is a raster for each band that contains the reflectance data for the entire reservoir.

2.3. Superspectral Satellite Data Pre-Processing and Retrieval of Indices

The analysis was performed using two bands extracted from Sentinel-2 (Bands 3 and 5) and five calculated spectral indices. This was expected to improve the analytical capacity, and to obtain the bands or indices with the better correlation with cyanobaterias and Chl-a. The spectral indices used were the Normalized Difference Water Index (NDWI), the Normalized Differences Vegetation Index (NDVI), the green Normalized Difference Vegetation Index (gNDVI), the Normalized Soil Moisture Index (NSMI), and Toming’s Index (Table 1).
The NDWI, proposed by McFeeters [41], is designed to: (1) maximize the reflectance of the water body in the green band; and (2) minimize the reflectance of water body in the NIR band [50,51]. The NDVI is a dimensionless index that describes the difference between visible and near-infrared reflectance of vegetation cover. It is used to detect vegetation in different environments; in our case, it was used only to evaluate the surface level of the lake [52]. The gNDVI is resistant to atmospheric effects, and it has a greater dynamic range than the NDVI and is five times more sensitive to chl-a concentrations; this index avoids the saturation problem of the NDVI at relatively low chlorophyll concentrations [53]. The index used to obtain the value model is a transformation of Total Suspended Solids (TSS) using NSMI. NSMI is a widely used universal transformation. The values generated vary between −1 and 1, where lower figures indicate the presence of clearer water [54]. The height of the Chl-a reflectance peak between 700 and 720 nm was studied to estimate the concentration of Chl-a in the waters of lakes or reservoirs. Band 5 of Sentinel-2 analyzes this spectral region (705 nm). The logarithm studied in Toming et al. [24] was followed. This logarithm calculates the height of the peak against the baselines of band 4 (665 nm) and band 6 (740 nm).

2.4. Statistical Analysis

The experimental data were analyzed and plotted with SPSS 16.0. Pearson’s correlation was studied between Chl-a and cyanobacteria concentration in situ data (rD for the downstream point, rU for the upstream point), and the regression equation and coefficient of determination (R2) between them were calculated to determine the empirical relationship. With the data obtained from the bands analyzed and the indices calculated, the same analyses were carried out to study the correlation between the in situ values and those calculated from the satellite images. For the regression analyses, a bibliographic review was carried out. The most recent studies in this field indicate that the use of a polynomial regression model has a better fit with these data [31,55,56]. In the regression analysis between chlorophyll-a concentration and cyanobacteria concentration, the first would be the dependent variable and the second the independent variable. Furthermore, when performing the regression analyses with the Sentinel-2 information, these data would be the independent variable, while the parameters chlorophyll-a and cyanobacteria would be the dependent ones. Model performance was evaluated by using Coefficient of Determination (R2) and Student’s t-test (p = 0.05).

3. Results and Discussion
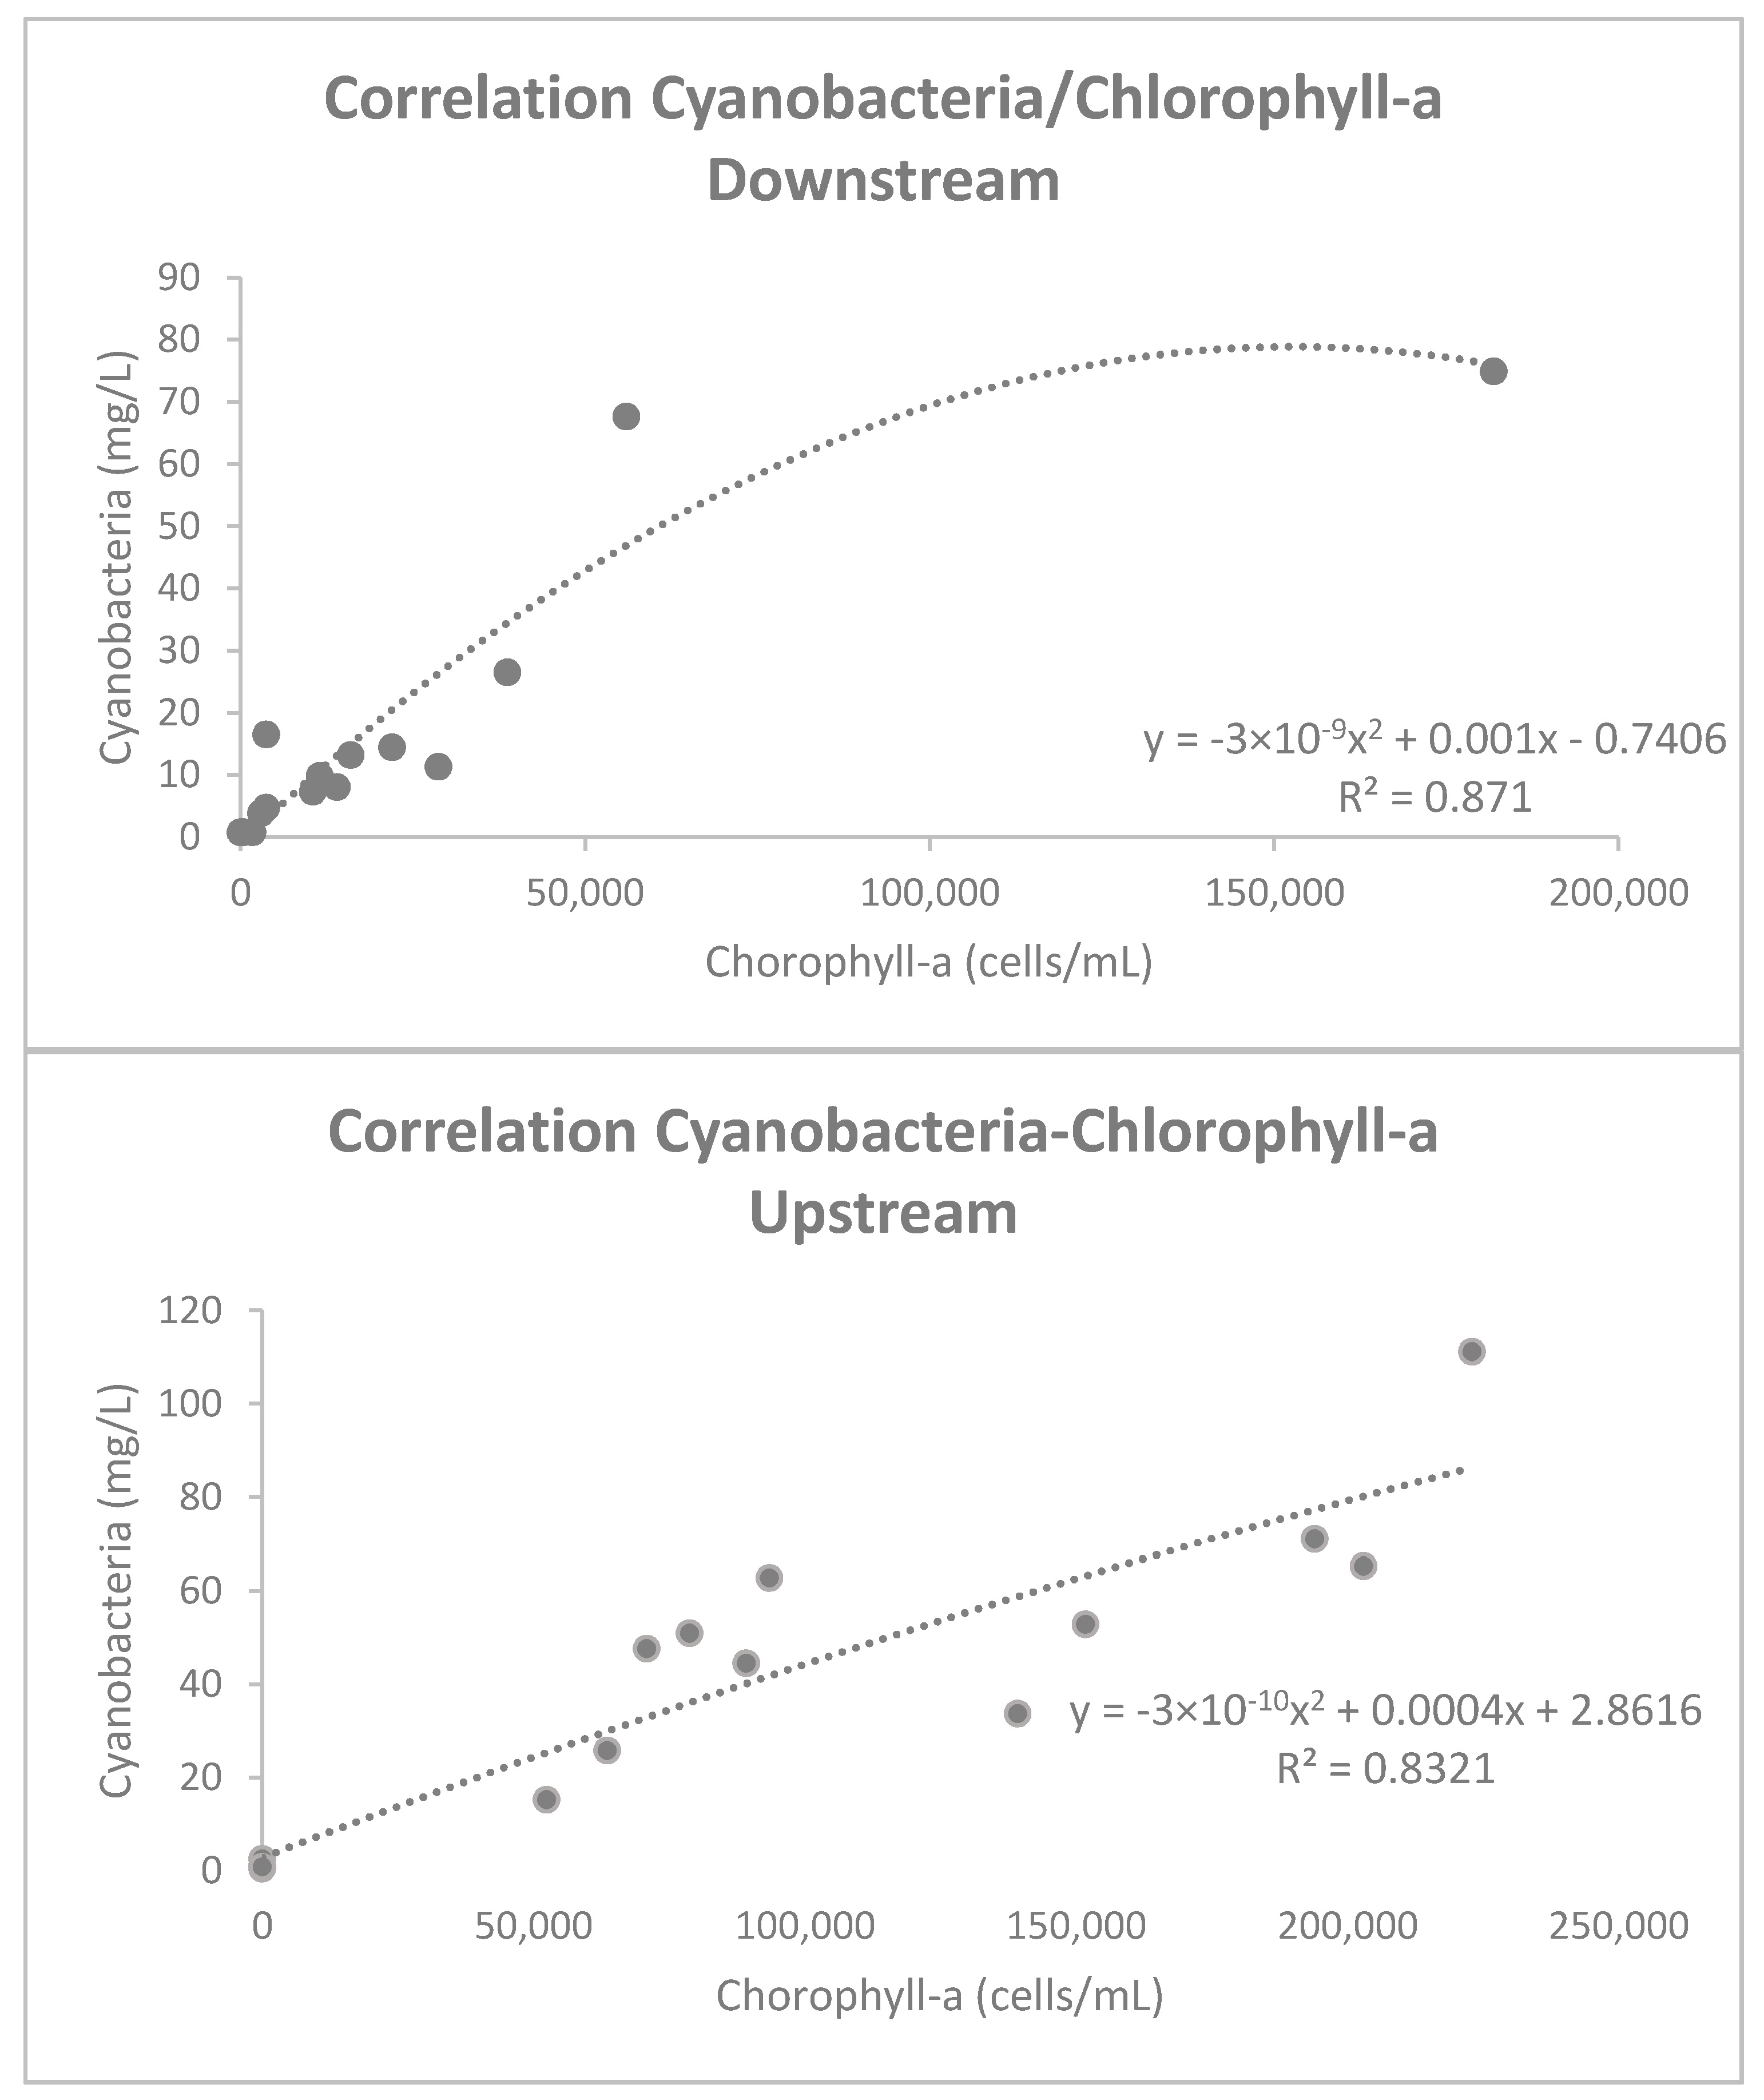
3.1. In Situ Data

At the downstream point, 98.8% of the potentially toxic cyanobacteria found in the whole sampling belonged to Microcystis sp. At the upstream point, 94.3% belonged to this genus (Appendix A). The concentration of cyanobacteria and Chl-a were more closely correlated upstream (p = 0.528 *) than downstream (p = 0.245) (α = 0.01) (Figure 2).

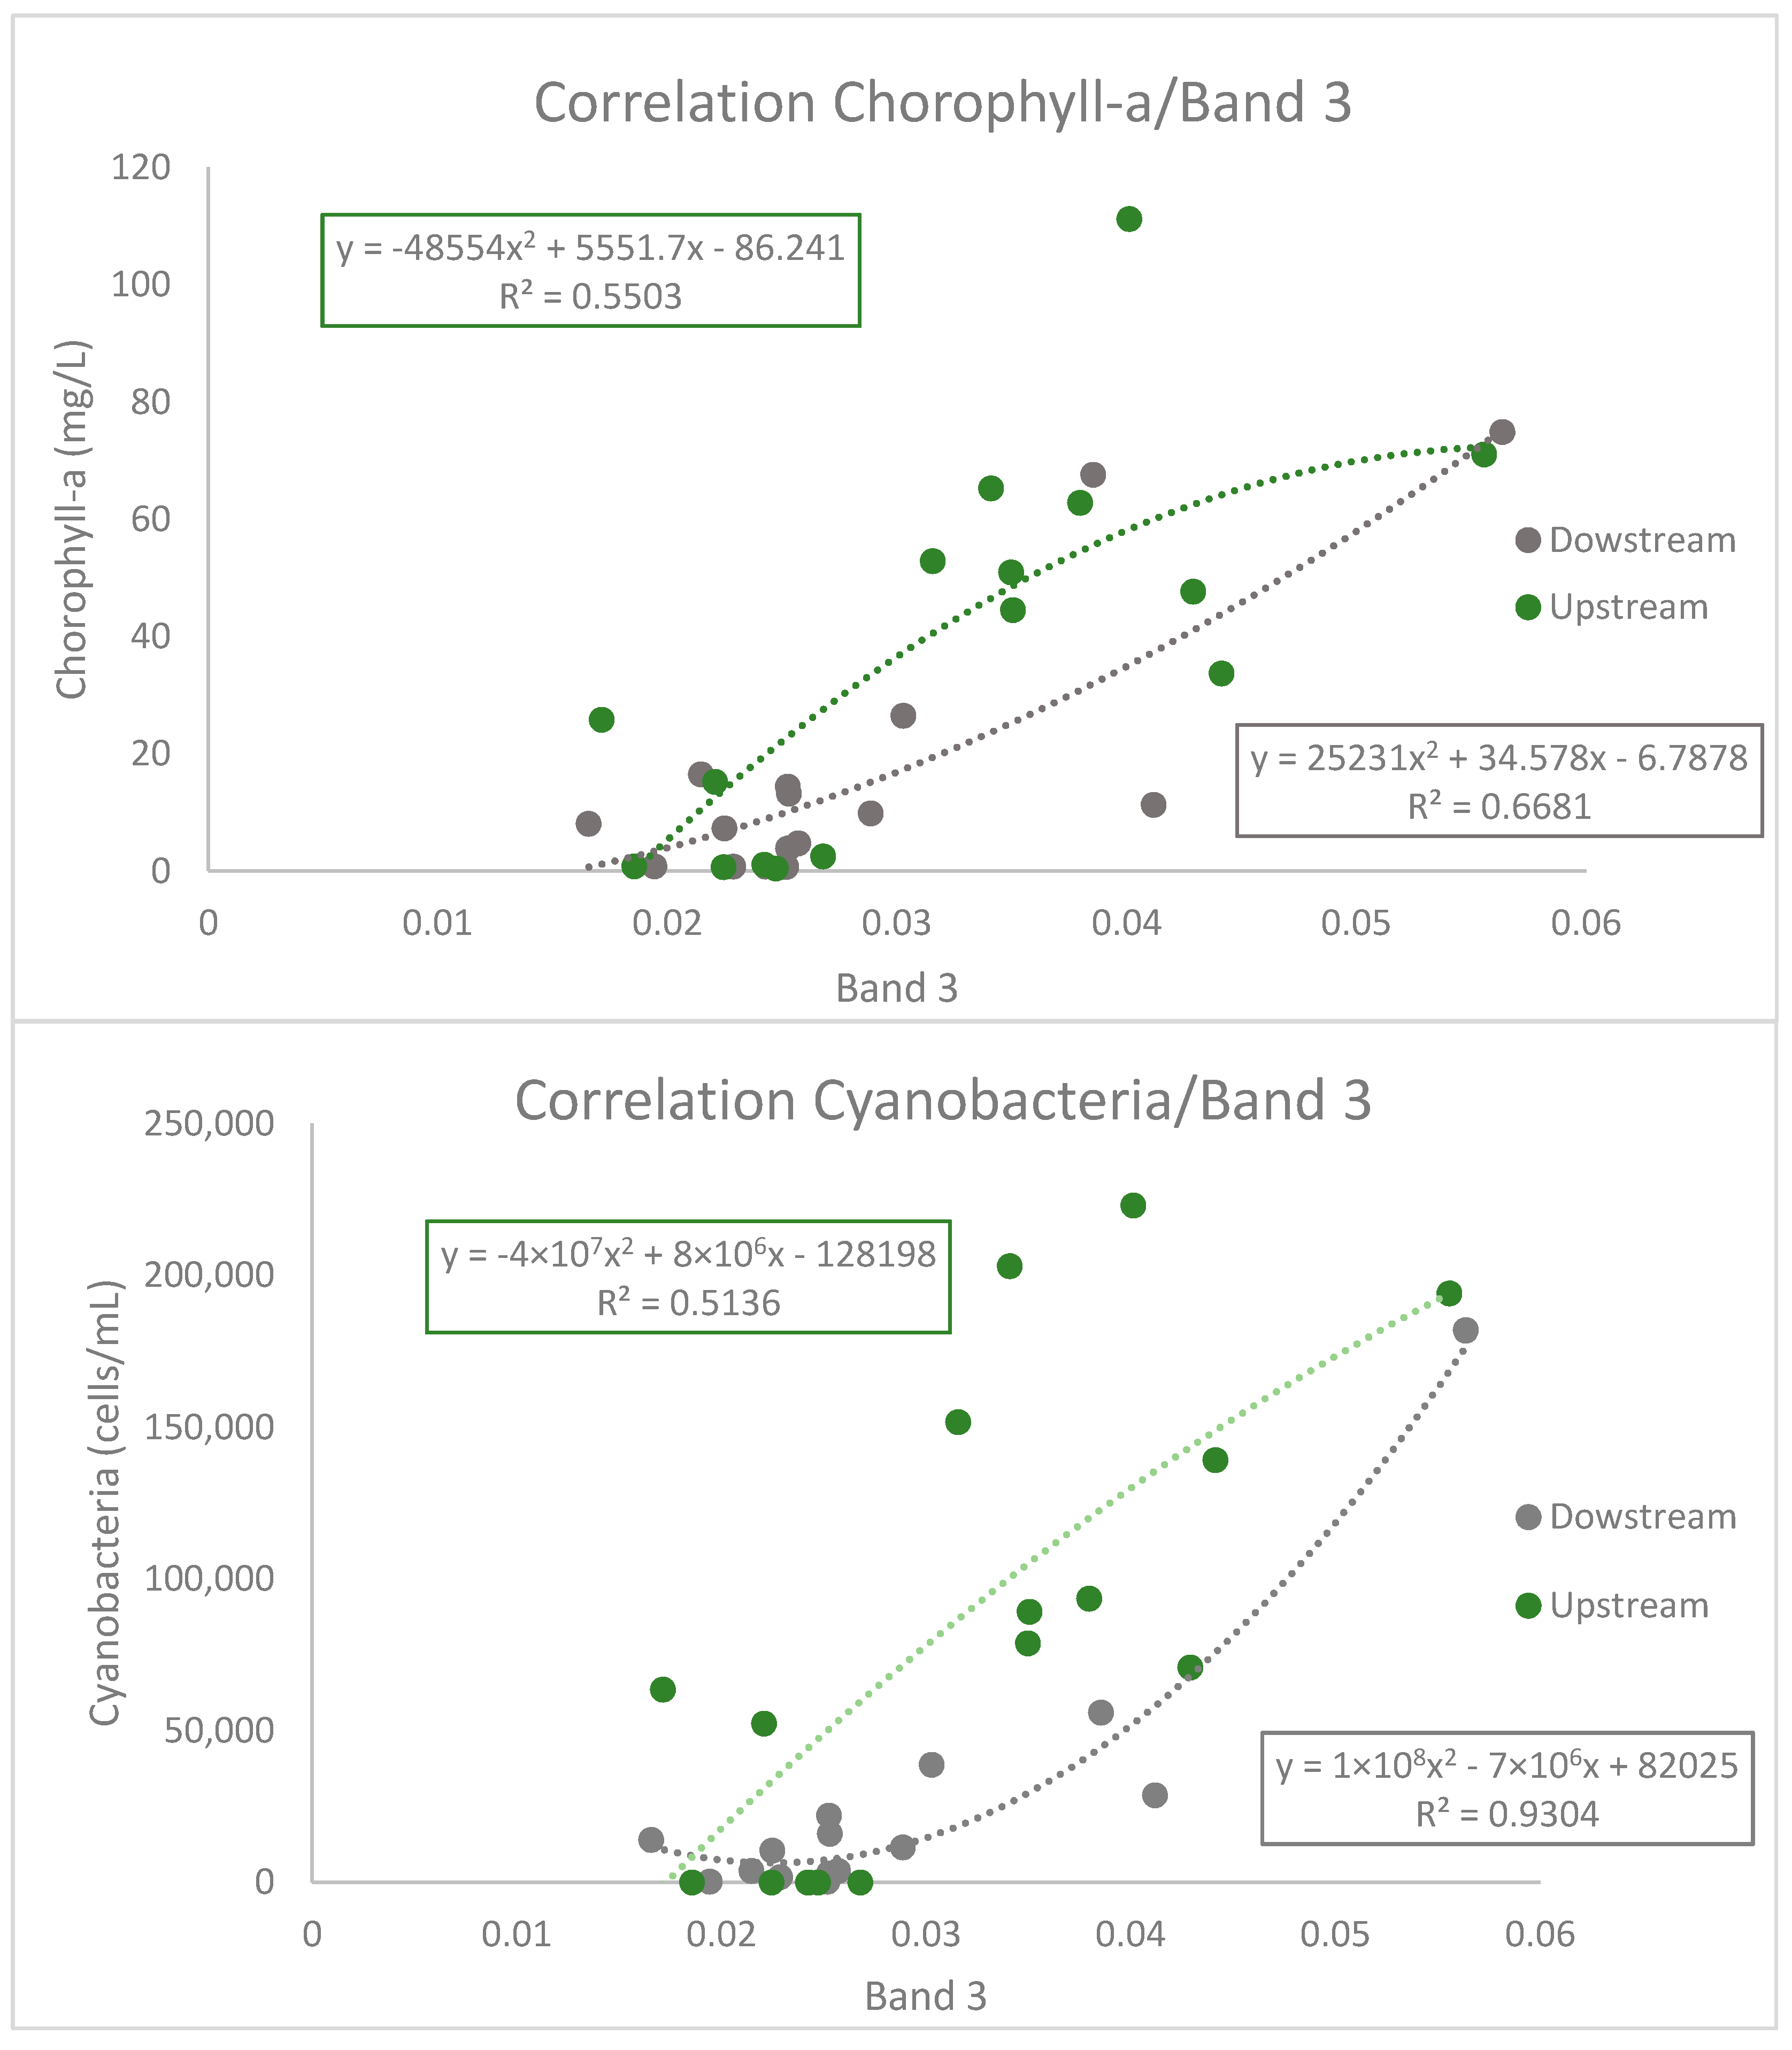
3.2. Sentinel-2 Spectral Band Performance

The correlation between the spectral bands and the water quality parameters measured in situ is shown in Table 2. There was a high Pearson’s correlation high for band 3 with Chl-a (rD = 0.807) and with cyanobacteria (rD = 0.882), while the RU (rU = 0.717 and 0.713, respectively) values were slightly lower. These results indicate the presence of suspended solids, which is why reflectance peaks were detected in the range of 530 to 600 nm, corresponding to band 3 [57]. By contrast, Saberioon et al. [58] found a negative correlation with bands 3 and 4 and a similar value to B5 (0.59) for Chl-a. However, Ha et al. [59] obtain a better correlation with B3 than with B4. Their study posits that this correlation depends largely on the biogeochemical characteristics of the water mass, i.e., algae, colored dissolved organic matter, and suspended inorganic solids. On the other hand, Toming et al. [37] also analyzed B5 to estimate Chl-a, and found a closer correlation (R = 0.83) than in this study (RD = 0.614; RU = 0.568). The good correlation obtained for this band is due to the fact that the peak reflectance for Chl-a analysis is between 700 and 720 nm (B5 in the Sentinel) and has traditionally been the main way of estimating Chl-a by remote sensing [43]. However, for more effective results, in addition to taking into account the biogeochemical composition, it is necessary to analyze the peak height of the contiguous bands, as discussed in the next section. Moreover, Ansper and Alikas [60] attribute this low correlation in small lakes to the adjacency effect, a phenomenon that affects the pixels near the shore of the reservoir. As a correction method for this effect, the buffer used here did not include those pixels, so the low correlation may be due to the set of photosynthetic pigments contained in the phytoplankton sampled and to a broader spectral length, which includes the possible uses of three bands (B4, B5, and B6) to carry out a correct analysis of Chl-a in the study area.
As shown in Table 2, in the performance of the bands extracted from Sentinel-2A and in the calculated water spectral indices, the B3 spectral band (560 nm) provided the closest correlations with Chl-a and Cyanobacteria concentration. By contrast, B4 (665 nm) gave a low correlation with the concentration of cyanobacteria (rD = 0.263, rU = 0.453) even though cyanobacteria have a wavelength range of 500 to 650 nm. The photosynthetic pigments contained in the physiology of cyanobacteria may be key to correctly analyzing satellite images. Phycocyanin (PC) (620 nm) and phycoerythrin (PE) (560 nm) are identified at different wavelengths [32]. According to these studies, this better correlation with B3 could indicate that the strain is rich in PE. Binding et al. [61] observe that the pigment PE is strongly absorbed in the green portion of the spectrum. They find a significant deviation from the blue to green reflectance ratio typically observed for Chl-a bearing phytoplankton. Microcystis aeruginosa is the principal species in the area study, and the composition of PC and PE can vary according to the strain. Close correlation with band 3 (rD = 0.882) may indicate that ceps with PE like pigment predominate.
The values measured in the field for Chl-a range from 0.69 mg/L to 111.17 mg/L. The data from the estimation maps generated from the Sentinel images for band 3 (Figure 3) vary between 0 and 99 mg/L. The values measured in the field for cyanobacteria vary between 0 and 223,000 cells/mL, while, for the estimation map for band 3, the figure varies from 0 to 220,111 cells/mL. This value coincides with the coefficient of determination (R2) calculated. A higher value is obtained for the concentration of cyanobacteria (R2D = 0.931) (Figure 4) than for Chl-a (R2U = 0.678). This low value of the Chl-a determination coefficient is due to the fact that this band does not reflect the correct wavelength for this photosynthetic pigment. Despite this, numerous studies [62,63] have focused on this pigment to analyze the occurrence of these blooms of cyanobacteria.
Chl-a may not be the only photosynthetic pigment that indicates the presence of cyanobacteria in lakes and reservoirs, so in-depth analysis of other pigments that form these cells is needed. This will facilitate the analysis of satellite images and help discern aquatic phytoplankton. In turn, the physiology of strains could be analyzed using this technology, making it a tool that facilitates the correct monitoring of the water quality of reservoirs.

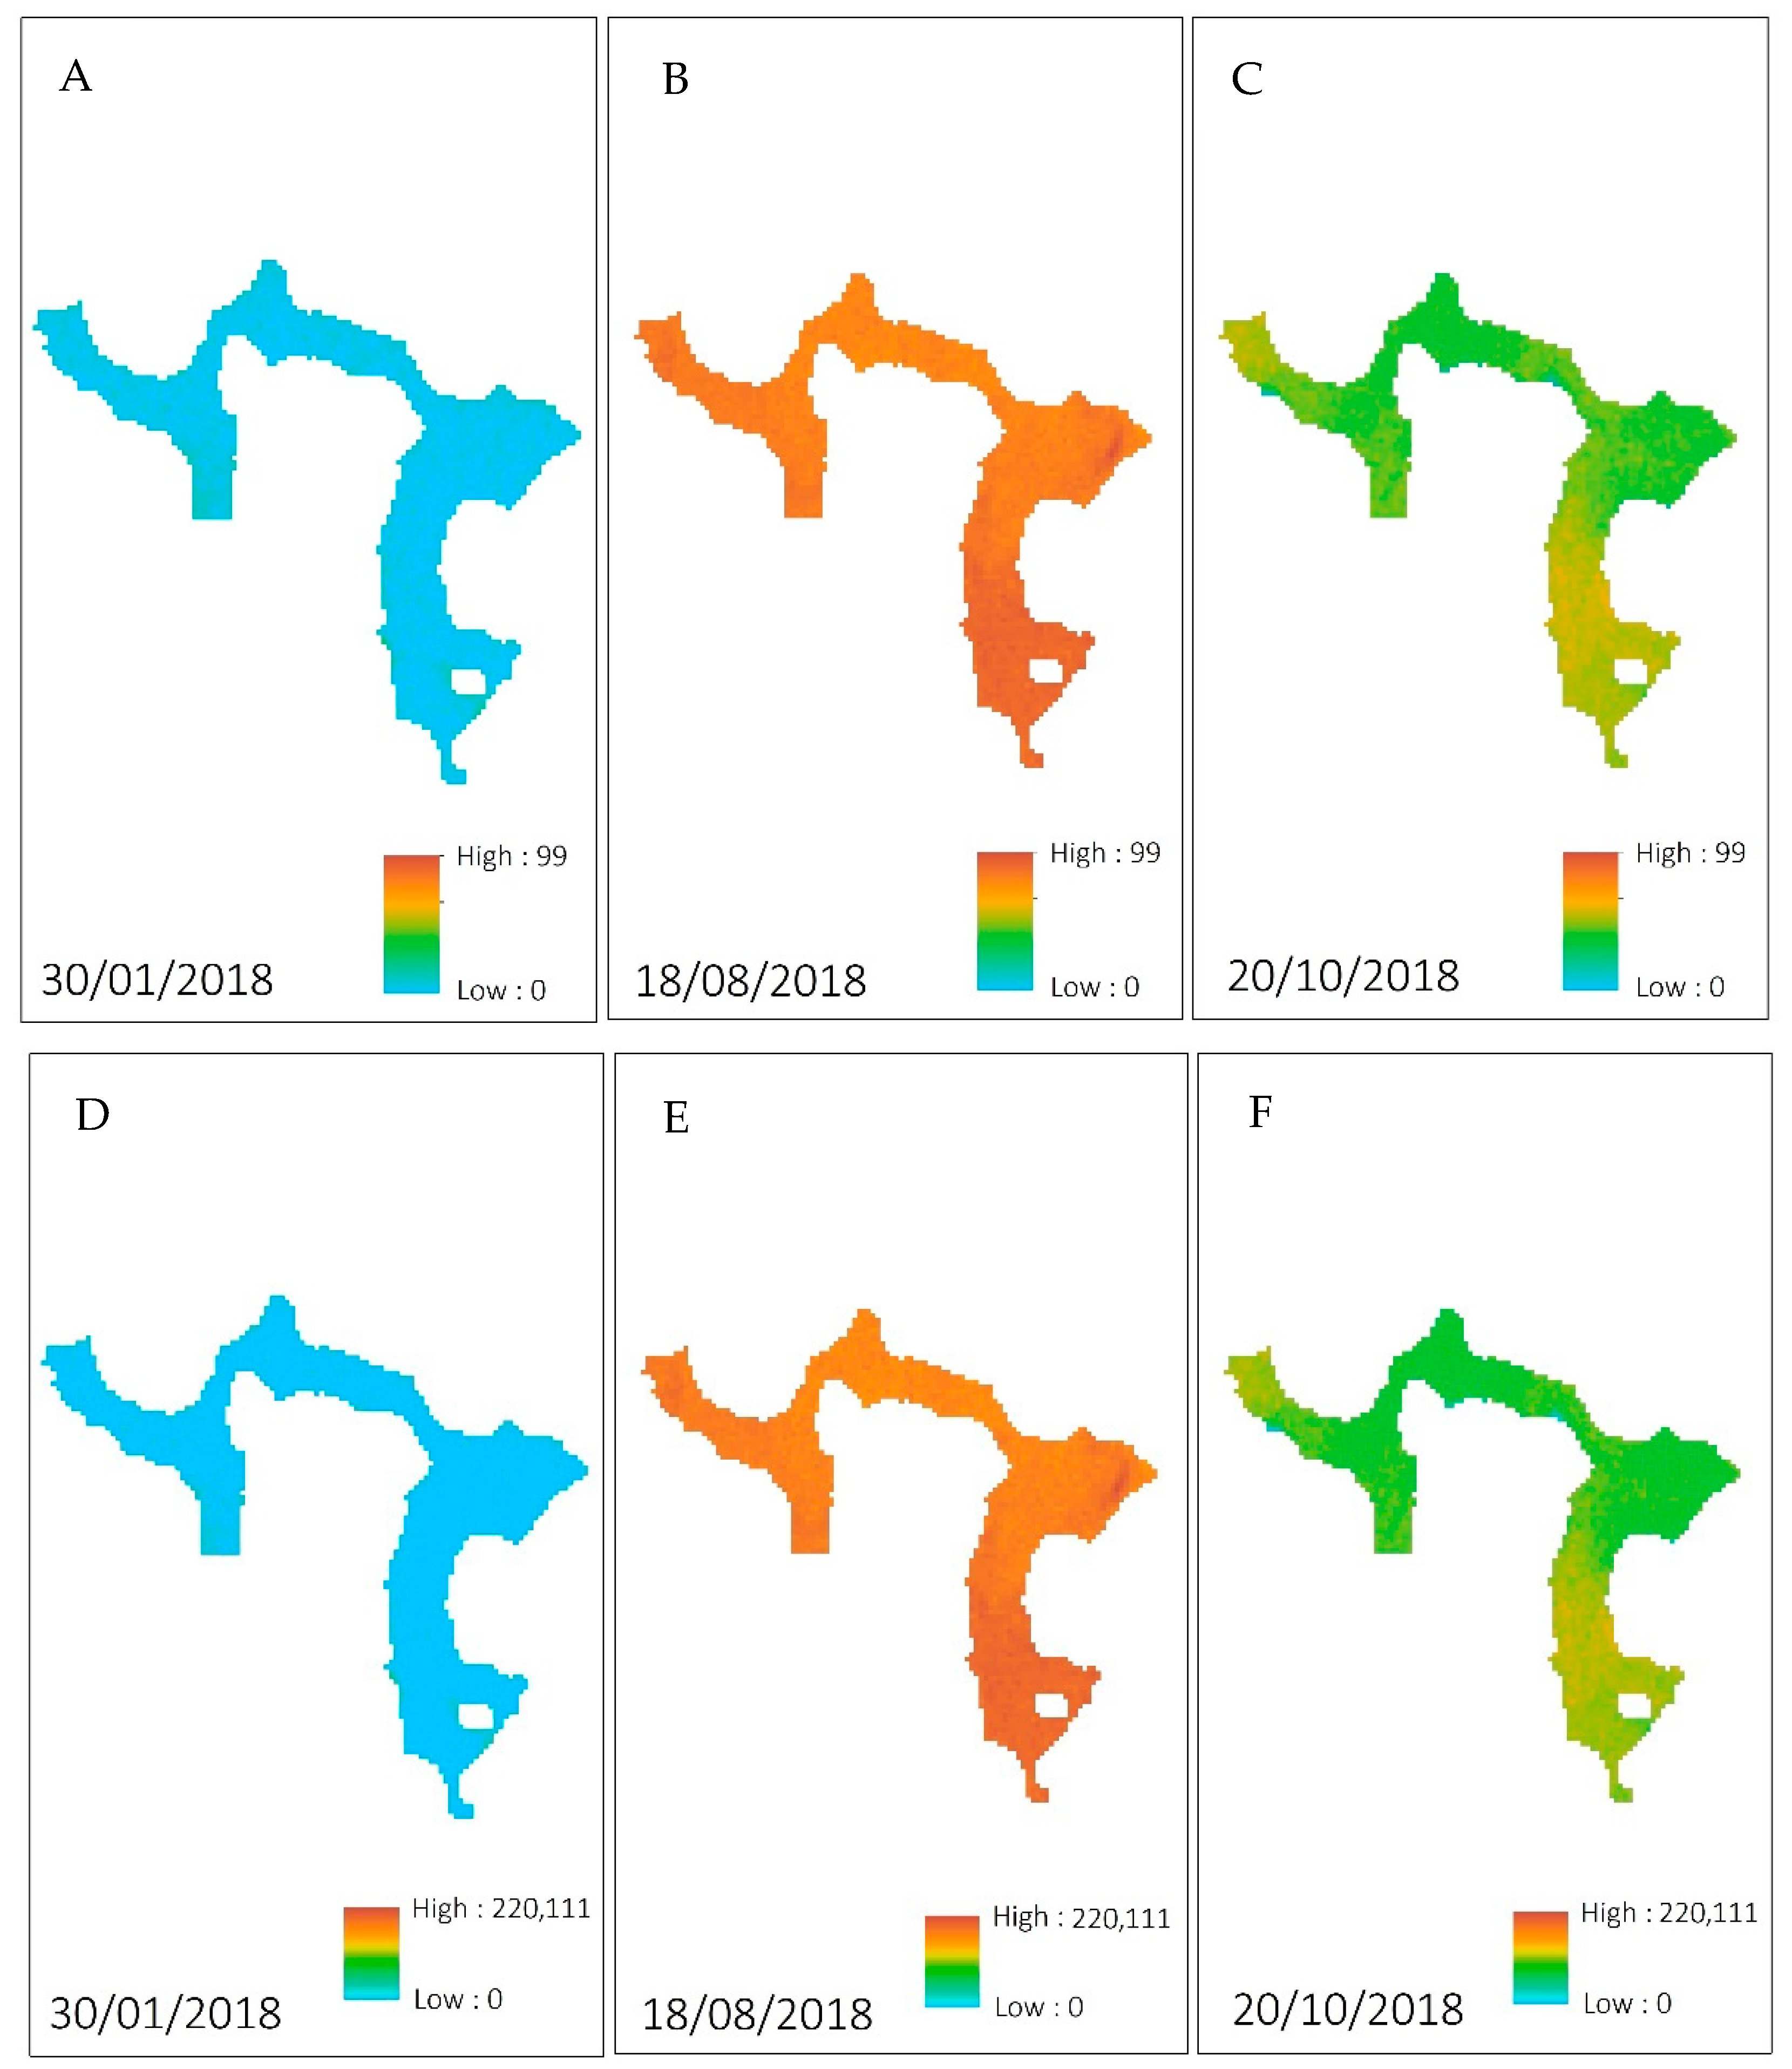
3.3. Water Indices via Sentinel-2

The correlation between water indices and water quality data collected in situ, specifically Chl-a and cyanobacteria concentration, was studied (Table 3). With Toming’s Index, this correlation was close for Chl-a (RD = 0.768). The coefficient of determination in this case peaks at R2D = 0.859 (Table 4) for the downstream measurement point. This index was created by Toming [37] to recover Chl-a data by describing the 705 nm peak height against the baseline of two neighboring spectral bands. In his study, a value of R = 0.80 was obtained, i.e., slightly higher than in the study reported here. NDVI and gNDVI showed negative correlations (Table 3). Saberioon et al. [58] obtained a high correlation of R = 0.58 with the NDVI index. The gNDVI index is very sensitive to change in chlorophyll content, which is related to changes in nitrogen content in reservoirs [64] and could explain this negative correlation. This basin is characterized by land uses with high loads of nitrogen and phosphorus that contribute significantly to lake eutrophication [39].
The highest correlation for cyanobacteria concentration was obtained with the NSMI index (R = 0.735) at the upstream point, i.e., the point with the lowest mean concentration, and the best Pearson’s correlation with Chl-a (p = 0.528 *, α = 0.01). This index has been related to TSS and includes bands 3 and 4. However, it is less closely correlated when the concentration is lower. This better correlation at the upstream point could also be due to the physiology of the strain. As discussed in the previous section, band 4 (whose wavelength is longer) detects phycocyanin more precisely. This is the only index studied that analyzes these two bands (3 and 4). Gutiérrez and Toro [65] obtain a close correlation with this index and achieve the best estimate with it since it best represents the reality of their study area. González Caro [66] classifies it as the index with the least representation in his study. Given the disparity of results in the different studies and the fact that the result obtained here is not entirely conclusive either, we coincide with Malahlela [67] in considering that this index needs optimization for each water body.
The correlation for Toming’s Index was high for cyanobacteria (rD = 0.683, rU = 0.662), and indeed gave the highest value on average (Table 3). This gives a useful algorithm for both Chl-a and cyanobacteria concentration, with less interference from other variables such as gNDVI, nitrogen, or NSMI, the concentration of solids in suspension.
The values measured in the field for Chl-a range between 0.69 and 111.17 mg/L. The data from the estimation maps generated from the Sentinel images for Toming´s Index (Figure 5) vary between 0.15 and 177 mg/L. A high value for Chl-a is obtained with the coefficient of determination (R2D = 0.859).
The values measured in the field for cyanobacteria vary between 0 and 223,000 cells/mL, while the data calculated for Toming´s Index in the estimation map range from 8200 to 322,200 cells/mL. This value coincides with the coefficient of determination (R2) calculated. A medium value is obtained for the concentration of cyanobacteria (R2 = 0.721) (Table 4), then for the Chl-a value (R2 = 0.678). For the NDWI, with a coefficient of determination, the value was R2 = 0.849, which is higher, and the data calculated from the estimation map range from 0 to 223,00 cells/mL.
Although the accuracy of the method introduced is significantly high, it needs to be improved. The uncertainties associated with the measurements in situ need to be known, and errors need to be controlled for. Ways of doing this include incorporating more sampling points and taking measurements of other photosynthetic pigments that could provide information on the strains present in the reservoir. The index studied by Toming obtained a good fit for the Chl-a value. However, for the determination and quantification of cyanobacteria in the reservoir, the indices have shown mismatches between the upstream and downstream points. The precision of the model could be improved by improving the field measurements and adjusting them to the timetables of the satellite. At the same time, analyzing the water column of the reservoir could help obtain a correct spectral unmixing to break down the optical components of the water. This study focuses on analyzing two sampling points due to the monitoring network established in this body of water arising from the Water Framework Directive. However, incorporating more points would provide information with fewer errors and the entire body of water would be analyzed. This would further facilitate environmental management by the administration, which would be able to design preventive and corrective measures to guarantee ecological integrity and water security.

3.4. General Discussion

In this study, the three NDWI indices, NSMI, the index in Toming et al. [37], and spectral band 3 provide the highest Pearson’s correlation with the data measured in the field for Chl-a. The index that best correlates with the Chl-a variable is that of Toming et al. [37], while, for the cyanobacterial variable, the strongest correlation is obtained with band 3 and the NDWI index.
On the other hand, extracting the 10 m buffer to calculate the spatial model can lead to a small loss of data from the areas closest to the shore, where large concentrations of microalgae and cyanobacteria are usually found when blooms are known to exist. However, this is considered necessary to obtain more real values from the reservoir and reduce the distortion of data due to potential riverside vegetation. It is also necessary to address the optical depth of the waters from the point of view of remote sensing. It is difficult to estimate the properties of the water column when the remote sensing signal comes mainly from the bottom of the lake or when those properties vary significantly over the course of the water column. This problem is accentuated in small lakes or reservoirs with more marked stratification, which are difficult to manage by remote sensing. However, in large lakes or reservoirs where the upper tens of meters are mixed uniformly and the optical depth is less than the depth of the mixed layer, this would not be a problem [68].
A look at the results for the different indices in similar studies such as Malahlela [67], Toming et al. [37], and Salgado [57] shows that these indices are useful for many types of water bodies. At this time, this methodology could be used in any regional, national, and even international geographic area. Continuing the line of research to further optimize the indices, it is necessary to develop machine learning algorithms. This approach helps address complex problems with no prior knowledge and is less affected by atmospheric and background factors in unfavorable contexts. Through this development, more optimal approaches can be obtained where this technology can be applied to other inland waters under the same terrestrial and atmospheric conditions. However, it still needs to be validated and adjusted to the peculiarities and specific characteristics of each study area. Improving these algorithms would not only provide information on when blooms may occur but also on the physiology of the strains that occur.
Thus, continuing with the line of research to further optimize the indices, this methodology could be used by the administration to improve data collection and speed up action times in case of blooms. This would reduce the costs of water quality management and the risks associated with high levels of toxicity. Some recommendations for future improvements in the predictive algorithm are: (1) increase the number of sampling points to provide a broad sampling network throughout the water body that enables the specific characteristics of each point to be known; and (2) assess the use of multispectral satellite images with higher resolution and multispectral cameras on drones, obtaining spectral images with a spatial resolution of less than 10 m.

4. Conclusions

The use of satellite images as a tool for analyzing cyanobacterial blooms is an innovative technology that will facilitate water governance and help develop measures to guarantee water security. Different bands of the Sentinel-2 satellite are analyzed and those most consistent with the analysis of cyanobacteria are selected. The green band (B3) gives the best results in correlating both Chl-a (R2 = 0.678) and cyanobacteria (R2 = 0.931). The study of cyanobacteria composition by bands can be a powerful tool for assessing the physiology of strains. This analysis is supplemented by an assessment of different indices and their respective correlation with the field data. NDWI gives an R2 value of 0.849 for the downstream point of the reservoir with the concentration of cyanobacteria. Toming’s Index gives a high R2 of 0.859 with Chl-a, and 0.721 for the concentration of cyanobacteria.
Notable differences in correlation at the upstream and downstream points are found with the indices. One possible reason for this is the complex composition of the Microcystis population and the high diversity of species. This highlights the difficulties of predicting the competitive outcome of cyanobacterial populations in natural settings. This complexity problem can be partially resolved by experimental approaches in which isolated species are grown in individual and mixed crops under a wide range of environmental conditions. Sentinel-2 could be a valuable tool for lake and reservoir monitoring and research, especially considering that the data will be routinely available for many years, and the images will be frequent and free.

Author Contributions

Conceptualization, J.L.R. and X.Á.; Data curation, M.V.-V.; Formal analysis, M.V.-V. and C.A.-A.; Funding acquisition, X.Á.; Investigation, M.V.-V., C.A.-A., J.L.R. and X.Á.; Methodology, M.V.-V. and J.L.R.; Project administration, X.Á.; Resources, X.Á.; Software, M.V.-V.; Supervision, J.L.R. and X.Á.; Validation, J.L.R. and X.Á.; Visualization, M.V.-V. and C.A.-A.; Writing—original draft, C.A.-A.; Writing—review and editing, J.L.R. and X.Á. All authors have read and agreed to the published version of the manuscript.

Funding

This research was funded by the Conselleira de Educación, Universidade e Formación Profesional, Xunta de Galicia, España, under project R815 131H 64502.

Institutional Review Board Statement

Not applicable.

Informed Consent Statement

Not applicable.

Data Availability Statement

The data that support the findings of this study are available from Xunta de Galicia.

Acknowledgments

The authors thank Augas de Galicia (Xunta de Galicia) for their collaboration.

Conflicts of Interest

The authors declare no conflict of interest. The funders had no role in the design of the study; in the collection, analyses, or interpretation of data; in the writing of the manuscript, or in the decision to publish the results.

Appendix A

Table A1. Sampling information in the A Baxe reservoir (Upstream point 42.604343E, −8.608041; Downstream point 42.606574, −8.6148194716953N).
DateChlorophyll-a Dowstream Point (mg/L)Chlorophyll-a Upstream Point (mg/L)Cyanobacteria Concentration Downstream Point (cells/mL)Microcystis sp. DowstreamCyanobacteria Concentration Upstream PointMicrocystis sp. Upstream
(cells/mL)(cells/mL)(cells/mL)
29 January20180.820.8125025000
18 June 20188.0525.7914,00014,00063,60063,600
25 June 201816.515.213750375052,40052,400
09 July 201811.2933.6928,75028,750139,250139,250
13 August 201874.971.05181,900150,000194,000160,000
20 August 201814.4250.9322,00022,00078,80065,000
27 August 20184.7247.643750375070,90051,250
10 September20187.352.8510,50010,500151,750151,750
17 September 201813.2165.2616,00016,000203,000203,000
24 September 20189.8662.7911,50011,50093,50093,500
08 October 201826.4944.5138,75038,75089,25089,250
15 October 201867.6111.1756,00056,000223,000223,000
19 November 20183.870.433000300000
03 December 20180.782.511750175000
10 December 20180.741.0825025000
26 December 20180.790.690000

References

  1. Bhagowati, B.; Talukdar, B.; Ahamad, K.U. Lake Eutrophication: Causes, Concerns and Remedial Measures. In Emerging Issues in the Water Environment during Anthropocene: A South East Asian Perspective; Kumar, M., Snow, D.D., Honda, R., Eds.; Springer: Singapore, 2020; pp. 211–222. ISBN 978-981-32-9771-5. [Google Scholar]
  2. Zhao, C.S.; Shao, N.F.; Yang, S.T.; Ren, H.; Ge, Y.R.; Feng, P.; Dong, B.E.; Zhao, Y. Predicting cyanobacteria bloom occurrence in lakes and reservoirs before blooms occur. Sci. Total Environ. 2019, 670, 837–848. [Google Scholar] [CrossRef]
  3. Dalu, T.; Wasserman, R.J. Cyanobacteria dynamics in a small tropical reservoir: Understanding spatio-temporal variability and influence of environmental variables. Sci. Total Environ. 2018, 643, 835–841. [Google Scholar] [CrossRef] [PubMed]
  4. Codd, G.A. Cyanobacterial toxins, the perception of water quality, and the prioritisation of eutrophication control. Ecol. Eng. 2000, 16, 51–60. [Google Scholar] [CrossRef]
  5. O’Neil, J.M.; Davis, T.W.; Burford, M.A.; Gobler, C.J. The rise of harmful cyanobacteria blooms: The potential roles of eutrophication and climate change. Harmful Algae 2012, 14, 313–334. [Google Scholar] [CrossRef]
  6. Welkie, D.G.; Rubin, B.E.; Diamond, S.; Hood, R.D.; Savage, D.F.; Golden, S.S. A Hard Day’s Night: Cyanobacteria in Diel Cycles. Trends Microbiol. 2019, 27, 231–242. [Google Scholar] [CrossRef]
  7. Pawlik-Skowrońska, B.; Toporowska, M.; Mazur-Marzec, H. Effects of secondary metabolites produced by different cyanobacterial populations on the freshwater zooplankters Brachionus calyciflorus and Daphnia pulex. Environ. Sci. Pollut. Res. 2019, 26, 11793–11804. [Google Scholar] [CrossRef] [PubMed] [Green Version]
  8. Li, J.; Dittrich, M. Dynamic polyphosphate metabolism in cyanobacteria responding to phosphorus availability. Environ. Microbiol. 2019, 21, 572–583. [Google Scholar] [CrossRef] [PubMed]
  9. Álvarez, X.; Valero, E.; Cancela, Á.; Sánchez, Á. Freshwater algae competition and correlation between their growth and microcystin production. Environ. Sci. Pollut. Res. 2016, 23, 21577–21583. [Google Scholar] [CrossRef]
  10. Richardson, J.; Feuchtmayr, H.; Miller, C.; Hunter, P.D.; Maberly, S.C.; Carvalho, L. Response of cyanobacteria and phytoplankton abundance to warming, extreme rainfall events and nutrient enrichment. Glob. Chang. Biol. 2019, 25, 3365–3380. [Google Scholar] [CrossRef] [Green Version]
  11. Sani, F.S.; Azmi, A.S.; Ali, F.; Mel, M. Interactive Effect of Temperature, pH and Light Intensity on Biodesalination of Seawater by Synechococcus sp. PCC 7002 and on the Cyanobacteria Growth. J. Adv. Res. Fluid Mech. Therm. Sci. 2018, 52, 85–93. [Google Scholar]
  12. Acuña-Alonso, C.; Lorenzo, O.; Álvarez, X.; Cancela, Á.; Valero, E.; Sánchez, Á. Influence of Microcystis sp. and freshwater algae on pH: Changes in their growth associated with sediment. Environ. Pollut. 2020, 263. [Google Scholar] [CrossRef] [PubMed]
  13. Álvarez, X.; Valero, E.; Picos, J. Evolution of Eutrophication depending on Environmental Conditions: A Case Study in a Reservoir. Eur. J. Sustain. Dev. 2014, 3, 83. [Google Scholar] [CrossRef]
  14. McFarlane, C.R.; Shah, N.R.; Kabasakal, B.V.; Echeverria, B.; Cotton, C.A.R.; Bubeck, D.; Murray, J.W. Structural basis of light-induced redox regulation in the Calvin–Benson cycle in cyanobacteria. Proc. Natl. Acad. Sci. USA 2019, 116, 20984–20990. [Google Scholar] [CrossRef] [Green Version]
  15. Massey, I.Y.; Yang, F.; Ding, Z.; Yang, S.; Guo, J.; Tezi, C.; Al-Osman, M.; Kamegni, R.B.; Zeng, W. Exposure routes and health effects of microcystins on animals and humans: A mini-review. Toxicon 2018, 151, 156–162. [Google Scholar] [CrossRef]
  16. Schmale, D.G.; Ault, A.P.; Saad, W.; Scott, D.T.; Westrick, J.A. Perspectives on Harmful Algal Blooms (HABs) and the Cyberbiosecurity of Freshwater Systems. Front. Bioeng. Biotechnol. 2019, 7, 128. [Google Scholar] [CrossRef] [PubMed] [Green Version]
  17. Sòria-Perpinyà, X.; Vicente, E.; Urrego, P.; Pereira-Sandoval, M.; Ruíz-Verdú, A.; Delegido, J.; Soria, J.M.; Moreno, J. Remote sensing of cyanobacterial blooms in a hypertrophic lagoon (Albufera of València, Eastern Iberian Peninsula) using multitemporal Sentinel-2 images. Sci. Total Environ. 2020, 698, 134305. [Google Scholar] [CrossRef]
  18. Doerffer, R.; Schiller, H. The MERIS Case 2 water algorithm. Int. J. Remote Sens. 2007, 28, 517–535. [Google Scholar] [CrossRef]
  19. Hu, C.; Chen, Z.; Clayton, T.D.; Swarzenski, P.; Brock, J.C.; Muller–Karger, F.E. Assessment of estuarine water-quality indicators using MODIS medium-resolution bands: Initial results from Tampa Bay, FL. Remote Sens. Environ. 2004, 93, 423–441. [Google Scholar] [CrossRef]
  20. Carpenter, D.J.; Carpenter, S.M. Modeling inland water quality using Landsat data. Remote Sens. Environ. 1983, 13, 345–352. [Google Scholar] [CrossRef]
  21. Zhao, Y.; Shen, Q.; Wang, Q.; Yang, F.; Wang, S.; Li, J.; Zhang, F.; Yao, Y. Recognition of Water Colour Anomaly by Using Hue Angle and Sentinel 2 Image. Remote Sens. 2020, 12, 716. [Google Scholar] [CrossRef] [Green Version]
  22. Du, Y.; Zhang, Y.; Ling, F.; Wang, Q.; Li, W.; Li, X. Water Bodies’ Mapping from Sentinel-2 Imagery with Modified Normalized Difference Water Index at 10-m Spatial Resolution Produced by Sharpening the SWIR Band. Remote Sens. 2016, 8, 354. [Google Scholar] [CrossRef] [Green Version]
  23. Suhet, H.B. Sentinel-2 User Handbook; ESA Standard Document; European Space Agency: Paris, France, 2015. [Google Scholar]
  24. Kutser, T.; Paavel, B.; Verpoorter, C.; Ligi, M.; Soomets, T.; Toming, K.; Casal, G. Remote Sensing of Black Lakes and Using 810 nm Reflectance Peak for Retrieving Water Quality Parameters of Optically Complex Waters. Remote Sens. 2016, 8, 497. [Google Scholar] [CrossRef]
  25. Delegido, J.; Verrelst, J.; Alonso, L.; Moreno, J. Evaluation of Sentinel-2 Red-Edge Bands for Empirical Estimation of Green LAI and Chlorophyll Content. Sensors 2011, 11, 63. [Google Scholar] [CrossRef] [Green Version]
  26. Maltese, A.; Capodici, F.; Ciraolo, G.; Corbari, C.; Granata, A.; La Loggia, G. Planktothrix Rubescens in Freshwater Reservoirs: The Sentinel-2 Potentiality for Mapping Phycocyanin Concentration. In Proceedings of the First Sentinel-2 Preparatory Symposium, Frascati, Italy, 23–27 April 2012; Volume 707, p. 37. [Google Scholar]
  27. Hilborn, E.D.; Beasley, V.R. One Health and Cyanobacteria in Freshwater Systems: Animal Illnesses and Deaths Are Sentinel Events for Human Health Risks. Toxins 2015, 7, 1374. [Google Scholar] [CrossRef] [Green Version]
  28. Rodríguez-Benito, C.V.; Navarro, G.; Caballero, I. Using Copernicus Sentinel-2 and Sentinel-3 data to monitor harmful algal blooms in Southern Chile during the COVID-19 lockdown. Mar. Pollut. Bull. 2020, 161, 111722. [Google Scholar] [CrossRef]
  29. Zhao, Y.; Liu, D.; Wei, X. Monitoring cyanobacterial harmful algal blooms at high spatiotemporal resolution by fusing Landsat and MODIS imagery. Environ. Adv. 2020, 2, 100008. [Google Scholar] [CrossRef]
  30. Hagolle, O.; Colin, J. Comment on “Comparison of Cloud Cover Detection Algorithms on Sentinel-2 Images of the Amazon Tropical Forest. Remote Sens. 2021, 13, 1023. [Google Scholar] [CrossRef]
  31. Pompêo, M.; Moschini-Carlos, V.; Bitencourt, M.D.; Sòria-Perpinyà, X.; Vicente, E.; Delegido, J. Water quality assessment using Sentinel-2 imagery with estimates of chlorophyll a, Secchi disk depth, and Cyanobacteria cell number: The Cantareira System reservoirs (São Paulo, Brazil). Environ. Sci. Pollut. Res. 2021. [Google Scholar] [CrossRef]
  32. Ho, M.-Y.; Niedzwiedzki, D.M.; MacGregor-Chatwin, C.; Gerstenecker, G.; Hunter, C.N.; Blankenship, R.E.; Bryant, D.A. Extensive remodeling of the photosynthetic apparatus alters energy transfer among photosynthetic complexes when cyanobacteria acclimate to far-red light. Biochim. Biophys. Acta Bioenerg. 2020, 1861, 148064. [Google Scholar] [CrossRef] [PubMed]
  33. Rodrigues, G.; Potes, M.; Costa, M.J.; Novais, M.H.; Penha, A.M.; Salgado, R.; Morais, M.M. Temporal and Spatial Variations of Secchi Depth and Diffuse Attenuation Coefficient from Sentinel-2 MSI over a Large Reservoir. Remote Sens. 2020, 12, 768. [Google Scholar] [CrossRef] [Green Version]
  34. Tao, M.; Duan, H.; Cao, Z.; Loiselle, S.A.; Ma, R. A hybrid EOF algorithm to improve MODIS cyanobacteria phycocyanin data quality in a highly turbid lake: Bloom and nonbloom condition. IEEE J. Sel. Top. Appl. Earth Obs. Remote Sens. 2017, 10, 4430–4444. [Google Scholar] [CrossRef]
  35. Afreen, S.; Fatma, T. Extraction, purification and characterization of phycoerythrin from Michrochaete and its biological activities. Biocatal. Agric. Biotechnol. 2018, 13, 84–89. [Google Scholar]
  36. Caballero, I.; Navarro, G. Monitoring cyanoHABs and water quality in Laguna Lake (Philippines) with Sentinel-2 satellites during the 2020 Pacific typhoon season. Sci. Total Environ. 2021, 788, 147700. [Google Scholar] [CrossRef]
  37. Toming, K.; Kutser, T.; Laas, A.; Sepp, M.; Paavel, B.; Nõges, T. First Experiences in Mapping Lake Water Quality Parameters with Sentinel-2 MSI Imagery. Remote Sens. 2016, 8, 640. [Google Scholar] [CrossRef] [Green Version]
  38. Bermúdez, X.Á.; del Olmo, E.V.G.; Carral, Á.C.; Martín, J.P. Modelo Conceptual de la Eutrofización y Proliferación de Cianobacterias. Un Caso de Estudio en el Embalse de A Baxe; Universidade de Vigo: Vigo, Spain, 2015. [Google Scholar]
  39. Álvarez, X.; Valero, E.; Santos, R.M.B.; Varandas, S.G.P.; Sanches Fernandes, L.F.; Pacheco, F.A.L. Anthropogenic nutrients and eutrophication in multiple land use watersheds: Best management practices and policies for the protection of water resources. Land Use Policy 2017, 69, 1–11. [Google Scholar] [CrossRef]
  40. Gobierno de España SIOSE. Sistema de Información de Ocupación del Suelo de España. Ministerio de Transportes, Movilidad y Agenda Urbana. 2016. Available online: https://www.siose.es/ (accessed on 12 October 2020).
  41. Acuña-Alonso, C.; Fernandes, A.C.P.; Álvarez, X.; Valero, E.; Pacheco, F.A.L.; Varandas, S.D.G.P.; Terêncio, D.P.S.; Fernandes, L.F.S. Water security and watershed management assessed through the modelling of hydrology and ecological integrity: A study in the Galicia-Costa (NW Spain). Sci. Total Environ. 2020, 143905. [Google Scholar] [CrossRef]
  42. Augas de Galicia. Plan Integral de Actuación sobre a Microcystis sp. no Encoro de Caldas de Reis no Río Umia. PLAN UMIA 2011, Santiago de Compostela, Galicia, Spain. Available online: http://7cfe.congresoforestal.es/sites/default/files/actas/7CFE01-311.pdf (accessed on 21 November 2020).
  43. Kallio, K.; Kutser, T.; Hannonen, T.; Koponen, S.; Pulliainen, J.; Vepsäläinen, J.; Pyhälahti, T. Retrieval of water quality from airborne imaging spectrometry of various lake types in different seasons. Sci. Total Environ. 2001, 268, 59–77. [Google Scholar] [CrossRef]
  44. Chavez, P.S. An improved dark-object subtraction technique for atmospheric scattering correction of multispectral data. Remote Sens. Environ. 1988, 24, 459–479. [Google Scholar] [CrossRef]
  45. Aranha, J.; Enes, T.; Calvão, A.; Viana, H. Shrub Biomass Estimates in Former Burnt Areas Using Sentinel 2 Images Processing and Classification. Forests 2020, 11, 555. [Google Scholar] [CrossRef]
  46. Mcfeeters, S.K. The use of the Normalized Difference Water Index (NDWI) in the delineation of open water features. Int. J. Remote Sens. 1996, 17, 1425–1432. [Google Scholar] [CrossRef]
  47. Rouse, J.W., Jr.; Haas, R.H.; Schell, J.A.; Deering, D.W. Third Earth Resources Technology Satellite-1 Symposium: The Proceedings of a Symposium Held by Goddard Space Flight Center at Washington, DC on 10–14 December 1973: Prepared at Goddard Space Flight Center; Scientific and Technical Information Office, National Aeronautics and Space Administration: Washington, DC, USA, 1974; Volume 351, p. 309.
  48. Gitelson, A.A.; Kaufman, Y.J.; Merzlyak, M.N. Use of a green channel in remote sensing of global vegetation from EOS-MODIS. Remote Sens. Environ. 1996, 58, 289–298. [Google Scholar] [CrossRef]
  49. Haubrock, S.N.; Chabrillat, S.; Lemmnitz, C.; Kaufmann, H. Surface soil moisture quantification models from reflectance data under field conditions. Int. J. Remote Sens. 2008, 29, 3–29. [Google Scholar] [CrossRef]
  50. Xu, H. Modification of normalised difference water index (NDWI) to enhance open water features in remotely sensed imagery. Int. J. Remote Sens. 2006, 27, 3025–3033. [Google Scholar] [CrossRef]
  51. Sun, F.; Sun, W.; Chen, J.; Gong, P. Comparison and improvement of methods for identifying waterbodies in remotely sensed imagery. Int. J. Remote Sens. 2012, 33, 6854–6875. [Google Scholar] [CrossRef]
  52. Weier, J.; Herring, D. Measuring Vegetation (NDVI & EVI). Earth Observatory; NASA Earth Observatory: Washington, DC, USA, 2000.
  53. Rodríguez-López, L.; Duran-Llacer, I.; González-Rodríguez, L.; Abarca-del-Rio, R.; Cárdenas, R.; Parra, O.; Martínez-Retureta, R.; Urrutia, R. Spectral analysis using LANDSAT images to monitor the chlorophyll-a concentration in Lake Laja in Chile. Ecol. Inform. 2020, 60, 101183. [Google Scholar] [CrossRef]
  54. Pandhadha, E.; Aunurrahim, A.; Ayudyanti, A.; Huda, M.; Sabrina, R.; Anindya, S. Total Suspended Solid (TSS) Estimation in Lake Tempe, South Sulawesi Using Sentinel-2B Imagery. EasyChair 2019, 1, 19–22. [Google Scholar]
  55. Molkov, A.A.; Fedorov, S.V.; Pelevin, V.V.; Korchemkina, E.N. Regional models for high-resolution retrieval of chlorophyll a and TSM concentrations in the Gorky Reservoir by Sentinel-2 imagery. Remote Sens. 2019, 11, 1215. [Google Scholar] [CrossRef] [Green Version]
  56. Yacobi, Y.Z.; Moses, W.J.; Kaganovsky, S.; Sulimani, B.; Leavitt, B.C.; Gitelson, A.A. NIR-red reflectance-based algorithms for chlorophyll-a estimation in mesotrophic inland and coastal waters: Lake Kinneret case study. Water Res. 2011, 45, 2428–2436. [Google Scholar] [CrossRef] [PubMed] [Green Version]
  57. De Salgado, A.A. Modelagem da Dinâmica de Algas e Cianobactérias em um Reservatório de Abastecimento. Ph.D. Thesis, Universidade Federal de Goiás, Goiânia, Brazil, 2018. [Google Scholar]
  58. Saberioon, M.; Brom, J.; Nedbal, V.; Soucek, P.; Císar, P. Chlorophyll-a and total suspended solids retrieval and mapping using Sentinel-2A and machine learning for inland waters. Ecol. Indic. 2020, 113, 106236. [Google Scholar] [CrossRef]
  59. Ha, N.T.T.; Thao, N.T.P.; Koike, K.; Nhuan, M.T. Selecting the Best Band Ratio to Estimate Chlorophyll-a Concentration in a Tropical Freshwater Lake Using Sentinel 2A Images from a Case Study of Lake Ba Be (Northern Vietnam). ISPRS Int. J. Geo-Inf. 2017, 6, 290. [Google Scholar] [CrossRef]
  60. Ansper, A.; Alikas, K. Retrieval of Chlorophyll a from Sentinel-2 MSI Data for the European Union Water Framework Directive Reporting Purposes. Remote Sens. 2019, 11, 64. [Google Scholar] [CrossRef] [Green Version]
  61. Binding, C.E.; Zastepa, A.; Zeng, C. The impact of phytoplankton community composition on optical properties and satellite observations of the 2017 western Lake Erie algal bloom. J. Great Lakes Res. 2019, 45, 573–586. [Google Scholar] [CrossRef]
  62. Germán, A.; Andreo, V.; Tauro, C.; Scavuzzo, C.M.; Ferral, A. A novel method based on time series satellite data analysis to detect algal blooms. Ecol. Inform. 2020, 59, 101131. [Google Scholar] [CrossRef]
  63. Cremella, B. Puesta a Punto y Validación de un Método Basado en la Fluorescencia in Vivo de Pigmentos Como Indicador de Biomasa de Fitoplancton y Cianobacterias en Cuerpos de Agua de Uruguay. Ph.D. Thesis, Universidad de la República (Uruguay), Montevideo, Uruguay, 2017. [Google Scholar]
  64. Elhag, M.; Gitas, I.; Othman, A.; Bahrawi, J.; Gikas, P. Assessment of Water Quality Parameters Using Temporal Remote Sensing Spectral Reflectance in Arid Environments, Saudi Arabia. Water 2019, 11, 556. [Google Scholar] [CrossRef] [Green Version]
  65. Chicuazuque Gutiérrez, C.T.; Sarmiento Toro, J.E. Análisis de la Presencia de Partículas Sólidas en Suspensión Sobre el Río Bogotá Generadas Por los Procesos de las Curtiembres, Haciendo Uso de Teledetección, en el Municipio de Villapinzón. Ph.D. Thesis, Universidad Distrital Francisco José de Caldas, Bogotá, Colombia, 2015. [Google Scholar]
  66. González Caro, M. Análisis Espectral de Solidos Suspendidos en Aguas Continentales con Presencia de Actividades Mineras: Caso de Estudio río Sipí, Pacifico Colombiano. Ph.D. Thesis, Universidad Militar de Granada, Bogotá, Colombia, 2015. [Google Scholar]
  67. Malahlela, O.E. Spatio-temporal assessment of inland surface water quality using remote sensing data in the wake of changing climate. In Proceedings of the IOP Conference Series: Earth and Environmental Science; IOP Publishing Ltd.: Bristol, UK, 2019; Volume 227, p. 62012. [Google Scholar] [CrossRef]
  68. Soomets, T.; Uudeberg, K.; Jakovels, D.; Brauns, A.; Zagars, M.; Kutser, T. Validation and Comparison of Water Quality Products in Baltic Lakes Using Sentinel-2 MSI and Sentinel-3 OLCI Data. Sensors 2020, 20, 742. [Google Scholar] [CrossRef] [PubMed] [Green Version]
Figure 1. Study area, showing the A Baxe reservoir, the sampling points, and land uses in the basin. (UTM 533823E 471635N).
Sustainability 13 08570 g001
Figure 2. Regression equations for data collected in situ.
Sustainability 13 08570 g002
Figure 3. (AC) Estimate of chlorophyll concentration (mg/L) from band 3; (DF) estimate of cyanobacteria concentration (cells/mL) from band 3.
Sustainability 13 08570 g003
Figure 4. Polynomial regression equation for band 3, analyzing chlorophyll-a and the concentration of cyanobacteria for both sample points.
Sustainability 13 08570 g004
Figure 5. (AC) Chlorophyll-a concentration estimate (mg/L) from Toming’s index; (DF) estimate of cyanobacteria concentration (cells/mL) from Toming´s index.
Sustainability 13 08570 g005
Table 1. Indices used to assess the concentration of chlorophyll-a and cyanobacteria in the study area.
IndexDefinitionDefinition Based on Sentinel-2References
NDWI ρ G r e e n ρ N I R ρ G r e e n + ρ N I R B 3 B 8 B 3 + B 8 [46]
NDVI ρ N I R ρ R e d ρ N I R + ρ R e d B 8 B 4 B 8 + B 4 [47]
gNDVI ρ N I R ρ G r e e n ρ N I R + ρ G r e e n B 8 B 3 B 8 + B 3 [48]
NSMI ρ R e d + ρ G r e e n ρ B l u e ρ R e d + ρ G r e e n + ρ B l u e B 4 + B 3 B 2 B 4 + B 3 + B 2 [49]
Toming’s Index ρ V R E 5 ( ρ R e d ρ V P R 6 ) 2 B 5 ( B 4 B 6 ) 2 [24]
Table 2. Pearson’s correlation obtained for the spectral bands analyzed at each sample point. Statistically significant by Student´s t-test (p = 0.05).
BandPoint DescriptionPearson’s Correlation
Chlorophyll-aCyanobacteria Concentration
Band 3 (ρGreen, 543–578 nm)Downstream point0.807 (p = 0.011)0.882 (p = 0.045)
Upstream point0.717 (p = 0.000)0.713 (p = 0.001)
Band 4 (ρRed, 650–680 nm)Downstream point0.370 (p = 0.011)0.263 (p = 0.045)
Upstream point0.319 (p = (0.011)0.453 (p = 0.045)
Band 5 (ρVRE5, 698–713 nm)Downstream point0.614 (p = 0.011)0.575 (p = 0.045)
Upstream point0.568 (p = 0.011)0.443 (p = 0.045)
Table 3. Pearson’s correlation obtained for the indices studied at both points. Statistically significant by Student´s t-test (p = 0.05).
IndexPoint DescriptionPearson’s Correlation
Chlorophyll-aCyanobacteria Concentration
NDWIDownstream point0.545 (p = 0.011)0.651 (p = 0.045)
Upstream point0.612 (p = 0.001)0.651 (p = 0.011)
NDVIDownstream point−0.247 (p = 0.012)−0.352 (p = 0.045)
Upstream point−0.211 (p = 0.011)−0.198 (p = 0.011)
gNDVIDownstream point−0.545 (p = 0.012)−0.651 (p = 0.045)
Upstream point−0.609 (p = 0.000)−0.678 (p = 0.011)
NSMIDownstream point0.505 (p = 0.012)0.418 (p = 0.045)
Upstream point0.767 (p = 0.001)0.735 (p = 0.000)
Toming´s IndexDownstream point0.768 (p = 0.011)0.683 (p = 0.045)
Upstream point0.682 (p = 0.010)0.662 (p = 0.010)
Table 4. Polynomial regression equation for indices, analyzing chlorophyll-a and the concentration of cyanobacteria for both sample points.
IndexPoint DescriptionRegression EquationsR2
NDWIChlorophyll-a Downstreamy = 354.14x2 + 88.15x + 10.930.498
Chlorophyll-a Upstreamy = 7.70x2 + 125.64x + 29.640.442
Cyanobacteria Downstreamy = 1 × 10 6x2 + 213,239x + 7619.90.849
Cyanobacteria Upstreamy = 283,144x2 + 297,113x + 614780.532
NSMIChlorophyll-a Downstreamy = 1491x2 − 632.08x + 65.4490.356
Chlorophyll-a Upstream2903.4x2 − 1332.8x + 152.810.662
Cyanobacteria Downstreamy = 2 × 106x2 – 1 × 10⁶X + 101,7160.239
Cyanobacteria Upstreamy = 4 × 10⁶ + 06x2 – 2 × 10⁶ + 06x + 152,4810.507
Toming’s IndexChlorophyll-a Downstreamy = 52,947x2 + 6561x + 20.6910.859
Chlorophyll-a Upstreamy = 85,859x2 + 5397.6x + 35.0350.526
Cyanobacteria Downstreamy = 1 × 109x2 + 1 × 10⁷x + 31,3040.721
Cyanobacteria Upstreamy = −1 × 108x2 + 1 × 10⁷x + 86,8990.489
Publisher’s Note: MDPI stays neutral with regard to jurisdictional claims in published maps and institutional affiliations.

