
Evaluating STEM-Based Sustainability Understanding: A Cognitive Mapping Approach

Abstract
1. Introduction
1.1. STEM and Sustainability
Project Background
- (1)
- inclusion of the three sustainability dimensions;
- (2)
- inclusion of the four STEM dimensions; and
- (3)
- the design, development, and implementation of an original problem-based case study with teaching manual.
1.2. Cognitive Mapping
1.2.1. Characteristics of Cognitive Maps
1.2.2. Cognitive Maps in STEM Settings
1.3. Research Questions
- Research Question 1: Do the cognitive maps of sustainability of students enrolled in treatment courses significantly change after receiving STEM-based sustainability curricular interventions?
- Research Question 2: How do the cognitive maps of sustainability of students enrolled in treatment courses change after receiving STEM-based sustainability curricular interventions?
- Research Question 3: Is this adapted cognitive mapping process a viable method for evaluating interuniversity STEM-based sustainability curricular interventions?
2. Materials and Methods
2.1. Cognitive Mapping Exercise
2.2. Qualitative Coding
2.3. Statistical Analysis
3. Results
3.1. Paired Sample t Tests
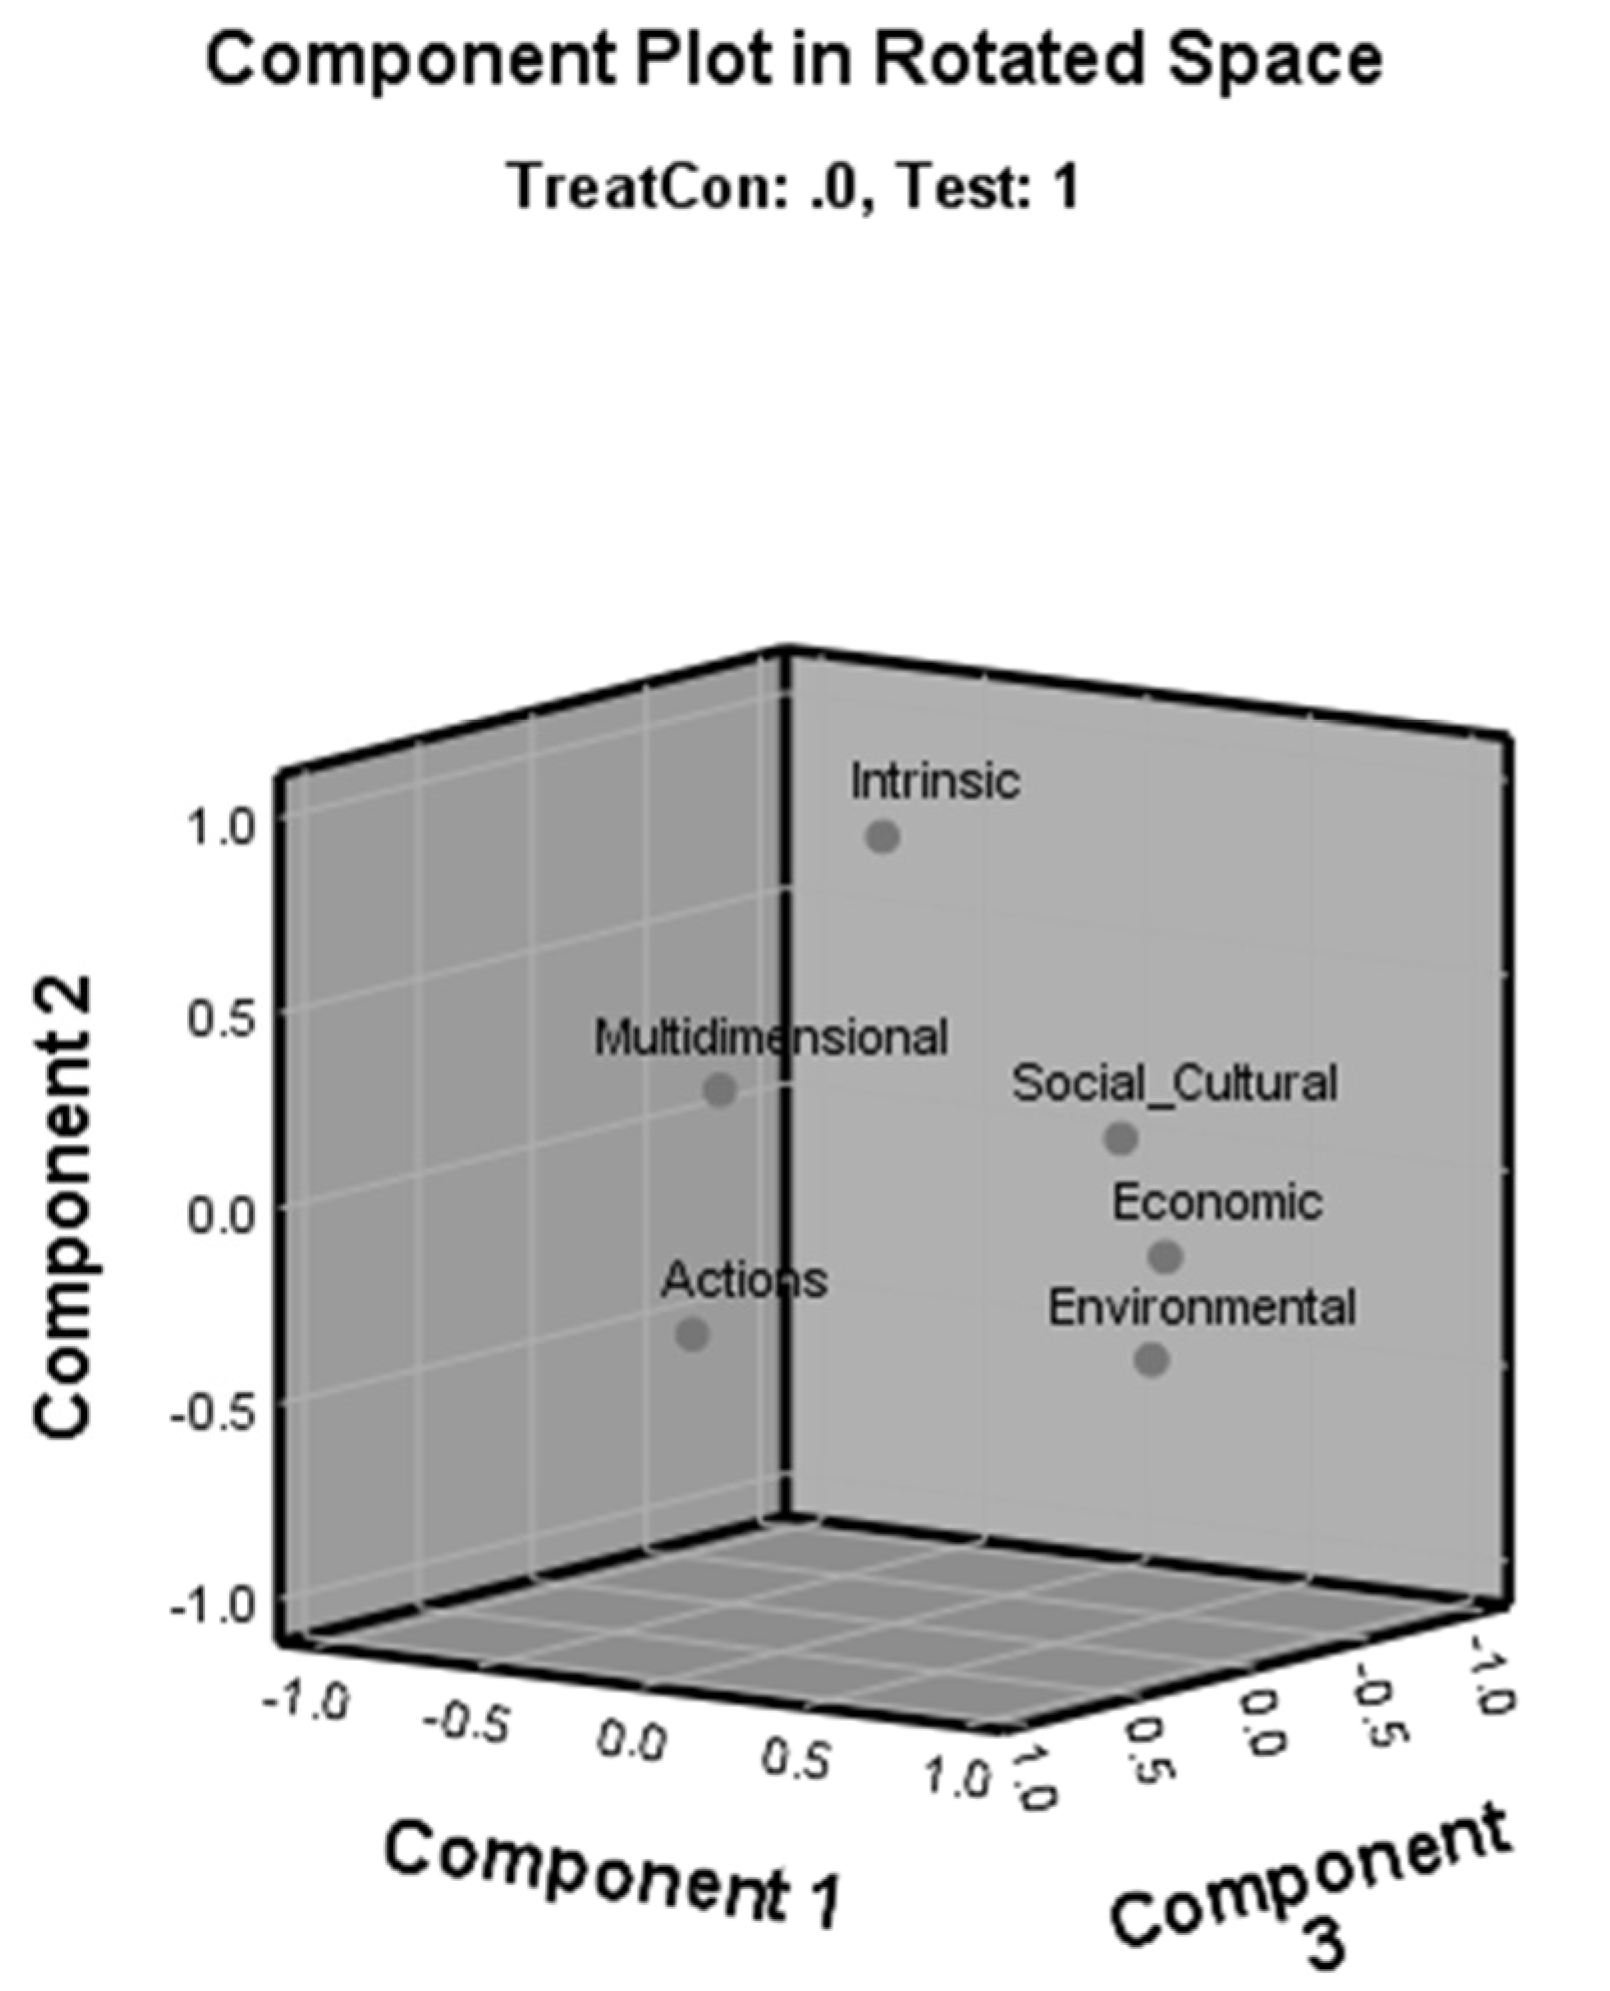
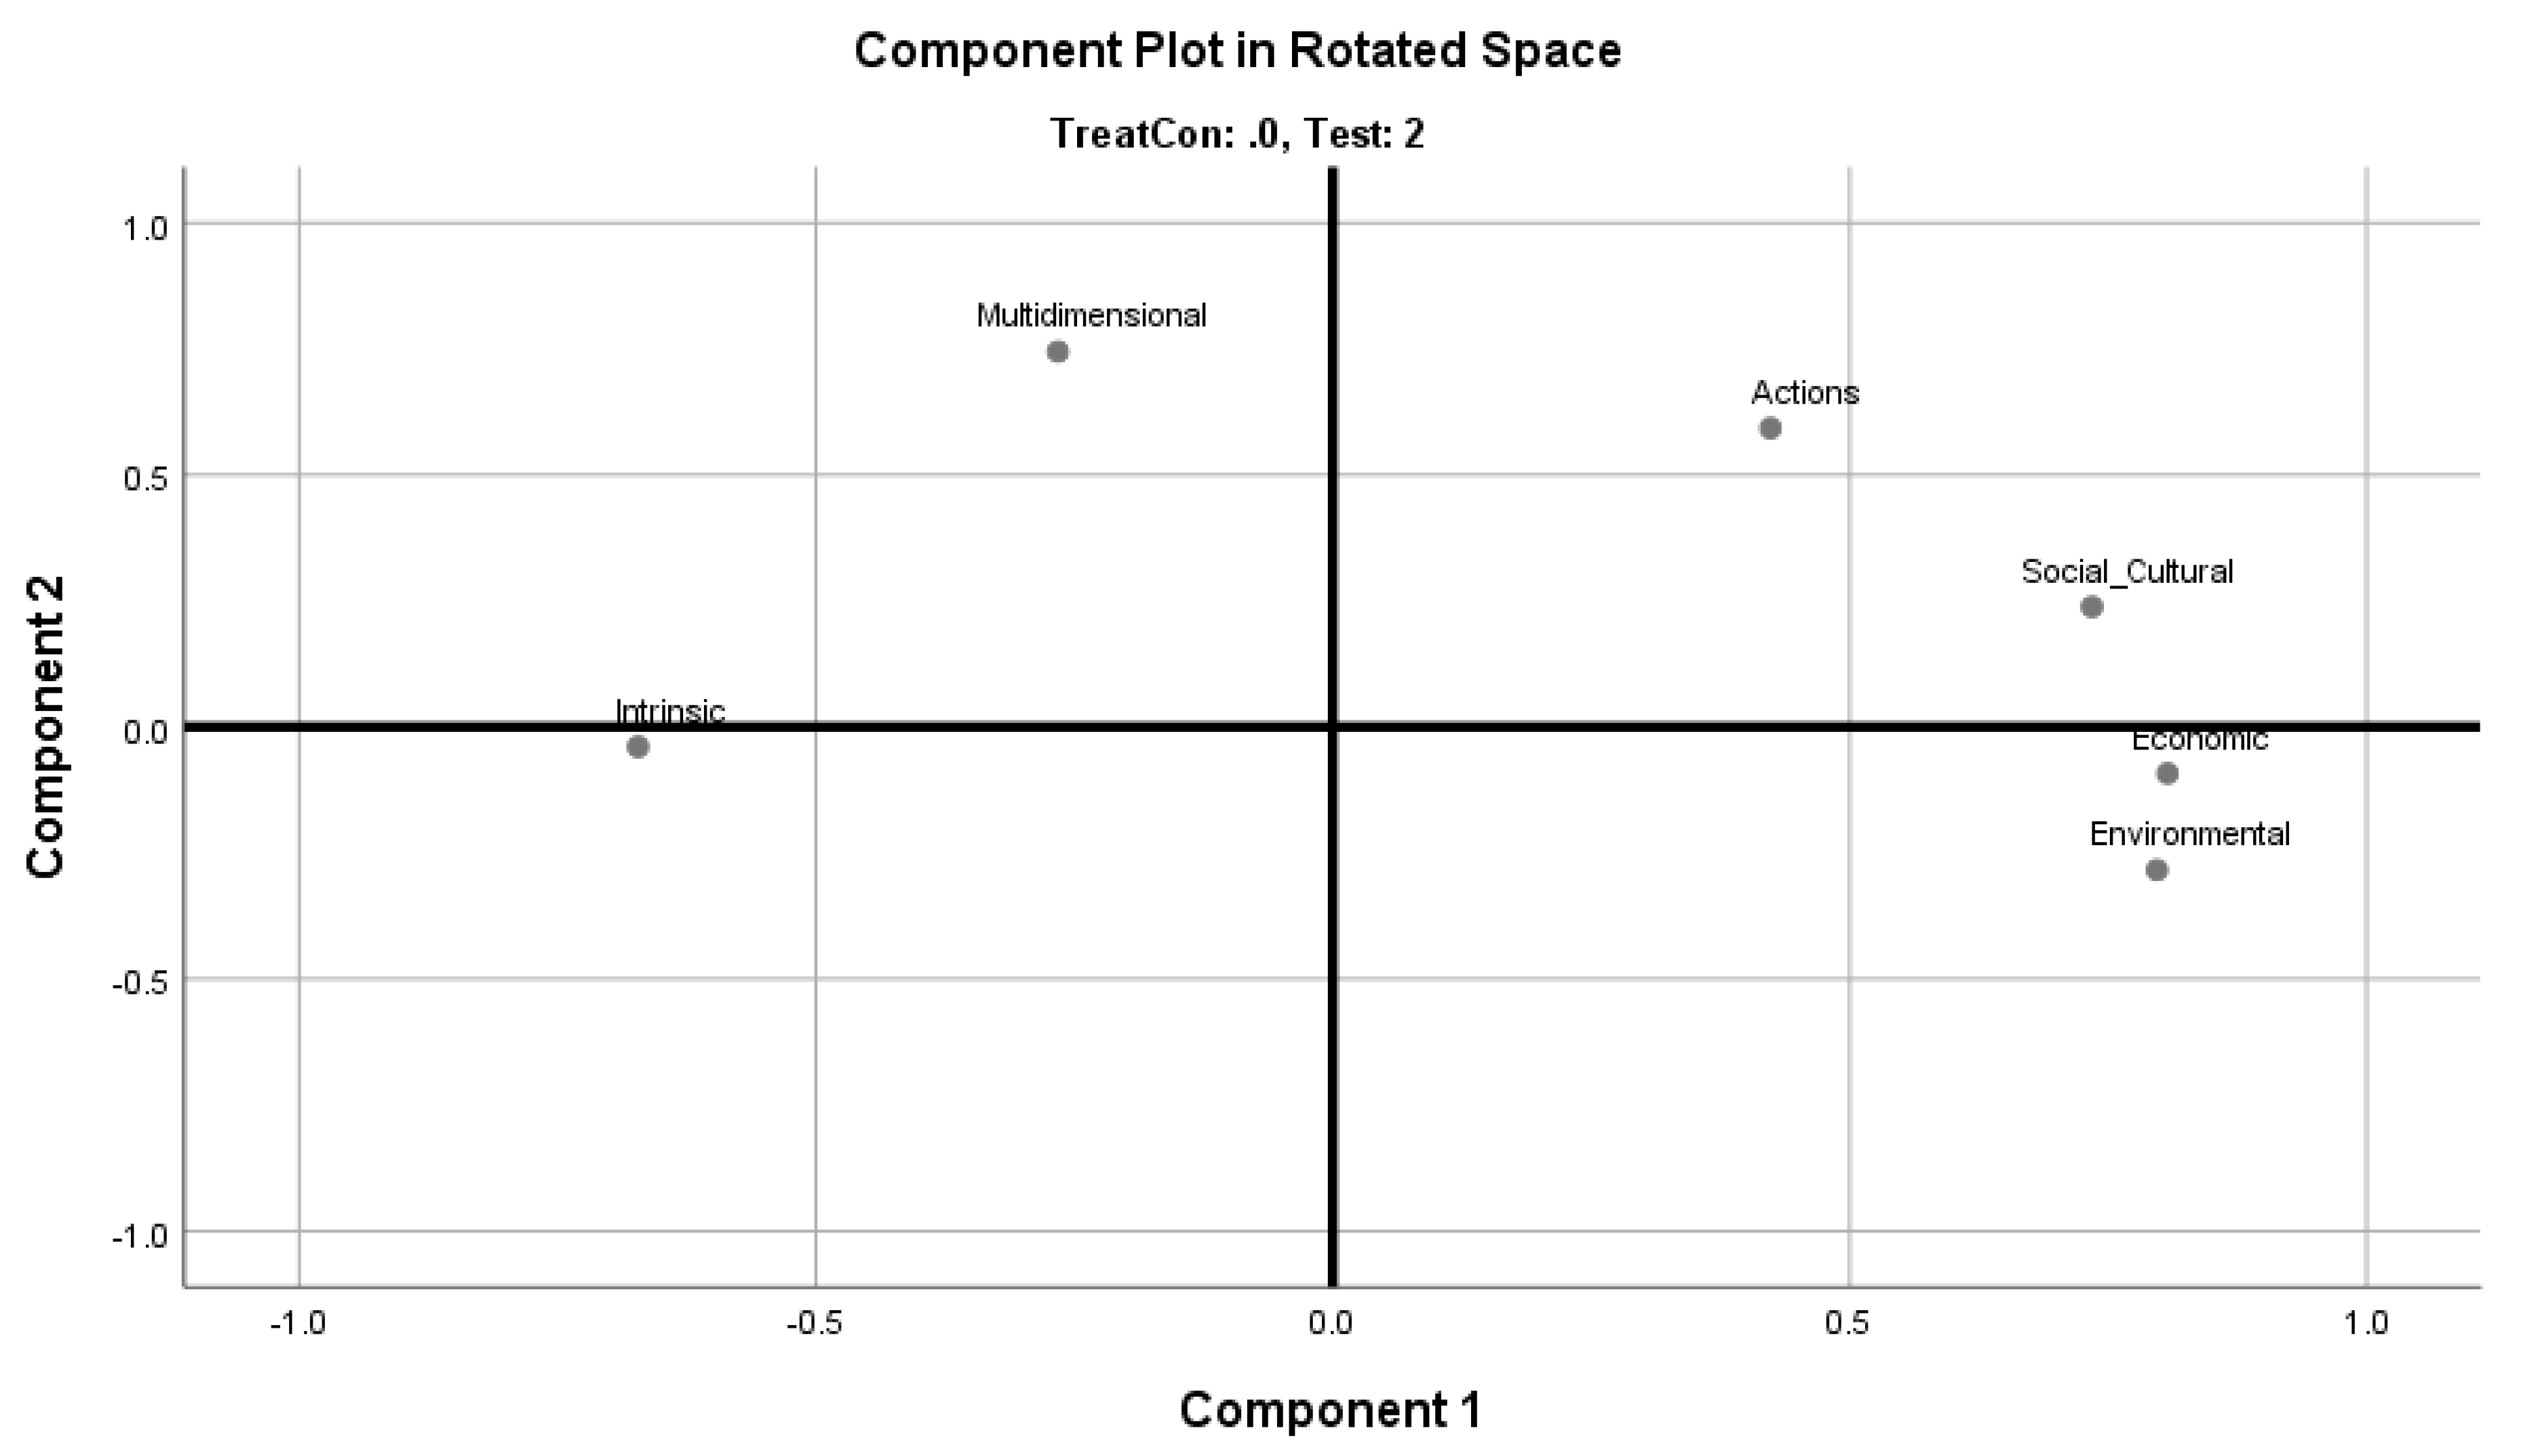
3.2. Principal Component Analysis
4. Discussion
4.1. Research Question 1: Do Student Cognitive Maps in Treatment Courses Significantly Change?
4.2. Research Question 2: How Do Student Cognitive Maps from Treatment Courses Change?
4.3. Research Question 3: Using Cognitive Mapping to Assess Student Learning
4.4. Limitations and Future Research
5. Conclusions
Author Contributions
Funding
Institutional Review Board Statement
Informed Consent Statement
Data Availability Statement
Conflicts of Interest
Appendix A

| Lourdel et al. (2007) | Segalas et al. (2008) |
|---|---|
| environmental | environmental |
| social–cultural | resources scarcity |
| multidimensional approaches | social impact |
| economic, scientific, technological | values |
| procedural and political approaches | future generations (temporal) |
| actors and stakeholders | unbalances (spatial) |
| technology | |
| economy | |
| education | |
| actors and stakeholders |
Appendix B
| Term | Definition | Examples |
|---|---|---|
| social–cultural (parent) | A set of beliefs, customs, practices and/or behaviors that exists within a population. | language culture social |
| politics | Activities associated with the governance of a country or other area, especially the debate or conflict among individuals or parties having or hoping to achieve power. | Republican Party liberal democratic political conservative |
| laws | Anything related to formal rules used to regulate local, state, or federal actors. This could be proposed law, current law, or past law. | severance taxes regulations policy |
| stakeholders | A stakeholder is any person, organization, or social group. The “who” that is involved with sustainability that encompasses individuals, groups of individuals, or organizations (both for-profit and not-for-profit) | Exxon Mobile government communities society societal people population business/usinesses generation |
| religion | Belief in or worship of a higher power; the organization of groups that share common beliefs and/or worship a higher power | religion God faith higher power worship |
| economic (parent) | Anything related to the production and management of material wealth. This could include for-profit businesses. When coding businesses, including “Economic” code as well as the parent code “Social” and child code “Stakeholder.” | money economy financial finances currency/dollars business/businesses Exxon Mobile resource, usage |
| environmental (parent) | The “natural environment encompasses the atmosphere, hydrosphere, lithosphere, ecosystem processes, and all human and non-human lifeforms” where environmental refers to the interactions between the human and non-human elements. | energy (or wind energy, solar energy) earth, food sky forest, living oil, non-GMO, green energy |
| scientific advancement | Scientific or technological advancement is the generation of information or the discovery of knowledge that advances the understanding of scientific relations or technology. | solar panels wind turbines off-grid geothermal recyclable (i.e., product characteristics) |
| transportation | An act, process, or instance of moving or being moved. | electric car, mass transit, bicycle |
| intrinsic (parent) | Encompasses an individual’s internal way of seeing, knowing, feeling, and/or understanding the term sustainability. The three most common intrinsic items will likely be values, attitudes, and beliefs. | attitude: sad, happy, good, bad, satisfactory, useful, smart, strong, supported value: happiness, important, green, healthy, green energy belief: consensus, worthwhile, worthy, viable, functioning, operational, relevant, thoughtful, conservative, supportable |
| attitudes | Attitudes: Positive or negative evaluations of something very specific. Unlike values, attitudes are more directed toward a specific item or event (i.e., towards sustainability). | |
| values/beliefs | Values: Concepts or beliefs about desirable end states or behaviors that go beyond specific situations to influence how we behave and evaluate behaviors. Values extend beyond a specific item or event. Beliefs: Our understanding about the state of the world or the facts as we see them. This would also encompass synonyms for sustainability and personal opinions. | |
| actions (parent) | The fact or process of doing something, typically to achieve an aim. Please note that actions can fall within other categories. When coding, all action words should be included within this category. | recycle recycling plant planting vote voting preserve preserving less packaging bicycling walking, protect save, manage |
| multidimensional(parent) | See individual definitions below. | |
| temporal | Relating to time; future focused. | continual, durable longevity, stability future, growth preservation renewable, survive sustainable sustain/to sustain maintainable consistency length, cyclic regenerated self-sustaining generation reserve |
| spatial | Relating to space or dispersion. | geographic worldwide widespread far-reaching |
| catch-all | Content that does not fit into one of the other categories and may need additional review. |
Appendix C
Cognitive Mapping Instructions and Analysis
| Analysis | Interpretation | |
|---|---|---|
| descriptives and correlation | Run descriptive and correlations for all codes (parent and child codes), sorted by pre- and post-test for treatment and comparison courses. | Descriptive information, such as the number of words provided, and the representation of semantic categories provide preliminary insight to student understanding of sustainable development. Higher word counts and representation across semantic categories suggests greater student understanding. Correlations point to relationships between code categories. |
| paired-sample t tests | Next, run paired-sample t tests to compare student means to determine whether there is statistical evidence that the mean difference between paired observations (i.e., between pre- and post-tests) is significantly different from zero. | The paired-sample t tests will confirm if treatment courses are significantly different from the comparison courses. Significant findings will confirm the impact of the curricular interventions in treatment courses. |
| principal component analysis | Conduct principal component analysis with varimax (orthogonal) rotation to develop linkages for the parent code categories, including relational maps. | Linkages between codes show strong and weak connections between concepts and demonstrate changes in linkages over time via pre- and post-tests. |
References
- Bagley, C.E.; Sulkowski, A.J.; Nelson, J.S.; Waddock, S.; Shrivastava, P. A path to developing more insightful business school graduates: A systems-based, experiential approach to integrating law, strategy, and sustainability. Acad. Manag. Learn. Educ. 2020, 19, 541–568. [Google Scholar] [CrossRef]
- Petrun Sayers, E.L.; Craig, C.A.; Gilbertz, S.; Feng, S.; Karam, R.; Bohman, A. Advancing STEM-based business sustainability: Mending the curricular gap. Manag. Teach. Rev. 2020, 5, 82–93. [Google Scholar] [CrossRef]
- Rogers, M.; Pfaff, T.; Hamilton, J.; Erkan, A. Using sustainability themes and multidisciplinary approaches to enhance STEM education. Int. J. High. Educ. 2015, 16, 523–536. [Google Scholar] [CrossRef]
- Koehn, P.H.; Uitto, J.I. Evaluating sustainability education: Lessons from international development experience. High. Educ. 2015, 67, 621–635. [Google Scholar] [CrossRef]
- Kurland, N.B.; Michaud, K.E.H.; Best, M.; Wohldmann, E.; Cox, H.; Pontikis, K.; Vasishth, A. Overcoming silos: The role of an interdisciplinary course in shaping a sustainability network. Acad. Manag. Learn. Educ. 2010, 9, 457–476. [Google Scholar]
- Lidgren, A.; Rodhe, H.; Huisingh, D. A systematic approach to incorporate sustainability into universities and course curricula. J. Clean. Prod. 2006, 14, 797–809. [Google Scholar] [CrossRef]
- Hollander, R.; Arenberg, C.R. (Eds.) Ethics Education and Scientific Education Research: What’s Been Learned? What Should Be Done? Summary of a Workshop; National Academy of Engineering: Washington, DC, USA, 2009. [Google Scholar]
- Allen, M.W. Strategic Communication for Sustainable Organizations: Theory and Practice; Springer: New York, NY, USA, 2016. [Google Scholar]
- Hiezman, H.; Liu, H. Becoming green, becoming leaders: Identity narratives in sustainability leadership. Manag. Learn. 2017, 49, 40–58. [Google Scholar] [CrossRef]
- National Science Foundation (NSF). Improving Undergraduate STEM Education: Education and Human Resources (IUSE: ERH). Available online: https://www.nsf.gov/funding/pgm_summ.jsp?pims_id=505082\ (accessed on 3 March 2020).
- U.S. Department of Education. Science, Technology, Engineering, and Math Including Computer Science. Available online: https://www.ed.gov/stem (accessed on 4 April 2020).
- Zwickle, A.; Koontz, T.M.; Slagle, K.M.; Bruskotter, J.T. Assessing sustainability knowledge of a student population. Int. J. Sustain. High. Educ. 2014, 15, 375–389. [Google Scholar] [CrossRef]
- Zwickle, A.; Jones, K. Sustainability knowledge and attitudes-Assessing latent constructs. In Handbook of Sustainability and Social Science Research; Leal Filho, W., Marans, R.W., Callewaert, J., Eds.; Springer: New York, NY, USA, 2018; pp. 435–451. [Google Scholar]
- Somers, M.J.; Passerini, K.; Parhankangas, A.; Casal, J. Using mind maps to study how business school students and faculty organize and apply general business knowledge. Int. J. Manag. Educ. 2014, 12, 1–13. [Google Scholar] [CrossRef]
- Lourdel, N.; Gondran, N.; Laforest, V.; Debray, B.; Brodhag, C. Sustainable development cognitive map: A new method of evaluating student understanding. Int. J. Sustain. High. Educ. 2007, 8, 170–182. [Google Scholar] [CrossRef]
- Wood, M.D.; Bostrom, A.; Bridges, T.; Linkov, I. Cognitive mapping tools: Review and risk management needs. Risk Anal. 2012, 32, 1333–1348. [Google Scholar] [CrossRef] [PubMed]
- Gul, R.B.; Boman, J.A. Concept mapping: A strategy for teaching and evaluation in nursing education. Nurse Educ. Pract. 2006, 6, 199–206. [Google Scholar] [CrossRef] [PubMed]
- Martínez, G.; Pérez, A.L.; Suero, M.I.; Pardo, P.J. The effectiveness of concept maps in teaching physics concepts applied to engineering education: Experimental comparison of the amount of learning achieved with and without concept maps. J. Sci. Educ. Technol. 2013, 22, 204–214. [Google Scholar] [CrossRef]
- Omer, U.; Farooq, M.S.; Abid, A. Cognitive learning analytics using assessment data and concept map: A framework-based approach for sustainability of programming courses. Sustainability 2020, 12, 6990. [Google Scholar] [CrossRef]
- Sellmann, D.; Lieflander, A.K.; Bogner, F. Concept maps in the classroom: A new approach to reveal students’ conceptual change. J. Educ. Res. 2015, 108, 250–257. [Google Scholar] [CrossRef]
- Okereke, C.; Wittneben, B.; Bowen, F. Climate change: Challenging business, transforming politics. Bus. Soc. 2012, 51, 7–30. [Google Scholar] [CrossRef]
- Peoples, R. Preparing today for a sustainable future. J. Manag. Educ. 2009, 33, 376–383. [Google Scholar] [CrossRef]
- Eisenhardt, K.M.; Graebner, M.E.; Sonenshein, S. Grand challenges and inductive methods: Rigor without rigor mortis. Acad. Manag. J. 2016, 59, 1113–1123. [Google Scholar] [CrossRef]
- Henderson, C.; Mestre, J.P.; Slakey, L.L. Cognitive science research can improve undergraduate STEM instruction: What are the barriers? Policy Insights Beh. Brain Sci. 2015, 2, 51–60. [Google Scholar] [CrossRef]
- Norton, G.; Thompson, A. Ethics and sustainable development: The virtues of an adaptive approach to environmental choice. In Handbook of Sustainable Development, 2nd ed.; Atkinson, G., Dietz, S., Neumayer, E., Agarawal, M., Eds.; Edward Elgar: Northamptom, MA, USA, 2014; pp. 105–124. [Google Scholar]
- Twilley, N. Trailblazers: A New Plan to Solve California’s Fire Problem. New Yorker. 2019. Available online: https://www.newyorker.com/magazine/2019/08/26/a-trailblazing-plan-to-fight-california-wildfires (accessed on 10 November 2020).
- Beach, A.L.; Henderson, C.; Finkelstein, N. Facilitating change in undergraduate STEM education. Chang. Mag. High. Learn. 2012, 44, 52–59. [Google Scholar] [CrossRef]
- Laboy, J.B.; Singer, S.R.; George, M.D.; Schweingruber, H.A.; Hilton, M.L. Effective practices in undergraduate STEM education part 1: Examining the evidence. CBE-Life Sci. Educ. 2009, 8, 157–161. [Google Scholar] [CrossRef][Green Version]
- Association for the Advancement of Sustainability in Higher Education (AASHE). Campus Sustainability Hub: Academic Programs. Available online: https://hub.aashe.org/browse/types/academicprogram/ (accessed on 9 November 2020).
- Craig, C.A.; Petrun Sayers, E.L.; Gilbertz, S.; Karam, R.; Feng, S. The Role of Stem-Based Sustainability in Business and Management Curricula: Exploring Cognitive and Affective Outcomes in University Students. J. Manag. Educ. (under review).
- Craig, C.A. Managinge wildfire disasters in the Rocky Mountains. CASE J. 2019, 15, 78–87. [Google Scholar] [CrossRef]
- Craig, C.A.; Petrun Sayers, E.L. Sustainable development in international markets: A metrics-based case study. SAGE Bus. Cases 2020. [Google Scholar] [CrossRef]
- Gilbertz, S.; Hall, D. Bringing Sustainability to the Ground Level: Competing Demands in the Yellowstone River Valley; Business Expert Press: New York, NY, USA, (forthcoming).
- Novak, J.D.; Gowin, D.B.; Johansen, G. The use of concept mapping and knowledge vee mapping with junior high school science students. Sci. Educ. 1983, 67, 625–645. [Google Scholar] [CrossRef]
- Novak, J.D. Clarify with concept maps: A tool for students and teachers alike. Sci. Teach. 1991, 58, 45–49. [Google Scholar]
- Novak, J.D.; Canas, A.J. The origins of the concept mapping tool and the continuing evolution of the tool. Inform. Visual. 2006, 5, 175–184. [Google Scholar] [CrossRef]
- Segalas, J.; Mulder, K.F.; Ferrer-Balas, D. What do EESD ‘experts’ think sustainability is? Which pedagogy is suitable to learn it? Results from interviews and Cmaps analysis gathered at EESD 2008. Int. J. Sustain. High. Educ. 2012, 13, 293–304. [Google Scholar] [CrossRef]
- Rebich, S.; Gautier, C. Concept mapping to reveal prior knowledge and conceptual change in a mock summit course on global climate change. J. Geosci. Educ. 2005, 53, 355–365. [Google Scholar] [CrossRef]
- Novak, J.D.; Canas, A.J. The Theory Underlying Concept Maps and How to Construct Them; Institute for Human and Machine Cognition: Ocala, FL, USA, 2006. [Google Scholar]
- Kinchin, I.M.; Hay, D.B.; Adams, A. How a qualitative approach to concept map analysis can be used to aid learning by illustrating patterns of conceptual development. Educ. Res. 2000, 42, 43–57. [Google Scholar] [CrossRef]
- Chen, J.; Wang, M.; Dede, C.; Grotzer, T.A. Design of a three-dimensional cognitive mapping approach to support inquiry learning. Educ. Technol. Soc. 2017, 20, 191–204. [Google Scholar]
- Segalas, J.; Ferrer-Balas, D.; Mulder, K.F. Conceptual maps: Measuring learning processes of engineering students concerning sustainable development. Eur. J. Eng. Educ. 2008, 33, 297–306. [Google Scholar] [CrossRef]
- Ritchie, J.; Spencer, L. Qualitative data analysis for applied policy research. In Analyzing Qualitative Data; Bryman, A., Burgess, R.G., Eds.; Routledge: New York, NY, USA, 1994; pp. 173–194. [Google Scholar]
- Iverson, J.O.; McPhee, R.D. Communicating knowing through communities of practice: Exploring internal communicative processes and differences among CoPs. J. Appl. Commun. Res. 2008, 36, 176–199. [Google Scholar] [CrossRef]
- Dedoose Software. Web Application for Managing, Analyzing, and Presenting Qualitative and Mixed Method Research Data. Available online: https://www.dedoose.com/ (accessed on 9 November 2020).
- Landis, J.R.; Koch, G.G. The measurement of observer agreement for categorical data. Biometrics 1977, 33, 159–174. [Google Scholar] [CrossRef] [PubMed]
- Cozzolino, D.; Power, A.; Chapman, J. Interpreting and reporting principal component analysis in food science analysis and beyond. Food Anal. Methods 2019, 12, 2469–2473. [Google Scholar] [CrossRef]
- Sanguansat, P. (Ed.) Principal Component Analysis: Engineering Applications; IntechOpen: London, UK, 2012. [Google Scholar]
- Bakhru, K.A.; Sanghi, S.; Medury, Y. A principal component analysis of teaching competencies required for management education. Arth Prabhand A J. Econ. Manag. 2013, 2, 1–15. [Google Scholar]
- Erguven, M. Comparison of the Efficiency of Principal Component Analysis and Multiple Linear Regression to Determine Studetns’ Academic Achievement; IEEE: Piscataway, NJ, USA, 2013. [Google Scholar] [CrossRef]
- Yang, S.; Lu, O.; Huang, J.; Ogata, H.; Lin, A. Predicting students’ academic performance using multiple linear regression and principle component analysis. J. Inf. Process. 2018, 26, 170–176. [Google Scholar]
- Earle, A.G.; Layva-de la Hiz, D.I. The wicked problem of teaching about wicked problems: Design thinking and emerging technologies in sustainability education. Manag. Learn. 2020. [Google Scholar] [CrossRef]
- Kurucz, E.C.; Colbert, B.A.; Marcus, J. Sustainability as a provocation to rethink management education: Building a progressive education practice. Manag. Learn. 2013, 45, 437–457. [Google Scholar] [CrossRef]
- Kagawa, F. Dissonance in students’ perceptions of sustainable development and sustainability: Implications for curriculum change. Int. J. Sustain. High. Educ. 2007, 8, 317–338. [Google Scholar] [CrossRef]
- Shephard, K. Higher education for sustainability: Seeking affective learning outcomes. Int. J. Sustain. High. Educ. 2008, 9, 87–98. [Google Scholar] [CrossRef]
- Brower, H.H. Sustainable development through service learning: A pedagogical framework and case example in a third world context. Acad. Manag. Learn. Educ. 2011, 10, 58–76. [Google Scholar] [CrossRef]
- Montiel, I.; Antolin-Lopez, R.; Gallo, P.J. Emotions and sustainability: A literary genre-based framework for environmental sustainability management education. Acad. Manag. Learn. Educ. 2018, 17, 155–183. [Google Scholar] [CrossRef]
- Ausubel, D.P. Educational Psychology: A Cognitive View; Rinehart and Winston: New York, NY, USA, 1968. [Google Scholar]
- Ausubel, D.P.; Novak, J.D.; Hanesian, H. Educational Psychology: A Cognitive View, 2nd ed.; Holt, Rinehart, and Winston: New York, NY, USA, 1978. [Google Scholar]
- Ajzen, I.; Joyce, N.; Sheikh, S.; Cote, N.G. Knowledge and the prediction of behavior: The role of information accuracy in the theory of planned behavior. Basic App. Soc. Psychol. 2011, 33, 101–117. [Google Scholar] [CrossRef]
- Shrivastava, P. Pedagogy of passion for sustainability. Acad. Manag. Learn. Educ. 2010, 9, 443–455. [Google Scholar] [CrossRef]
- Heeren, A.J.; Singh, A.S.; Zwickle, A.; Koontz, T.M.; Slagle, K.M.; McCreery, A.C. Is sustainability knowledge half the battle? An examination of sustainability knowledge, attitudes, norms, and efficacy to understand sustainable behaviours. Int. J. Sustain. High. Educ. 2016, 17, 613–632. [Google Scholar] [CrossRef]
- Mento, A.J.; Martinelli, P.; Jones, R.M. Mind mapping in executive education: Applications and outcomes. J. Manag. Dev. 1999, 18, 390–407. [Google Scholar] [CrossRef]


| Treatment (n = 110) | Comparison (n = 57) | |
|---|---|---|
| Gender | ||
| female | 61 (55.5%) | 39 (68.4%) |
| male | 49 (44.5%) | 18 (31.6%) |
| other | - | - |
| Race/Ethnicity | ||
| Hispanic | - | - |
| Non-Hispanic American Indian or Alaskan Native | 7 (6.4%) | 2 (3.5%) |
| Non-Hispanic Asian | 3 (2.7%) | 1 (1.8%) |
| Non-Hispanic Black | - | 2 (3.5%) |
| Non-Hispanic Hawaiian or Pacific Islander | - | - |
| Non-Hispanic White | 105 (90.9%) | 52 (91.4%) |
| Student Classification | ||
| freshman | 9 (8.2%) | 4 (7.0%) |
| sophomore | 14 (14.5%) | 10 (17.5%) |
| junior | 39 (37.3%) | 14 (24.6%) |
| senior | 68 (38.2%) | 29 (49.1%) |
| graduate | 2 (1.8%) | - |
| Latino, Hispanic, or Spanish Speaking | 5 (4.5%) | 3 (5.3%) |
| International | 5 (4.5%) | 1 (1.8%) |
| Employment status | ||
| full-time | 38 (34.5%) | 32 (56.1%) |
| part-time | 40 (36.4%) | 19 (33.3%) |
| unemployed | 32 (29.1%) | 6 (10.5%) |
| Treatment (n = 110) | Test | Mean | SD | SE | Corr. | Sig. |
|---|---|---|---|---|---|---|
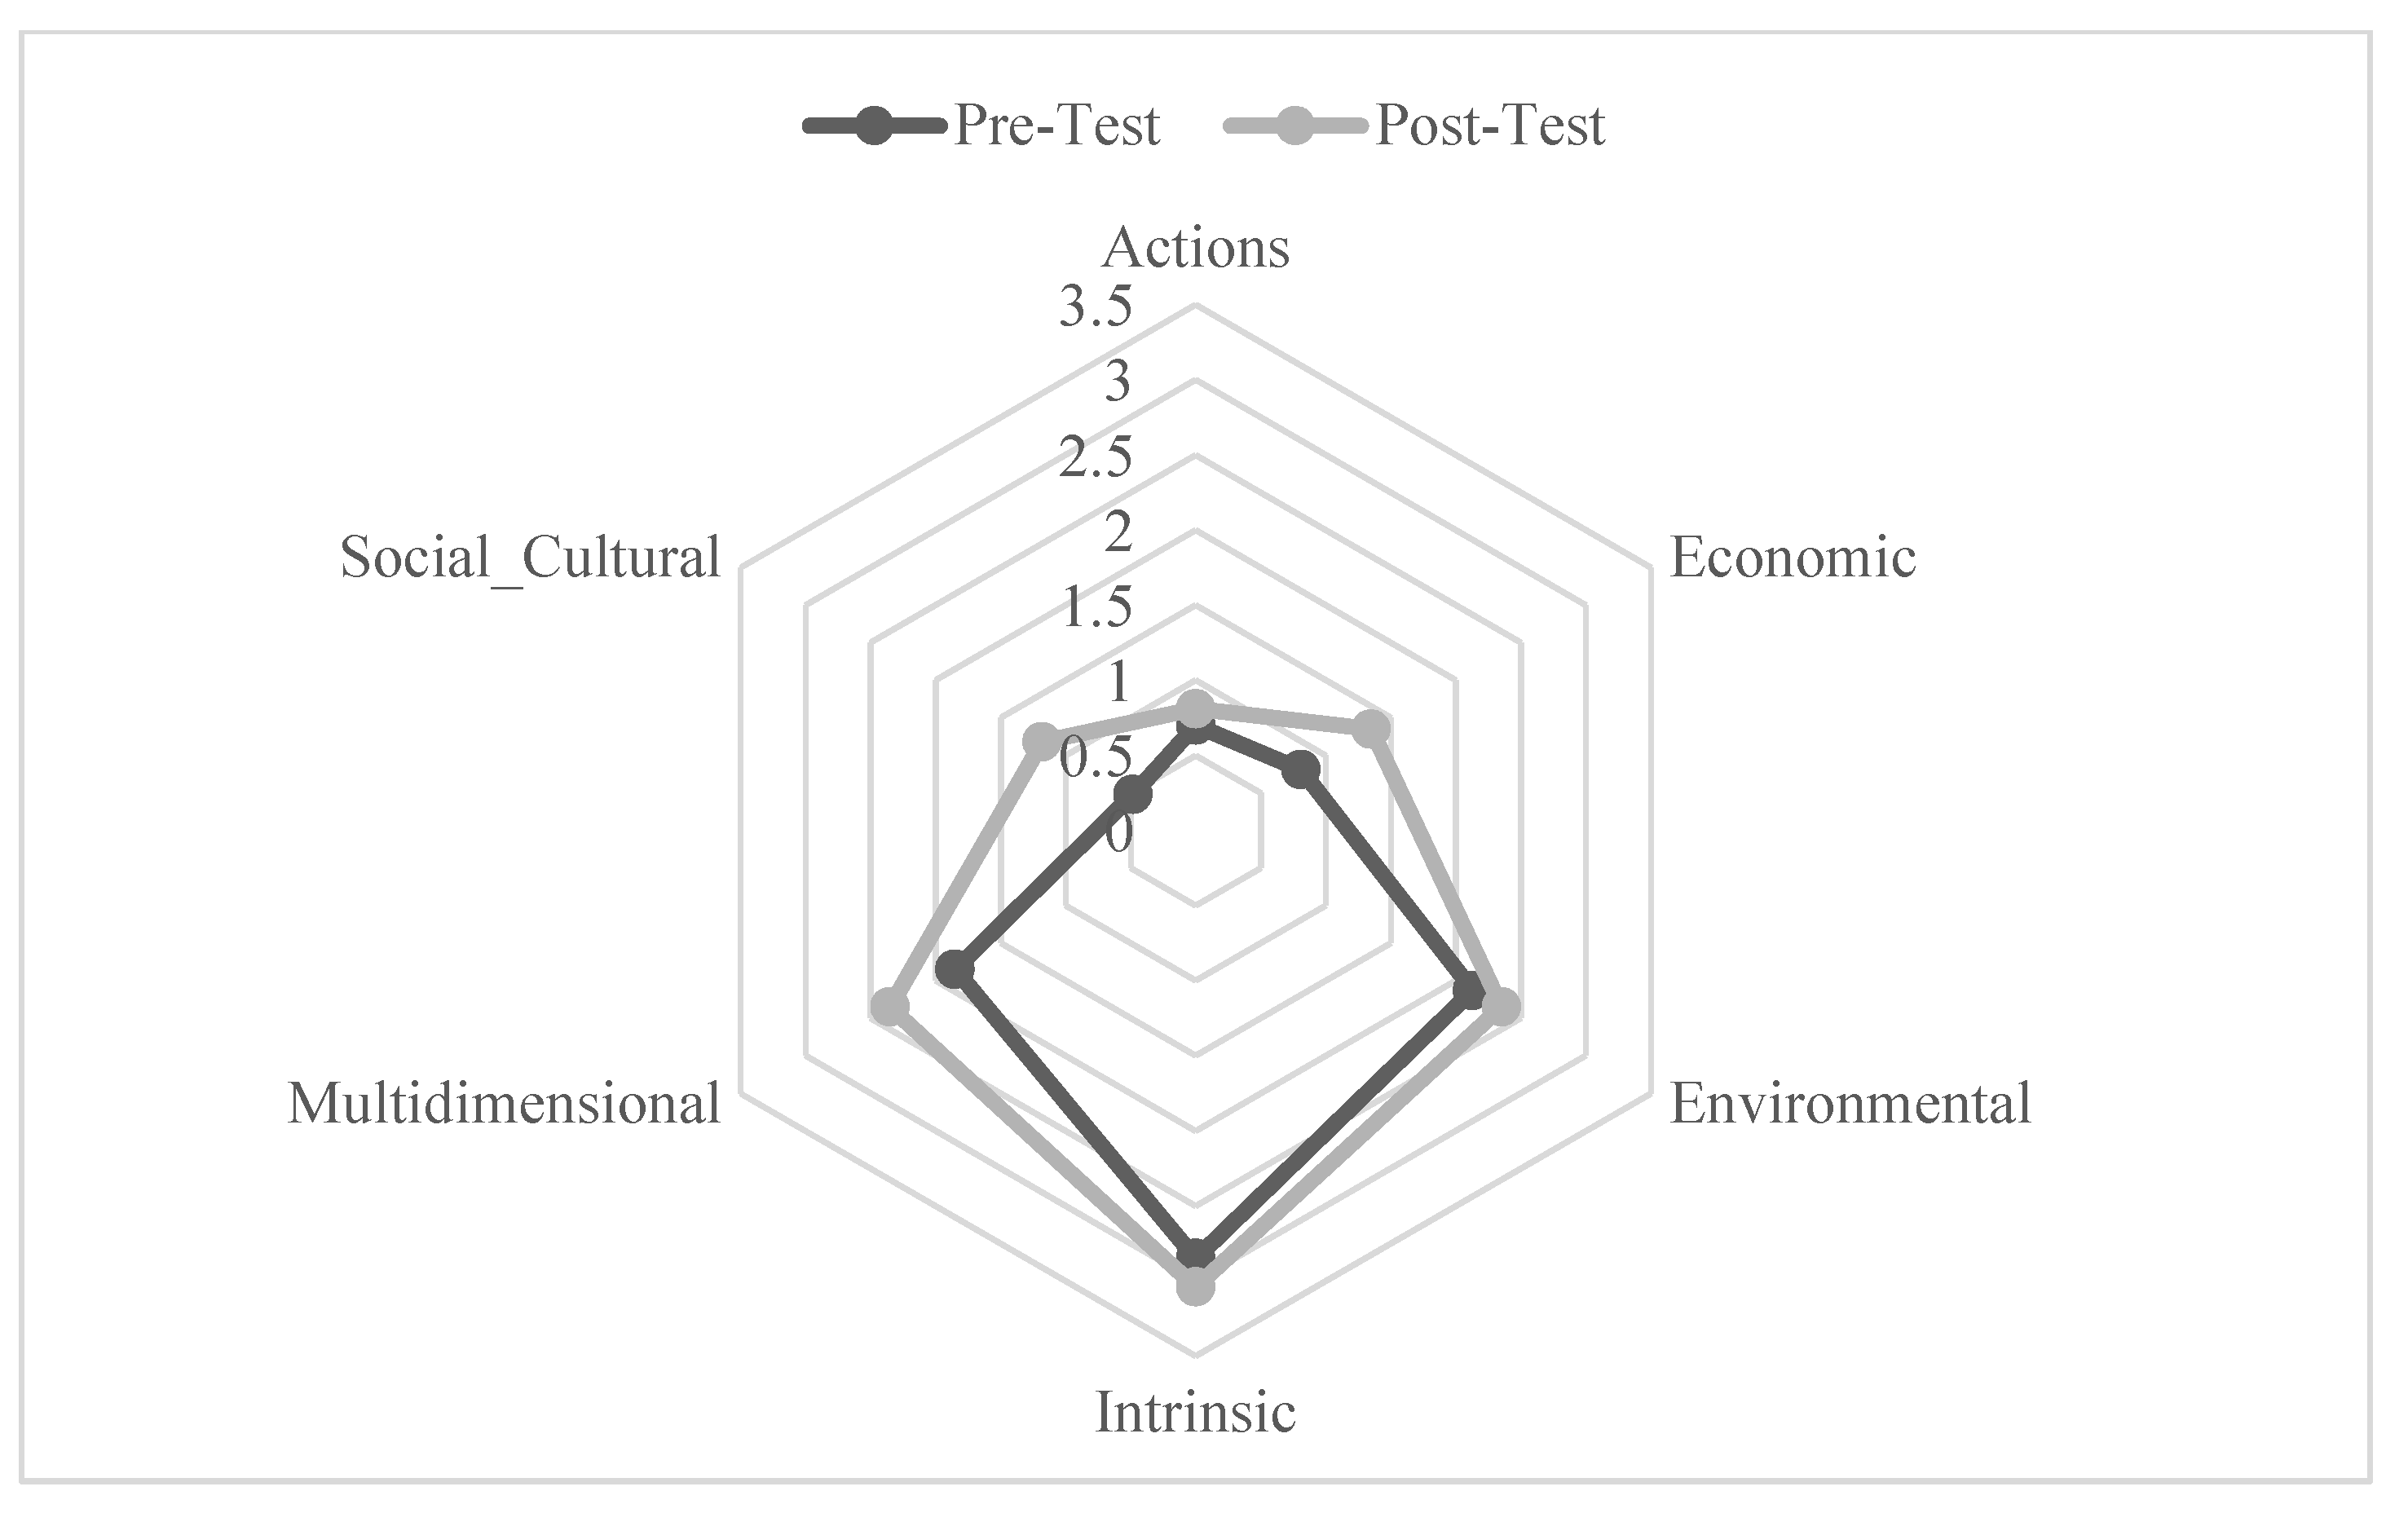
| all Codes | Pre | 8.82 | 4.23 | 0.40 | 0.53 | 0.000 |
| Post | 11.06 | 4.99 | 0.48 | |||
| actions | Pre | 0.70 | 0.98 | 0.09 | 0.24 | 0.012 |
| Post | 0.81 | 1.21 | 0.12 | |||
| economic | Pre | 0.81 | 1.15 | 0.11 | 0.37 | 0.000 |
| Post | 1.35 | 1.58 | 0.15 | |||
| environmental | Pre | 2.13 | 3.03 | 0.29 | 0.46 | 0.000 |
| Post | 2.35 | 2.53 | 0.24 | |||
| intrinsic | Pre | 2.85 | 2.66 | 0.25 | 0.63 | 0.000 |
| Post | 3.04 | 3.11 | 0.30 | |||
| multidimensional | Pre | 1.85 | 1.64 | 0.16 | 0.32 | 0.001 |
| Post | 2.35 | 1.75 | 0.17 | |||
| social–cultural | Pre | 0.48 | 0.92 | 0.09 | 0.33 | 0.000 |
| Post | 1.18 | 1.47 | 0.14 | |||
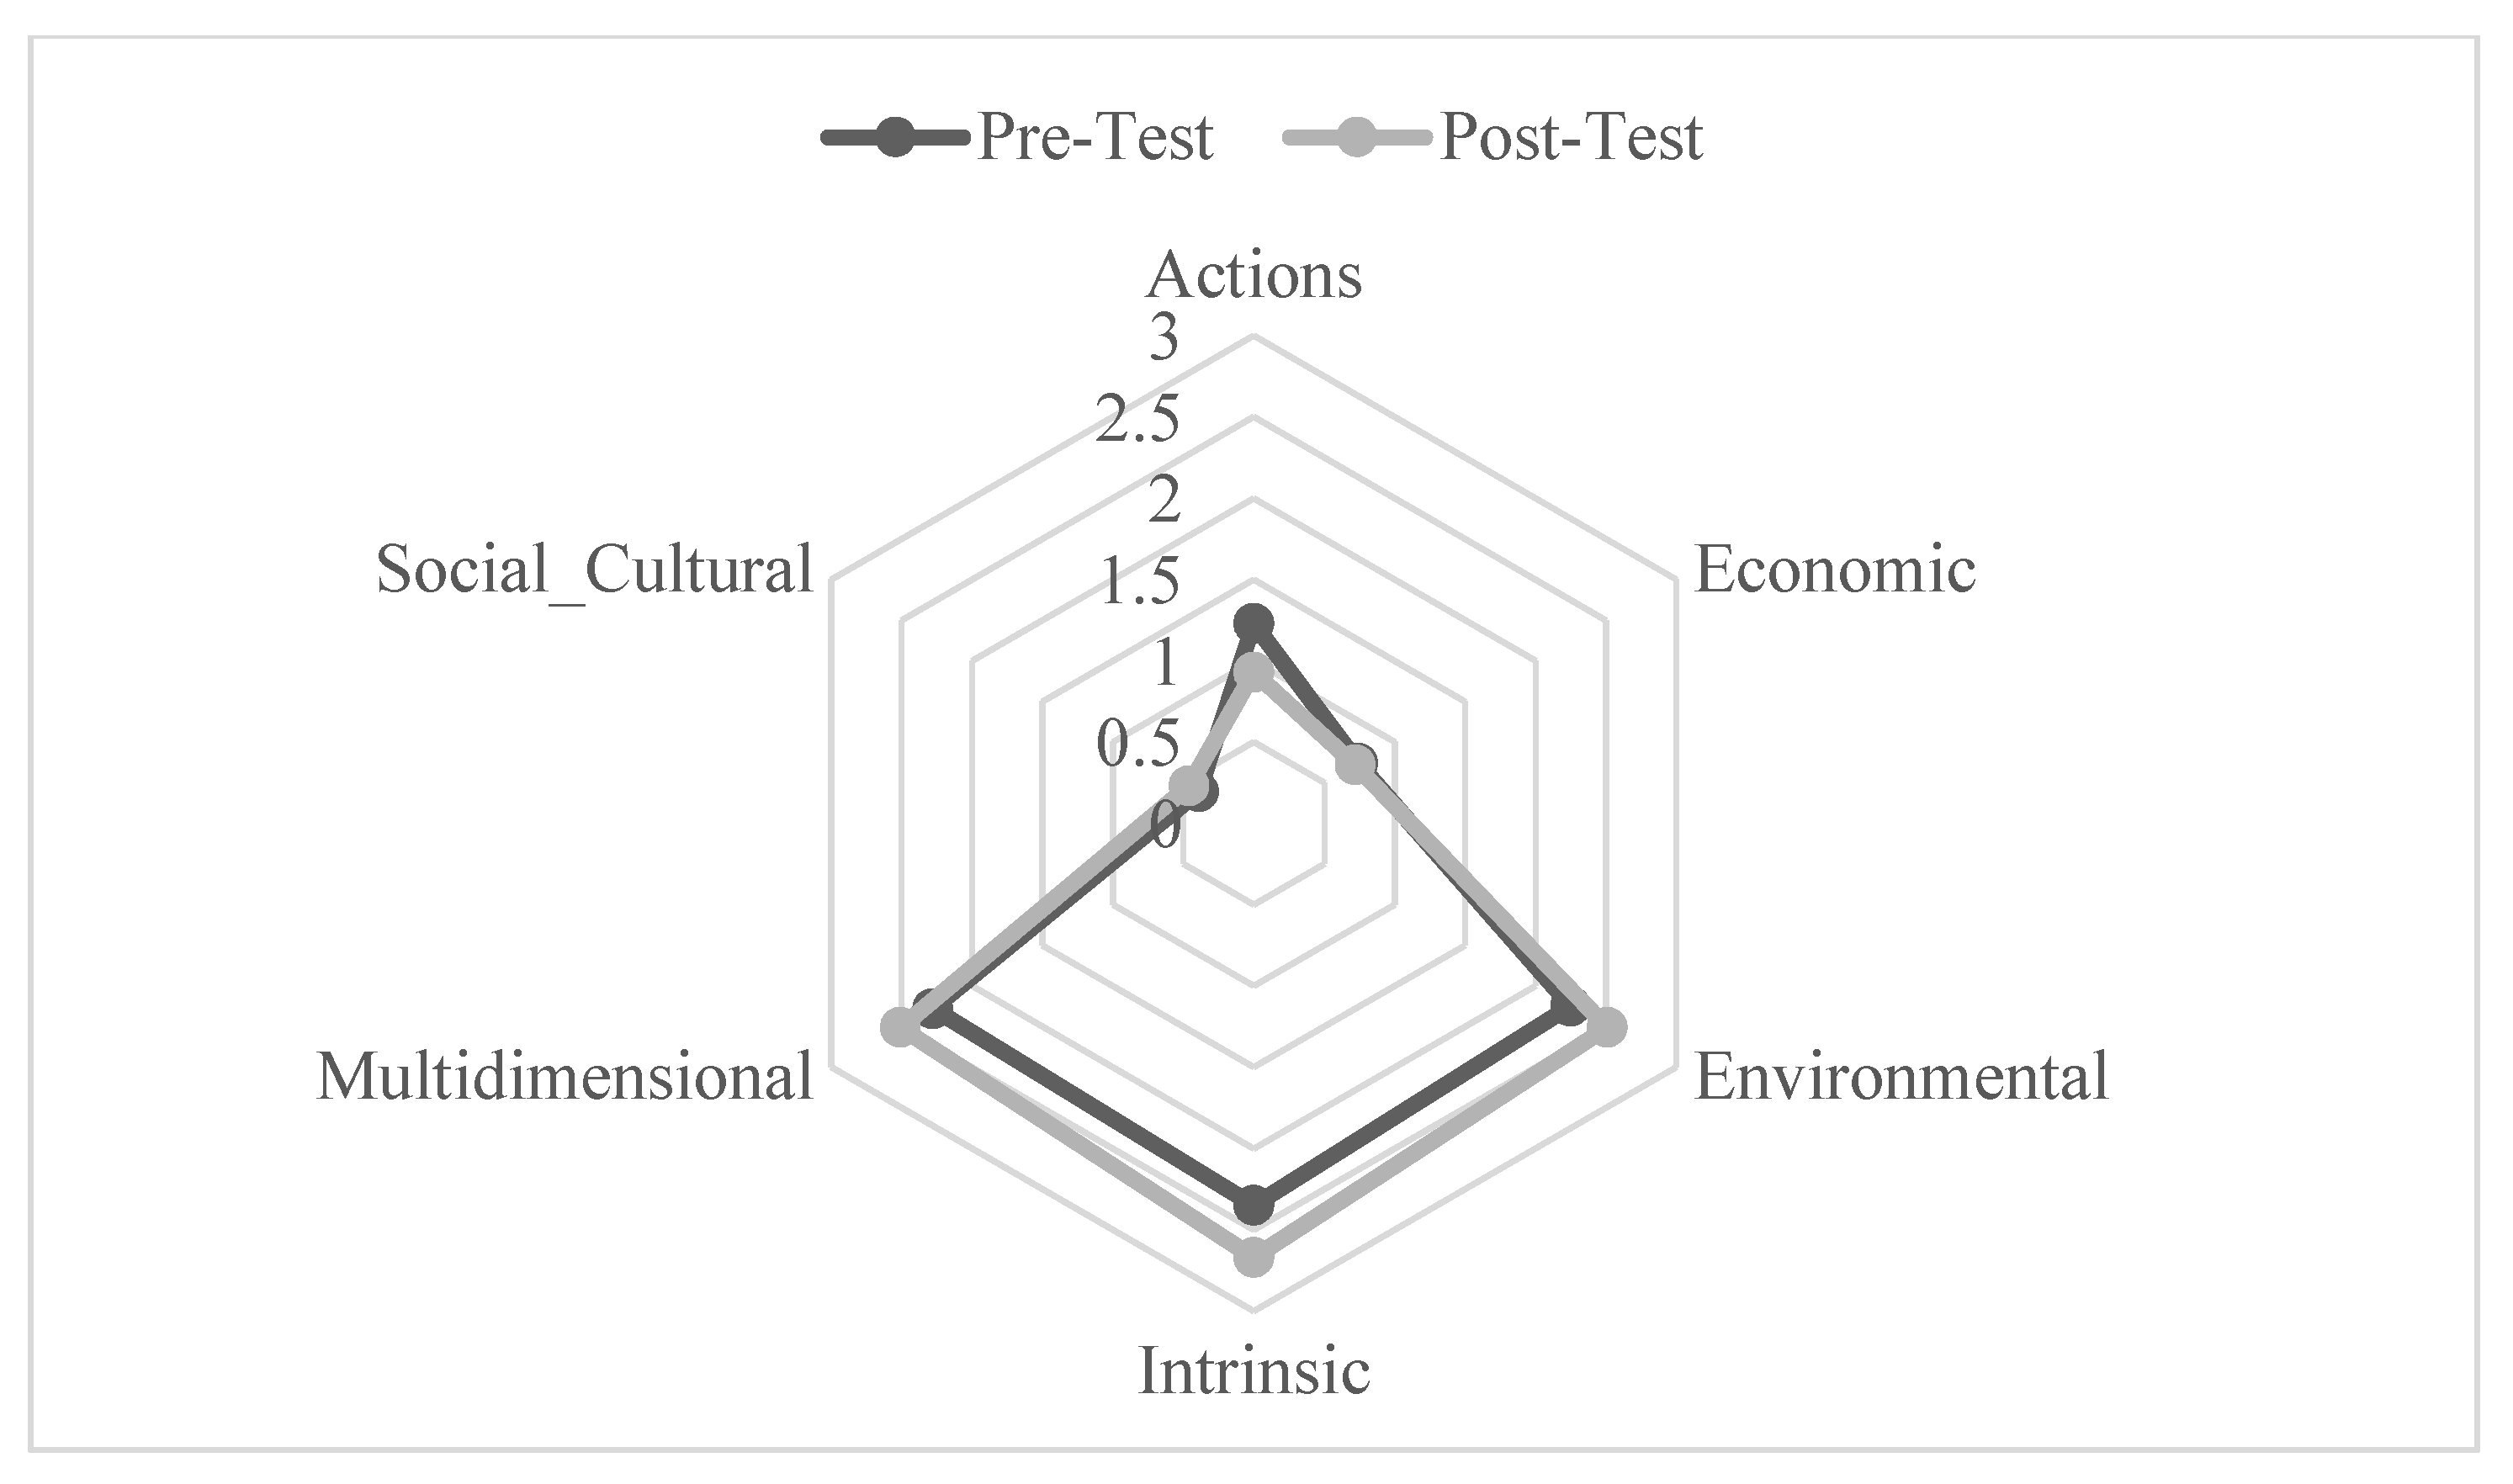
| Comparison (n = 57) | Test | Mean | SD | SE | Corr. | Sig. |
| all codes | Pre | 9.23 | 4.15 | 0.55 | 0.62 | 0.000 |
| Post | 9.79 | 4.31 | 0.57 | |||
| actions | Pre | 1.23 | 1.58 | 0.21 | 0.40 | 0.002 |
| Post | 0.93 | 1.41 | 0.19 | |||
| economic | Pre | 0.74 | 0.81 | 0.11 | 0.47 | 0.000 |
| Post | 0.72 | 0.92 | 0.12 | |||
| environmental | Pre | 2.25 | 2.87 | 0.38 | 0.53 | 0.000 |
| Post | 2.51 | 3.31 | 0.44 | |||
| intrinsic | Pre | 2.35 | 2.26 | 0.30 | 0.65 | 0.000 |
| Post | 2.67 | 2.36 | 0.31 | |||
| multidimensional | Pre | 2.28 | 1.69 | 0.22 | 0.23 | 0.082 |
| Post | 2.51 | 1.72 | 0.23 | |||
| social–cultural | Pre | 0.39 | 0.70 | 0.09 | 0.36 | 0.006 |
| Post | 0.46 | 0.85 | 0.11 |
| Treatment (n = 110) | M | SD | SE | t | df | Sig. (2-tail) |
|---|---|---|---|---|---|---|
| total | 2.25 | 4.53 | 0.43 | 5.20 | 109 | 0.000 |
| action | 0.11 | 1.36 | 0.13 | 0.84 | 109 | 0.403 |
| economic | 0.54 | 1.58 | 0.15 | 3.57 | 109 | 0.001 |
| environmental | 0.22 | 2.91 | 0.28 | 0.79 | 109 | 0.434 |
| intrinsic | 0.18 | 2.51 | 0.24 | 0.76 | 109 | 0.450 |
| multidimensional | 0.50 | 1.99 | 0.19 | 2.64 | 109 | 0.009 |
| social–cultural | 0.70 | 1.46 | 0.14 | 5.04 | 109 | 0.000 |
| Comparison (n = 57) | M | SD | SE | t | df | Sig. (2-tail) |
| total | 0.56 | 3.72 | 0.49 | 1.14 | 56 | 0.259 |
| action | −0.30 | 1.65 | 0.22 | −1.37 | 56 | 0.177 |
| economic | −0.02 | 0.90 | 0.12 | −0.15 | 56 | 0.883 |
| environmental | 0.26 | 3.01 | 0.40 | 0.66 | 56 | 0.512 |
| intrinsic | 0.32 | 1.93 | 0.26 | 1.24 | 56 | 0.222 |
| multidimensional | 0.23 | 2.11 | 0.28 | 0.82 | 56 | 0.419 |
| social–cultural | 0.07 | 0.88 | 0.12 | 0.60 | 56 | 0.551 |
| Initial Eigenvalues | Rotation Sums of Squared Loadings | |||||
|---|---|---|---|---|---|---|
| Component | Total | %Variance | %Cumulative | Total | %Variance | %Cumulative |
| Treatment Pre-Test (n = 110); χ2 = 54.024, df = 15, Sig. = 0.000, KMO = 0.541 | ||||||
| 1 | 1.76 | 29.29 | 29.29 | 1.56 | 25.99 | 25.99 |
| 2 | 1.24 | 20.65 | 49.94 | 1.44 | 23.95 | 49.94 |
| 3 | 0.96 | 16.05 | 65.99 | |||
| 4 | 0.92 | 15.25 | 81.24 | |||
| 5 | 0.62 | 10.36 | 91.60 | |||
| 6 | 0.50 | 8.40 | 100 | |||
| Treatment Post-Test (n = 110); χ2 = 127.79, df = 15, Sig. = 0.000, KMO = 0.541 | ||||||
| 1 | 2.18 | 36.40 | 36.40 | 2.18 | 36.40 | 36.40 |
| 2 | 1.25 | 20.77 | 57.17 | 1.25 | 20.77 | 57.17 |
| 3 | 0.96 | 16.03 | 73.20 | |||
| 4 | 0.73 | 12.24 | 85.43 | |||
| 5 | 0.62 | 10.39 | 95.83 | |||
| 6 | 0.25 | 4.17 | 100 | |||
| Comparison Pre-Test (n = 57); χ2 = 29.77, df = 15, Sig. = 0.013, KMO = 0.546 | ||||||
| 1 | 1.81 | 30.11 | 30.11 | 1.65 | 27.48 | 27.48 |
| 2 | 1.19 | 19.89 | 50.00 | 1.22 | 20.27 | 47.74 |
| 3 | 1.07 | 17.90 | 67.90 | 1.21 | 20.16 | 67.90 |
| 4 | 0.82 | 13.60 | 81.50 | |||
| 5 | 0.63 | 10.51 | 92.01 | |||
| 6 | 0.48 | 7.99 | 100 | |||
| Comparison Post-Test (n = 57); χ2 = 68.77, df = 15, Sig. = 0.000, KMO = 0.714 | ||||||
| 1 | 2.53 | 42.16 | 42.16 | 2.53 | 42.16 | 42.16 |
| 2 | 1.05 | 17.52 | 59.68 | 1.05 | 17.52 | 59.68 |
| 3 | 0.89 | 14.76 | 74.44 | |||
| 4 | 0.73 | 12.20 | 86.64 | |||
| 5 | 0.44 | 7.32 | 93.96 | |||
| 6 | 0.36 | 6.04 | 100 | |||
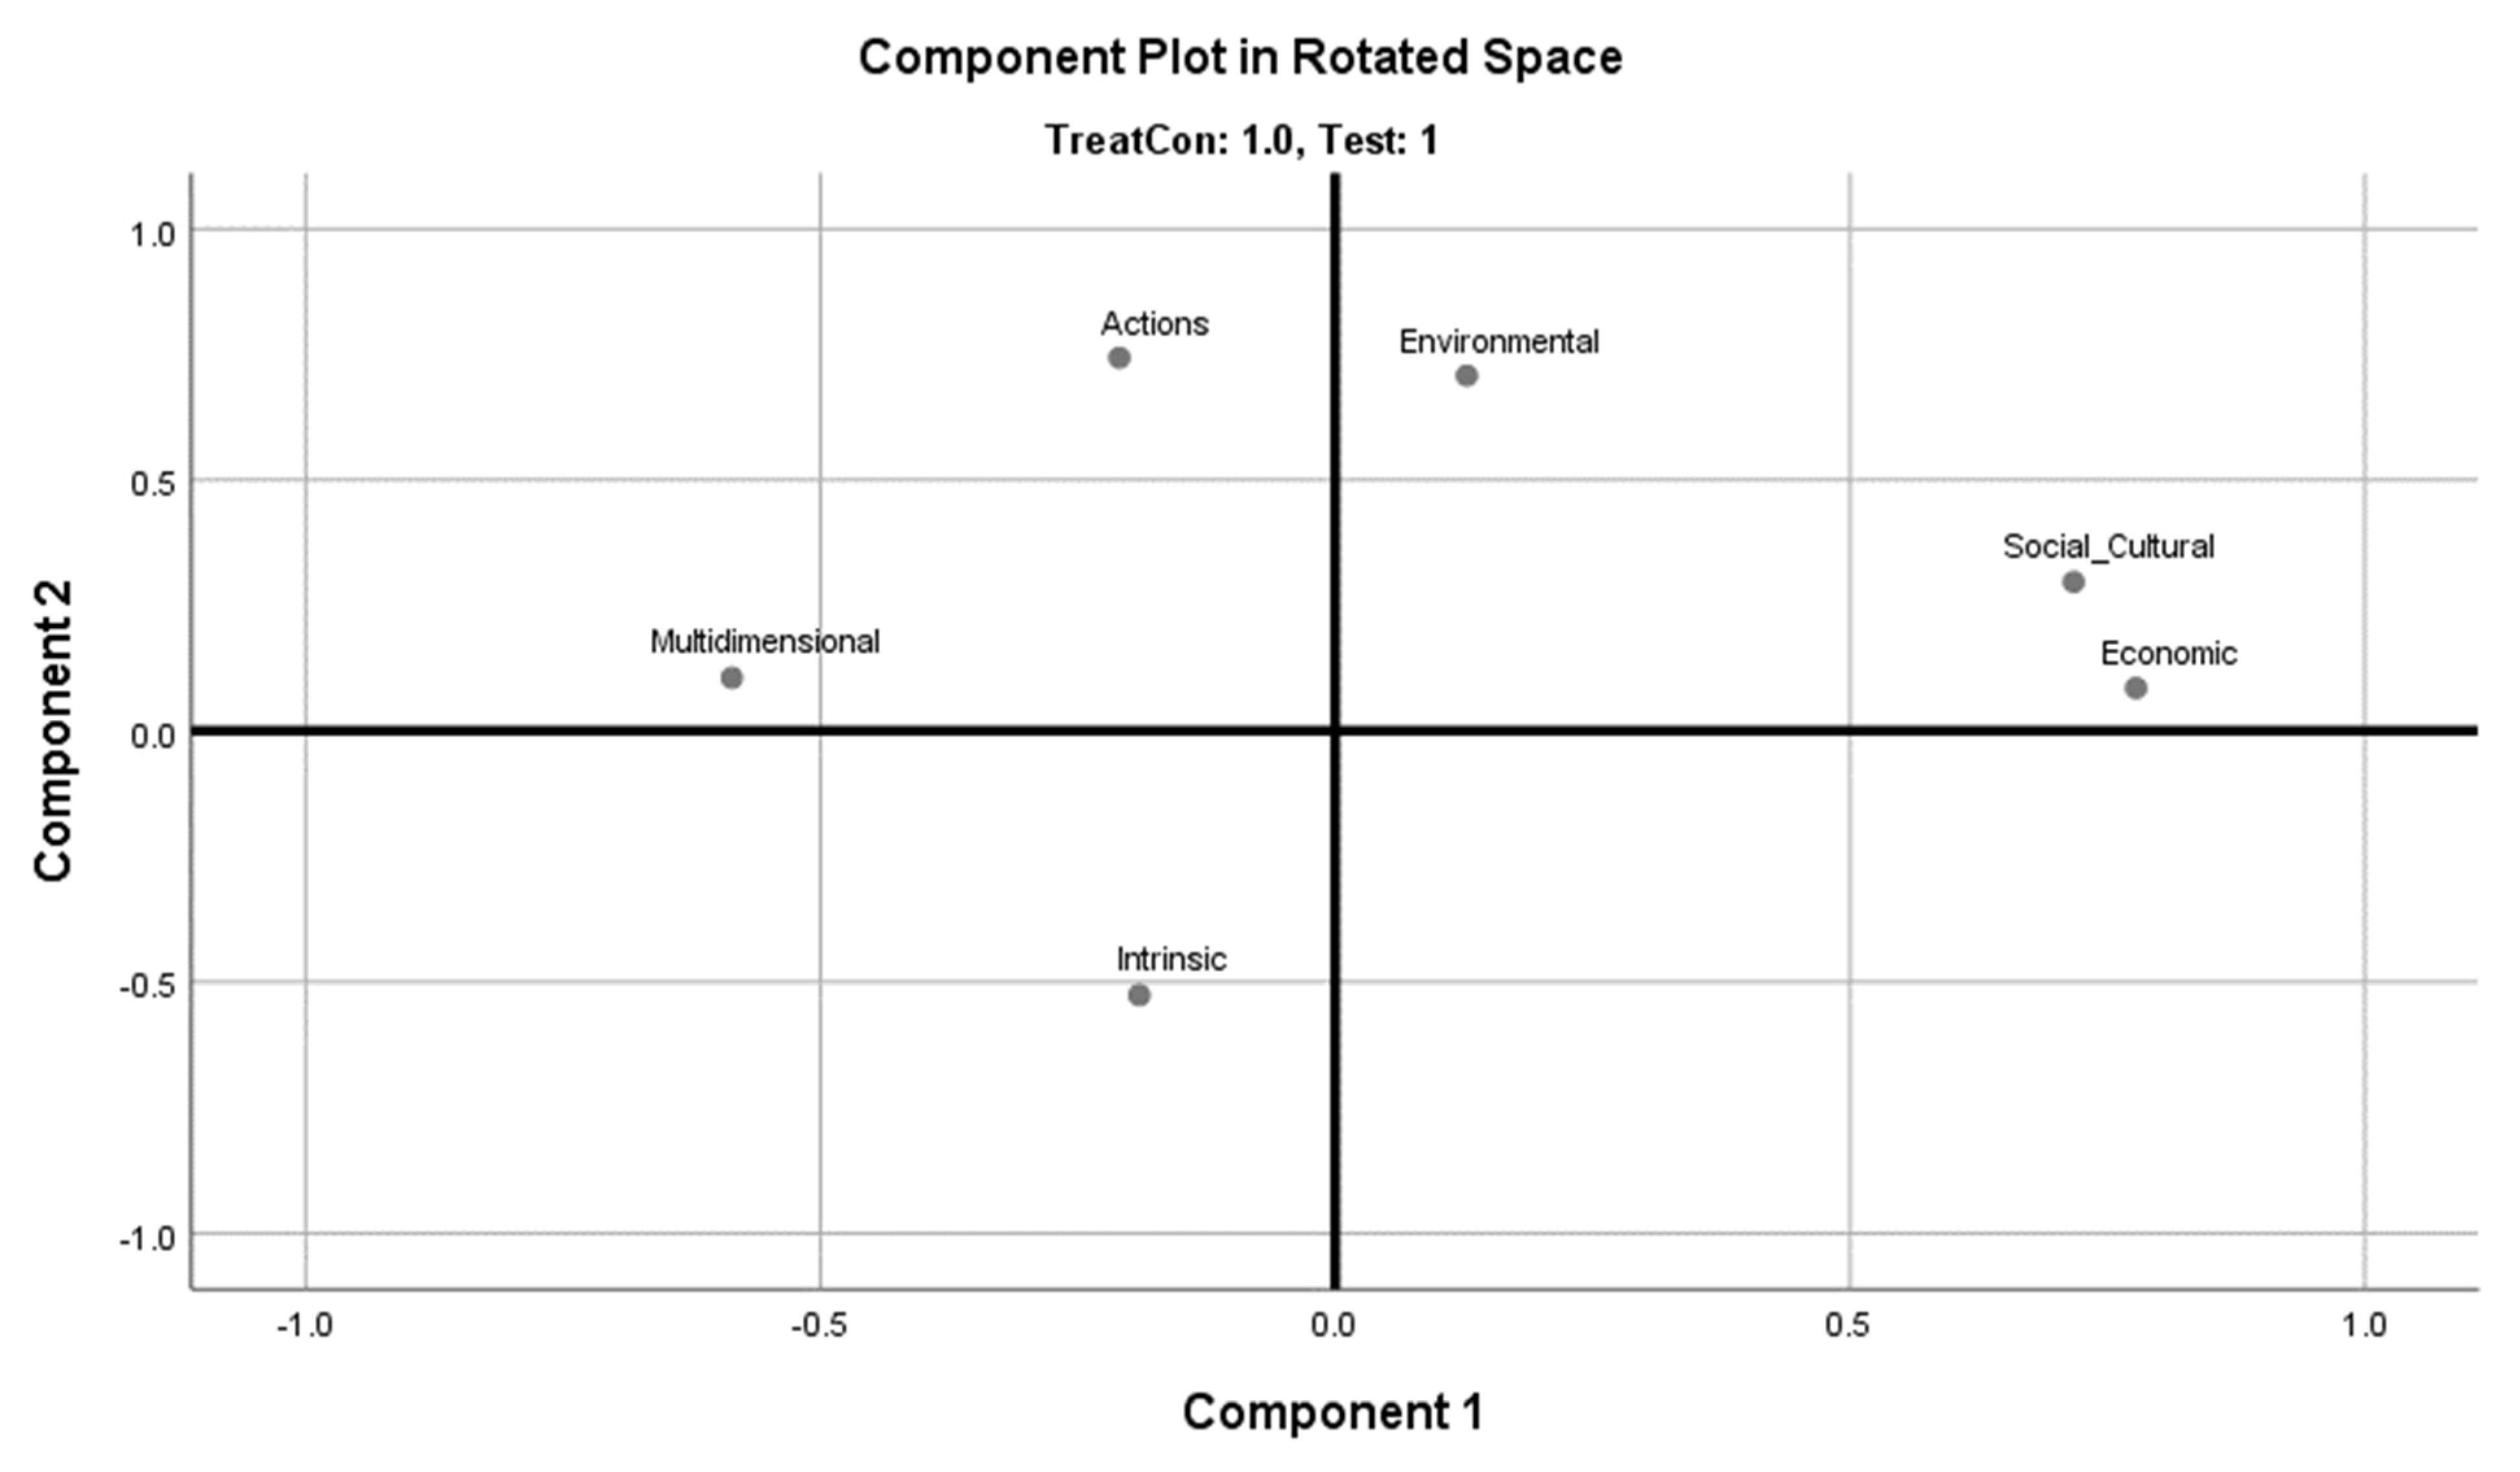
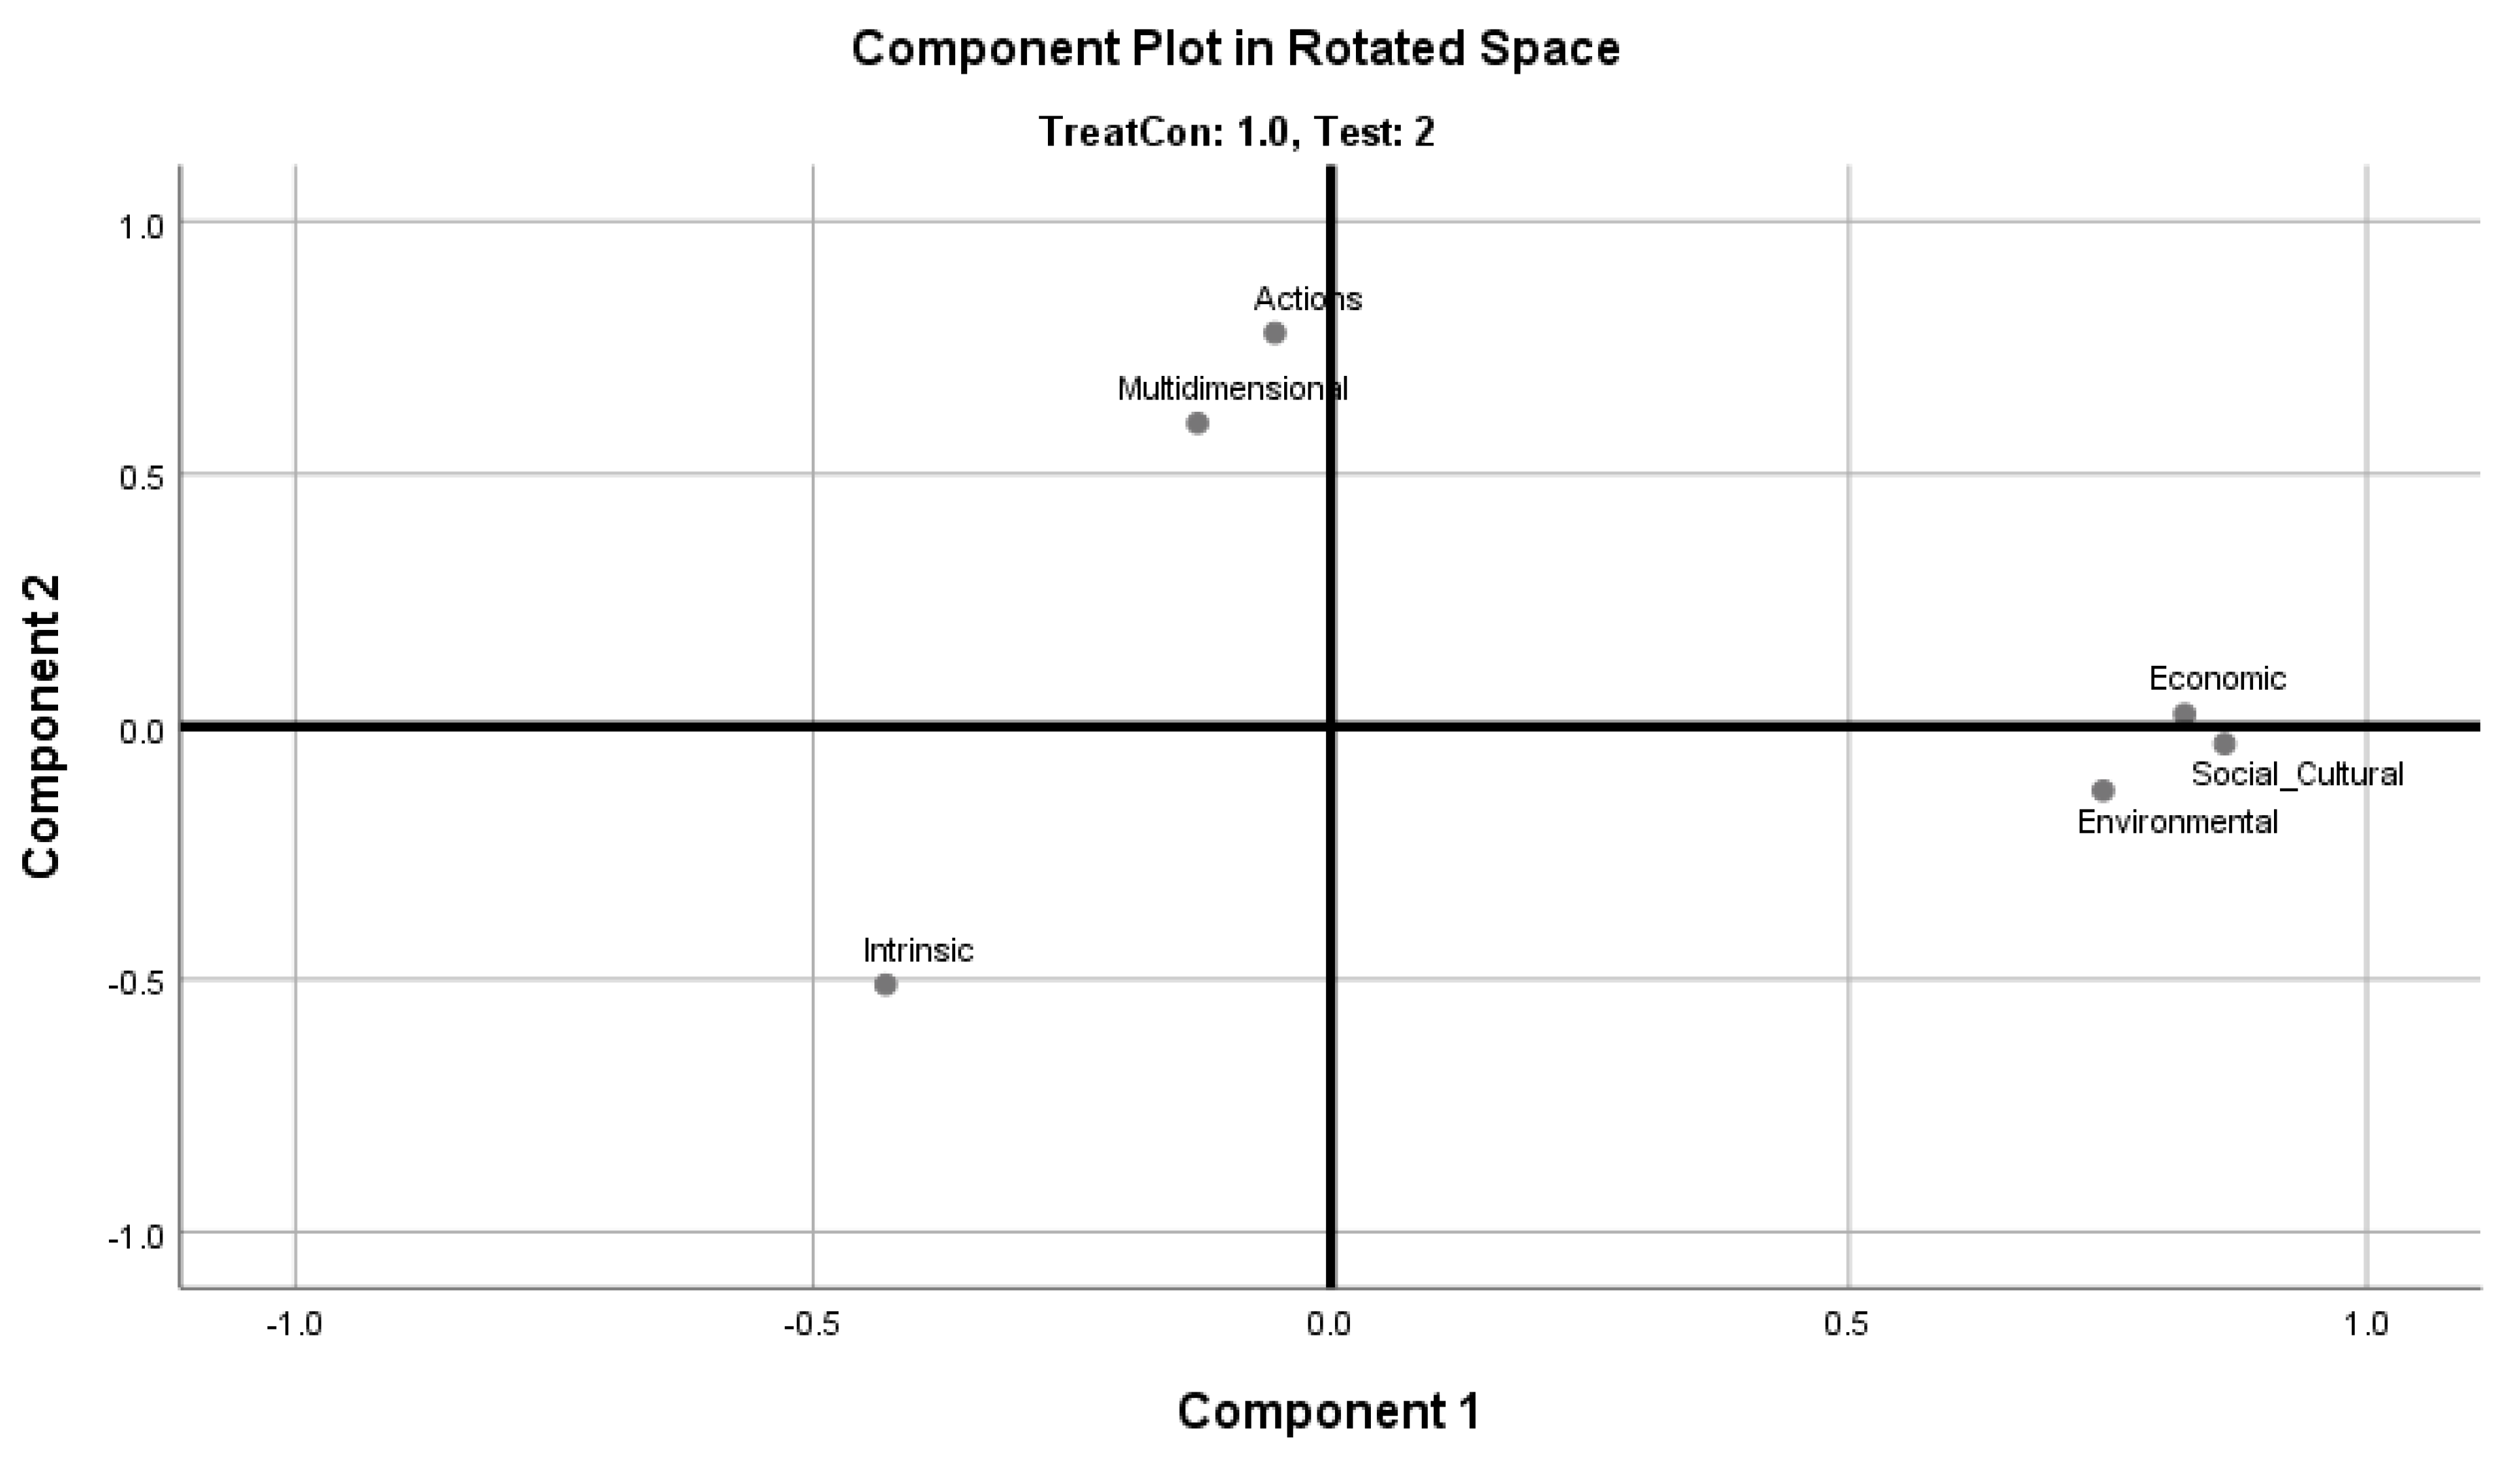
| Component | 1 | 2 | 3 |
|---|---|---|---|
| Treatment Pre-Test (n = 110) | |||
| economic | 0.78 | ||
| environmental | 0.71 | ||
| social–cultural | 0.72 | ||
| action | 0.74 | ||
| multidimensional | −0.59 | ||
| intrinsic | −0.53 | ||
| Treatment Post-Test test (n = 110) | |||
| economic | 0.82 | ||
| environmental | 0.75 | ||
| social–cultural | 0.86 | ||
| action | 0.78 | ||
| multidimensional | 0.60 | ||
| intrinsic | −0.43 | −0.51 | |
| Comparison Pre-Test (n = 57) | |||
| economic | 0.72 | ||
| environmental | 0.66 | −0.40 | |
| social–cultural | 0.83 | ||
| action | 0.81 | ||
| multidimensional | 0.35 | 0.68 | |
| intrinsic | 0.89 | ||
| Comparison Post-Test test (n = 57) | |||
| economic | 0.81 | ||
| environmental | 0.80 | ||
| social–cultural | 0.73 | ||
| action | 0.59 | ||
| multidimensional | 0.74 | ||
| intrinsic | −0.67 | ||
Publisher’s Note: MDPI stays neutral with regard to jurisdictional claims in published maps and institutional affiliations. |
© 2021 by the authors. Licensee MDPI, Basel, Switzerland. This article is an open access article distributed under the terms and conditions of the Creative Commons Attribution (CC BY) license (https://creativecommons.org/licenses/by/4.0/).
Share and Cite
Petrun Sayers, E.L.; Craig, C.A.; Skonicki, E.; Gahlon, G.; Gilbertz, S.; Feng, S. Evaluating STEM-Based Sustainability Understanding: A Cognitive Mapping Approach. Sustainability 2021, 13, 8074. https://doi.org/10.3390/su13148074
Petrun Sayers EL, Craig CA, Skonicki E, Gahlon G, Gilbertz S, Feng S. Evaluating STEM-Based Sustainability Understanding: A Cognitive Mapping Approach. Sustainability. 2021; 13(14):8074. https://doi.org/10.3390/su13148074
Chicago/Turabian StylePetrun Sayers, Elizabeth L., Christopher A. Craig, Emily Skonicki, Grace Gahlon, Susan Gilbertz, and Song Feng. 2021. "Evaluating STEM-Based Sustainability Understanding: A Cognitive Mapping Approach" Sustainability 13, no. 14: 8074. https://doi.org/10.3390/su13148074
APA StylePetrun Sayers, E. L., Craig, C. A., Skonicki, E., Gahlon, G., Gilbertz, S., & Feng, S. (2021). Evaluating STEM-Based Sustainability Understanding: A Cognitive Mapping Approach. Sustainability, 13(14), 8074. https://doi.org/10.3390/su13148074