
Performance Investigation of a Solar Photovoltaic/Diesel Generator Based Hybrid System with Cycle Charging Strategy Using BBO Algorithm


Abstract
:1. Introduction
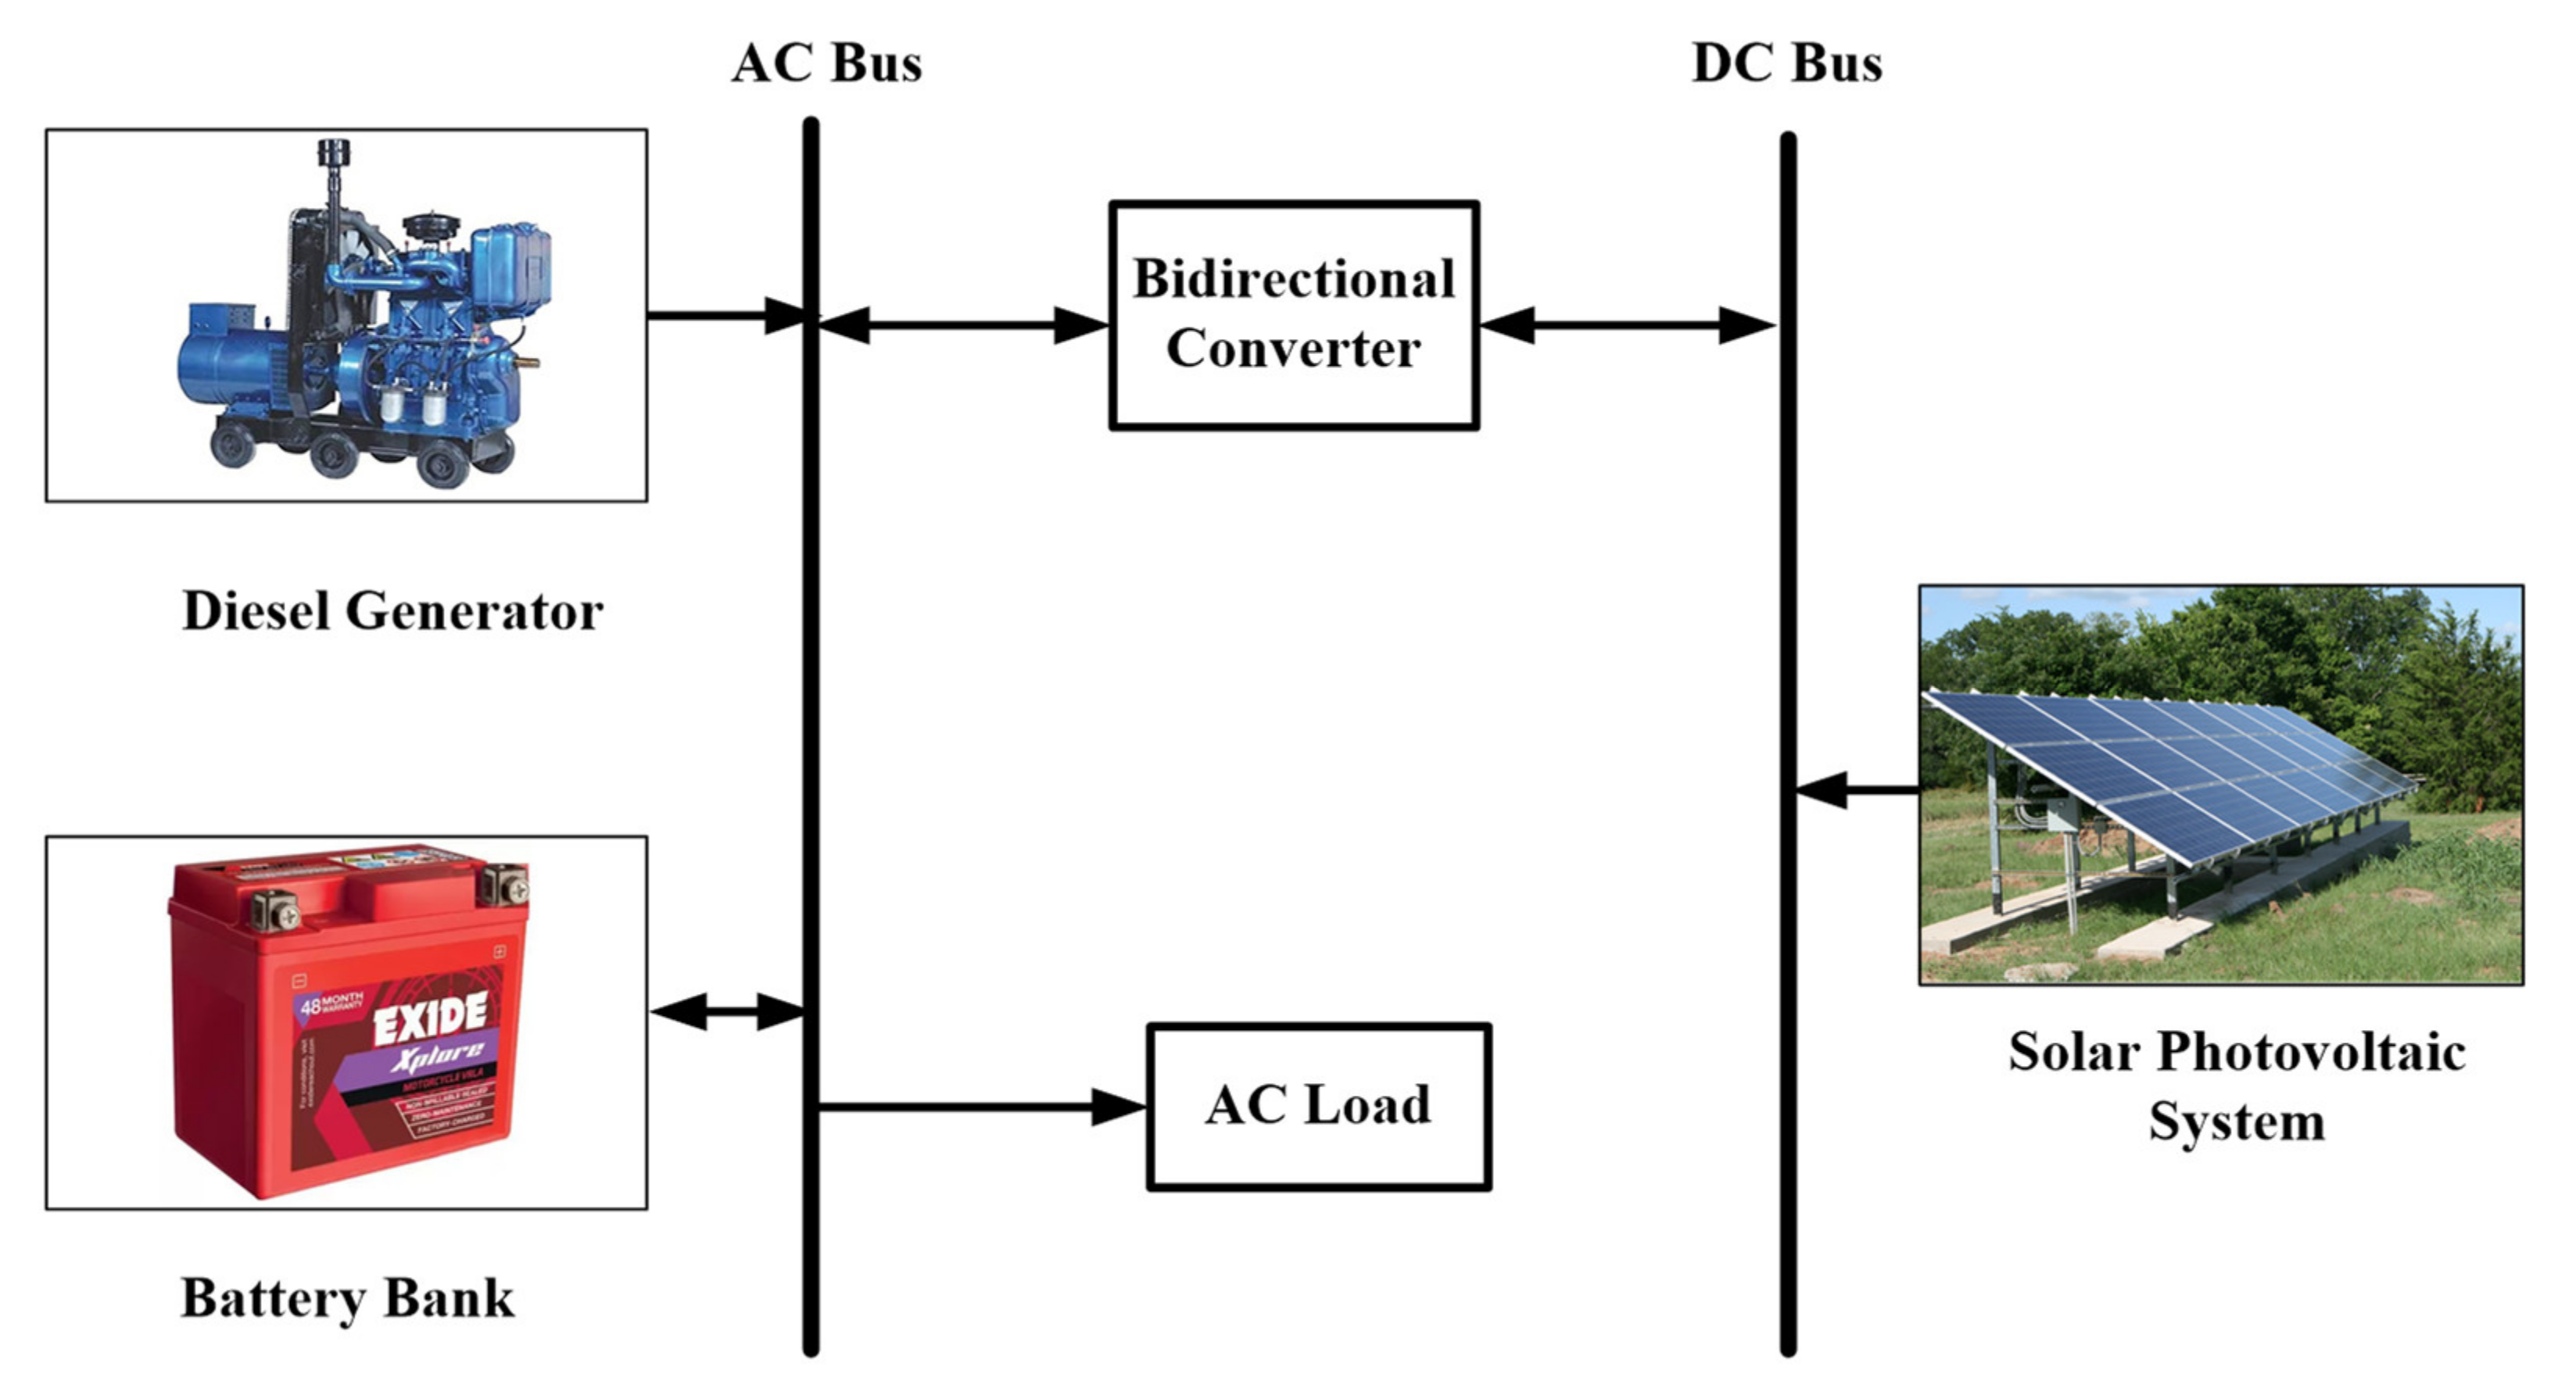
2. Hybrid System Configuration
3. Mathematical Model
3.1. Model of Solar PV Array
3.2. Model of Diesel Generator
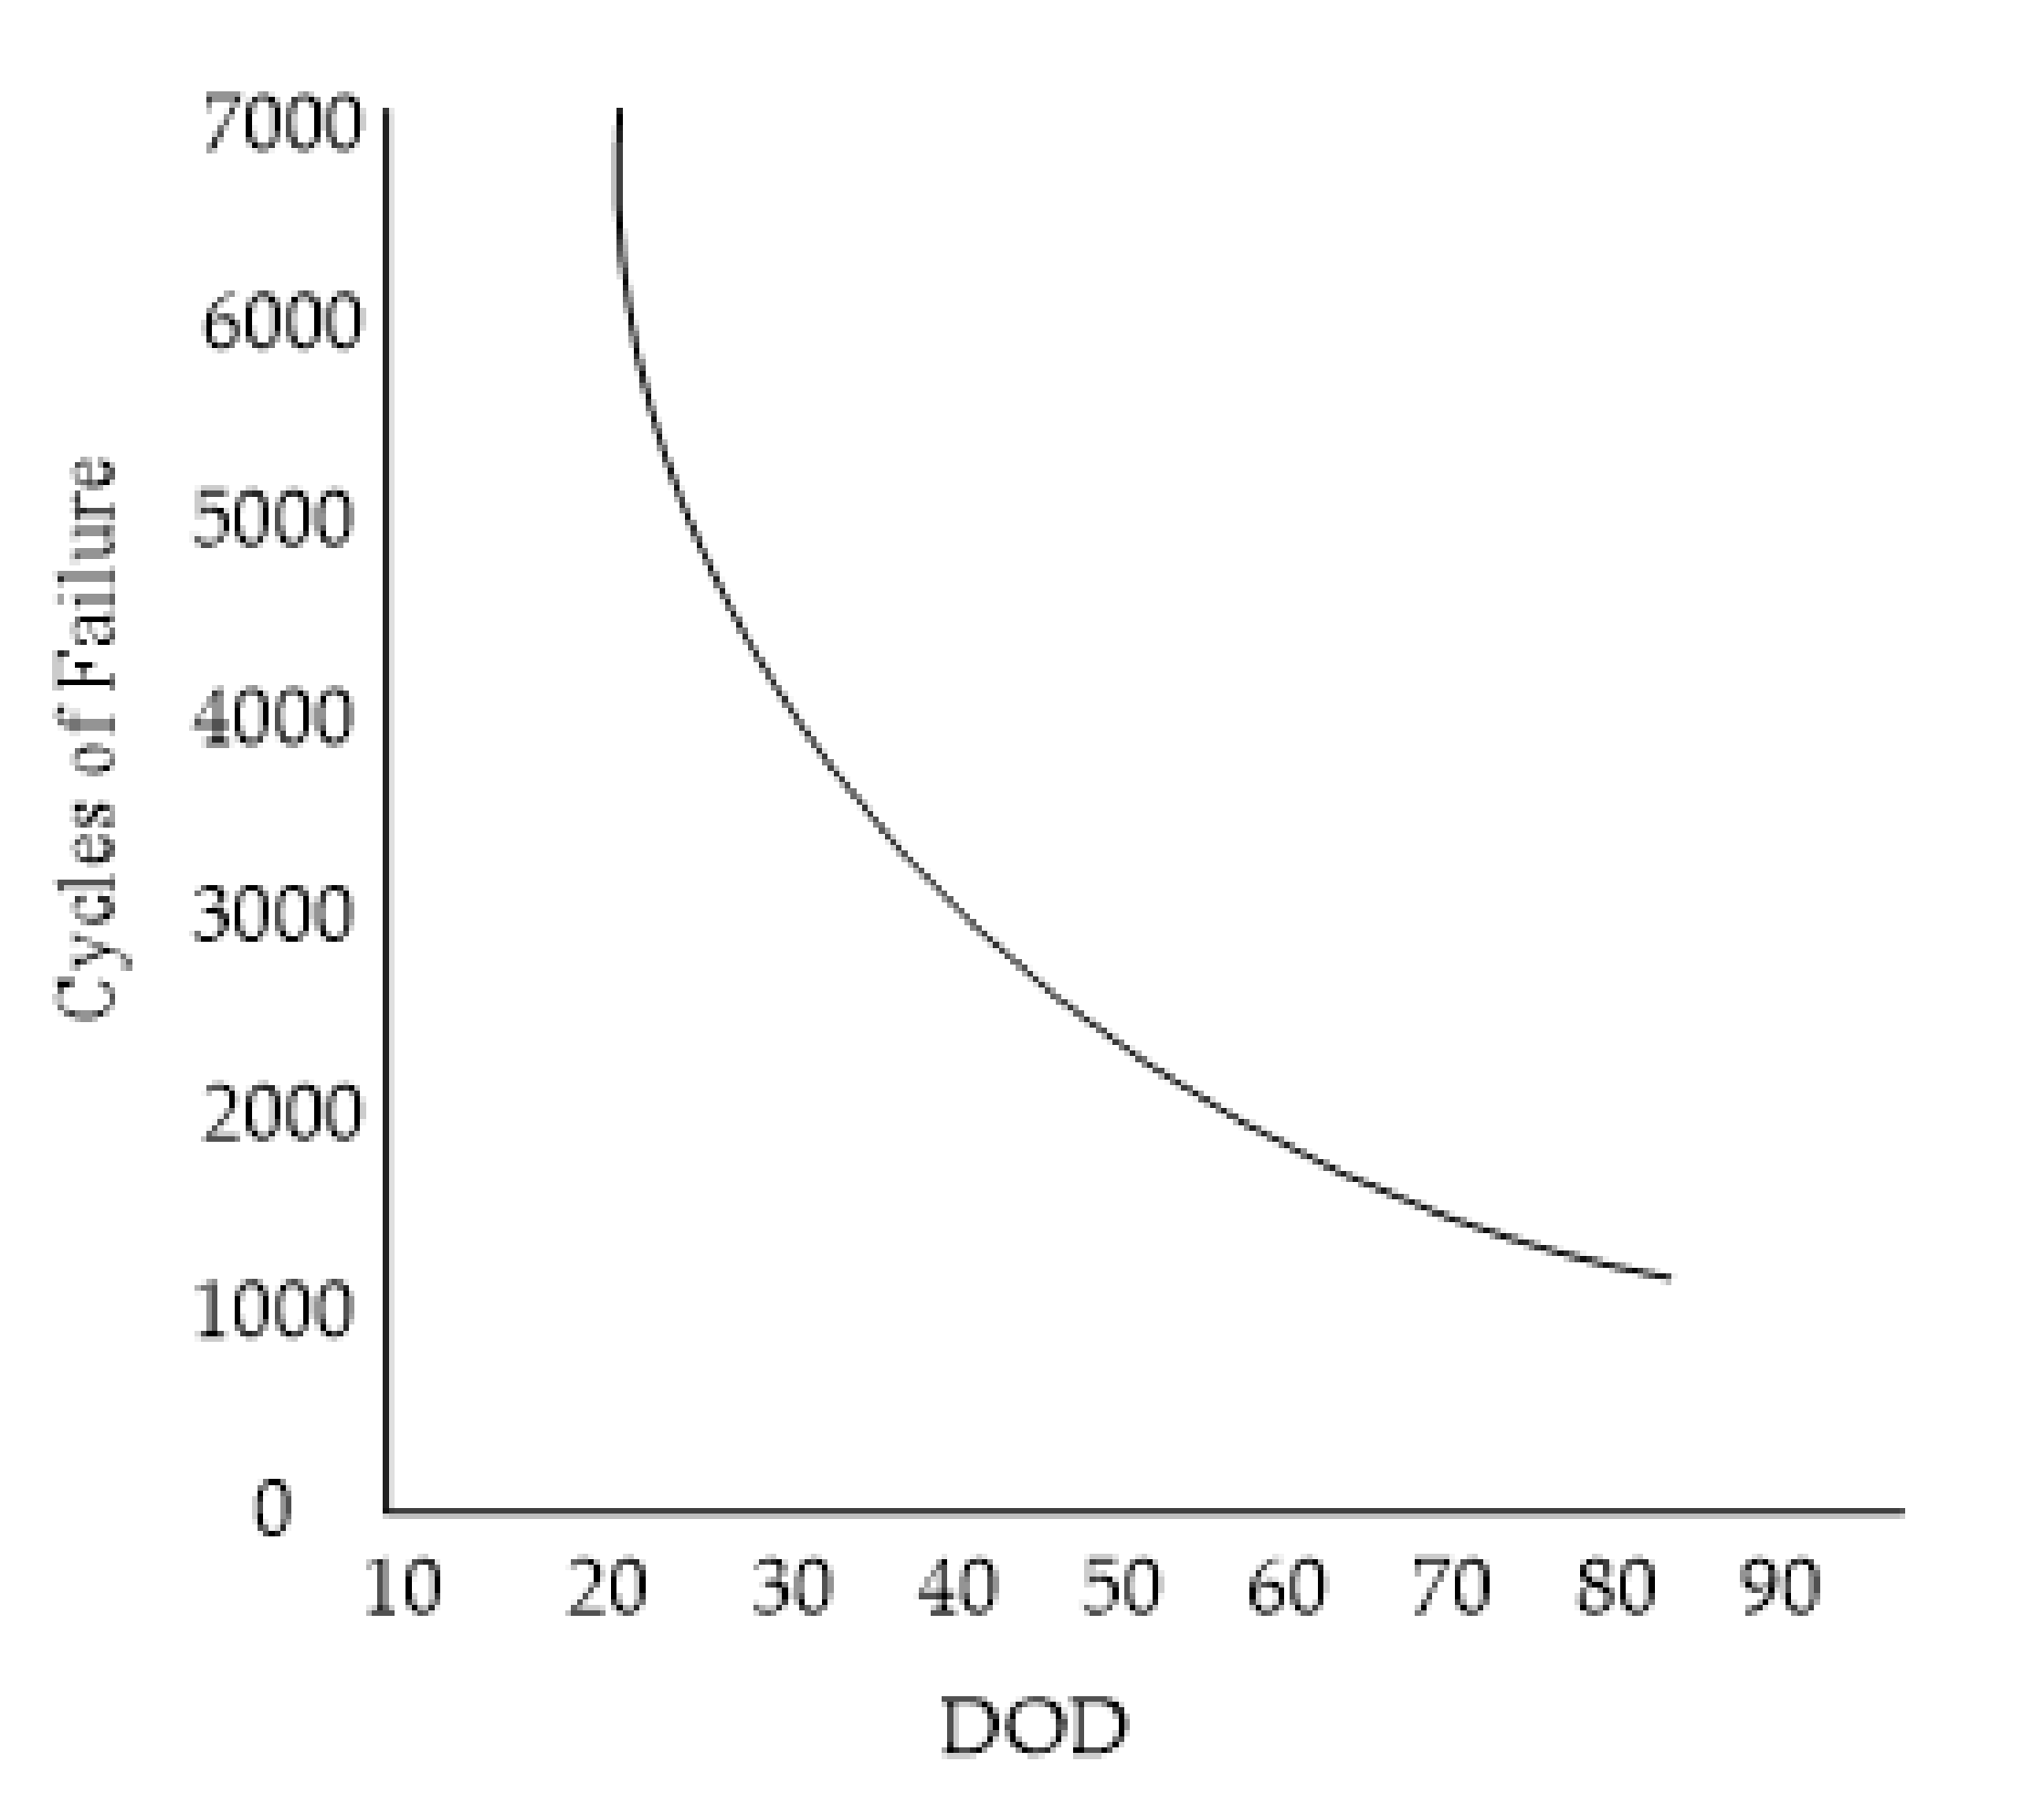
3.3. Model of Storage System
3.4. Mathematical Model of Charge Controller
4. Problem Formulation
4.1. Objective Function
4.2. Operational Constraints
4.2.1. Power Reliability Constraint
4.2.2. Economic Parameter Constraint
4.2.3. Renewable Energy Fraction
4.2.4. Total Carbon Emissions
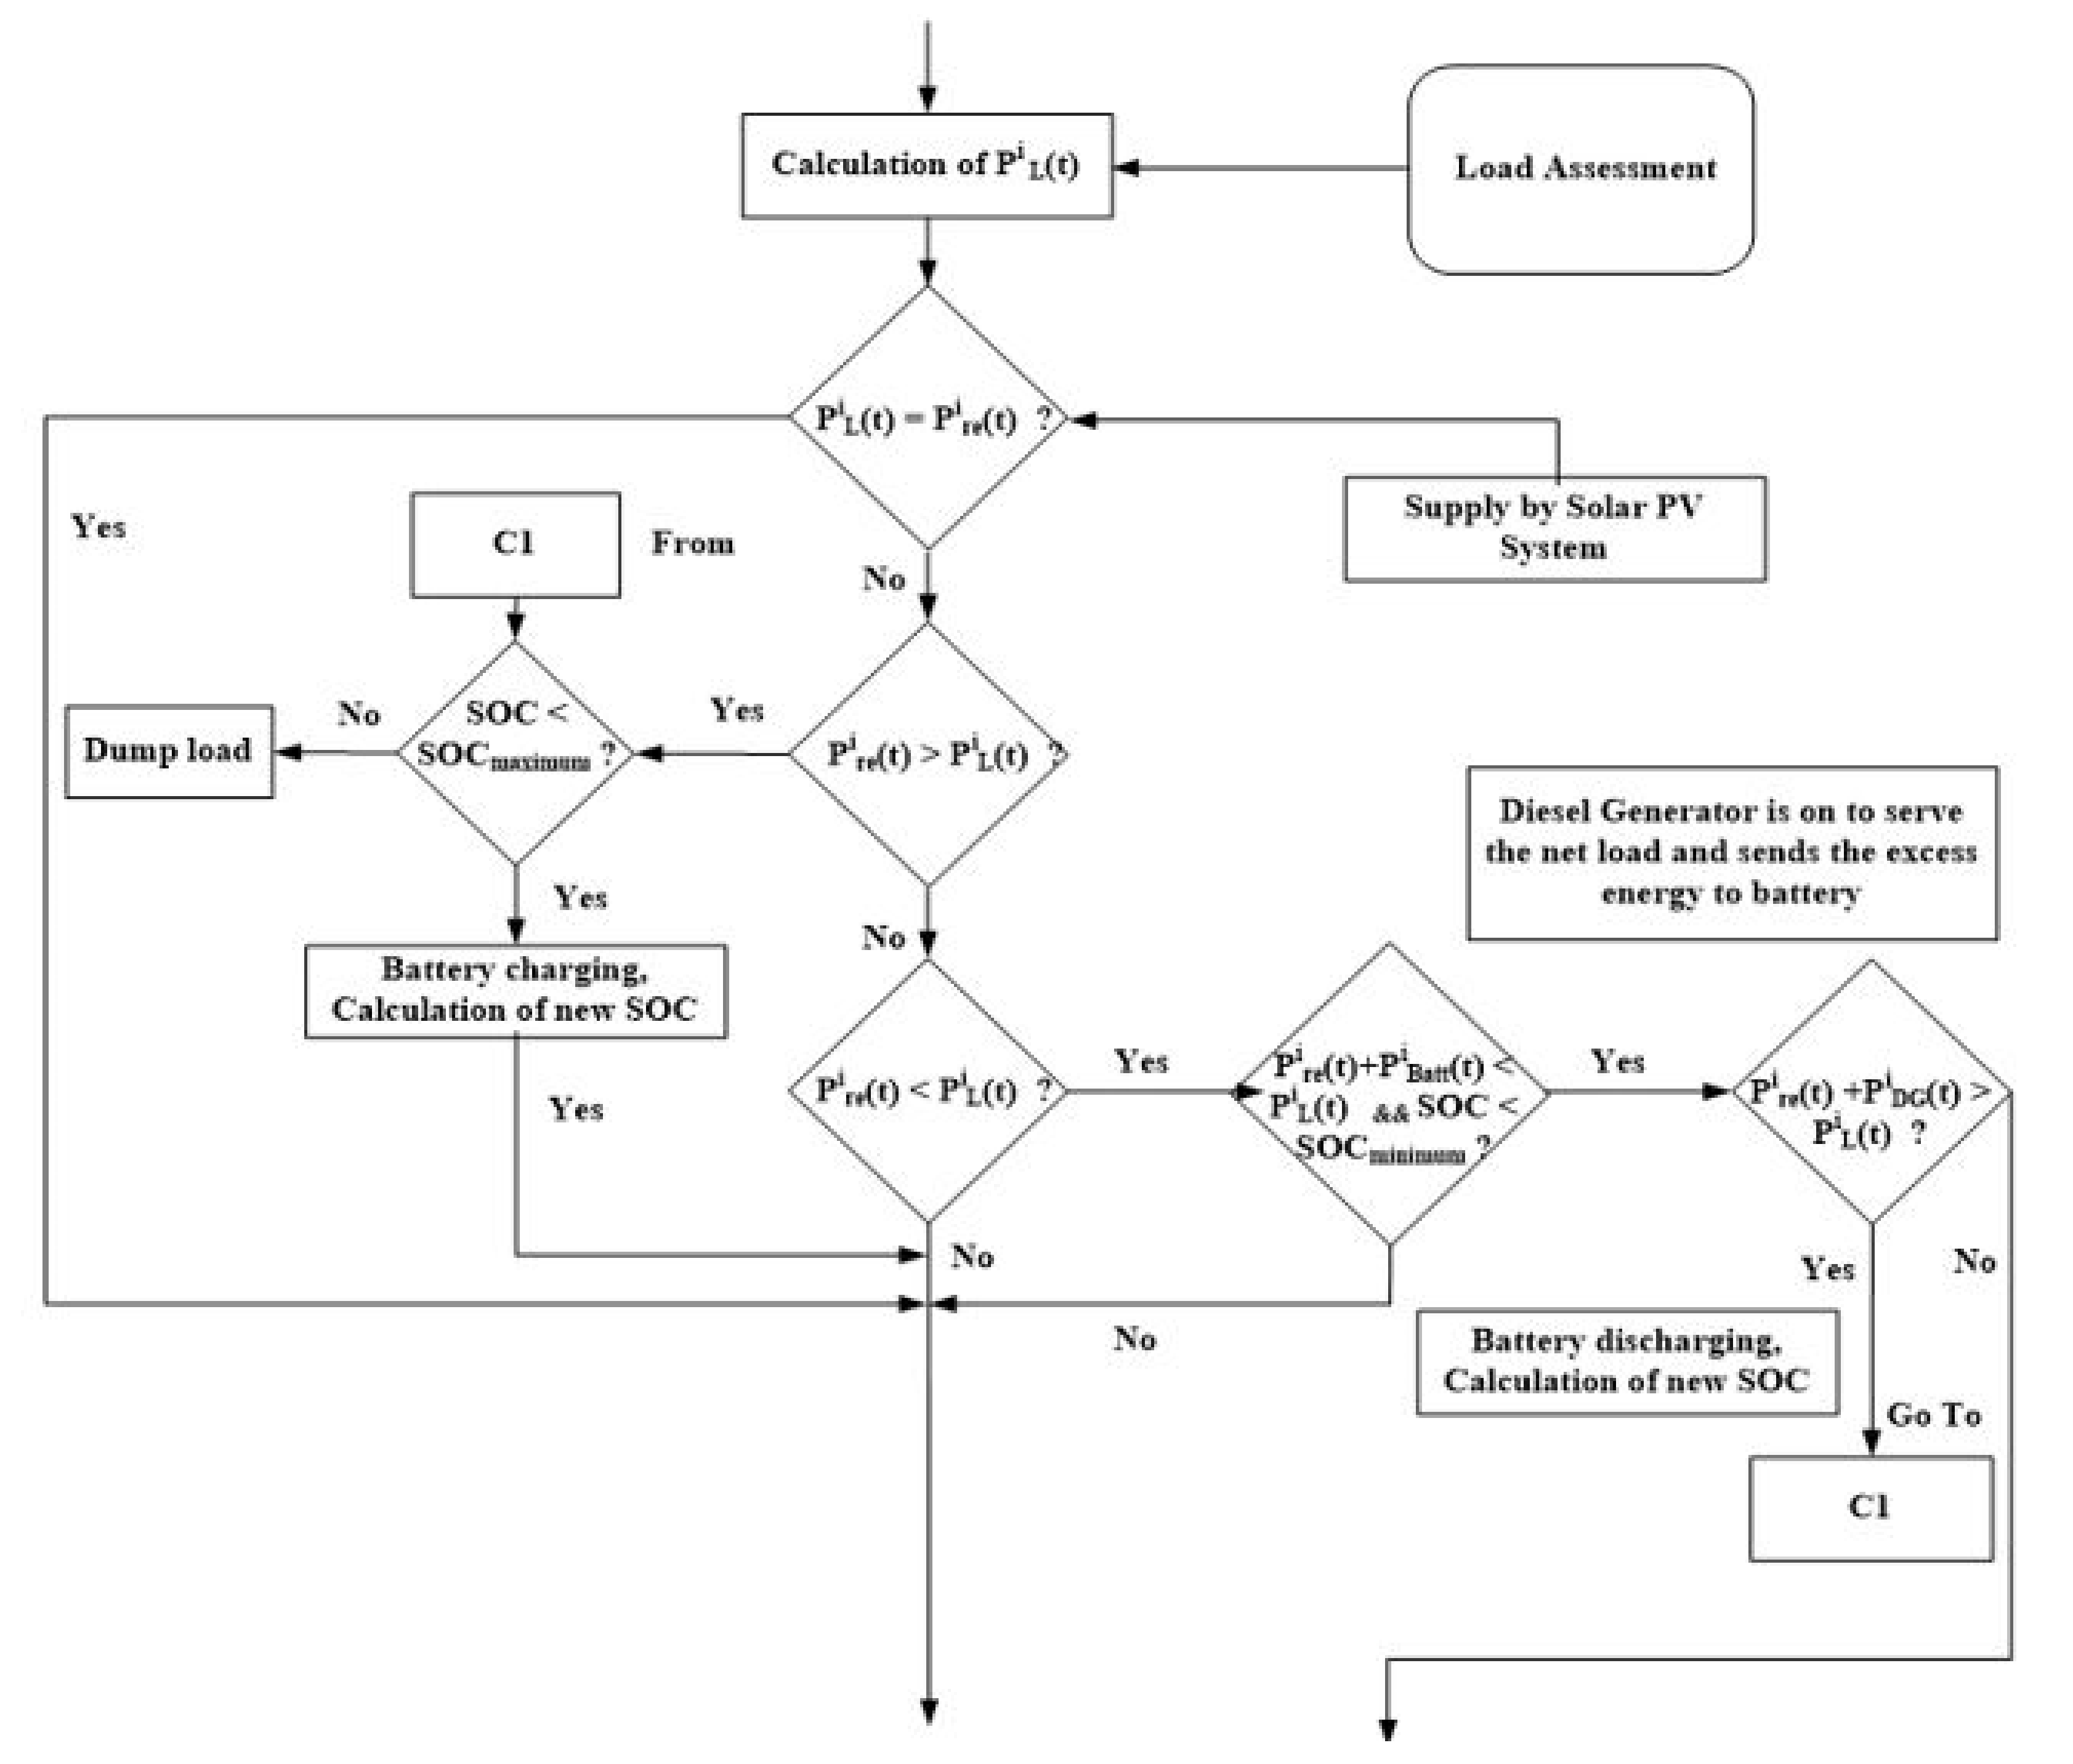
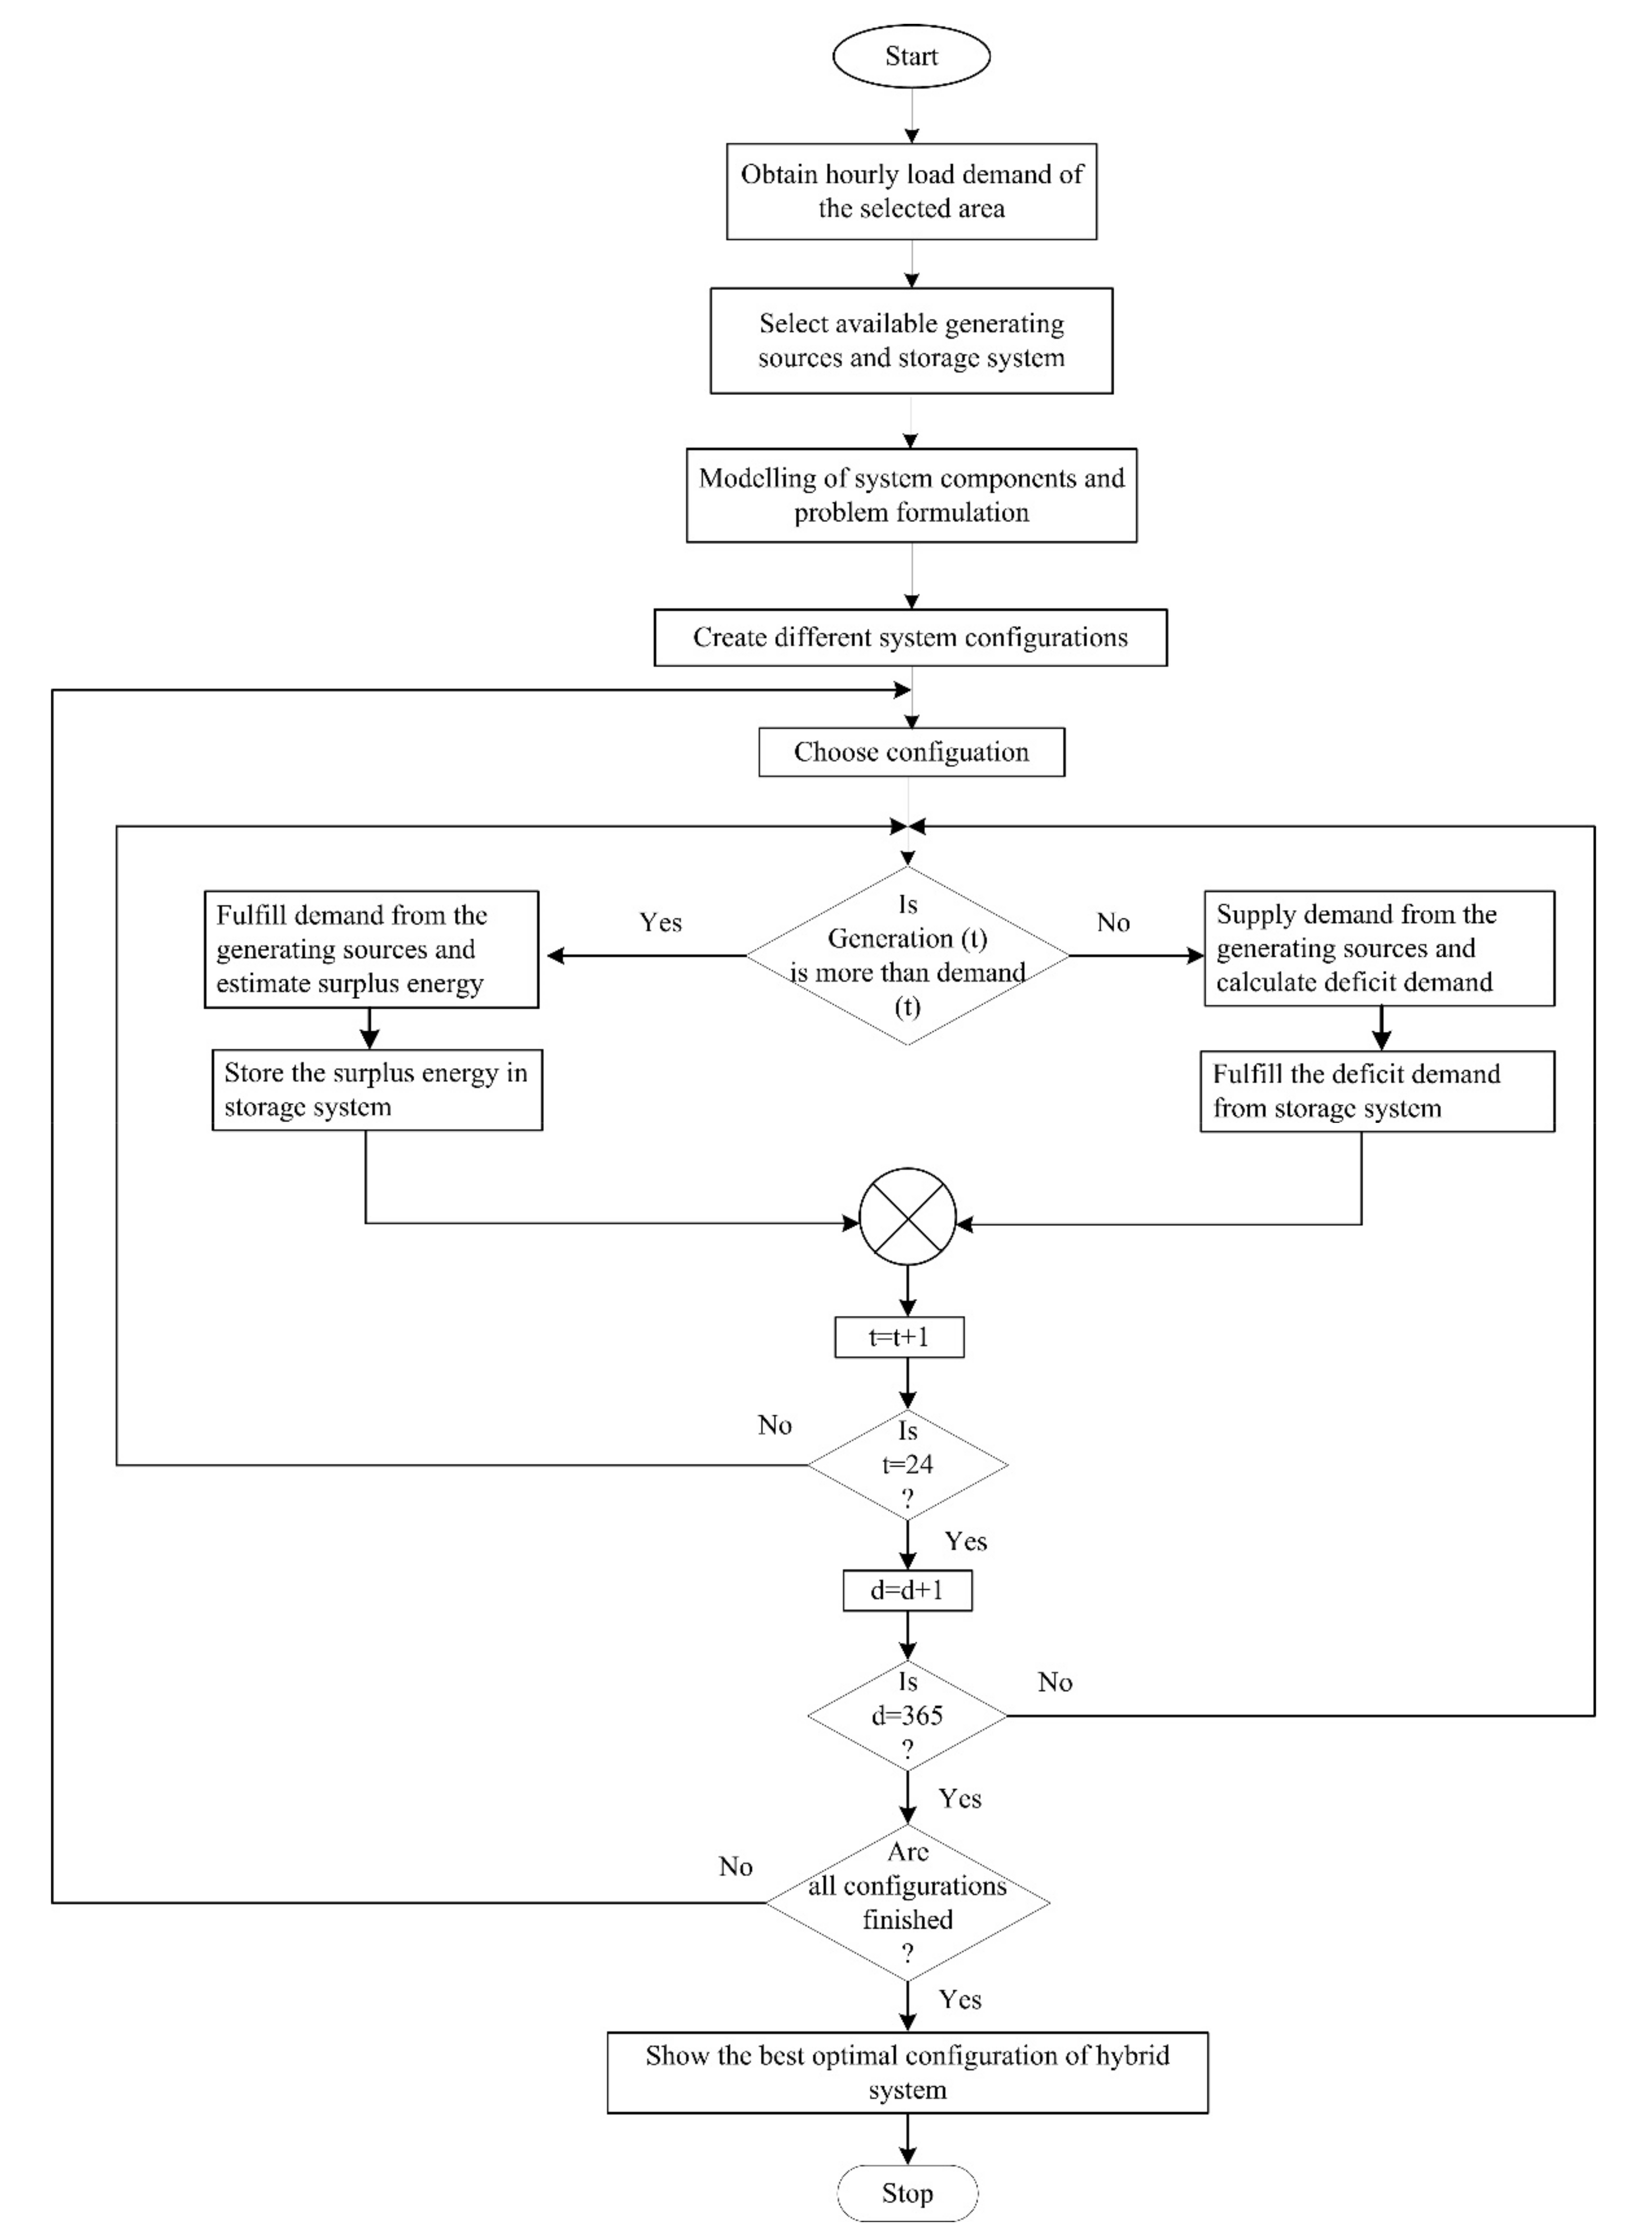
5. Energy Management Strategy
5.1. Load Following Strategy
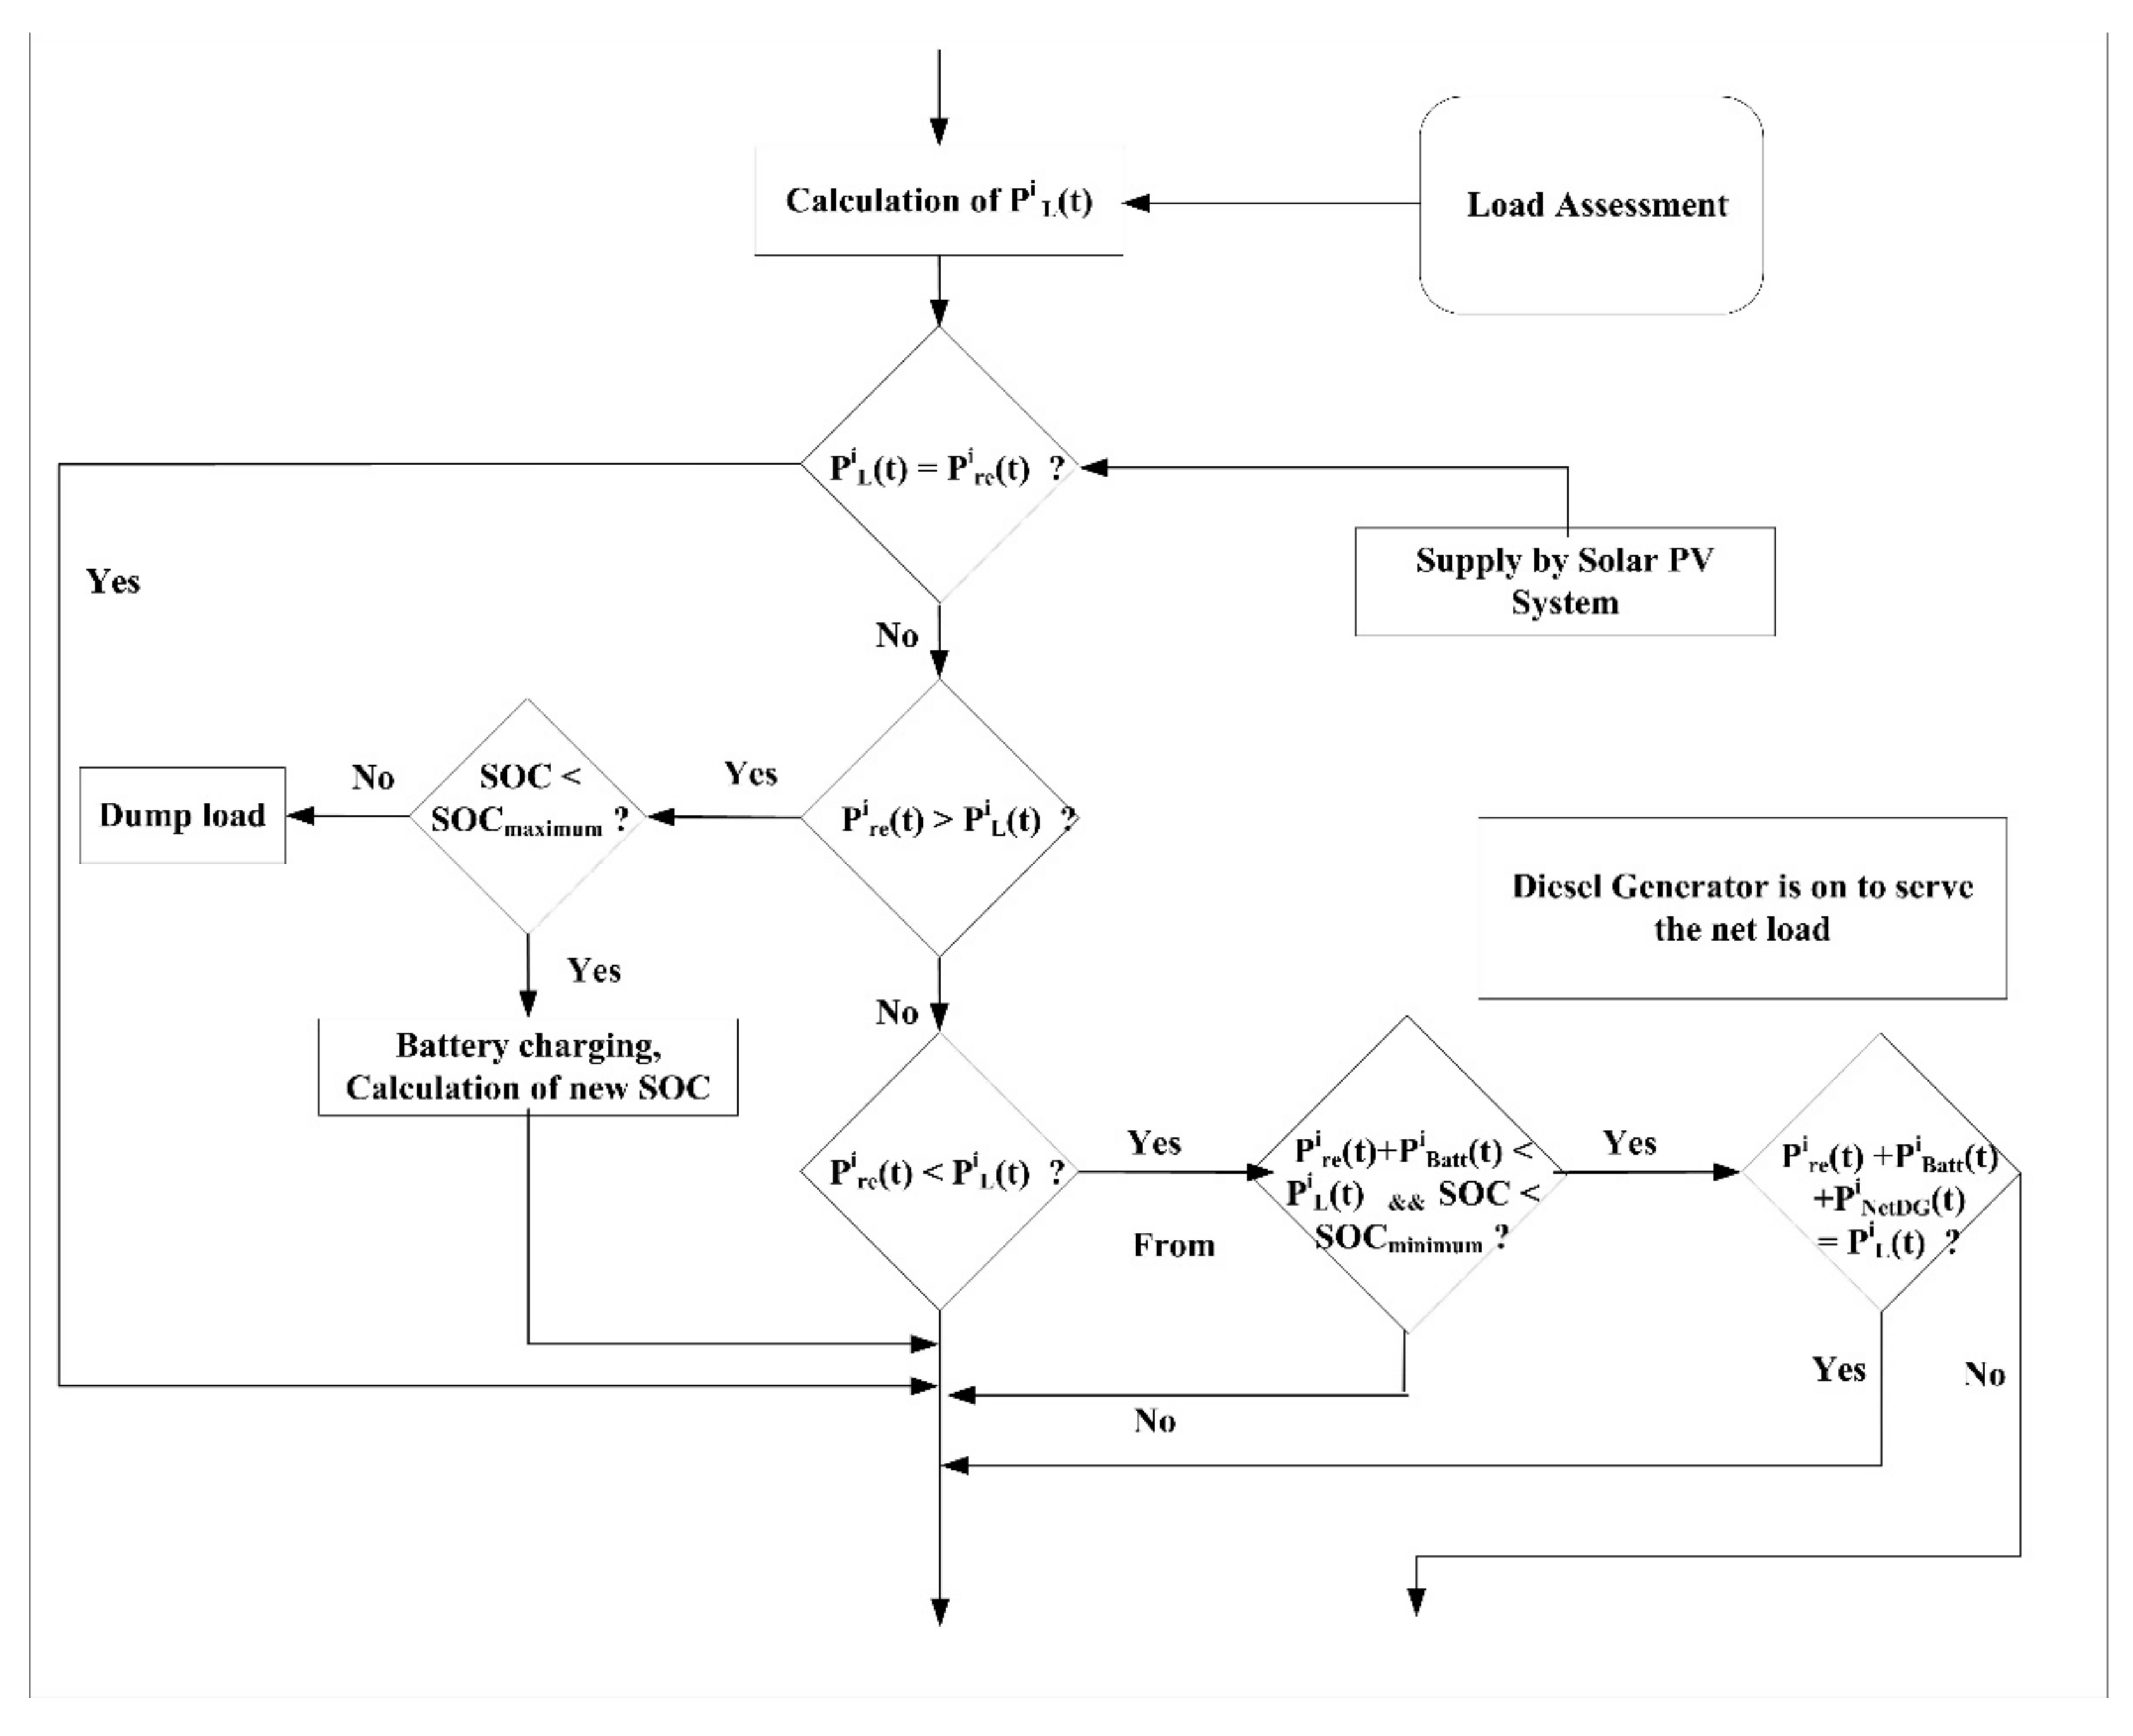
5.2. Cycle Charging Strategy
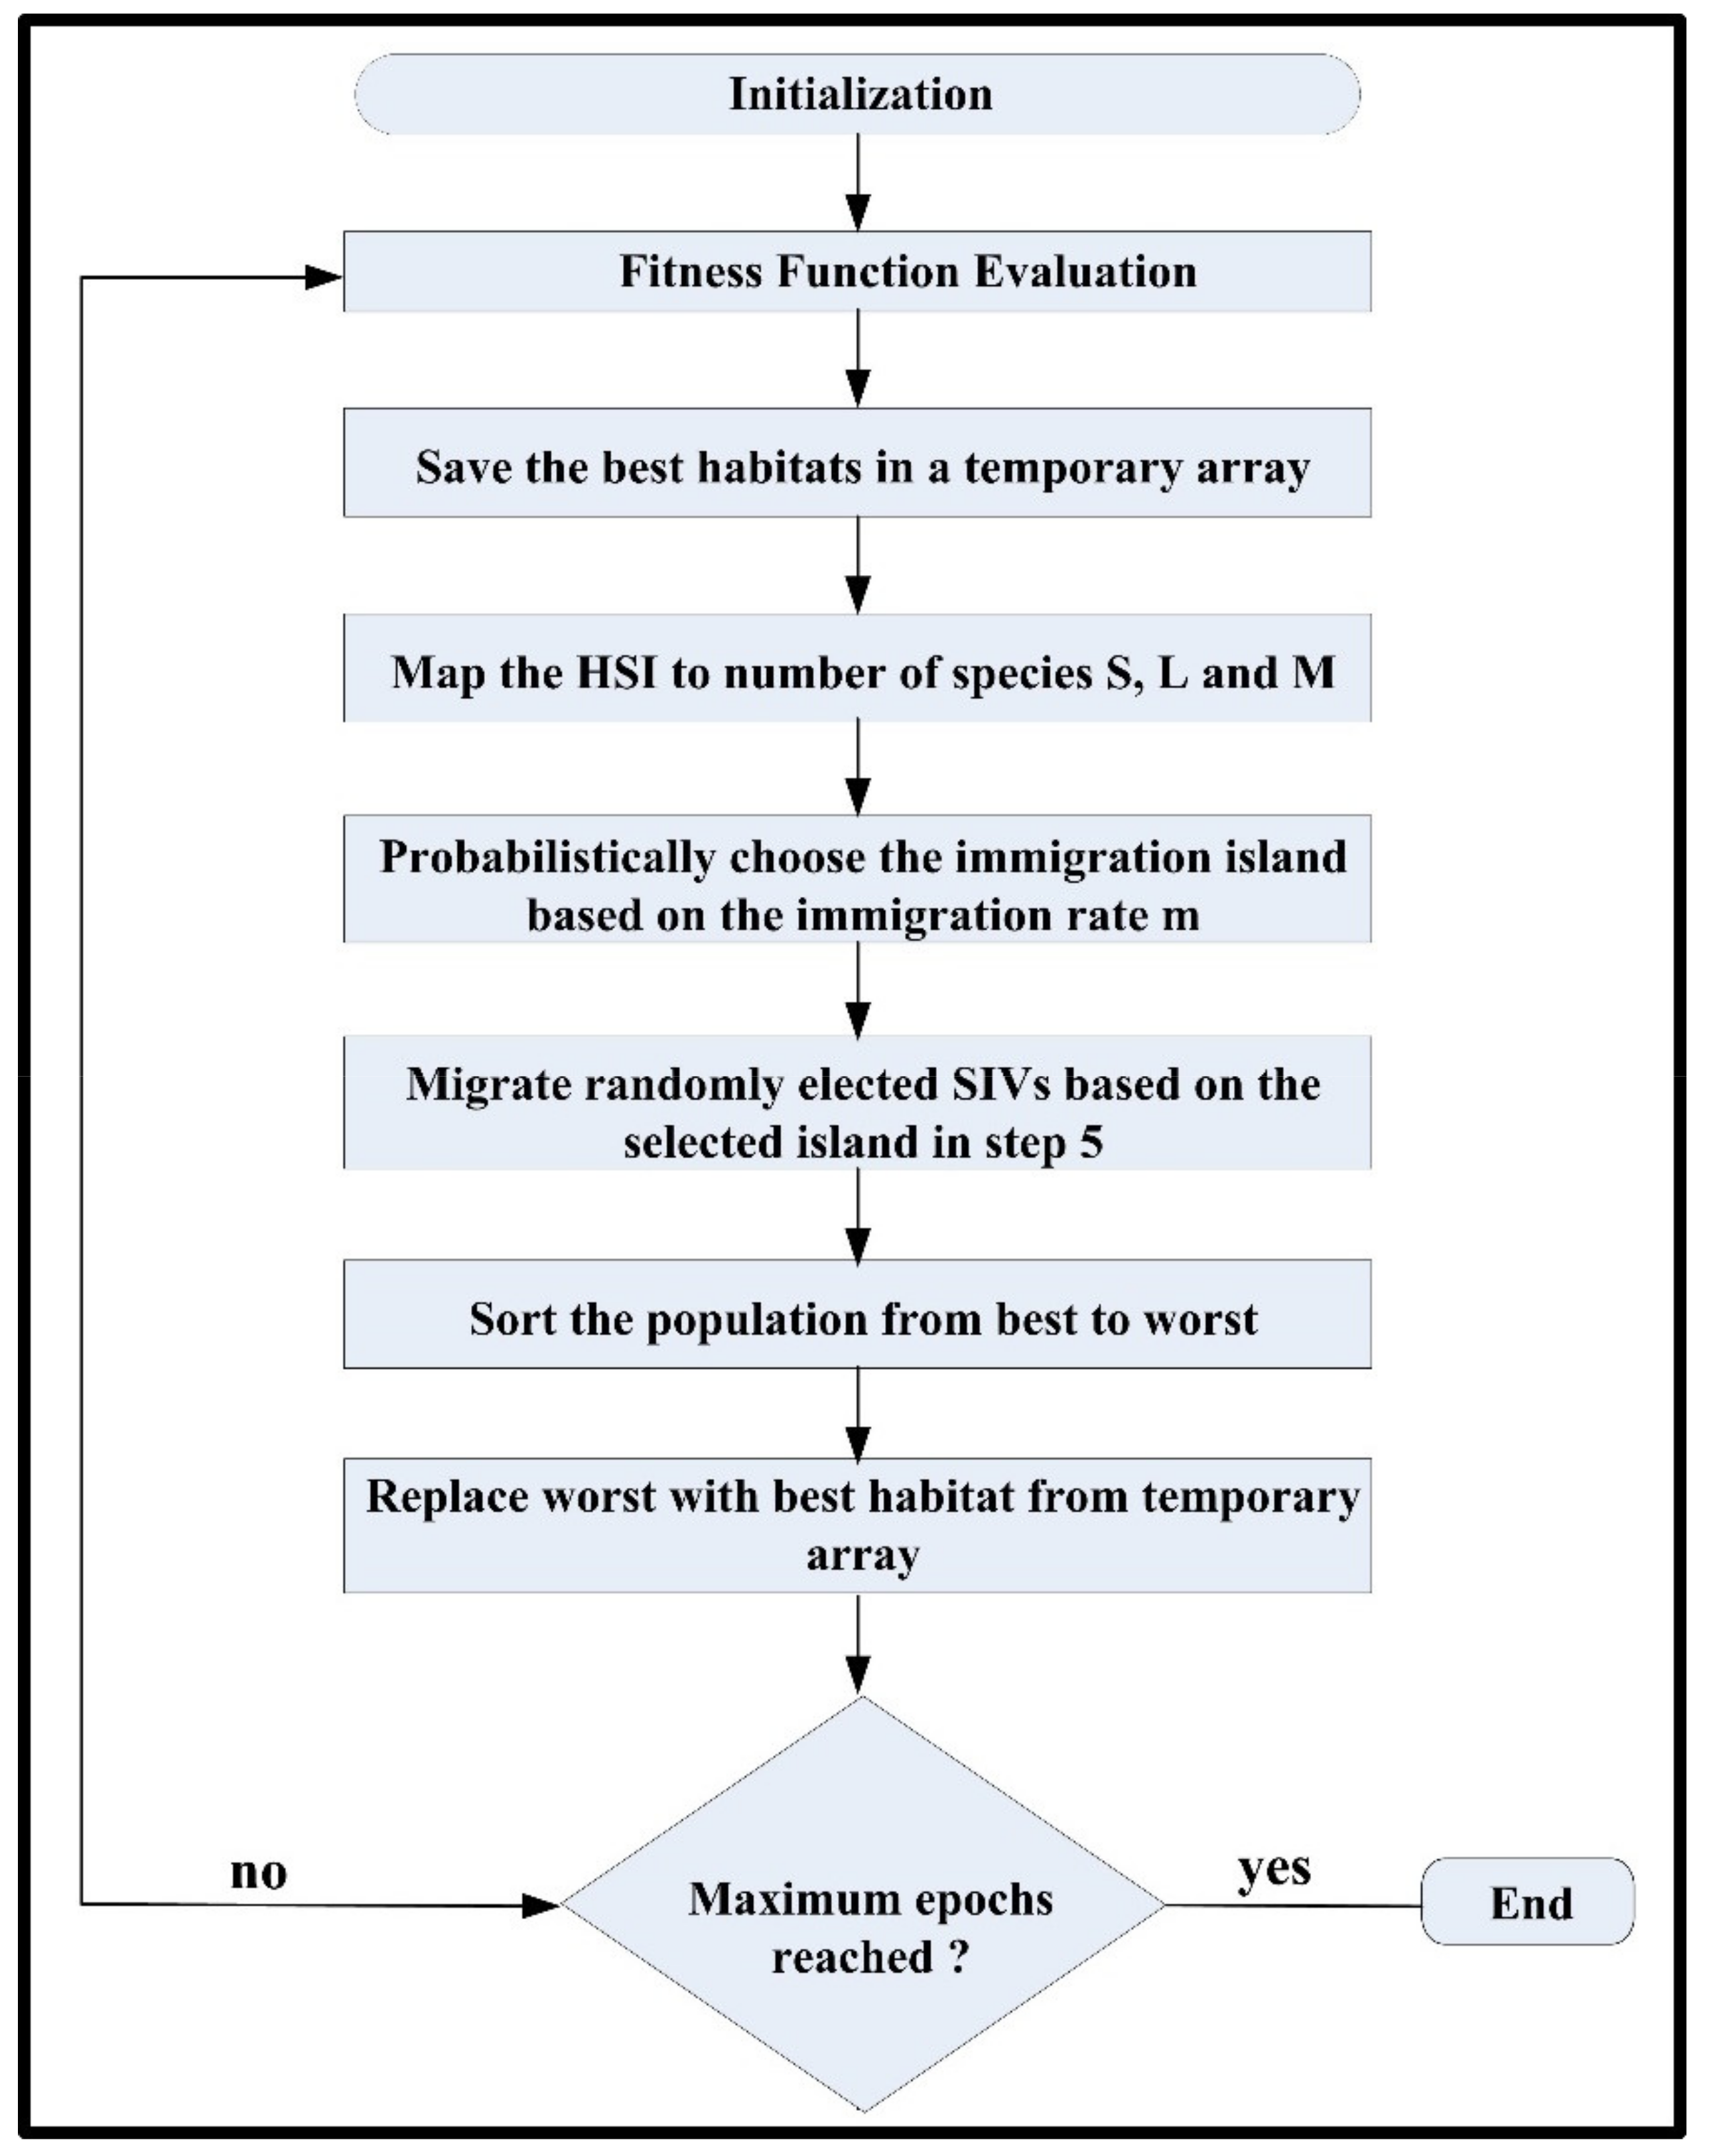
6. Biogeography-Based Optimization (BBO) Algorithm
7. Results and Discussions
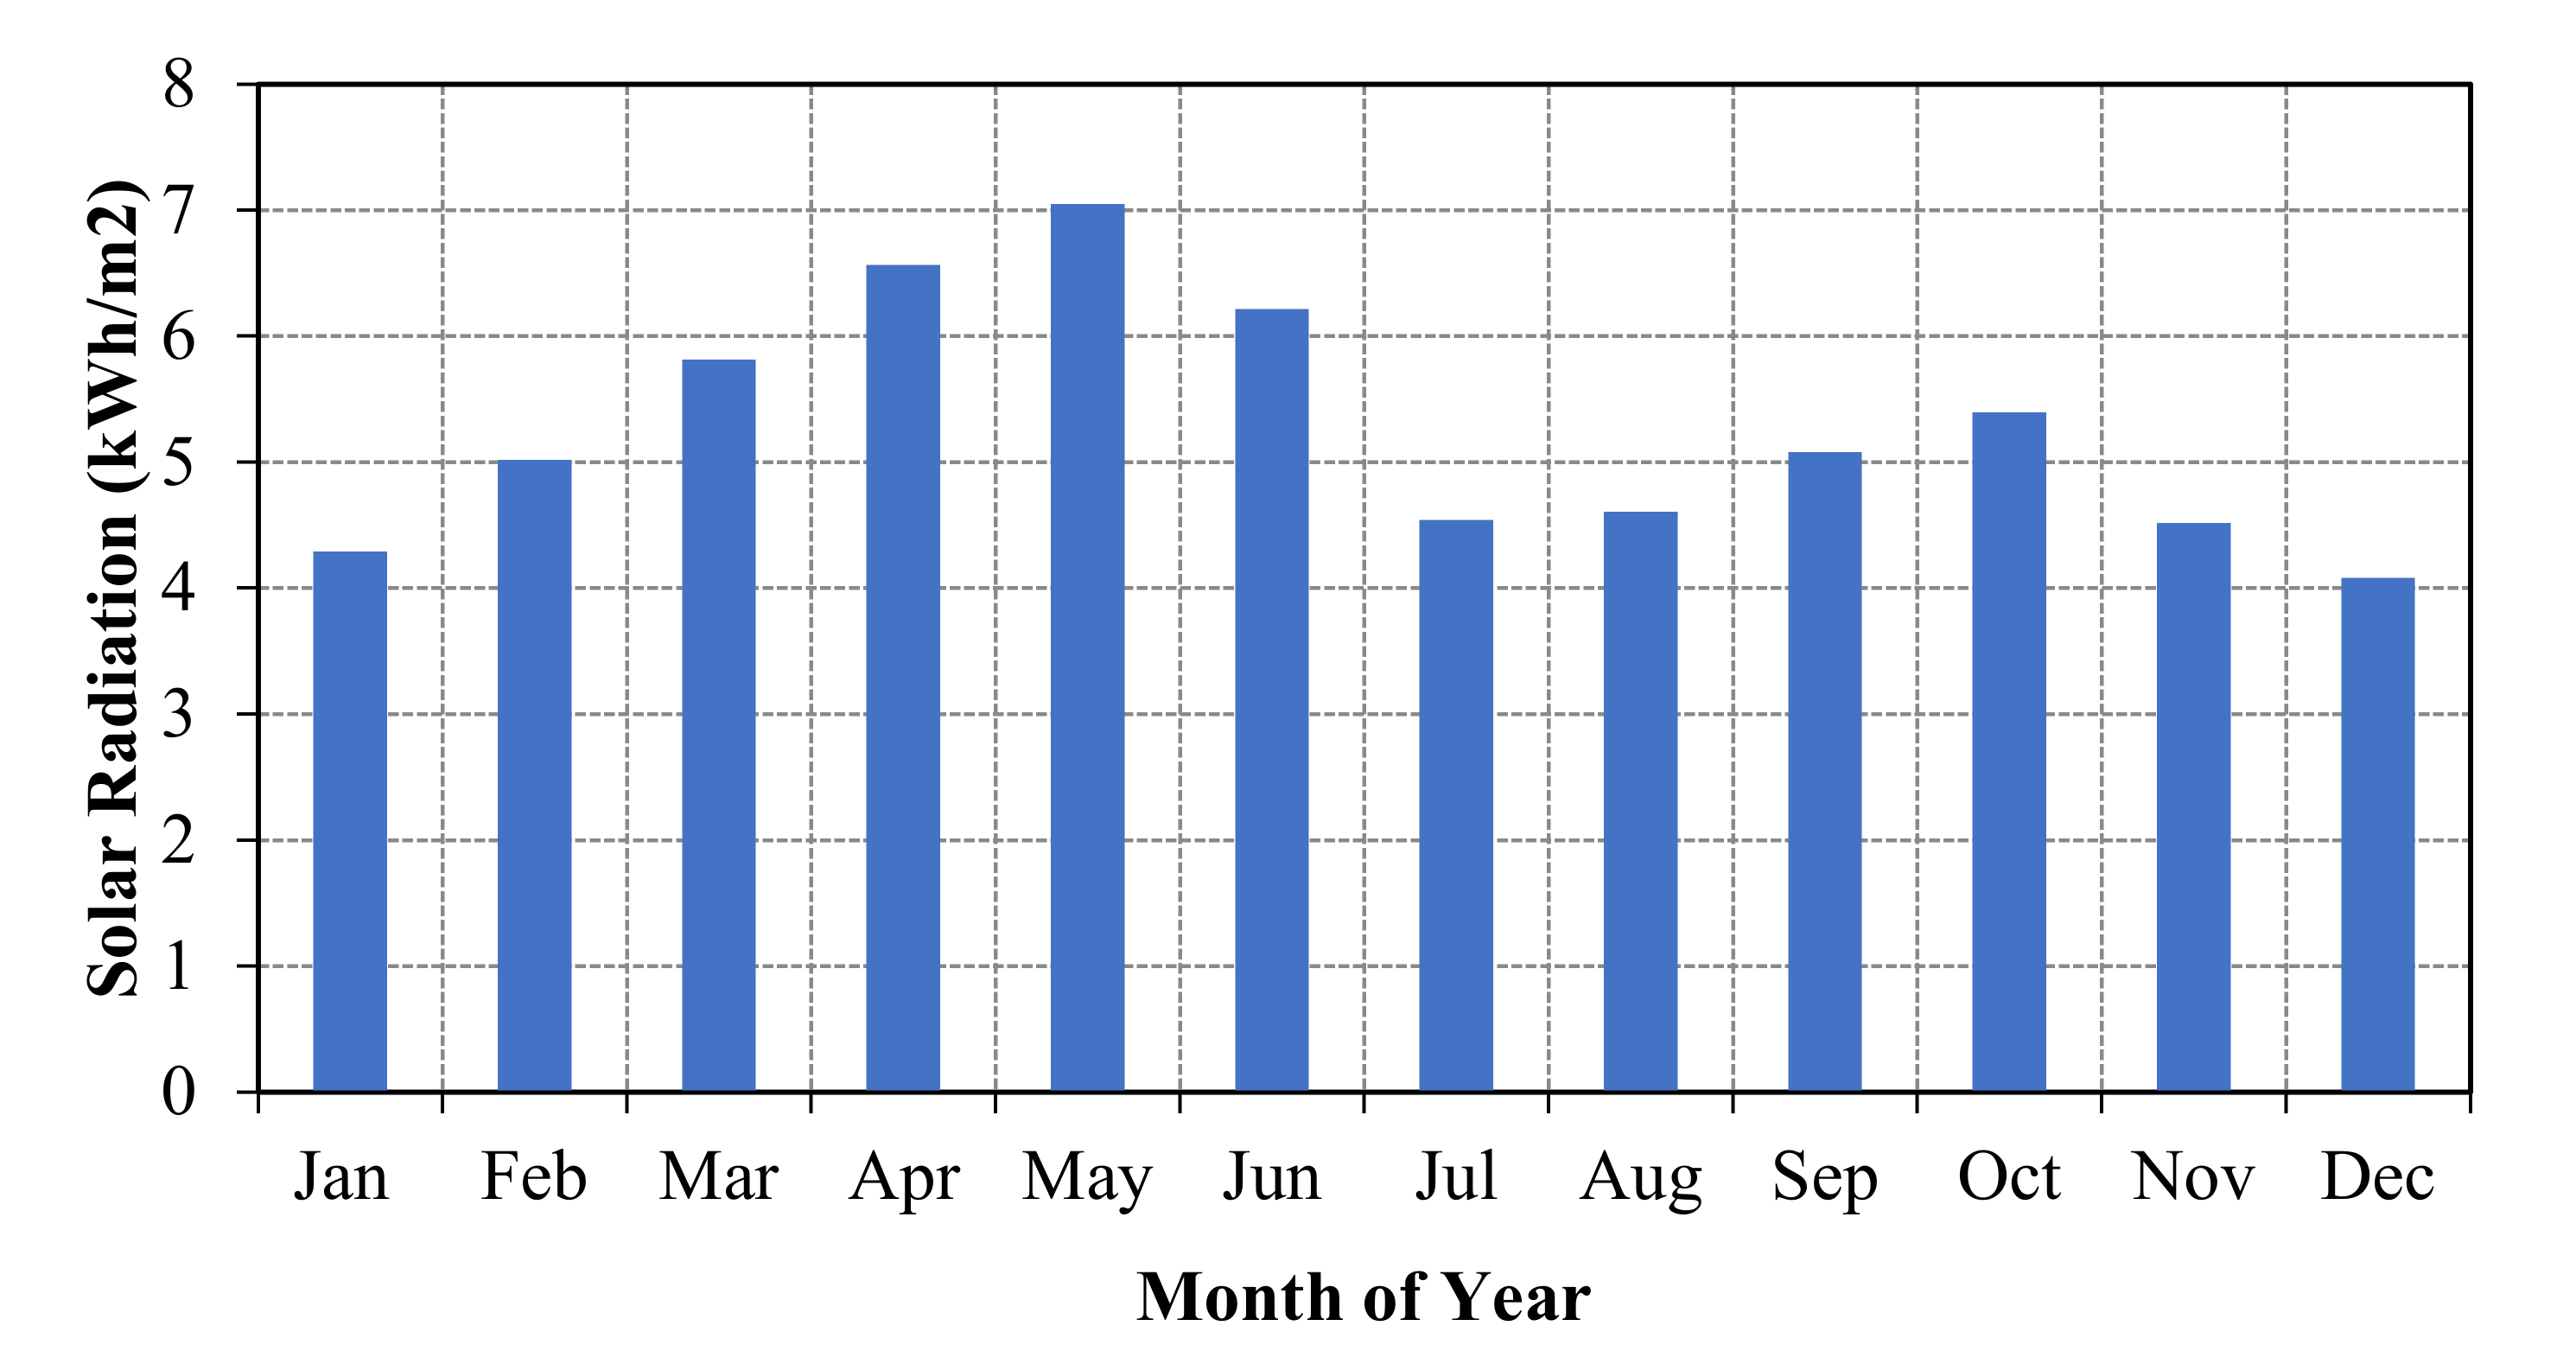
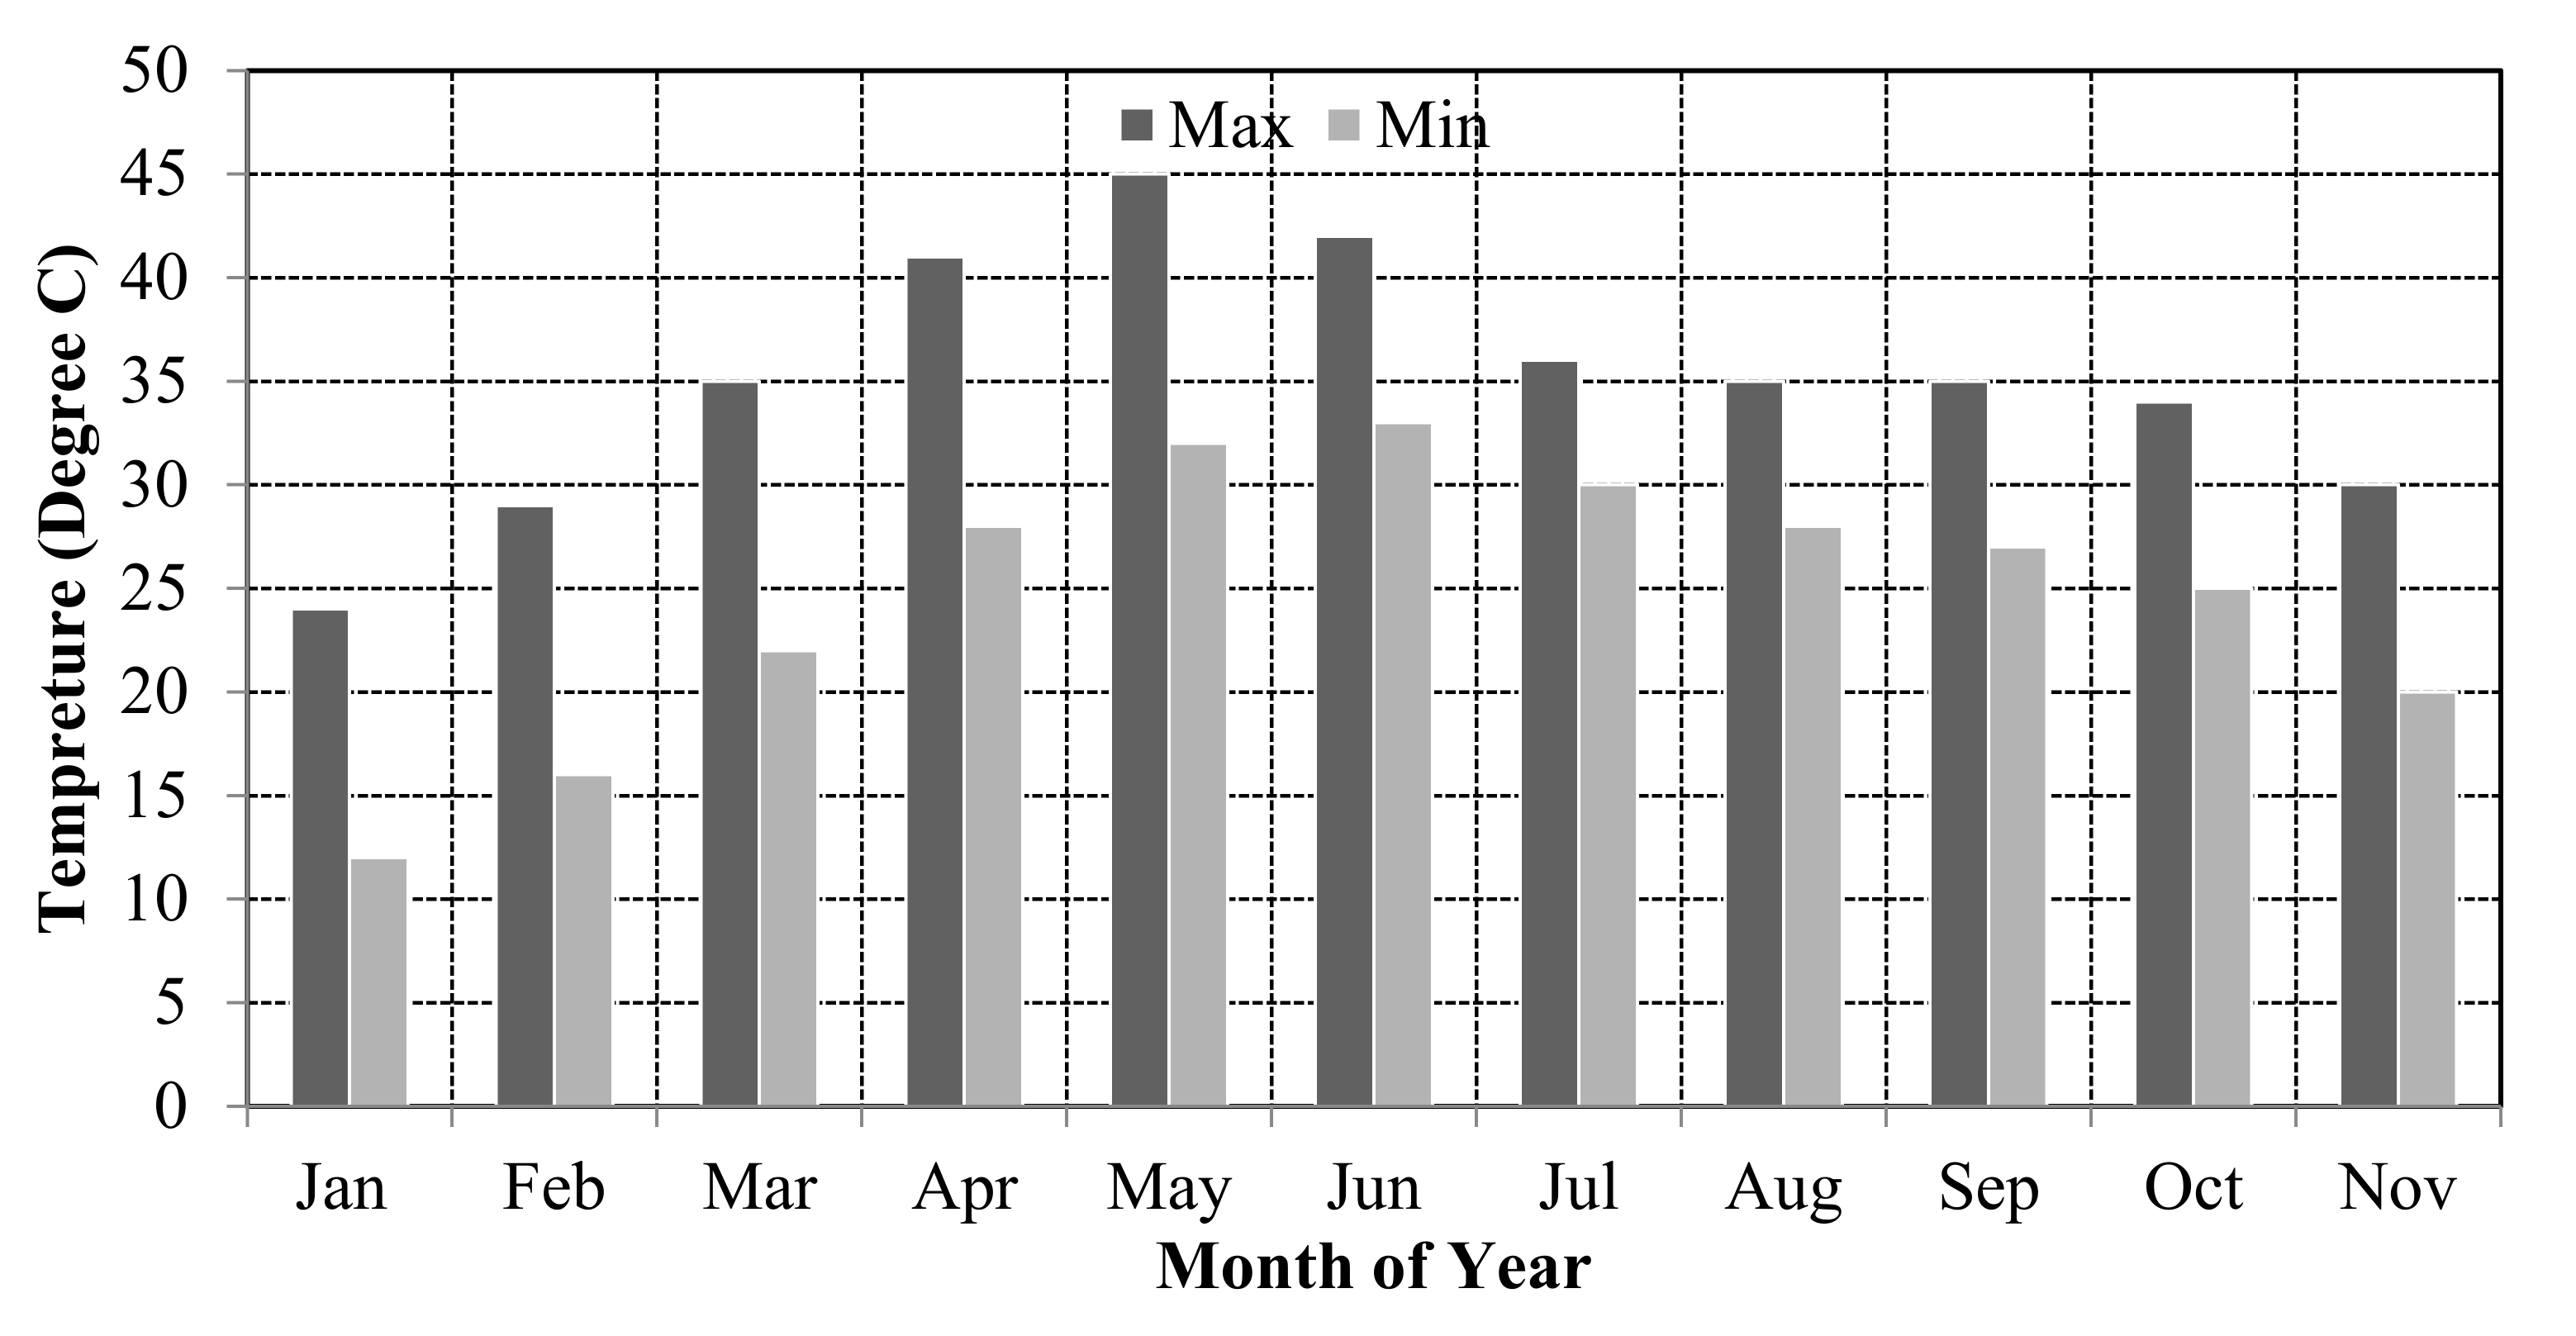
7.1. Input Technical and Economical Dataset
7.2. Results and Discussions
7.2.1. Cost of Energy
7.2.2. Optimum Size for Each Combination
7.2.3. Carbon Emission
7.2.4. Renewable Fraction
7.2.5. Total Fuel Consumption
7.2.6. Total Operating Hours of DG and Battery Bank
7.2.7. Convergence of BBO Algorithm
8. Conclusions
Author Contributions
Funding
Institutional Review Board Statement
Informed Consent Statement
Data Availability Statement
Conflicts of Interest
References
- Korkeakoski, M. Towards 100% Renewables by 2030: Transition Alternatives for a Sustainable Electricity Sector in Isla de la Juventud, Cuba. Energies 2021, 14, 2862. [Google Scholar] [CrossRef]
- Balžekienė, A.; Budžytė, A. The Role of Environmental Attitudes in Explaining Public Perceptions of Climate Change and Renewable Energy Technologies in Lithuania. Sustainability 2021, 13, 4376. [Google Scholar] [CrossRef]
- Aleem, S.A.; Hussain, S.M.S.; Ustun, T.S. A Review of Strategies to Increase PV Penetration Level in Smart Grids. Energies 2020, 13, 636. [Google Scholar] [CrossRef] [Green Version]
- Kagimu, V.; Ustun, T.S. Novel business models and policy directions based on SE4ALL global framework for minigrids. In Proceedings of the IEEE International Conference on Emerging Technologies and Innovative Business Practices for the Transformation of Societies (EmergiTech), Mauritius, 1–6 August 2016; pp. 251–256. [Google Scholar]
- Sharafi, M.; Elmekkawy, T.Y. Multi-objective optimal design of hybrid energy systems using PSO-simulation based approach. Renew. Energy 2014, 68, 67–79. [Google Scholar] [CrossRef]
- Ustun, T.S.; Hussain, S.M.S.; Kikusato, H. IEC 61850-Based Communication Modeling of EV Charge-Discharge Management for Maximum PV Generation. IEEE Access 2019, 7, 4219–4231. [Google Scholar] [CrossRef]
- Javed, K.; Ashfaq, H.; Singh, R.; Hussain, S.M.S.; Ustun, T.S. Design and Performance Analysis of a Stand-alone PV System with Hybrid Energy Storage for Rural India. Electronics 2019, 8, 952. [Google Scholar] [CrossRef] [Green Version]
- Dey, P.P.; Das, D.; Latif, A.; Hussain, S.; Ustun, T. Active Power Management of Virtual Power Plant under Penetration of Central Receiver Solar Thermal-Wind Using Butterfly Optimization Technique. Sustainability 2020, 12, 6979. [Google Scholar] [CrossRef]
- Latif, A.; Hussain, S.M.S.; Das, D.C.; Ustun, T.S. Double stage controller optimization for load frequency stabilization in hybrid wind-ocean wave energy based maritime microgrid system. Appl. Energy 2021, 282, 116171. [Google Scholar] [CrossRef]
- Ramesh, M.; Saini, R.P. Dispatch strategies based performance analysis of a hybrid renewable energy system for a remote rural area in India. J. Clean. Prod. 2020, 259, 120697. [Google Scholar] [CrossRef]
- Baruah, A.; Basu, M.; Amuley, D. Modeling of an autonomous hybrid renewable energy system for electrification of a township: A case study for Sikkim, India. Renew. Sustain. Energy Rev. 2021, 135, 110158. [Google Scholar] [CrossRef]
- Das, M.; Singh, M.A.K.; Biswas, A. Techno-economic optimization of an off-grid hybrid renewable energy system using metaheuristic optimization approaches—Case of a radio transmitter station in India. Energy Convers. Manag. 2019, 185, 339–352. [Google Scholar] [CrossRef]
- El-houari, H.; Allouhi, A.; Rehman, S.; Buker, M.S.; Kousksou, T.; Jamil, A.; El Amrani, B. Feasibility evaluation of a hybrid renewable power generation system for sustainable electricity supply in a Moroccan remote site. J. Clean. Prod. 2020, 277, 123534. [Google Scholar] [CrossRef]
- Elkadeem, M.R.; Wang, S.; Sharshir, S.W.; Atia, E.G. Feasibility analysis and techno-economic design of grid-isolated hybrid renewable energy system for electrification of agriculture and irrigation area: A case study in Dongola, Sudan. Energy Convers. Manag. 2019, 196, 1453–1478. [Google Scholar] [CrossRef]
- Kumar, P.P.; Saini, R.P. Optimization of an off-grid integrated hybrid renewable energy system with different battery technologies for rural electrification in India. J. Energy Storage 2020, 32, 101912. [Google Scholar] [CrossRef]
- Ma, T.; Javed, M.S. Integrated sizing of hybrid PV-wind-battery system for remote island considering the saturation of each renewable energy resource. Energy Convers. Manag. 2019, 182, 178–190. [Google Scholar] [CrossRef]
- Jahangir, M.H.; Cheraghi, R. Economic and environmental assessment of solar-wind-biomass hybrid renewable energy system supplying rural settlement load. Sustain. Energy Technol. Assess. 2020, 42, 100895. [Google Scholar] [CrossRef]
- Ustun, S.T.; Nakamura, Y.; Hashimoto, J.; Otani, K. Performance analysis of PV panels based on different technologies after two years of outdoor exposure in Fukushima, Japan. Renew. Energy 2019, 136, 159–178. [Google Scholar] [CrossRef]
- Misra, A.; Sharma, M.P. Development of Hybrid Energy System for a Remote Area in Kutch District of Gujarat State, India. Energy Sources Part A Recovery Util. Environ. Eff. 2020. [Google Scholar] [CrossRef]
- Ismail, M.S.; Moghavvemi, M.; Mahlia, T.M.I. Techno-economic analysis of an optimized photovoltaic and diesel generator hybrid power system for remote houses in a tropical climate. Energy Convers. Manag. 2013, 69, 163–173. [Google Scholar] [CrossRef]
- Tazvinga, H.; Xia, X.; Zhang, J. Minimum cost solution of photovoltaic–diesel–battery hybrid power systems for remote consumers. Sol. Energy 2013, 96, 292–299. [Google Scholar] [CrossRef]
- Chauhan, A.; Saini, R.P. Size Optimization and Demand Response of A Stand-Alone Integrated. Renew. Energy System. Energy 2017, 124, 59–73. [Google Scholar]
- Fodhil, F.; Hamidat, A.; Nadjemi, O. Potential, optimization and sensitivity analysis of photovoltaic-diesel-battery hybrid energy system for rural electrification in Algeria. Energy 2019, 169, 613–624. [Google Scholar] [CrossRef]
- Ayodele, T.R.; Ogunjuyigbe, A.S.O.; Akpeji, K.O.; Akinola, O.O. Prioritized rule based load management technique for residential building powered by PV/battery system. Eng. Sci. Technol. 2017, 20, 859–873. [Google Scholar] [CrossRef]
- Lopez, R.D.; Agustin, J.L.B. Techno-economic analysis of gridconnected battery storage. Energy Convers. Manag. 2015, 91, 394–404. [Google Scholar] [CrossRef]
- Upadhyay, S.; Sharma, M.P. Selection of a suitable energy management strategy for a hybrid energy system in a remote rural area of India. Energy 2016, 94, 352–366. [Google Scholar] [CrossRef]
- Kanase-Patil, A.B.; Saini, R.P.; Sharma, M.P. Sizing of integrated renewable energy system basedon load profile and reliability index for the state of Uttarakhand in India. Renew. Energy 2011, 36, 2809–2821. [Google Scholar] [CrossRef]
- Kumar, S.; Kaur, T.; Arora, M.K.; Upadhyay, S. Resource estimation and sizing optimization of PV/micro hydro-based hybrid energy system in rural area of Western Himalayan Himachal Pradesh in India. Energy Sources Part A Recovery Util. Environ. Eff. 2019, 41, 2795–2807. [Google Scholar] [CrossRef]
- Simon, D. Biogeography-based optimization. IEEE Trans. Evol. Comput. 2008, 12, 702–713. [Google Scholar] [CrossRef] [Green Version]
- Kumar, R.; Gupta, R.A.; Bansal, A.K. Economic analysis and power management of a stand-alone wind/ photovoltaic hybrid energy system using biogeography based optimization algorithm. Swarm Evol. Comput. 2013, 8, 33–43. [Google Scholar] [CrossRef]


| (a) | Diesel Generator | ||||||||||
|---|---|---|---|---|---|---|---|---|---|---|---|
| Type | Power Rating DG (kVA) | Capital Cost ($) | Diesel ($/Ltr) | ||||||||
| 1 | 20 | 3450 | 1.05 | ||||||||
| 2 | 30 | 5133 | 1.05 | ||||||||
| 3 | 50 | 5818 | 1.05 | ||||||||
| (b) | Solar Photovoltaic Module | ||||||||||
| Type | Voc (V) | Isc (A) | Vmax (V) | Imax (A) | Pmax (kW) | NCOT (oC) | Capital Cost ($) | ||||
| 1 | 44.5 | 9.9 | 39 | 9.62 | 0.375 | 48 | 273.79 | ||||
| 2 | 45 | 9.17 | 36.2 | 8.84 | 0.320 | 48 | 205.34 | ||||
| (c) | Battery | ||||||||||
| Type | Nominal Capacity (Ah) | Voltage (V) | DOD (%) | Capital cost ($) | |||||||
| 1 | 100 | 12 | 80 | 96 | |||||||
| 2 | 150 | 12 | 80 | 130 | |||||||
| 3 | 250 | 12 | 80 | 219 | |||||||
| (d) | Charge Controller | ||||||||||
| Type | n1 (%) PV Battery Charger | n2 (%) PV battery Charger | Power Rating (kW) | Capital Cost ($) | |||||||
| 1 | 95 | 70 | 0.24 | 68.45 | |||||||
| (e) | Bidirectional Converter | ||||||||||
| Type | Efficiency of Inv (%) | Power rating (kW) | Capital cost ($) | ||||||||
| 1 | 90 | 5.5 | 205.34 | ||||||||
| Combination | Device Type | Number of DGs | Number of Batteries | Number of PV Modules | Cost of Energy ($/kWh) | Total Net Present Cost ($) | ||
|---|---|---|---|---|---|---|---|---|
| DG | SPV | Battery | ||||||
| 1 | 1 | 1 | 1 | 5 | 254 | 466 | 0.261 | 1,201,939 |
| 2 | 1 | 1 | 2 | 10 | 260 | 490 | 0.236 | 1,214,814 |
| 3 | 1 | 1 | 3 | 10 | 162 | 489 | 0.237 | 1,204,933 |
| 4 | 1 | 2 | 1 | 11 | 353 | 495 | 0.235 | 1,226,900 |
| 5 | 1 | 2 | 2 | 9 | 152 | 524 | 0.245 | 1,322,258 |
| 6 | 1 | 2 | 3 | 8 | 104 | 495 | 0.239 | 1,207,519 |
| 7 | 2 | 1 | 1 | 8 | 134 | 493 | 0.231 | 1,224,802 |
| 8 | 2 | 1 | 2 | 7 | 258 | 488 | 0.235 | 1,215,611 |
| 9 | 2 | 1 | 3 | 8 | 79 | 493 | 0.267 | 1,621,356 |
| 10 | 2 | 2 | 1 | 7 | 380 | 495 | 0.234 | 1,195,032 |
| 11 | 2 | 2 | 2 | 6 | 139 | 495 | 0.245 | 1,300,750 |
| 12 | 2 | 2 | 3 | 7 | 136 | 483 | 0.234 | 1,218,686 |
| 13 | 3 | 1 | 1 | 5 | 307 | 519 | 0.225 | 1,204,972 |
| 14 | 3 | 1 | 2 | 3 | 65 | 519 | 0.284 | 1,655,641 |
| 15 | 3 | 1 | 3 | 5 | 78 | 519 | 0.264 | 1,642,181 |
| 16 | 3 | 2 | 1 | 4 | 386 | 495 | 0.232 | 1,184,115 |
| 17 | 3 | 2 | 2 | 4 | 261 | 495 | 0.229 | 1,170,417 |
| 18 | 3 | 2 | 3 | 2 | 104 | 495 | 0.246 | 1,139,395 |
| Combination | Emissions of CO2 by DG (kg/yr) | Total Fuel Consumption by DG (Litre) | Renewable Fraction (%) | Energy Index Ratio |
|---|---|---|---|---|
| 1 | 165,106 | 64,280 | 0.38 | 1 |
| 2 | 154,845 | 60,285 | 0.52 | 1 |
| 3 | 149,587 | 58,239 | 0.54 | 1 |
| 4 | 160,815 | 62,610 | 0.51 | 1 |
| 5 | 195,227 | 76,007 | 0.37 | 1 |
| 6 | 173,399 | 67,509 | 0.42 | 1 |
| 7 | 157,932 | 61,487 | 0.53 | 1 |
| 8 | 154,395 | 60,110 | 0.53 | 1 |
| 9 | 260,302 | 101,343 | 0.15 | 1 |
| 10 | 154,395 | 60,110 | 0.52 | 1 |
| 11 | 195,227 | 76,007 | 0.35 | 1 |
| 12 | 165,258 | 64,340 | 0.48 | 1 |
| 13 | 155,184 | 60,418 | 0.55 | 1 |
| 14 | 270,936 | 105,483 | 0.004 | 1 |
| 15 | 264,576 | 103,007 | 0.16 | 1 |
| 16 | 155,693 | 60,616 | 0.52 | 1 |
| 17 | 155,523 | 60,550 | 0.52 | 1 |
| 18 | 162,562 | 63,290 | 0.4 | 1 |
| Combination | Energy Index Ratio | Total Operating Hours (hr/yr) | |
|---|---|---|---|
| DGs | Batteries | ||
| 1 | 1 | 1947 | 3680 |
| 2 | 1 | 913 | 4683 |
| 3 | 1 | 882 | 4714 |
| 4 | 1 | 862 | 4734 |
| 5 | 1 | 1279 | 4286 |
| 6 | 1 | 1278 | 4318 |
| 7 | 1 | 776 | 4789 |
| 8 | 1 | 867 | 4729 |
| 9 | 1 | 1279 | 4286 |
| 10 | 1 | 867 | 4729 |
| 11 | 1 | 1279 | 4317 |
| 12 | 1 | 928 | 4699 |
| 13 | 1 | 732 | 4772 |
| 14 | 1 | 2130 | 3374 |
| 15 | 1 | 1248 | 4256 |
| 16 | 1 | 918 | 4678 |
| 17 | 1 | 917 | 4679 |
| 18 | 1 | 1917 | 3679 |
Publisher’s Note: MDPI stays neutral with regard to jurisdictional claims in published maps and institutional affiliations. |
© 2021 by the authors. Licensee MDPI, Basel, Switzerland. This article is an open access article distributed under the terms and conditions of the Creative Commons Attribution (CC BY) license (https://creativecommons.org/licenses/by/4.0/).
Share and Cite
Chauhan, A.; Upadhyay, S.; Khan, M.T.; Hussain, S.M.S.; Ustun, T.S. Performance Investigation of a Solar Photovoltaic/Diesel Generator Based Hybrid System with Cycle Charging Strategy Using BBO Algorithm. Sustainability 2021, 13, 8048. https://doi.org/10.3390/su13148048
Chauhan A, Upadhyay S, Khan MT, Hussain SMS, Ustun TS. Performance Investigation of a Solar Photovoltaic/Diesel Generator Based Hybrid System with Cycle Charging Strategy Using BBO Algorithm. Sustainability. 2021; 13(14):8048. https://doi.org/10.3390/su13148048
Chicago/Turabian StyleChauhan, Anurag, Subho Upadhyay, Mohd. Tauseef Khan, S. M. Suhail Hussain, and Taha Selim Ustun. 2021. "Performance Investigation of a Solar Photovoltaic/Diesel Generator Based Hybrid System with Cycle Charging Strategy Using BBO Algorithm" Sustainability 13, no. 14: 8048. https://doi.org/10.3390/su13148048
APA StyleChauhan, A., Upadhyay, S., Khan, M. T., Hussain, S. M. S., & Ustun, T. S. (2021). Performance Investigation of a Solar Photovoltaic/Diesel Generator Based Hybrid System with Cycle Charging Strategy Using BBO Algorithm. Sustainability, 13(14), 8048. https://doi.org/10.3390/su13148048