Review

A Review of Modeling Rotating Packed Beds and Improving Their Parameters: Gas–Liquid Contact

1
Faculty of Petroleum, Gas and Petrochemical Engineering, Persian Gulf University, Bushehr P.O. Box 75169-13817, Iran
2
School of Chemical Engineering and Institute of LNG, College of Engineering, University of Tehran, Tehran P.O. Box 14779-56315, Iran
*
Author to whom correspondence should be addressed.
Sustainability 2021, 13(14), 8046; https://doi.org/10.3390/su13148046
Submission received: 28 May 2021 / Revised: 5 July 2021 / Accepted: 13 July 2021 / Published: 19 July 2021
(This article belongs to the Special Issue Industrial Wastewater Treatment and Recycling)

Abstract

:
The aim of this review is to investigate a kind of process intensification equipment called a rotating packed bed (RPB), which improves transport via centrifugal force in the gas–liquid field, especially by absorption. Different types of RPB, and their advantages and effects on hydrodynamics, mass transfer, and power consumption under available models, are analyzed. Moreover, different approaches to the modeling of RPB are discussed, their mass transfer characteristics and hydrodynamic features are compared, and all models are reviewed. A dimensional analysis showed that suitable dimensionless numbers could make for a more realistic definition of the system, and could be used for prototype scale-up and benchmarking purposes. Additionally, comparisons of the results demonstrated that Re, Gr, Sc, Fr, We, and shape factors are effective. In addition, a study of mass transfer models revealed that the contact zone was the main area of interest in previous studies, and this zone was not evaluated in the same way as packed beds. Moreover, CFD studies revealed that the realizable k-ε turbulence model and the VOF two-phase model, combined with experimental reaction or mass transfer equations for analyzing hydrodynamic and mass transfer coefficients, could help define an RPB system in a more realistic way.

1. Introduction

Process intensification (PI) is defined as an engineering application utilized to improve sustainability, cleaning, safety and energy efficiency. PI in mass transfer (MT) involves three main methods: rotating, mixing, and vibrating [1]. There are good reviews available on PI that provide more details on this topic [2,3]. Researchers have been using the advantages of centrifugal fields for more than 65 years [4]. A rotating packed bed (RPB) contactor is a piece of PI equipment, also called a “HiGee” (high g) because of the high gravity applied in this contactor by the centrifugal force used for increasing the contact of phases [5]. This device was first patented in 1963, and includes concentric rings for packing purposes [6]. Industrial applications of this equipment started in the 1970s when Imperial Chemical Industries worked on technology derived from NASA research projects [7]. Almost a decade later, Ramshaw and Mallinson presented a report on NH3 absorption and MT coefficient intensification using an RPB for the first time [8]; later, this technology was licensed by Glitsch in the USA [9]. Investigations into and the development of RPBs were have been out by numerous researchers in many MT and reaction fields, such as distillation. Several kinds of RPB have been reviewed and their advantages discussed in [10], while the results and some of their industrial applications are presented in [11].
As CO2 emissions are now a global concern, investigations in this field employ three main approaches: post-combustion, oxy-fuel combustion, and pre-combustion for CO2 capture [12,13]. Chemical absorption has been applied and developed more extensively in post-combustion than in other industrial processes [14]. Therefore, a large amount of waste is produced by the use of certain conventional gas treatment packed bed columns (PBCs), and this approach requires high quantities of absorbent solvents in order to prevent hydrate formation with the small quantities of other components, such as CO2 and H2S. The most common acidic gas removal problems include absorption heat, high energy consumption for regeneration, and amine solutions’ corrosive nature and temporal degradation [15,16]. The previous field studies on chemical absorption will be explained, along with some brief examples, below.
  • Absorbent formulation, in which a highly soluble, reactive, absorbent, and aqueous solution of alkanolamines is made and blended by adding activators or promoters, such as sterically hindered amine AMP, and effective promoters, such as PZ.
  • Process intensification involves the application of PI techniques or devices and optimization parameters. This category contains many techniques that can be considered to enhance transport in numerous processes, such as bioremediation [17], water deaeration [18], and absorption. As regards devices, many popular contactors are available, such as rotating discs, membranes, and RPBs.
For instance, Hosseinzadeh et al. [19] examined CO2 capture with a hallow fiber membrane contactor (HFMC), using MEA to increase the chemical reaction rate and the contact of phases. M. Theils et al. [20] performed a comparison between several arrangements of PBs and RPBs, and demonstrated that reducing the packing volume in the RPBs resulted in equal removal efficiencies. Additionally, this kind of method is applied in many fields, and the simultaneous application of the above two intensifying absorption methods (a and b) can offer advantages such as energy reduction in thermal regeneration using an RPB on MEA–CO2 system, as reported by Cheng et al. [21]. Their results show that the same regeneration efficiency in PBCs could be achieved with RPBs that were at least 10 times smaller than the PBCs, and they demonstrated that RPBs had higher MT and heat transfer coefficients and involved less HTU and regeneration energy consumption. Other benefits of this approach have also been reported. An investigation into CO2 capture with water-based NFs (absorbing solutions) in HFMC revealed possible enhancements to MT and removal efficiency [22]. In addition, Luo et al. [23] reported that the relative effective gas–liquid interfacial surface area and volumetric liquid-side MT coefficient were both increased when using ultrasonic induction, in comparison with an RPB without ultrasonic induction under the same conditions. These approaches, referred to as hybrid processes, have been further discussed in [24].
RPB is a piece of equipment that operates via centrifugal acceleration, which affects the hydrodynamics to induce PI. Therefore, improving an RPB’s characteristics via hydrodynamic analysis is the main goal of this investigation. In this paper, the status of the gas–liquid contact in the RPB, and especially the absorption processes taking place in various models and methods, have been evaluated and reviewed. The comparison of publications shows that various configurations of RPBs have been developed to expand contact zones and effective surface areas, and to achieve a higher MT and capacity, as well as a reduced pressure drop.
In the first section, the main concepts, such as the advantages of centrifugal gravity, the geometry and classification of RPB, the directions of investigations (i.e., hydrodynamic and mass transfer enhancement) and modeling outlooks, are described. In the second section, the modeling of hydrodynamic parameters and their development to attain accurate systems are analyzed. In the third section, the developments in the modeling of MT’s parameters as regards its rate are studied. Finally, in the last sections, two powerful methods suitable for hydrodynamic analysis and scaling-up, as well as the effects of centrifugal gravity on the dimensionless numbers that form the main focus of this analysis, are reviewed and evaluated. Here, all the above-mentioned items are reviewed simultaneously, because no previous review has evaluated all the parameters that together characterize the RPB.

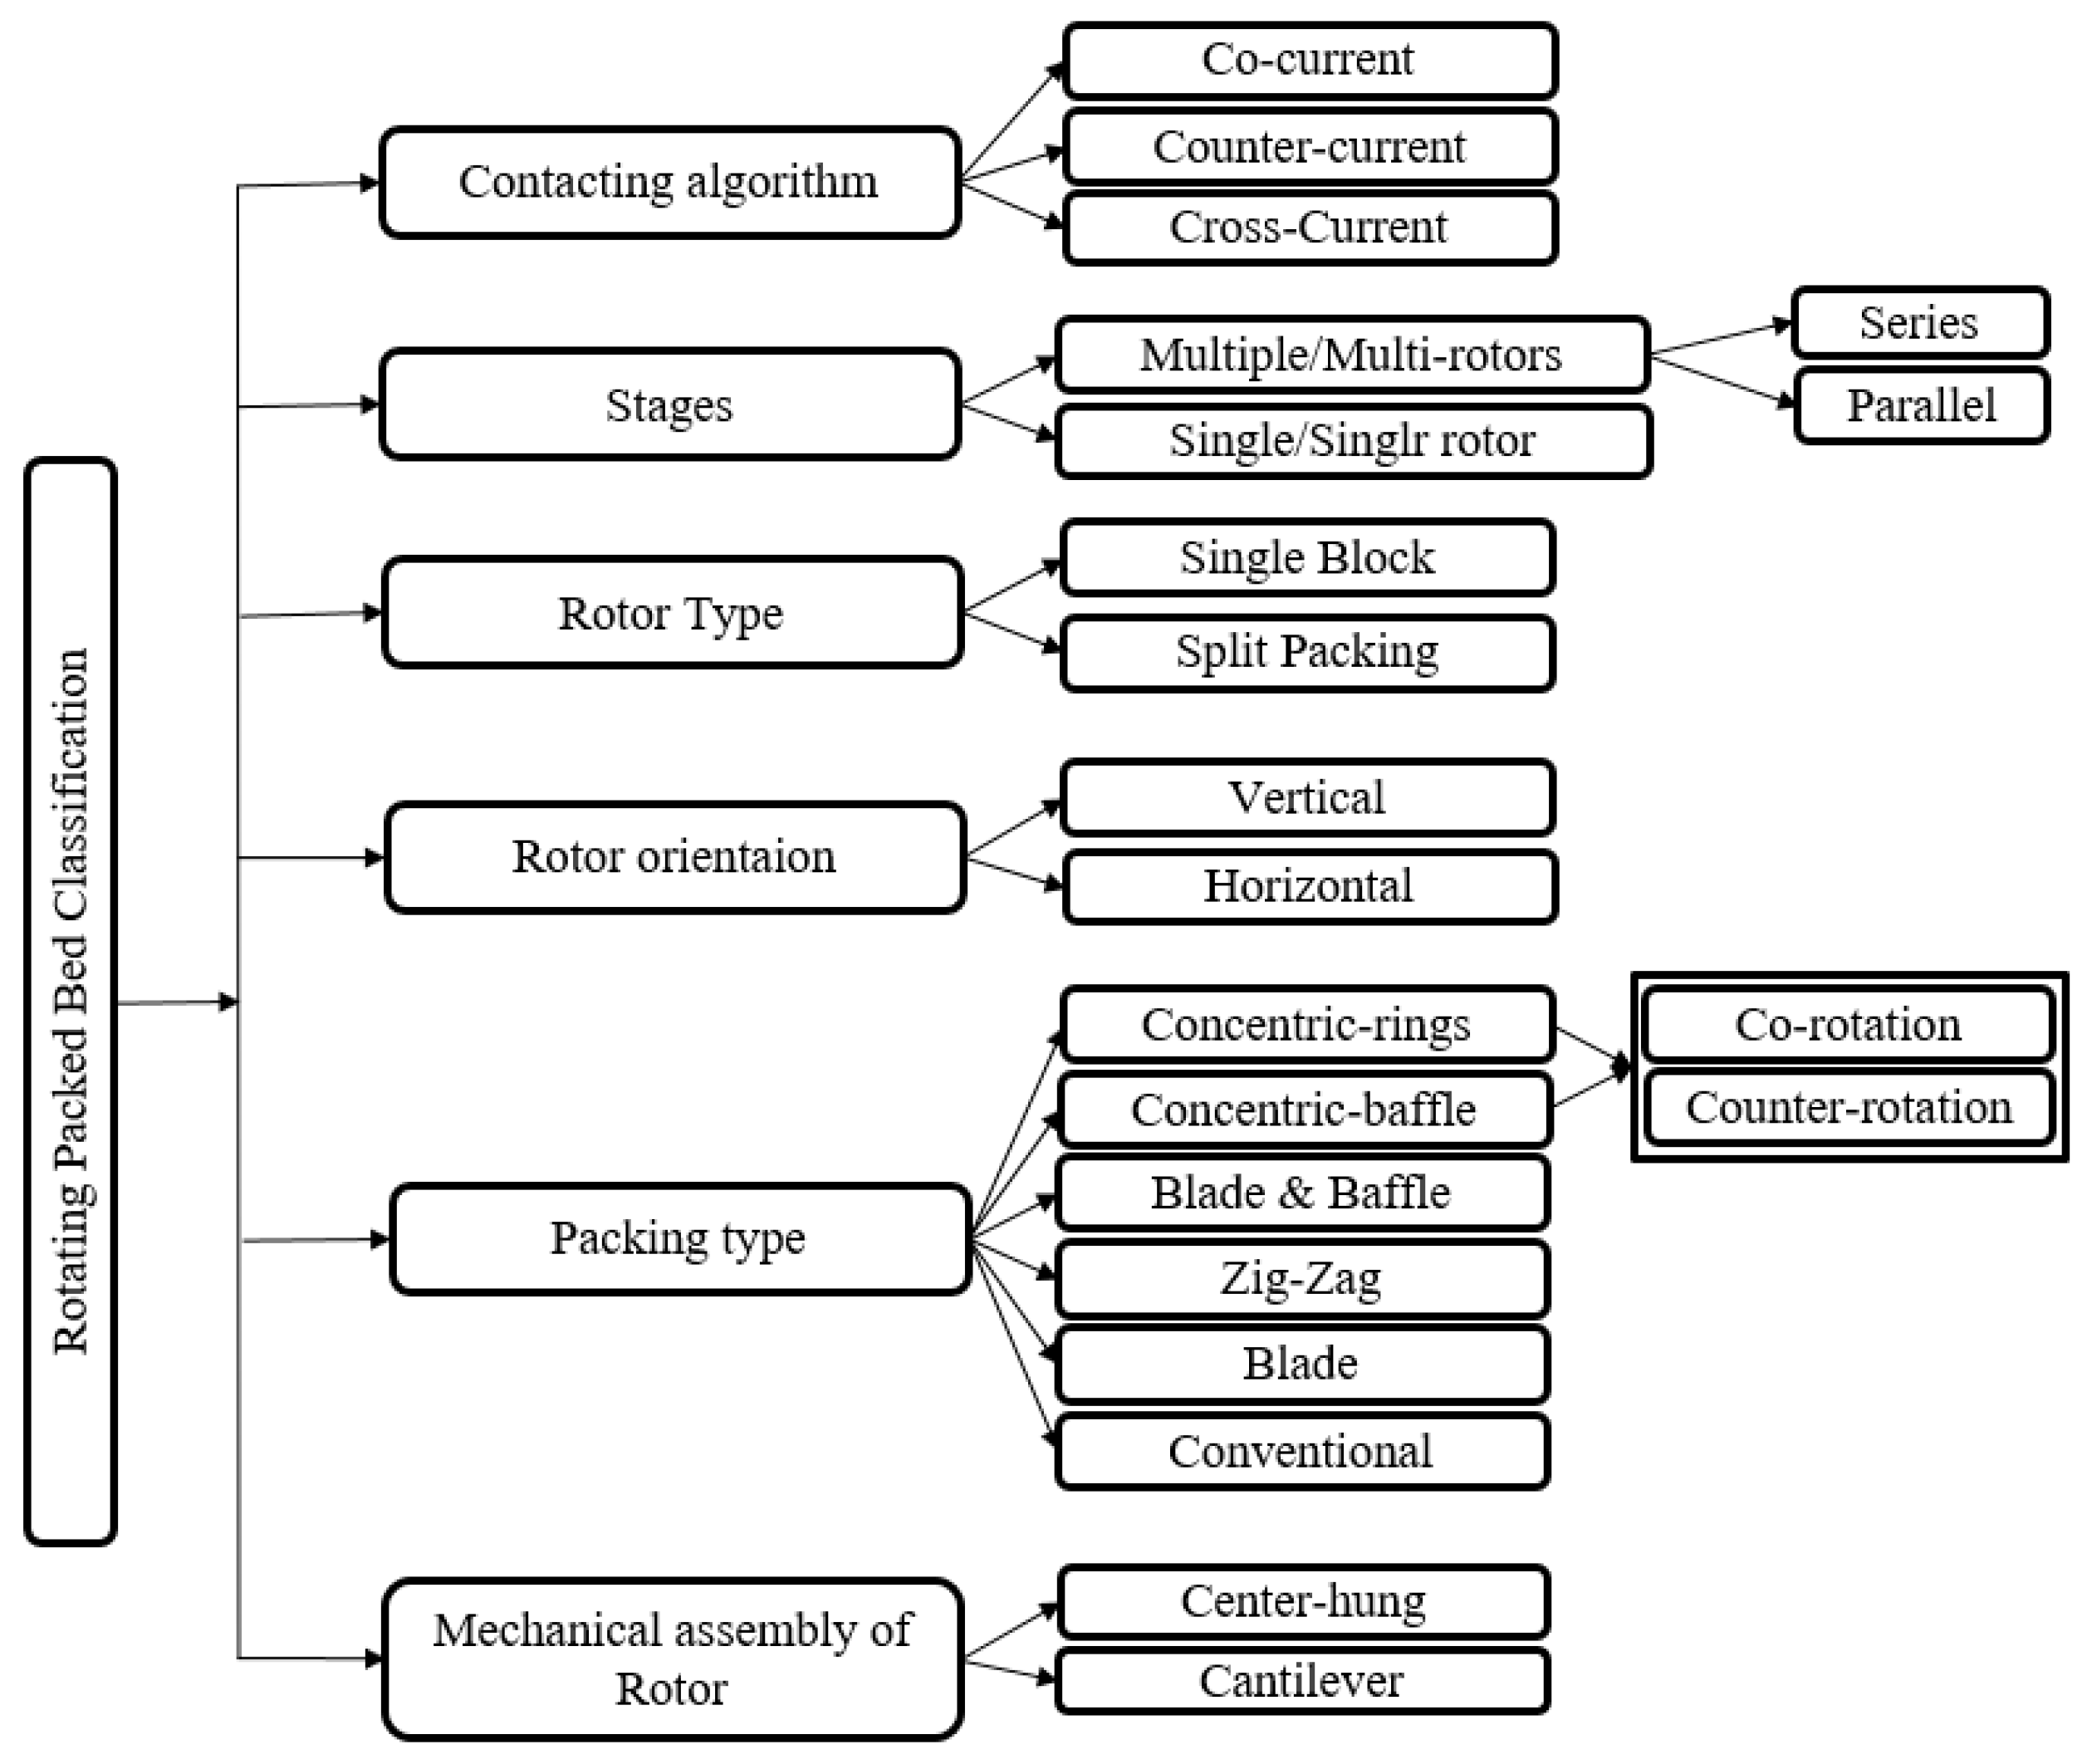
2. RPB Advantages and Configurations

An RPB contactor consists of packing mounted on a horizontal/vertical shaft (rotor), casing, and a liquid distributor. A simple conventional RPB is made up of a rotor enclosed in casing, with a liquid distributor that injects liquid into the packing center. The packing is divided into three zones: the bulk packing, the end-effect (the part near the inner edge of the rotor), and cavity zones, which are between the outer edge of the packing and the inner edge of the casing [25]. The acceleration in RPBs (typically 1000 g) is greater than that in PBCs, which allows for improved micro-mixing, as demonstrated, for instance, by the experimental results of Yue’s investigation of an RPB [26]. The high gravity leads to higher gas–liquid interfacial surface area accessibility in RPBs, compared with conventional PBCs.
Ramashaw and Mallinson applied average centrifugal accelerations of up to 1000× g, and showed that the MT coefficient would increase by ω, with a power of 0.28–1.08 [8]. This was confirmed in other studies, such as those by Guo et al. [27] and Liu et al. [28], and in reports on MT coefficients, which examined parameters of 1500 rpm and higher. Tsai et al. conducted a similar experiment and added 38% to the MT coefficient’s value, with an annular speed increase from 600 to 1800. They reported that this was due to the boundary layer thickness reduction [29]. On the other hand, the liquid film becomes thinner with higher annular speeds and greater radii from the axis, due to the lower difference between the phase interface and average bulk concentrations [30]. Additionally, the effective surface has been shown to increase with an increase in the ω [31]. Lin et al. examined the effective surface area, which they increased from 5.9 to 31.7 m2/m3 by increasing the rotational speed from 600 to 1800 rpm [32].
Chen et al. examined the liquid hold-up in two RPBs with different sizes of packing and with rotations of 300–1500 rpm (providing 4–152 g), and showed that the liquid hold-up was reduced with an increase in ω [33]. The MT rate directly depends on hold-up, which is a function of the rotational speed, and ω directly depends on the radius of the packing [34]. Furthermore, the rate of pressure drop within the RPB increases with an increased rpm, as illustrated by the results of Zheng et al. and Sandalia et al. [35,36]. Additionally, as examined and discussed in [37,38], the height of transfer unit (HTU) achieved in an RPB is lower than that in a PBC under the same conditions.
Some researchers focused on acidic gas removal efficiency, showing that it increased with an increase in the rpm [39,40]. Moreover, Thiels et al. [20] demonstrated that a lower packing volume was required at higher rpms than at lower ones to achieve the same value of removal efficiency.
Based on the above information and in order to optimize the RPBs, many researchers have refined the operation parameters of RPB contactors by focusing on increasing the contact between the phases and staging, which allows better feed injection between the stages and increases the capacity of the contactor. A summary of US patents registered in 1935–2018 is given in Table 1, which shows that US patent development has been focusing on modifying RPBs to increase their contact zone. More detailed information about several patents can be found in [6].
Table 1. US RPB patents published in 1939–2018.
Type of RotorCCFImprovementsPatent No.Inventor(s)Published Year
SingleCCContact zone and sealsUS 2,172,222W. J. Podbielniak [41]1939
Contact zoneUS 2,281,796W. J. Podbielniak [42]1935
US 2,758,783W. J. Podbielniak [43]1951
US 2,878,993W. J. Podbielniak [44]1959
US 2,941,872C. W. Pilo et al. [45]1960
US 3,034,730C. W. Pilo et al. [46]1962
Contact zone, reduced entrainmentUS 3,233,880W. J. Podbielniak [47]1962
Multi-rotorContact zone, increased capacityUS 3,344,981W. J. Podbielniak [48]1965
SingleContact zoneUS 3,415,501C. W. Pilo et al. [49]1965
Multi-rotorContact zone, increased capacityUS 3,486,743D. B. Todd [50]1967
SingleCC & COCContact zoneUS 4,283,255C. Ramshaw and R. H. Mallinson [8]1981
SingleCCUS 4,397,794C. W. Pilo [51]1981
SingleLiquid distribution and contact zoneUS 6,884,401 B2S. Yang et al. [52]2002
Multi-rotorContact zoneUS 7,344,126 B2J Ji et al. [53]2004
SingleCC & COCUS 8,448,926 B2M. D. Mello et al. [54]2011
Multi-rotorUS 20130319235A1H. Wolf et al. [55]2012
SingleCCUS 20160317967 A1M. Kotagiri et al. [56]2016
SingleUS 20170028311A1B. K. Namdeo et al. [57]2017
Two stagesUS 20170157554A1C. H. Yu and C. S Tan [58]2017
Multi-rotorCC & COCUS20180016159A1M. V. D. e Mello et al. [59]2018
CCF: contacting conditions of fluids; CC: counter-current; COC: co-current; MTP: mass transfer process.
The different RPB names depend on the structure of the rotor, e.g., baffle [29] and blade [60], the bulk zones of which consist of baffles or blades, respectively; split (RSB) [61], the rotor of which includes dual packings rotating in the same or opposite directions; zigzag (RZB), which comprises a special rotor with a zigzag flow direction [62].
Generally, RPBs can be classified according to six criteria, as shown in Figure 1.
Comparing the cross-current and countercurrent flows of simple RPBs, Chia-Chang Lin et al. investigated CO2 removal using caustic solution, and reported that the KGa values of the cross-current flows were higher than those of the countercurrent flows [63]. In the same year, G. Q. Wang et al. [62] developed RZBs with similar MT efficiency and better operability and turn-down ratios. This contactor was first patented in 1952 by Kapitza [64]. After consulting the review papers of Visscher et al. [65] and Wang et al. [66], which were published in 2013 and 2019, respectively, the advantages of RZBs over simple RPBs may be listed as follows:
  • less maintenance due to their static seal;
  • possibility of multiple feeds and more flexibility;
  • no need for liquid distributers;
  • more liquid hold-up and residence time;
  • multi-rotor operability on one shaft.
Additionally, Wang et al. [67] contributed to RZB optimization by making modifications to its structure.
The disadvantages of this kind of RPB in comparison with simple RPBs include a lower MT rate, which is attributed to the replacement of packings with baffles and rings, and higher power consumption.
RPBs equipped with blades and RPBs with a number of liquid inlets have greater MT efficiency than simple RPBs due to the intensified MT rate in their end-effect zone, as Guang-Wen Chu et al. reported [68].
Moreover, counter-rotation RSBs achieve greater MT efficiency than the co-rotation type [69]. Furthermore, the benefits of an RZB over an RPB include the possibility of additional feed streams, the replacement of a dynamic seal with a static one, the need for fewer liquid streams for distributers, greater liquid hold-up, and the operability of stages by one rotor [65].
Different layouts with RPBs or PBCs in series or in parallel may help to achieve specific process parameters [70]. For instance, C. H. Yu et al. [71] studied the effect and removal efficiency of these configurations by examining eight single-, parallel- and series-mode configurations of RPBs and PBCs with MEA, and showed that the greatest level of gas treatment was achieved with two RPBs in a parallel mode, the regeneration energy consumption of which was approximately equal to that of a PB.

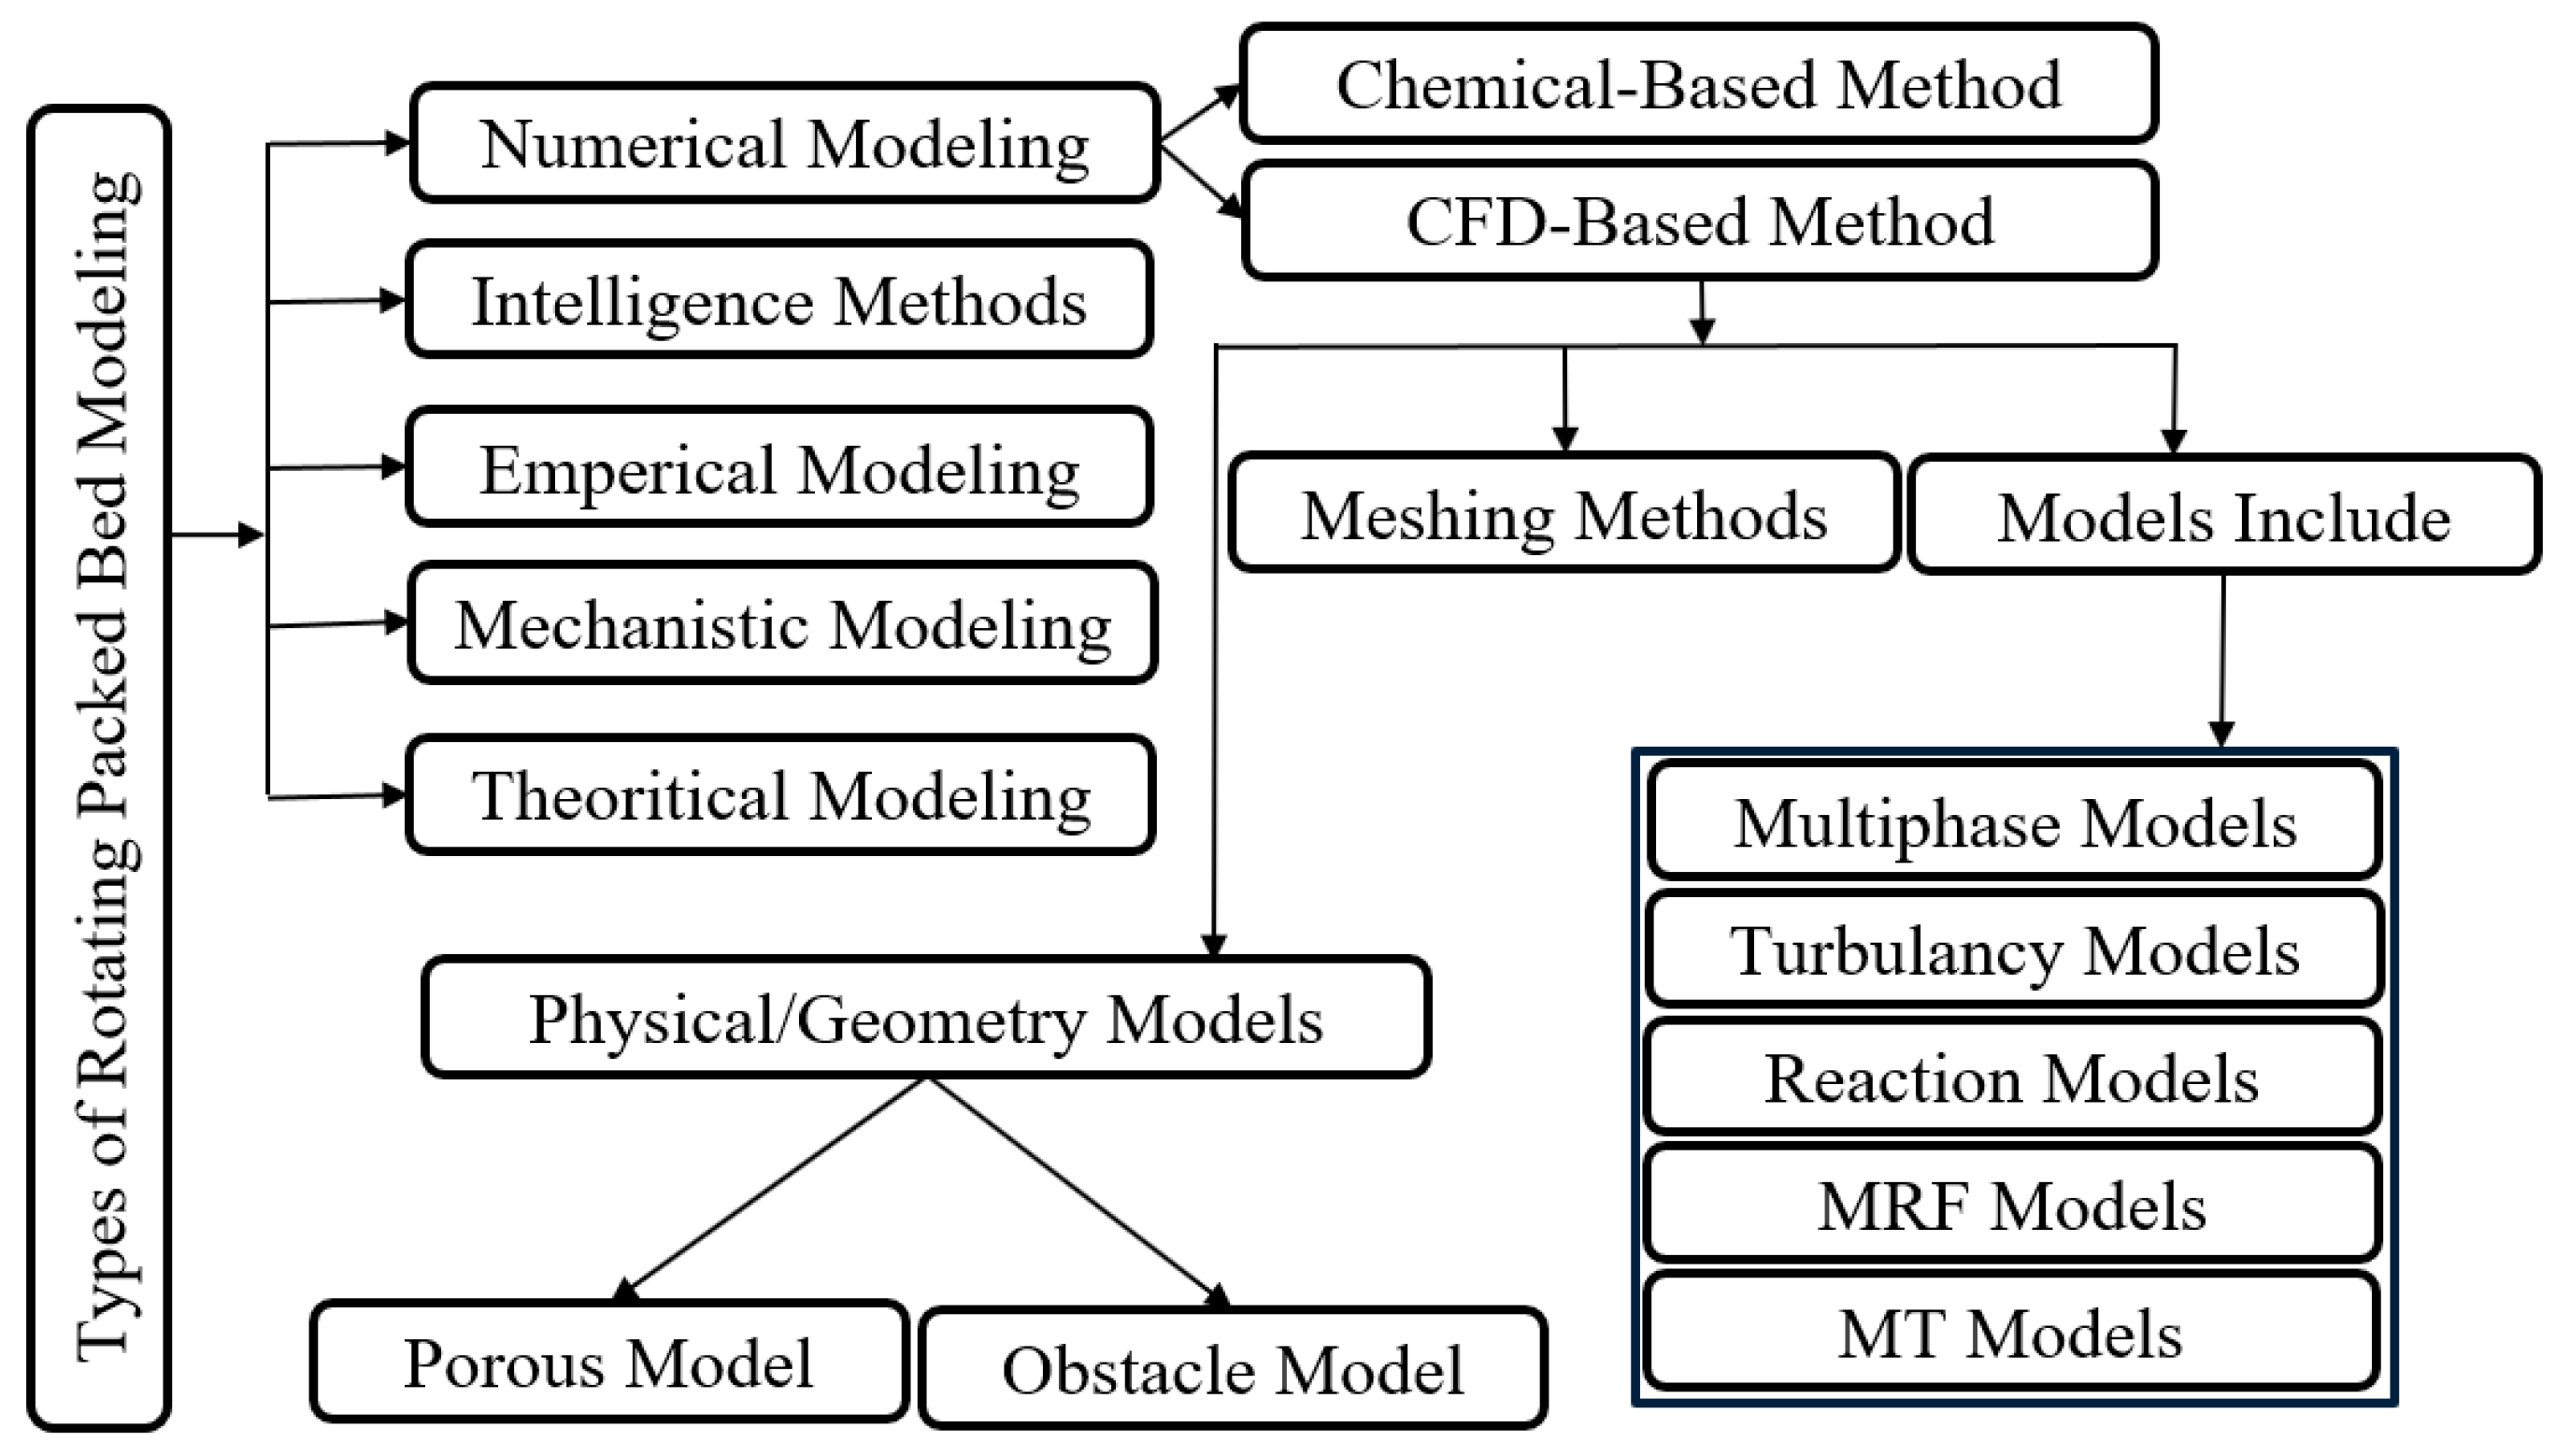
3. Modeling Rotating Packed Beds

RPB contactors can be modeled via various approaches based on the MT’s characteristics and hydrodynamic analysis, as shown in Figure 2. Theoretical and mechanical models help us to comprehend the nature of gas–liquid flows and reactions. These methods result in significant discrepancies with experimental data due to the simplification of assumptions. Statistical and empirical methods developed to increase accuracy rely on semi-empirical and statistical regressions. Generally, these models give acceptable results, but due to their dependency on experimental data, it is not possible to infer general correlations from these models. Numerical simulation is another useful approach, and it is categorized into chemical-based and computational fluid dynamics-based (CFD) types, which are more detailed and accurate in comparison with previous methods [72]. Additionally, in the context of CFD complexity and the numbers of empirical model errors, machine learning, or artificial intelligence, is another method that has been developed by researchers such as Saha, who used artificial neural networks (ANN) to estimate the overall gaseous MT coefficient by applying the radial basis transfer function [73]. Lashkarbolooki et al. [74] employed ANN for pressure drop modeling and estimation in RPBs under various operations. Zhao et al. [75] proposed an intelligent approach to MT coefficient estimation in CO2–NaOH systems by employing the radial basis transfer function. Saha reported that the developed model was more accurate than multiple nonlinear regression and ANN. Li et al. [76] applied three ANN models to simulate adsorption in RPBs. Liu et al. [77] developed an ANN-based approach for biosorption modeling, which was used the ReL, λ, maximum contact time, ratio of particle diameter to bed height (Dparticle/Z), and ratio of initial concentration to packing density, as input variables. Recently, Liu et al. employed ANN to a model and estimated the overall MT coefficient (KLa) in the ozone absorption process in RPBs, using input variables such as ReG, ReL, FrL, and WeL. [78].

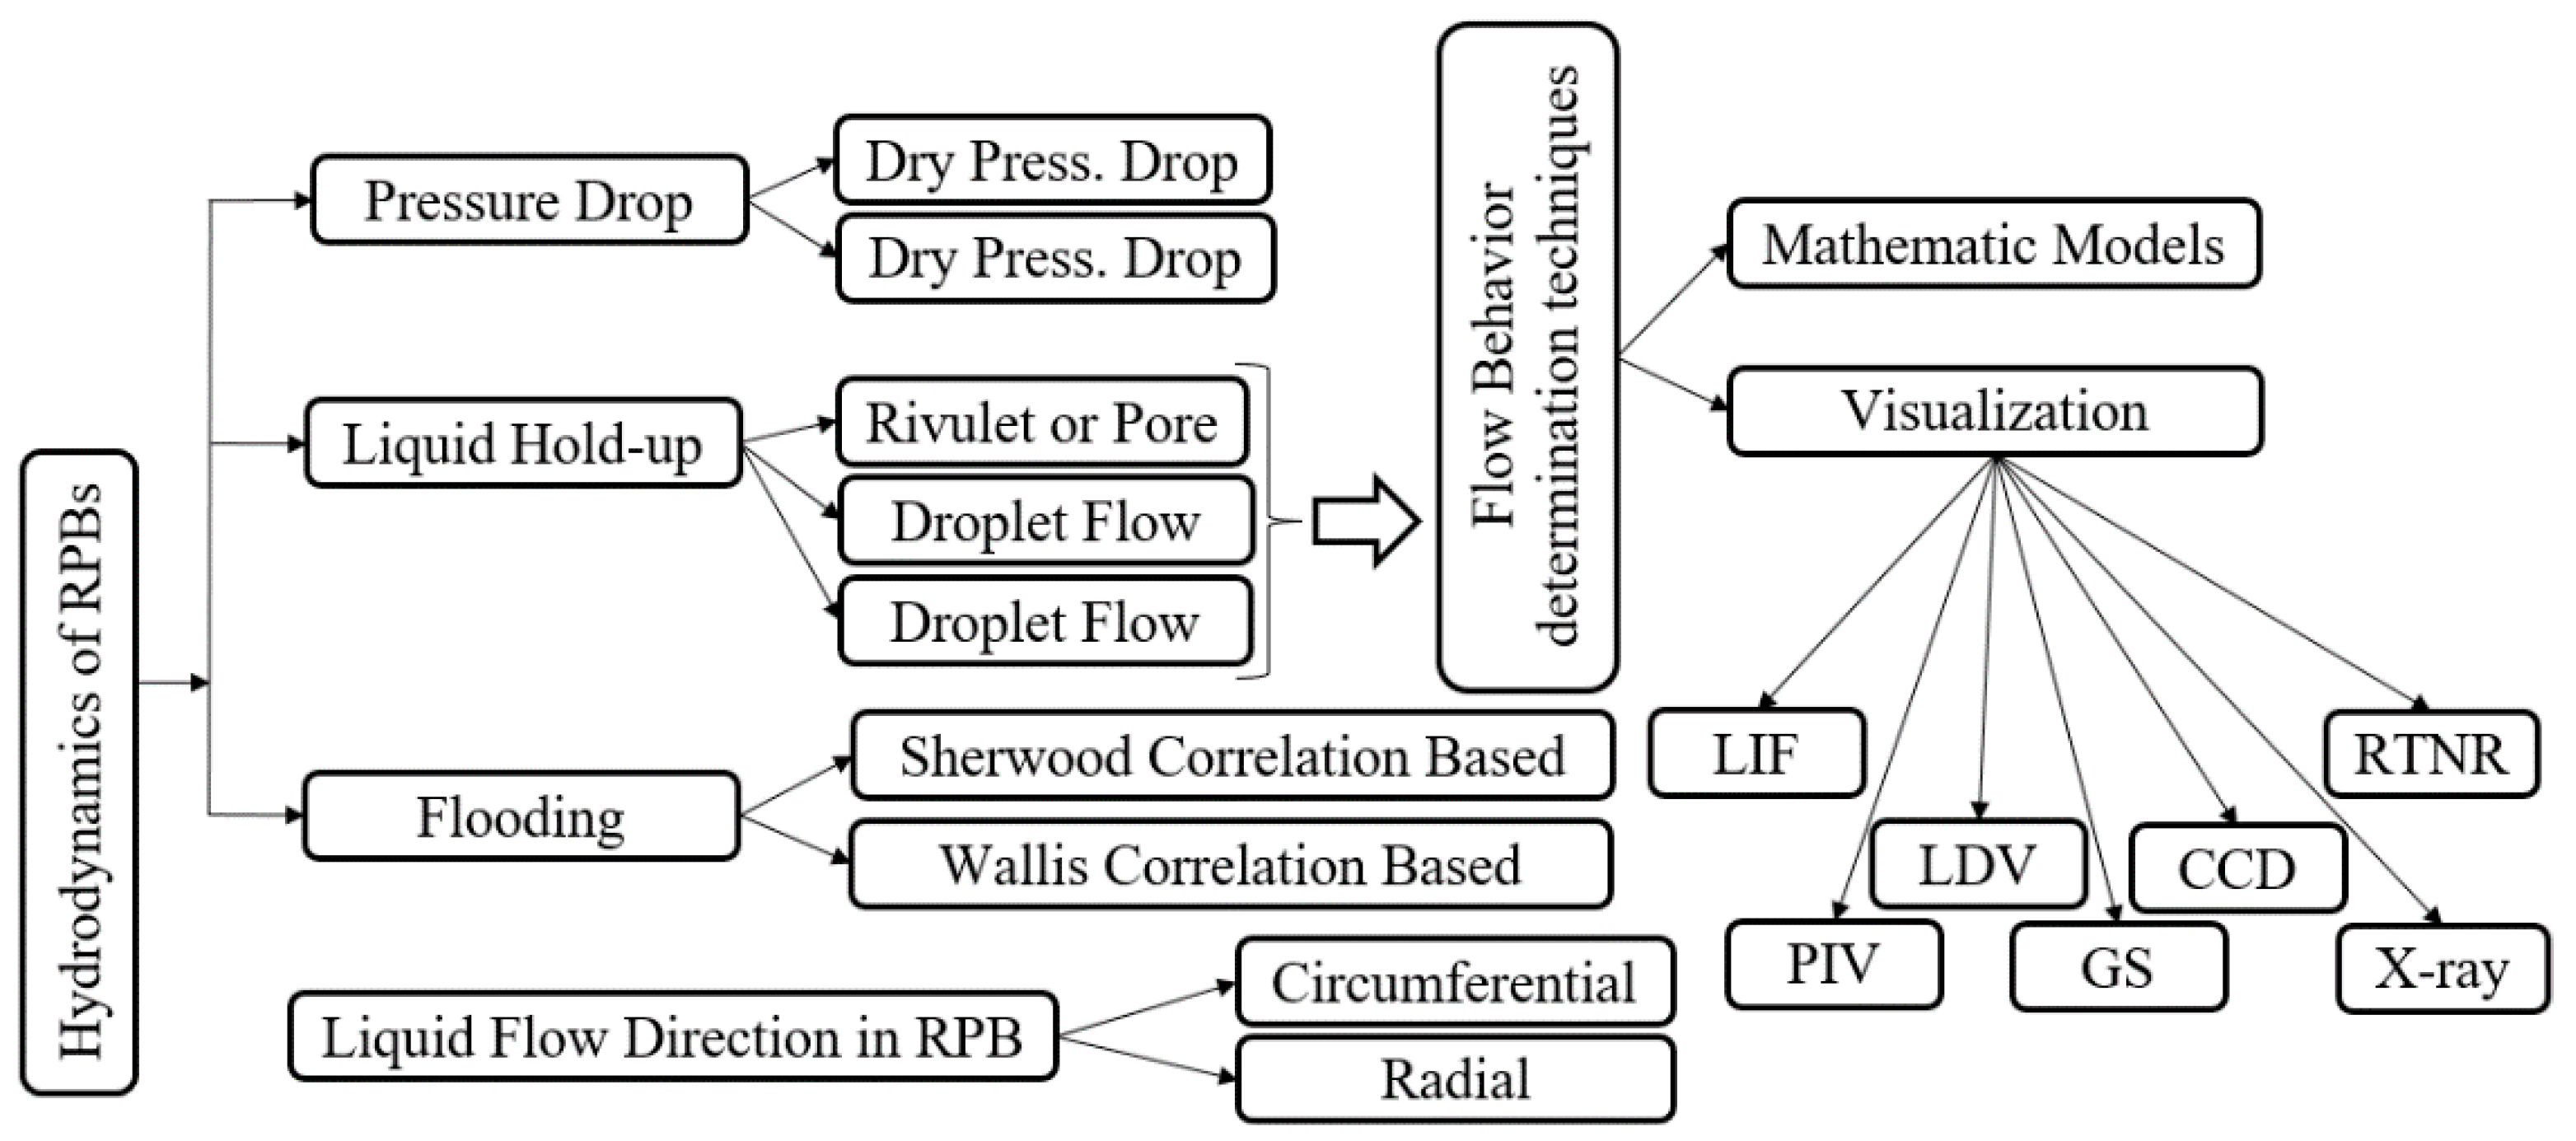
3.1. Hydrodynamic Modeling

Hydrodynamics is the study of fluid motions [79] and includes pressure drop, flooding and liquid hold-up [79]. Basic and detailed experimental research is required for explaining hydrodynamics and MT in RPBs, as well as their correlations [80]. On the other hand, MT performance strongly depends on fluid flow patterns [66]. The hydrodynamic parameters employed for RPB scale-up and design [81], which are going to be reviewed in this section, are shown in Figure 3. Regarding these important issues, investigators have determined many correlations for three models—flooding, pressure drop and hold-up models—as described below.

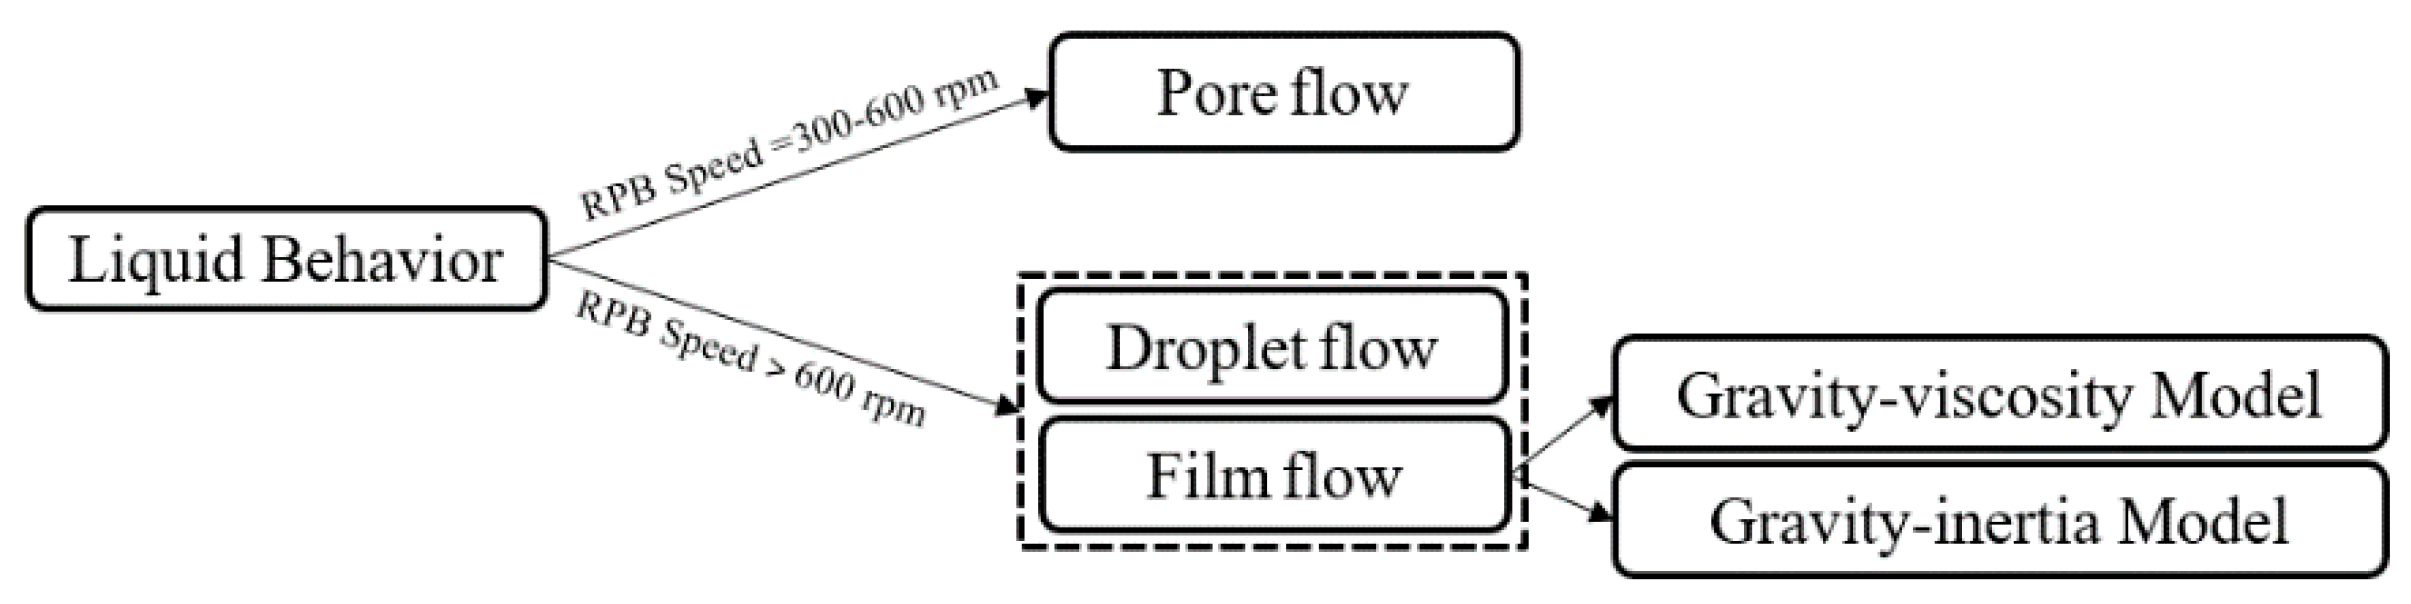
3.1.1. Liquid Behavior and Hold-Up

The liquid patterns in RPBs can be classified into the three categories of droplet flows, film flows and pore (thread or ligaments) flows, which were proposed by Burns and Ramshaw [82] following visual observation and photography, which confirmed the presence of pore and droplet pattern flows, as shown in Figure 4.
When the rotational speed is between 300 and 600 rpm, the pore flow regime is the dominant pattern in the RPB, wherin the liquid primarily flows in the form of radial rivulets, while the zones between them are empty, and this leads to a reduction in the MT effective surface area. When the rotational speed exeeds 600 rpm, the liquid’s behavior changes to a droplet flow and then to a film flow pattern [27,82,83]. Generally speaking, centrifugal increments make film flows thinner and cause the mass fluxes to increase [84].
Generally, the most prominent visualization techniques for determining flow fields and behavior in packed beds include gamma scanning [85], tomography [86], X-ray [83], PIV measurement [87], RTNR [88], and CCD camera [89].
S. Munjal et al. illustrated that δ was affected by the liquid kinematic viscosity, flow rate, packing radius and annular speed of RPBs [30]. Later, researchers developed empirical correlations for predicting the thickness of liquid elements. A brief summary of these correlations, developed between 2000 and 2020, is given in Table 2, which confirms the results of Manjal et al.’s study and illustrates that the liquid’s properties, along with packing configuration and rotation rate, determine the amount of δ .
Some investigators applied the above findings in the hydrodynamic analysis of RPBs in their studies. X. Li et al. [90], for example, reported that when the acceleration was lower than 60 g in a rotating fin baffle packed bed contactor, the dominant regime was film flow, and that Guo et al.’s correlation could be used to calculate the thickness of the liquid film. This correlation, as shown in Table 2, demonstrates that liquid thickness reduces when the rotational speed increases.
Sang et al. [91] analyzed fluid patterns in RPBs with high-speed photography. They found that the liquid flow would take the form of ligaments, which exited the packing at lower rotational speeds (pore flow) and grew in numbers at higher speeds, then finally disappeared. Drawing on the results of their study, they categorized liquid patterns into ligament or pore flows and droplet flows, suggested six parameters that affect the flow regime, and proposed a criterion to determine the regime based on the relation between the Re and We numbers via the new dimensionless number of q, which is defined by the liquid’s initial velocity, the annular speed, and the outer rotor diameter.
Additionally, Sang et al. reported that most of the MT in the cavity zone of their RPB was carried out by droplet collisions with the casing wall. They considered the deposition splashing of a liquid (droplets) using Ohnesorge and Reynolds numbers. They proposed a set of criteria relation criteria named “splash criteria”, and reported that the MT in the cavity zone was due to droplet interaction with the inner wall of the casing [25].
Li et al. studied the liquid flow situation in an RPB with a charge-coupled device (CCD) camera [89]. They reported the non-continuity of film–ligament droplets at low velocities and weaker surface tension at higher velocities, showing that the liquid flow turned into droplets at higher velocities. Moreover, they argued that the break-up and coalescence of liquids may occur when droplets fly in RPBs, which is determined by
W e = ρ G | v L v G | 2 D σ L > 12
where Weber numbers lower than 12 indicate that liquid breaking occurred in the cavity zone. They proposed a correlation with a ±15% error using
d = 5.03 × N 0.347 u 0 0.183
Table 2. Estimation of liquid element thickness via empirical correlations.
AuthorYearRPB TypeKind of PackingLiquid FormCorrelation
Burns et al. [92]2000Glass sphere δ ¯ = 2.25 ( ν L u L a w a c ) 1 3 δ ¯ = 2.59 u L a w a c 1 2 d p o r e 1 2 [ 1 ( 1 K ) 1 2 K 1 2 ] : Inertia flow δ ¯ = 2.25 ( ν L u L a w a c ) 1 3 : Viscos flow
C. C. Lin et al. [93]2000Glass sphere δ = 4 Q L d 5 π r u r , L h , δ ¯ = 1 R o R i R i R o δ d r
Chen et al. [33]2003Metal wire meshFor complete wetted packing: δ ¯ = 4106 u L , i 0.454 u G , i 0.002 ω 0.104
For partial wetted packing: δ ¯ = 2055 u L , i 0.183 u G , i 0.003 ω 0.109
Yi et al. [94]2009Wire meshDroplet d = [ 0.826 + 17.4 ( r r i ) ] d 1 , r r i < 0.01   m Cavity zone
d = 12.84 ( σ L ω 2 r ρ L ) 0.63 u L 0.201 Bulk zone
Li et al. [95]2009Film δ = ( 3 ν L Q r ω 2 ) 1 3
Yang et al. [96]2010Droplet d ¯ = C ( σ ω 2 r ρ L ) 0.5
Sang et al. [91]2017 d d r o p l e t R o = 0.042 W e 0.272 R e 0.068 q 0.098 ( R o R R o t o r ) 0.776 For cavity zone
Sang et al. [97]2019SimpleWire mesh d e = [ 0.826 + 17.4 ( r e r i ) ] d 1 d e z = [ 0.826 + 17.4 ( r e z r i ) ] d 1 End-effect zone
d b = 12.84 ( σ ρ L r b ω 2 ) 0.630 u L , b 0.201 d b z = 12.84 ( σ ρ L r b z ω 2 ) 0.630 u L , b z 0.201 Bulk zone
Wang et al. [98] d i ¯ = 0.7284 ( σ L ω 2 R p ρ L ) 0.5 Bulk zone
d o ¯ r o = 0.042 W e L 0.272 R e L 0.068 q L 0.098 ( R o R i ) 0.776 Cavity zone
q L , 0 = u L , 0 ω r
Su et al. [99]2020Metal wire mesh d a v g d 0 = 8.58 W e 0.18 R e 0.24 N p 0.44 ( 1 C o s θ a d v * ) 0.12 ( h 1 h m a x ) 0.18
Recently, Hacking et al. [100] examined several kinds of concentric redistribution rings in an RPB operated in the speed range of 500–1200 rpm, and reported that this type of liquid distribution could improve the uniformity of liquid distribution, thus increasing the wetting and effective surface areas and reducing the channeling area in the packing zone.
In PBCs, it is important to know the hold-up in order to determine the dynamics of the tower, because this affects the mass transfer and pressure drop. In addition, the hold-up directly affects the operating weight of PBCs and, therefore, the design of the supports [101]. The term “hold-up” describes the volume of liquid present on the surface of the packing in the form of a film or ligaments, or droplets in the voidage of the packing in the form of rivulets. There are two types of hold-up: static and dynamic (operating). The first term refers to the liquid inventory in the packing where gas and liquid do not flow, and the second one refers to the liquid inventory when both liquid and gas flow. The hold-up in random packing is defined by the summation of both (static and dynamic) the terms [102]. Most researchers report total hold-up, and do not establish this parameter separately in their correlations [102]. Hold-up estimation allows for the determination of residence time in the packing, and is especially important when the system contains a special mixture that is sensitive to temperature or reactive absorption processes [103]. There are many correlations available to help predict the liquid hold-up in PBCs [104,105], but because of the existence of radial flows in an RPB’s geometry, the liquid hold-up equations for RPBs are not the same as those for PBCs. The rotational speed reduces the hold-up and simplifies the gas passage, as Lashkarbolooki [106] showed. Theoretically, the mean hold-up in RPBs may be defined by the following equations [93]:
h ¯ L = V L V B
V B = π ( R o 2 R i 2 ) Z
Other methods for hold-up measurement, such as gamma absorption [103], conductance measurement [107] and the neural network method [108], are empirical.
Basic and Dudukovic [107] defined a correlation, according to their empirical data, using Re and Ga numbers and packing characteristics. F. Guo et al. focused on cross-flow simple RPBs equipped with wire gauze packings, and determined the amount of hold-up by considering the ratio of the liquid area flow rate to the liquid mean radial velocity [27]. C. C. Lin et al. [93] developed a correlation via the theoretical analysis of liquid hold-up for a simple counter-current RPB based on one rotating disk. They modeled their work on the layers of hypothetical rotating disks, and verified their analysis with experimental pressure drop data. Considering the mean liquid film, they described the hold-up thickness as follows:
h L = δ ¯ × a w
δ ¯ = 1 R o R i R i R o δ d r
Finally, according to their experimental data, they proposed a prediction correlation to estimate the hold-up for co-current systems that used the modified Galileo number, Ga*.
In the same year, Burns et al. [92] reported that hold-up prediction for RPBs can be performed using the following equations for pore and droplet flows, respectively.
h L = 1.41 u L a c 1 2 d p o r e 1 2 [ 1 ( 1 K ) 1 2 K 1 2 ] ,   0 < K < 1
h L = 1.41 u L a c 1 2 d ¯ p o r e 1 2
They performed electrical resistance measurements to empirically determine the hold-up and residence time in RPBs with a kind of reticulated foam packing, and proposed the following general equations, which exclude the effects of gas flows on hold-up for propylene glycol and water, respectively.
h L = 0.039 ( a c a 0 ) 0.5 ( u L u 0 ) 0.6 ( ν ν 0 ) 0.22
h L = 0.034 ( a c a 0 ) 0.38 ( u L u 0 ) 0.62
where
  • a0: 100 m/s2
  • u0: 0.01 m/s
  • ν0: 1CS or 10−6 m2/s
They also highlighted that when R e δ ¯ d p o r e , an inertia flow is dominant, while when R e δ ¯ d p o r e , a viscose flow is dominant.
Later, Chen et al. [33] studied this subject, assuming that the gas and liquid took the form of plug and film flows in steel wire mesh RPBs, and derived a hold-up correlation with regression from their experimental data. They illustrated that hold-up could be determined via the initial superficial liquid and gas velocities, as well as the annular velocity.
For the accurate estimation of hold-up in RPBs, Yang et al. [83] used an X-ray CT scanner. Their analysis of the time-averaged tomographic photographs of the surface area showed that a high rotating speed improved liquid distribution in the packing. Their experimental results showed that the hold-up decreased with an increase in rotation. Finally, Yang et al. proposed the following correlation with a ±22% error by adding the Kapitza number, which included surface tension, to Basic and Dudukovic’s correlations.
h L = 12.159 R e 0.923 G a 0.61 K a 0.019   For   wire   mesh   packing
h L = 12.159 R e 0.479 G a 0.392 K a 0.033   For   nickel   foam   packing
After that, Liu et al. [109] carried out the same study, and proposed correlations with a lower error (±15%) that were similar to those of Yang et al., and which were devised for an RPB that was equipped with a mesh-pin rotor.
h L , I M Z = 5.835 R e L 0.854 G a 0.454 K a 0.037 h L , O P Z = 0.247 R e L 0.427 G a 0.239 K a 0.031
Another operating parameter in RPBs is the liquid residence time, which can be determined via liquid hold-up prediction [107]. K. Guo et al. [110] studied the residence time distribution (RTD) in an RPB with simple wire mesh screen packing. They reported that the average residence time was a function of the liquid flow rate and rotational speed, with a reverse relationship. Similarly, D. Xinlin et al. explained liquid mean residence time in a simple RPB based on a modified surface renewal model [111].

3.1.2. Flooding and Pressure Drop

Generally speaking, the flooding point is defined as the upper limit of a contactor’s operation, its permissable flow rates, as well as the liquid and gas velocities at which high rates of pressure drop and low MT efficiency occur. The flooding point in PBCs is not exactly the same as that in RPBs because of the presence of centerifugal accerelation, the orientaion of the rotors, and the flow areas in RPBs. However, the flooding point in RPBs depends on the total pressure drop, as well as gas and liquid flow rates [84,112], and it does not allow operation at high throughputs. Sivakumar [113] also argued that high gravity limits flooding in RPBs, compared to PBCs, and establishes more effective gas–liquid surface areas in the packing. RPBs have a higher flooding capacity due to their high gravity, as reported by Hendry et al. [81], who also showed how a flooding point could be determined and measured. Gas velocity and effective surface area increase as a result of an increase in acceleration, which can reduce the volume of the contactor. Greater centrifugal acceleration allows for greater flooding capacity [84,114]. Neumann et al. [114] examined knit meshes, metal foam, and two types of fixed nozzles (flat fan (FF) and full jet (FJ)), and reported that FF nozzles reduced the flooding point and that the effect of the packing type was tiny. Their experimental results indicate that the flooding point depends on gas capacity, liquid loads, rotational speeds, liquid distributor types, and packing characteristics.
A greater flooding capacity allows the use of high-volume of more porous packings. Furthermore, the flooding is locally affected, with the liquid hold-up from the inner to the outer edge decreasing and becoming thinner due to centrifugal acceleration and flow area increment. Therefore, selecting the most suitable liquid distributer can improve these aspects. Near the flooding point, a greater pressure drop and MT rate are achieved, after which the MT rate drops to a minimum and the NTU decreases when the operation reaches its flooding point [81,84,112,113,115].
There are two approaches to flooding prediction in PBCs. One method is based on generalized correlation charts for irrigated beds, known as GPDC (Generalized pressure drop correlation) charts, and the second method focuses on theoretical models for describing one or two phases in the column. With these approaches, famous correlations, such as those of Wallis and Sherwood, were established [116]. In the Sherwood approach, u G 2 a t g ε 3 ( ρ G ρ L ) 0.2 μ L 0.2 (Y axis) vs L G ( ρ G ρ L ) 0.5 (X axis) gives the flooding limitation [117], and in that of Wallis, two other parameters are used, the summation of which is one constant, as follows [118]:
C G 0.5 + m C L 0.5 = C
C G = M G ρ G A ( ρ G ρ L ρ G ) 0.5
C L = M L ρ L A ( ρ L ρ L ρ G ) 0.5
Furthermore, in 1992, Singh et al. proposed a modified Sherwood correlation in the following form, according to their RPB experimental data for a VOC removal system [119].
l o g [ u G 2 a t R i ω 2 ε 3 ( ρ G ρ L ) ( μ L μ w ) 0.2 ] = 2.27 1.14 l o g ( L G ρ G ρ L ) 0.17 [ l o g ( L G ρ G ρ L ) ] 2
They examined the hydraulic capacity of a simple counter-current RPB, and compared their experimental results with those of the Sherwood corrolation. The experimental data showed good compatibility with wire gauze packing, and they underestimated the ω for the Sumitomo packing. Kelleher and Fair [84] reported that the hydraulic capacity and area of the flows on the packing’s inner surface could be predicted via the Sherwood method by replacing g with ac for RPBs. Rao et al. [112] suggested that the term “ejection point” was a better expression than “flooding point”, which denotes the point where at the pressure drop across the rotor increases with a reduction in the angular speed, and they made use of the Sherwood approach in their investigation of an RPB by replacing g with ac. The experimental results of Wang et al.’s investigation [62] demonstrate that the hydraulic capacity is a function of vapor velocity at the eye of the rotor. Y. Li et al. [115] investigated an air–water system, and showed that the flooding point in RZBs and RPBs was that at which the pressure drop increased quickly when the superficial liquid velocity increased. They proposed a modified Sherwood correlation (17) for RZBs, without considering at and ε, as follows:
l o g [ u G , Δ r 2 R i ω 2 Δ r ( ρ G ρ L ) ] = 2.281 0.9788 l o g ( L G ρ G ρ L ) 0.1605 [ l o g ( L G ρ G ρ L ) ] 2
where Δr is the distance between the inner rotational and stationary baffles.
Lockett [120] reported that the Wallis type plot was better than the Sherwood type for correlating flooding data in RPBs, and proposed a correlation based on the Wallis correlation that Rajan et al. [121] provided. This correlation, based on their experimental data for an RSB, is as follows:
C G 0.5 + m C L 0.5 = 1.57 β 0.25 a t 0.25 ( μ L μ w ) 0.03   Lockett s   extended   form
C G 0.5 + 1.51 C L 0.5 = 130 β 0.434 a t 0.9343 ( μ L μ w ) 0.03   Rajan   et   al . s   extended   form
C G = u G ( ρ G ρ L ρ G ) 0.5
C L = u L ( ρ L ρ L ρ G ) 0.5
Another important parameter is the minimum height for an RPB without flooding, which was defined by K. Gudena et al. [122] as Equation (22):
h f = Q G 2 π R i u g
In addition, they applied Equation (23) to determine the minimum length of an RPB’s inner radii.
r i , m i n = ( Q G π u j e t ( 1 f d ) ) 1 / 2 ( ρ G ξ ρ L ) 1 / 4
where the unit of QG is m3/s.
The loss of momentum in RPBs due to fluid flow resistance across porous media causes a pressure drop in the whole packing [123], which can be computed using the various models and approaches developed by investigators. The measurement and calculation of the pressure drop in RPBs is more complicated than in PBCs. Additionally, a pressure drop in RPBs may be described as dry or wet by investigators. A dry pressure drop is determined when only gas flows across the RPB, while it is called a wet pressure drop when liquid and gas are introduced simultaneously.
In 1990, Kumar and Rao [124] proposed a correlation to evaluate the pressure drop for counter-current simple RPBs with wire mesh packing, and defined the total pressure via friction forces, centrifugal pressure drop, and increases in (rotating and translational) kinetic energy, as follows:
Δ P t = Δ P c + Δ P f + Δ P k
Singh et al. [119] evaluted RPBs with three kinds of rotor in the context of removing VOC from water, and proposed the following correlation, which only includes a pressure drop due to the rotaion and friction of fluid in the packing.
Foumeny et al. [125] investigated equilateral and non-equilateral solid cylinders as packing in a tube, and proposed an empirical correlation useful for pressure drop estimation that uses the size of particles and their relation to the bed diameter, thus resolving the deficiencies of Ergun’s correlations. In the same year, Hwai-Shen Liu et al. evaluated the dry and wet pressure drop in a simple counter-current RPB using the gas capacity factor, as well as the wetted and dry resistance coefficients, which depend on QL, QG, and the annular velocity of the packing [28]. Additionally, their experimental results showed that, due to the reduced liquid hold-up, the effects of QL were more significant in rectangular packing than in elliptical packing with different rotor speeds.
Rao et al. [112] contended that a dry pressure drop across the stationary rotors in simple RPBs can be predicted by the Ergun correlation, as follows:
d P d r ε 3 ρ g d p ( 1 ε ) m ˙ g 2 = 150 ( 1 ε ) R e p + 1.75
and according to the flow area variations, they changed it to the following form:
Δ P = ( 1 ε ) ε 3 Q g 2 π Z d p [ 150 ( 1 ε ) μ g d p l n R o R i + 1.75 Q g ρ g 2 π Z ( 1 R i 1 R o ) ]
They reported that a dry pressure drop was induced linearly with a change in the rotor’s speed, and that it initially decreased when liquid flowed in, while it remained constant when the speed was increased, which might have caused a reduction in the liquid hold-up [112]. In this experiment, the total pressure drop was defined in three segments across the RPB by Equation (24); Equation (26) was employed to determine the amount of ΔPf, and Equations (27) and (28) were used to estimate the kinetic and centrifugal pressure drop.
Δ P k = ρ g 8 ( Q g π Z ) 2 ( 1 R o 2 1 R i 2 )
Δ P c = A 2 ρ g ω 2 ( R o 2 R i 2 )
where A is a constant in the range of 0.5–2.
Chandra et al. [126] reported that gas velocity and rotor speed could increase the total pressure drop through rotors in an RSB. Wei-Der Sung and Yu-Shao Chen presented an RPB that was equipped with a blade and baffle. Their enforced modification baffle reduced the pressure drop by 53% [127]. Wang et al. [128] studied a cross-flow RPB with concentric ring packing (CRB), and suggested a correlation that could calculate the degree of pressure drop according to the gas and liquid’s superficial velocities and rotational speeds. The experimental results of this investigation show that the degree of dry pressure drop did not vary with an increase in the gas velocity. Furthermore, the rotational speed had no effect on the dry pressure drop, but the degree of wet pressure drop increased with an increase in the rotational speed.
Although Lashkarbolooki [106] reported that the major parameters impacting simple RPBs’ pressure drop rates were gas and liquid flow rates and rotor speeds, Neumann et al. [80] employed a channel model, and pointed out that the geometry of the packing was not considered in Ergun’s correlation. They showed that the centrifugal pressure drop mainly depends on the outer radii of the rotors, and the friction pressure drop depends on the geometry of the rotors and the packing characteristics when under the operation conditions of RPBs.
Several of the pressure drop correlations proposed by investigators between 2009 and 2017 are summerized in Table 3. These correlations illustrate that the total pressure drop depends on the gas capacity factor, gas and liquid flow rates, the rotational speed of the packing, and gas density.
Table 3. Summary of several pressure drop correlations published by investigators between 2009 and 2017.
RPB TypeYearKind of PackingFlows ContactingCorrelationDiv. (%)Refs.
CRB2009Concentric ringCross-current Δ P = 0.019 n 0.35 Q s , L 0.018 u g 0.95 ,
u g = 4 m ˙ g ρ g π D i 2 , Q s , L = 3600 m ˙ g π R i ρ L h c
±20[128]
Simple2009Wire meshCounter-current Δ P t = Δ P I + Δ P I I + Δ P I I I
Δ P I = ρ G Q G 2 8 π 2 Z 1 2 ( 1 R 2 2 R 1 2 ) + R 2 R 1 ρ G u θ 2 r d r
Δ P I I = ξ ρ G 2 R h ( Q G 8 π ε r Z 2 ) 2 ( 1 R 3 1 R 2 ) + ρ G Q G 2 8 π 2 Z 2 2 ε 2 ( 1 R 2 3 R 2 2 ) + R 3 R 2 ρ G u θ I I 2 r d r
Δ P I I I = ρ G Q G 2 8 π 2 Z 2 2 ( 1 R 4 2 R 2 3 ) + R 3 R 4 ρ G u θ I I I 2 r d r
±5[129]
Simple2010Plastic porous plate packing
Rippled porous plate packing
Cross-current Δ P d = 0.06920 β 0.6764 Q G 0.8203
Δ P w = 0.08486 β 0.519 Q G 0.8529 Q L 0.0945
Δ P d = 0.1515 β 0.5201 Q G 0.9117
Δ P w = 0.07956 β 0.4499 Q G 1.0387 Q L 0.0792
±10[130]
RZB2013Stationary and rotating baffleCounter-current Δ P D = 1 2 ρ G ( u G , a v g φ ) 2 f d d h ( r o r i )
Δ P w = 1 2 ρ G ( u G , a v g φ ) 2 f w d h ( r o r i )
f d = ( 1.013 × 10 7 ) R e G 4.004 + 0.001942 R e G 0.903 R e ω 1.151
f w = 0.1159 R e G 1.308 R e L 0.0384 R e ω 0.936 + 3.819 R e L 0.0331
4.02–12.38
3.20–11.32
[131]
Simple2017Wire mesh, Sumitomo, foam metalCounter-current Δ P t = A ( Q G 2 π Z ) l n ( R o R i ) + B ( Q G 2 π Z ) 2 ( 1 R i 1 R o ) + ρ g 2 ( K ω ) 2 ( R o 2 R i 2 ) + ( S 1 + S 2 ) ( u G u L ) 7.24[106]
Simple2017Knit meshes and metal foamsCounter-current Δ P t o t = A C H ρ G ω 2 2 ( R o 2 R i 2 ) + Δ P f , s t a + Δ P f , e m p t y + Δ P f , r o t o r + Δ P r o t
Δ P f , s t a t e = Ψ 0 ( 1 φ ) 1 ε ε 3 F ¯ G , i n t 2 d p ( R o R i ) K
F ¯ G , i n t = ρ G R o R i R i R o u G ( r ) d r = Q G 2 π Z ( R o R i ) l n ( R o R i ) ρ G
Ψ 0 = 725.6 R e ¯ G , i n t 3.203 ,
R e ¯ G , i n t = d p ( 1 ε ) ν G F ¯ G , i n t ρ G
±15[80]

3.2. Mass Transfer and Performance Modeling

3.2.1. Mass Transfer Coefficients and Removal Efficiency

The mass transfer of soluble components depends on fluid motion in the field. The MT coefficient is a function of the fluid properties and flow rate, and will vary if these parameters cause any variations in the flow direction [132]. The MT rate can be affected by several parameters, such as the packing type, the absorbent physicochemical’s properties and concentration, the absorbing component’s partial pressure, gas flow rate, liquid flow rate, liquid temperature, and the loading of the components in the absorbents in PBCs [133]. The gas velocity and flow area change radially in RPBs; therefore, MT coefficients change from point to point in the contactor [134], but there is no general theory in this case, and the prediction of MT coefficients in RPBs is theoretically complicated [30]. The MT correlations developed by researchers for RPBs are theoretical or empirical correlations, and some of them replace the term “g” with “2” so as to use the conventional PBC correlations. For instance, H. H. Tung and R. S.H. Mah developed a theoretical equation for penetration theory, and showed that it could be made applicable for HiGee processes by replacing “g” with “2” [135].
k L d p D L = 2 × 3 0.33 π S c L 0.5 R e L 0.33 ( a t a e ) 0.33 ( d p 3 ρ L 2 g μ L 2 ) 0.167
Kang et al. [136] examined a CO2MEA system in an RPB by employing the two-film theory for mass transfer determination. Similarly, Joel et al. [137] worked on a CO2MEA system in 2015, and employed previous researchers’ correlations for PBCs. Both of these replaced “g” with “2” to use the correlations for RPBs. However, E. Oko et al. [138] demonstrated that estimating the gas–liquid effective interfacial area with the above method led to a noticeable error of around 50%.
The mathematical modeling of packed beds requires a system derived from heat, mass, and momentum conservation [139]. Reddy et al. [134] employed Equations (30) and (31) in the context of mass and energy balance to predict the overall gas volumetric MT coefficient, kGa, in SO2–NaOH systems, and the overall liquid volumetric MT coefficient, kLa, when stripping oxygen from water for an RSB, as:
k G a = Q G π ( R o 2 R i 2 ) Z l n C G , i C G , o
k L a = Q L π ( R o 2 R i 2 ) Z l n C L , i C L , o
Yu et al. [140] applied Equation (30) in a simple RPB to predict kGa and Equation (32) to calculate HTU in CO2 removal with a mixture of PZ-DEG.
H T U = R o R i l n ( Y i Y o )
According to this approach, Yu et al. [141] assumed an RPB in the form of several stirred tanks in series-mode and used a mole balance. Chu et al. [142] worked on SO2–Na2SO3 systems, and similarly, Liangliang et al. [143] worked on SO2 capturing with a calcium-based solution. Zhan et al. [144] studied the simultaneous absorption of H2S and CO2 into an MDEA-PZ solution in a simple RPB, and employed theoretical Equation (30).
Additionally, empirical and statistical correlations have been developed by investigators to enhance the accuracy and to identify more effective parameters. Munjal et al. [30] devised the following equations based on laminar liquid film flow to predict the liquid MT coefficient:
k L = 2.6 ( Q L Δ x ) S c L 1 2 R e L 2 3 G r a v 1 6
where Δ X = d p 2 is employed with higher liquid Reynolds numbers and Δ X = d p with lower ones.
Liu et al. [28] and Chen and Liu [145] evaluated MT coefficients experimentally with gas and liquid Reynolds and Grashoff numbers, gas diffusivity, total packing surface area, and effective packing surface area.
Lin et al. [146] examined CO2 absorption with NaOH, MEA, AMP, and MEA-AMP solutions in a simple RPB, reported the separation efficiency, and argued that KGa was a function of the rotational speed, absorbent concentration, CO2 concentration, and gas and liquid flow rates. Chen et al. studied the effects of RPB geometry using different radius values of packing, and estimated the kLa according to their experimental results for the Sc, Re, Gr, and We numbers of liquid flow and packing characteristics [147]. Additionally, they reported that MT decreased with an increase in the outer radius of the packing at low rotational speeds, and that this decrease was small at high rotational speeds. Similarly, Chen et al. [148] evaluated MT for various types of structured and random packing (beads, Rashing rings, Intalox Saddles and wire meshes) at greater detail, considering packing characteristics such as the size, material shape, surface property, and fluid surface tension.
Yi et al. [94] worked on carbon dioxide capturing with a DEA-promoted hot potassium carbonate solution in a simple RPB, and demonstrated that the KGa in the end-effect zone was higher than in the bulk zone of the packing. They employed Onda et al.’s correlation (34) for PBCs.
k G R T a t D G = 2 × R e G 0.7 S c G 0.33 ( a t d p ) 2.0
Equation (34) shows the co-rotation and counter-rotation modes and describes the volumetric liquid MT coefficient using liquid Reynolds, Froude, and Schmidt numbers, liquid diffusivity, total packing surface area, and equivalent diameter. A higher kLa was achieved using counter-rotation. Moreover, the liquid and gas’ superficial velocities and centrifugal acceleration were changed radially in RPBs, and the Re, Fr, and We numbers were functions of the liquid’s superficial velocity. In addition, the Fr and We changed with the centrifugal acceleration and packing surface area, respectively.
Lin and Chu [60] worked on a CO2–NaOH system in a blade-type RPB, and their experimental data indicate that the carbon dioxide removal efficiency increased with the rotational speed, solvent flow rate, and concentration. Chen et al. [149] studied CO2–NaOH and O2 desorption from water in an RPB with two kinds of packing (plain-woven packing and knit-woven packing), and reported that RPBs with dense wire meshes would show reduced kL and surface renewal due to their high resistance against flows. Their experimental results indicate that the ae would be higher with stainless steel than with PTFE. They established a correlation by considering the shape parameter φ in addition to the Reynolds, Froude and Weber numbers, the surface property, the fluid surface tension, the gas diffusivity, and the equivalent diameter of the packing.
Recently, Chen et al. [150] worked on simultaneous NOx–SO2–CO2 removal in a simple RPB, and proposed correlations based on the two-film theory, using the total surface area, gas diffusivity, equivalent diameter of packing, and the Reynolds, Froude, and Grashof numbers to estimate the gaseous volumetric MT coefficients, which increase with Fr reduction and increase with Re and Gr.
Another approach to MT prediction was proposed by Luo et al. [151], who contended that MT could be evaluated by dividing an RPB into three sections, namely, the bulk (packing), the cavity, and the end zone. This approach was proposed in Guo’s dissertation, in which he argued that the liquid volumetric MT coefficients were highest in the end-effect zone, second highest in the bulk zone, and lowest in the cavity zone, but in industrial applications, the evaluation of MT in the bulk zone is more important than that in the other zones. It is assumed that the MT in the end-effect zone was related to the intense contact between the liquid elements and the packing, the strong interaction between gas and liquid, and the fast outlet of fresh liquid from the liquid distributor.
Yang et al. [152] reported that the MT in the cavity zone was 13–25% of the overall MT in the whole RPB. The experimental results of Guo et al.’s investigation [153] illustrate that the effective interfacial gas–liquid surface area in the cavity zone was approximately 30% of that of the whole RPB, and the residual value in the bulk zone was 70%. Sang et al. [25] investigated this issue in detail with a high-speed camera in a NaOH–CO2 system, and analyzed the MT interfacial area in the cavity zone by considering the liquid elements as mother and daughter droplets and a liquid film. In the same year, the experimental result of Luo et al.’s investigation [154] demonstrated that the MT effective interfacial area in the cavity zone was about 9% of the whole interfacial area in their RPB.
In conclusion, correlations may be found via statistical regression analysis and dimensional analysis. A summary of the correlations developed by investigators in 2002–2019 to predict MT coefficients is given in Table 4. This table indicates that KG, KL, kG, and kL are functions of dimensionless numbers, which are expressed in terms of factors and variables depending on the system’s behavior, as follows:
K G = g ( R e G ,   F r G , R e L , W e L , F r L , G a , N , p H , C s o l v e n t )
k G a = h ( R e G , R e L ,   G r G ,   S c G , ( a t D G d p ) , G a , W e )
k L a = I ( R e L ,   G r L ,   S c L , ( a t D G d p ) , F r L , W e L ,   R e G , G r G ,   S c G )
Additionally, as the table clearly shows, researchers have described the geometry of the system, the fluid’s viscosity, and the effects of external forces such as the turbulence of the fluid flow (resulting from the packing and RPB geometry), the liquid surface tension, and the effect of rotational speed (using the Re, We and Gr numbers, respectively), to evaluate the performance of the contactor and determine the volumetric MT coefficient. Furthermore, it is possible to scale up this correlation and achieve dynamic similarity by adding the Fr number. Further details are provided in Section 4.
Table 4. MT correlations proposed by various investigators for RPBs in 2002–2019.
Type of RPBAbsorbentAbsorbing ComponentMT CorrelationsDiv.%YearRefs.
CCSR---O2 desorption k L a d p D L a t = 0.478 R e L 0.906 G r L 0.275 ±102002[155]
CCSRWaterVOC k G a H e 0.27 D G a t 2 = 0.077 R e G 0.323 R e L 0.328 G r G 0.18 ±302002[145]
CCSRWaterVOC k G a H e 0.315 D G a t 2 = 0.061 R e G 0.712 R e L 0.507 G r G 0.326 ±302004[156]
CCSR---O2 desorption k L a d p D L a t = 0.9 S c L 0.5 R e L 0.24 G r L 0.29 W e L 0.29 ±302005[157]
CCSR---O2 desorption k L a d p D L a t ( 1 0.93 V P a c k i n g V R P B 1.13 V i V t ) = 0.65 S c L 0.5 R e L 0.17 G r L 0.3 W e L 0.3 ±302005[147]
RSBNaOHSO2For co-rotation:
k G a = ( 7.62 × 10 3 ) R e G 0.832 G r G 0.194 S c G 1 / 3 ( a t D G d p )
k L a = 0.152 R e L 0.569 G r L 0.140 S c L 1 / 2 ( a t D L d p )
For counter-rotation
k G a = ( 7.62 × 10 3 ) R e G 0.976 G r G 0.132 S c G 1 / 3 ( a t D G d p )
k L a = 0.152 R e L 0.48 G r L 0.128 S c L 1 / 2 ( a t D L d p )
±202006[134]
BladeWaterIPA K G a d p D G a t = 0.027 R e G 0.679 R e L 0.245 G r G 0.14 ±102007[155]
CRCSRNaOHCO2 K L a = 0.003689 R e G 0.5449 W e L 0.5476 G a 0.3428 Plastic porous plate
K L a = 0.003968 R e G 0.1399 W e L 0.4336 G a 0.2724 Steal rippled porous plate
±102010[130]
CCSRWaterAmmonia and VOC k G a D G a t 2 ( 1 0.9 V P a c k i n g V R P B ) = 0.023 R e G 1.13 R e L 0.14 G r G 0.31 W e L 0.07 ( a t a p ´ ) 1.4 ±302011[158]
COCSRNH3 based sol.SO2 K G a = 0.08 Q G 0.01 Q L 0.56 N 0.36 p H 0.57 C t 0.76 C S O 2 0.09 ±82014[39]
CCSRA.SSO2 K G a = 2.6 × 10 4 R e G 0.60 F r G 0.34 G a 0.47 SiC structured packing
K G a = 2.7 × 10 5 R e G 0.77 F r G 0.21 G a 0.26 Plastic structured packing
±5
±10
2015[159]
CRCSRNaOHCO2 k L a = 1.8221 ( a t D L d p ) R e L 0.6371 G r L 0.0548 S c L 0.0623 ±102015[160]
CCSRTEGH2O K G a d 2 D G ρ G = 0.1697 ( Y w 1 W T E G ) 0.231 ( Q G Q L ) 0.236 S c G 0.333 R e G 1.614 λ 0.125 ±202018[161]
CCSRNaOHSO2 K G a d D G a s = 0.456 R e L 0.59 R e G 0.63 W e L 0.07 F r L 0.06 ( σ σ c ) 0.1 ±202018[162]
CCSRNa2SO3SO2 K G a = 2.76 × 10 5 Q G 0.22 Q L 0.43 N 0.55 p H 2.27 C S o l v e n t 0.1 ±152018[142]
COCSRNaClOVOC K G a = 8.5173 ( Q L Q G ) 1.2357 ω 0.2783 t 1.2783 p H 0.2351 C N a C l O 0.0346 ±302018[163]
CCSRMEACO2 k G = 2 a t D G R e G 0.7 S c G 1 2 ( a t d p ) 2 Bulk and end-effect zone
k G = D G d ( 2 + 0.552 R e G 0.5 S c G 0.5 ) Cavity zone
±202019[97]
A.S: ammonia-based solution; PWP: Plain-woven packing; KWP: knit-woven packing; CCSR: counter-current simple RPB; COCSR: co-current simple RPB; CRCSR: cross-current simple RPB.

3.2.2. Effective Interfacial Surface Area and Performance

The effective gas–liquid interfacial surface area of a contactor is central to absorption systems and depends on system characteristics [152]. The effective surface area in bubble absorbers is equivalent to the wet and total contacting surface areas, while, in PBCs, the effective surface area of the packing may be smaller than the wetted surface area in small packings with very high loadings [164]. The effective interfacial surface area in contactors is highly dependent on hydrodynamics [165]—with highly turbulent flows and super-high gravity, a thinner liquid film and finer droplets are produced, which enhances the gas–liquid surface area and MT. This was demonstrated through Liu et al.’s experimental results regarding the absorption of ozone into water in counter-current RPBs [166], and through the results of Liangliang et al.’s investigation [143] of the absorption of SO2 in RPBs with plastic and metal packings. Therefore, effective liquid distribution can be considered as essential to achieving a higher value of MT.
The method for the determination of effective gas–liquid interfacial surface area is shown in Figure 5. Due to the lack of physical methods and their complexity when employed in RPBs to predict the value of ae, chemical methods have often been applied by investigators, using the known kinetics of the reaction along with absorption theory. Examples of this include Munjal et al.’s investigation [31] with simple RPBs, Yang et al.’s study [152] of a simple RPB with various radii of packing, and Rajan et al.’s experiments [121] on RSBs. All of these researchers used NaOH–CO2–N2 systems in RPBs with a pseudo first-order reaction, and applied the Danckwerts model and Henry’s law to define the absorption flux and total gas–liquid interfacial area; they then determined the effective interfacial surface area by dividing the result by the overall volume of the packing. Similarly, Luo et al. [151,167] used this method in an RPB with simple wire mesh and blade packing, and defined the pseudo first-order reaction as follows:
R CO 2 = k L a e C CO 2 , L 1 + D CO 2 k 2 C NaOH , L k L 2 = k L a e C CO 2 , L 1 + M
When M 1 , then
a e = R CO 2 C CO 2 , L D CO 2 k 2 C NaOH , L
In the same situation, Dong et al. [160] applied the following equation for a simple cross-flow RPB.
a e = R CO 2 H CO 2 p CO 2 , L D CO 2 k 1
Similarly, Tsai and Chen used a chemical method with a NaOH–CO2 system in their RPB, which was equipped with blades and baffles, and proposed the following relationship for the CO2 absorption flux (mol/m2·s) [29]:
N CO 2 = D CO 2 k 1 a C CO 2 * π ( R o 2 R i 2 ) Z
wherein the rate constant of the pseudo first-order reaction is k1.
Generally, in PBCs, it is assumed that the gas–liquid interfacial area is the same as the wetted surface area of the packing. In 1968, Ondea et al. [168] proposed an empirical correlation with a discripancy of ±20% to express the ratio of the effective interfacial area in the following form (basing this assumption on their experimental data for PBCs with four packing types):
a e a t = 1 e x p [ 1.45 ( σ c σ ) 0.75 R e 0.1 F r 0.05 W e 0.2 ]
Similarly, Puranik and Vogelpohl [169] published the following emperical corrolation with a ±20% error:
a e a t = 1.045 R e 0.041 W e 0.133 ( σ σ c ) 0.182
In high-gravity and -turbulance situations, the liquid layers are thinner and the droplets are finer, which gives rise to a wider contacting surface area and an intensified MT rate [143,166]. Lin et al. [93] developed the following correlation for an RPB with a maximum error of ±20%:
a w a t = 584 R e L 1.03 W e L 0.576 F r L 0.23
Luo et al. [167] examined the effective interfacial surface area in an RPB with stainless steel wire mesh packing, and obtained an empirical correlation in a CO2–NaOH system similar to that in Equation (44), with the addition of the shape factor to increase the accuracy of the system.
Xie et al. [170] proposed a correlation via the regression of 31 sets of CFD simulation data for RPBs with real 3D packings, with an error value of ±20%, as follows:
a e = 202.3485 ( a c 205.6 ) 0.0435 ( u L 0.0106 ) 0.4275 ( ν L 3.35 ) 0.1200 ( γ 75 ) 0.5856
Yan-Zhen Lu et al. [171] used surface-modified stainless steel wire mesh (SSM) and non-surface modified stainless steel wire mesh (NSM) in a simple counter-current RPB with an NaOH–CO2 system, and their experimental results demonstrate that suitable liquid dispersion increased the ae.
Other empirical correlations for gas–liquid interfacial surface areas developed by other researchers are shown in Table 5.
Table 5. Empirical correlations proposed by investigators for the prediction of effective surface areas.
AuthorYearRPB typePackingSystemCorrelationDiv. %
Rajan et al. [121]2011RSBMFNaOH-CO2 ( a e a t ) = 54999 R e L 2.2186 F r L 0.1748 W e L 1.316 : for co-rotation
( a e a t ) = 11906 R e L 1.8070 F r L 0.0601 W e L 0.9896 : for counter-rotation
±15
Dong et al. [160]2015SimpleSSWM a e a t = 2980.9 R e L 0.2349 F r L 0.045 W r L 0.5023 φ 0.5 ±10
Chen et al. [149]2016SimplePTFE WM a a t = 11.057 R e L 0.359 W e 0.448 F r 0.224 φ 0.202 ( σ σ c ) 1.099 : for PWP
a a t = 21.558 R e L 0.283 W e 0.317 F r 0.218 φ 0.748 ( σ σ c ) 1.099 : for KWP
±20
Luo et al. [154]2017CCSRSSWM a e a t = 15.17 R e G 0.16 R e L 0.38 F r L 0.13 W r L 0.45 φ 0.29 ±15
Xie et al. [170]2019SimpleExpanded SS meshMEA a e a t = 202.3485 ( a c 205.6 ) 0.0435 ( u 0 0.0106 ) 0.4275 ( υ 3.35 ) 0.12 ( γ 75 ) 0.29 ±20
KWP: knit-woven packing; MF: metal foam; PWP: plain-woven packing; PTFE: polytetrafluoroethylene; SS: stainless steel; WM: wire mesh.
Additionally, three methods are available to evaluate the MT performance of a PBC, namely, evaluating the height of a transfer unit (HTU), evaluating the height equivalent to a theoretical plate (HETP), and evaluating the overall gas phase transfer unit. The main difference between a PBC and a HigGee is the height of the transfer unit (HTU) [84,165]. S. P. Singh et al. proposed Equation (46) to predict the area of the transfer unit (ATU) in counter-current simple RPBs [118].
A T U = ( 3.4 × 10 4 a t 2 ) ( Q L μ L a t ) 0.6 ( ρ L 2 g μ L 2 a t 3 ) 0.15
T. Kellehr and J. R. Fair [84] reported that the value of NTU could be increased by raising the rotaional speed, and that a higher-pressure operation requires a higher NTU. It has also been argued that the MT performance may be measured via the size of the packing (Ro-Ri) and the NTU, which reveal the separation efficiency of a simple counter-current RPB. Gue et al. reported that the HTU could be defined as follows for a simple RPB [27]:
H T U = Q L π K L a ( R i 2 R o 2 )
where KLa is the liquid phase volumetric MT coefficent (mol/m3·s), and QL is the liquid flow rate (m3/m2s).
C. C. Lin et al. [146] studied CO2 absorption with NaOH, MEA, and AMP, and showed that another important parameter was the NTU, which could be evaluated by considering the mole fraction of CO2 in the gas streams of the inlet and the outlet of an RPB. They suggested the following equation:
N T U = Y o Y i 1 Y Y * d Y
where they assumed that Y * equals zero due to the fast reaction of CO2 with the absorbing aqueous solution, and they proposed the following MT coefficient:
K G a = Q G ( N T U G ) h π ( R o 2 R i 2 ) = Q G h π ( R o 2 R i 2 ) l n ( Y i Y o )
D. P. Rao et al.’s investigation showed that the reduction in HTU in their simple RPBs was 5–10 times greater than that in conventional columns, and reported that the HTU did not change with angular velocity when MT-resistant control was enforced on the gas [113].
Additionally, G. Q. Wang et al. employed Equation (50) for the determination of HETP values in an RZB contactor [62]:
H E T P = d o d i N T
In 2009, Hsu-Hsiang Cheng and Chung-Sung Tan [37] applied Equation (51) to determine the HTU for CO2 removal with blended alkanolamines as part of their evaluation of centrifugal acceleration and a fast reaction in a simple counter-current RPB equipped with stainless wire mesh packing.
H T U = R o R i l n ( C i , CO 2 C o , CO 2 )
C. H. Yu et al. examined CO2 removal systems with aqueous and non-aqueous absorbents in a simple counter-current RPB, and showed that HTU would be reduced when the rotating speed increased, and would increase with the gas flow rate [140]. Sheng et al. defined the HTU via the NTU in a simple counter-current RPB using Equation (52) [172]:
H T U = R o R i N T U

3.3. Numerical Methods

The numerical methods for analyzing RPBs are generally divided into two groups: chemistry-based (chemisorption) and CFD-based [72]. The chemistry-based methods are related to reaction kinetics and the above-mentioned correlations for mass transfer, while the other type is based on CFD models, which are described below.
CFD is an interdisciplinary topic that can be used to simulate flow characteristics and transport phenomena under certain conditions, and which includes mathematics, hydrodynamics, the computation of the conservation of mass, heat and momentum equations, and a discretizing method [173]. The velocity field in RPBs must be studied in order to determine heat and MT mechanisms, but the conditions in RPBs are complicated, turbulent, swirling and anisotropic [89], and CFD is a good tool in such situations. To improve the RPB’s efficiency and flow, numerous researchers have focused on the CFD as related to hydrodynamic parameters, which include pressure drop and flow analysis. CFD modeling includes geometry definition, a meshing method, and models (multiphase, turbulence, and moving reference frame), as shown in Figure 2. Sometimes CFD modeling requires user-defined functions (UDF) for explaining reactions or MT. As for geometry generation, one of the following methods may be employed [173]:
  • Obstacle simplification (use of a simple geometry model or a representative elementary unit (REU), as used in [170];
  • Porous areas (use of mathematical methods that include viscosity and inertia resistance, which appear as a source term in momentum equations), which are suitable for RPB simulation on pilot and industrial scales;
  • Innovative models, such as Lu et al.’s [174], in which porous media are described based on the Kolodziej model, and that contained in another of Liu et al.’s investigations, wherein a physical model was defined via computed tomography (CT) reconstruction [175].
Yu-Cheng Yang et al. [173] reviewed the trends in CFD methods used to characterize an RPB, and concluded that obstacle simplification was a good approach for determining the liquid behavior, but it was not suitable for the 3D, pilot, or industrial scales, whereat porous media could be used.
One of the most important stages in RPB simulation is multiphase model selection. There are two major methods available for this goal: Euler–Lagrange and Euler–Euler, the second of which is widely used, and includes the volume of fluid (VOF), mixed, and Eulerian models [173]. The VOF model is not suitable for two- or three-dimensional (2D or 3D) pilot studies, while the Eulerian model, when used along with porous media models, is a good alternative, although it has been less commonly applied by investigators than the VOF model [66]. As regards the rotation of RPBs, it is necessary to define this situation with the multiple reference frame (MRF) or sliding mesh (SM) model [173]. H. Llerena-Chavez and F. Larachi applied the 3D physical unsteady-state model to simulate the air flow in a simple RPB, and applied porous media to define the packing. They validated the developed model with the experimental results of three RPBs [129]. Similarly, Wenjing Yang et al. [176] simulated the fluid flow in RPBs by applying 2D and 3D models to analyze the velocity profile in the bed. It was demonstrated that the effect of the packing rotation on the flow pattern was lower at a low inlet velocity. Martinez et al. [177] simulated multiphase flow behavior in a 3D model, which consisted of a water–sulfur dioxide system, and investigated the effect of the rotor speed on the flow pattern in an RPB. They considered the porous media in packed beds, which must be added as a momentum source term into standard fluid flow equations, and derived the same results for the gas inlet situation.
There is no general turbulent model for the simulation of RPBs. There are various models, which are categorized into the following two major approaches [173]:
  • Eddy viscosity models;
  • Reynolds stress transport models (RSM).
The RSM has a greater ability to give accurate predictions of complex flows, while five and seven additional equations, respectively, are required for 2D and 3D flows, which implies an increase in the calculation time and computational memory [173]. As such, the second group of models requires more time and computational memory, and is less attractive for researchers. Xin Shi et al. further developed this subject by studying the liquid droplet size and effect, size distribution, hold-up, and the effect of modifying the intensification of MT. They applied a 2D VOF model, a sliding mesh model, and an RSM in fluent solvers to simulate the velocity and liquid volume distribution, and concluded that the VOF model was suitable for defining the gas–liquid interface in RPBs [178]. A two-phase flow in an RPB was simulated with a 2D model, and the RNG k-ε and large discrete phase model (DPM) were selected by Cheng et al. as turbulence models for the continuous gas phase and liquid size distribution analyses, respectively [179]. They implemented a moving reference frame (MRF) of the packing area for the rotational section, and considered the following methods to compute the droplets’ breakup:
  • Taylor analogy breakup (TAB) for We < 100;
  • Wave model for We > 100.
They reported that the value of the Weber number of the droplets increased in a radial direction, and that increasing the gas flow rate and rotor speed would increase the merging or breaking up of droplets in the packing. Yongli Sun et al. [180] simulated an RZB using a 3D model to analyze the pressure distribution and the optimal sizing of the packing. Yucheng Yang et al. studied the MT phenomena in a simple RPB. They developed a UDF solver in the Fluent software and adopted VOF and RSM models to simulate the multiphase flows in three different rotors [181]. Similarly, in the same year, Xue-Ying Gao et al. [182] worked on MT characterization for a simple RPB with a CO2–NaOH system, using numerical simulation. They proposed a mathematical model that incorporated diffusion and reaction. Yi Liu et al. [183] developed a 3D physical model that used realizable k-ε, applied MRF models to simulate a simple RPB in a steady-state mode, and evaluated the air flow inside the packing and the pressure profile at various rotational speeds and gas flow rates. Additionally, Li et al. [89] employed an air–water system and studied the flow field in a perforated-ring RPB with a 2D obstacle physical model, using the RSM turbulence model. They defined air as the first phase and water as the second phase in a VOF model. They also used a PIV visualization method and compared the results, which indicated a suitable accuracy.
Finally, several approaches to CFD investigation for the characterization of RPBs, published in 2010–2020, are summarized in Table 6. According to this table, it is clear that the obstacle, VOF and realizable models were more attractive to, and more widely applied by, researchers.
Table 6. Models recently applied by various investigators for CFD analysis.
Physical ModelDimensionsMultiphase ModelTurbulence ModelSolving ApproachScopePublished YearRefs.
Obstacle2D and 3DSingle phaseRealizable k-ε---Pressure field and gas flow characteristics analysis2010[176]
Porous3D---Standard k-ε---Pressure field and hydrodynamic analysis2012[177]
Obstacle2DSingle phaseStandard k-εSIMPLEHydrodynamic analysis2013[184]
Obstacle2DVOFRSMSIMPLEHydrodynamic analysis2013[178]
Porous3DEulerStandard k-ε---Hydrodynamic analysis2013[185]
Obstacle2DDPMRNG k-εSIMPLEMixing and droplet size analysis2014[179]
Obstacle3DVOFRNG k-εPISO/ PRESTOHydrodynamic and MT analysis2014[180]
Obstacle2DVOFRSMSIMPLEMicro-mixing efficiency analysis2016[186]
Obstacle2DVOF---PISO/ PRESTOHydrodynamic and MT analysis2017[187]
Real3DSingle phaseRealizable k-ε---Pressure drop and gas flow characteristics analysis2017[183]
Obstacle2DVOFSST k-ωPISO/ PRESTOHydrodynamic analysis2017[188]
Obstacle2D & 3DVOFRealizable k-ε, RSM, k-ωSIMPLEHydrodynamic and droplet size analysis2017[189]
Obstacle2DVOFRealizable k-εSIMPLE/PRESTOMicro-mixing efficiency analysis2018[190]
Porous2D and 3DSingle phaseRealizable k-εSIMPLEGas flow characteristics analysis2018[191]
Obstacle2DVOFStandard k-εSIMPLEHydrodynamic analysis2018[192]
Obstacle3DSingle phaseStandard k-εSIMPLE/PRESTODroplet behaviors2019[193]
Obstacle2DVOFRealizable k-εPISOHydrodynamic analysis2019[194]
Obstacle2DVOFRealizable k-εSIMPLE/PRESTOMicro-mixing efficiency analysis2019[195]
Obstacle2DVOFRealizable k-εSIMPLE/PRESTOHydrodynamic analysis2019[66]
Obstacle2DVOFRSMPISO/ PRESTOMT analysis2016[181]
Real2DVOF, EulerRSM, LES---Hydrodynamic and liquid behavior analysis2019[196]
REU3DVOFSST k-ωPISOHydrodynamic analysis2019[170]
Obstacle3DVOFSST k-ωSIMPLEHydrodynamic and liquid behavior analysis2019[197]
Real3DSingle phaseRealizable k-εSIMPLE C/PRESTOGas flow characteristics analysis2020[198]
DPM: Lagrange discrete phase mode.

4. Dimensional Analysis

There are several approaches to scaling up in addition to dimensional analysis (DA). For instance, G. Jan Harmsen [199] divided the scale-up process in a pilot plant into the following categories, and recommended the following classifications for PI:
  • Brute force;
  • Rate model.
The DA method was used in this section due to the lack of data on scale-up methods for RPBs analysis. Several important parameters are required for the scaling up of RPBs, such as MT parameters, hydrodynamic information, etc., which can be found via several means, such as fundamental investigations or CFD analysis, as discussed in previous sections. DA can help to create more accurate and unique design parameters. In agitation contactors, the power requirement per unit volume and the mixing quality or fluid behavior are the scale-up criteria [200,201]. The same is true of an RPB, but the geometry and configuration of the rotor are different here; therefore, it is clear that the high-gravity factor should be a dimensionless number that may be used in gravity field analysis (as defined by Equation (53)), as employed by Jiao et al. [130] to study the gas pressure drop and MT in CO2–NaOH system. This study demonstrated that this parameter linearly increased with the radii of the rotor at a constant rate.
λ = ω 2 r g
Youzhi Liu et al. [69] examined the effects of this dimensionless parameter in a special RPB and an RSB, and showed that KGa, a and ky were augmented when λ increased. This dimensionless number enhanced the contacting situation, with finer droplets and increased MT when its value was increased, as Gui and Li [202] pointed out. S. B. Cao et al. [161] reported that a high λ value caused a change in the liquid flow pattern in the packing, from liquid film to droplets and small filaments, as follows:
  • liquid films λ < 60 g;
  • liquid droplets and small filaments λ > 100 g.
Additionally, their experimental results indicate that an increase in λ could reduce the HTU and increase KGa significantly.
It is worth noting that a correlation that considers Re, Sc and Sh only could not be suitable for MT coefficient prediction, because packing geometry is not included [203]. In light of this, Rajan et al. [121] reported that the Reynolds, Froude, and Weber numbers are the other important dimensionless numbers for determining the functions of uL,s, and they could change with the radios of the RPB and ug. Furthermore, ac and at can affect the Froude and Weber numbers, respectively. Xu et al. [179] reported hydrodynamic similarity as another criterion required for effective scaling up. The Weber number reflects the droplets’ break-up status inside the packing, and is defined as the ratio of the inertial force to the surface tension; its value increases as the rotor speed increases. Moreover, B. Zhao et al. [75] developed a model that uses dimension analysis, and defined three issues that could influence the RPB’s performance, namely, gas–liquid properties, operation conditions, and geometrical dimensions.
In light of all of the above, we have clarified the parameters that could affect performance—applying the Buckingham π theory to do so—and outlined the five independent dimensionless numbers of ReG, ReL, ScG, ScL, Mr, and Sh as dependent dimensionless numbers. Hence, the following correlation was proposed:
S h = 3.788 × 10 6 R e G 0.1404 R e L 0.3684 S c L 1.2280 G r G 0.0337 M r 0.4286
where Sh indicates the effective convective MT, and the exponent values of the Gr and Re numbers indicate the degree of turbulence [204].
Regarding the geometrical dimensions, it must be noted that the geometry of an RPB can influence the Re, Gr and Sc via changes in the average radial gas velocity and MT coefficients [205].
The Hatta number (Ha) is another important dimensionless number in RPBs incorporating a reaction system. This number is useful in comparing the reaction rate in the liquid film with the diffusion rate. For instance, S. Munjal et al. described this number for CO2 absorption with NaOH solution, using a pseudo first-order reaction. The value of this dimensionless number exceeds 1 for fast reaction rates, while a value of lower than 1 indicates that physical absorption overcomes the kinetic reaction.
Gas treatment capacity, τ, is another variable to consider when characterizing the parameters of RPBs, as highlighted by Sheng et al. [172]. This factor can be used to scale up and determine the processing capacity, which is described by Equation (55).
τ = Q G V b × 10 6
Additionally, as Neumann et al. [4,114] showed in 2017 and 2018, two considerable factors, maximum and integrated gas capacity and maximum and integrated liquid load, could be applied for benchmarking RPBs.

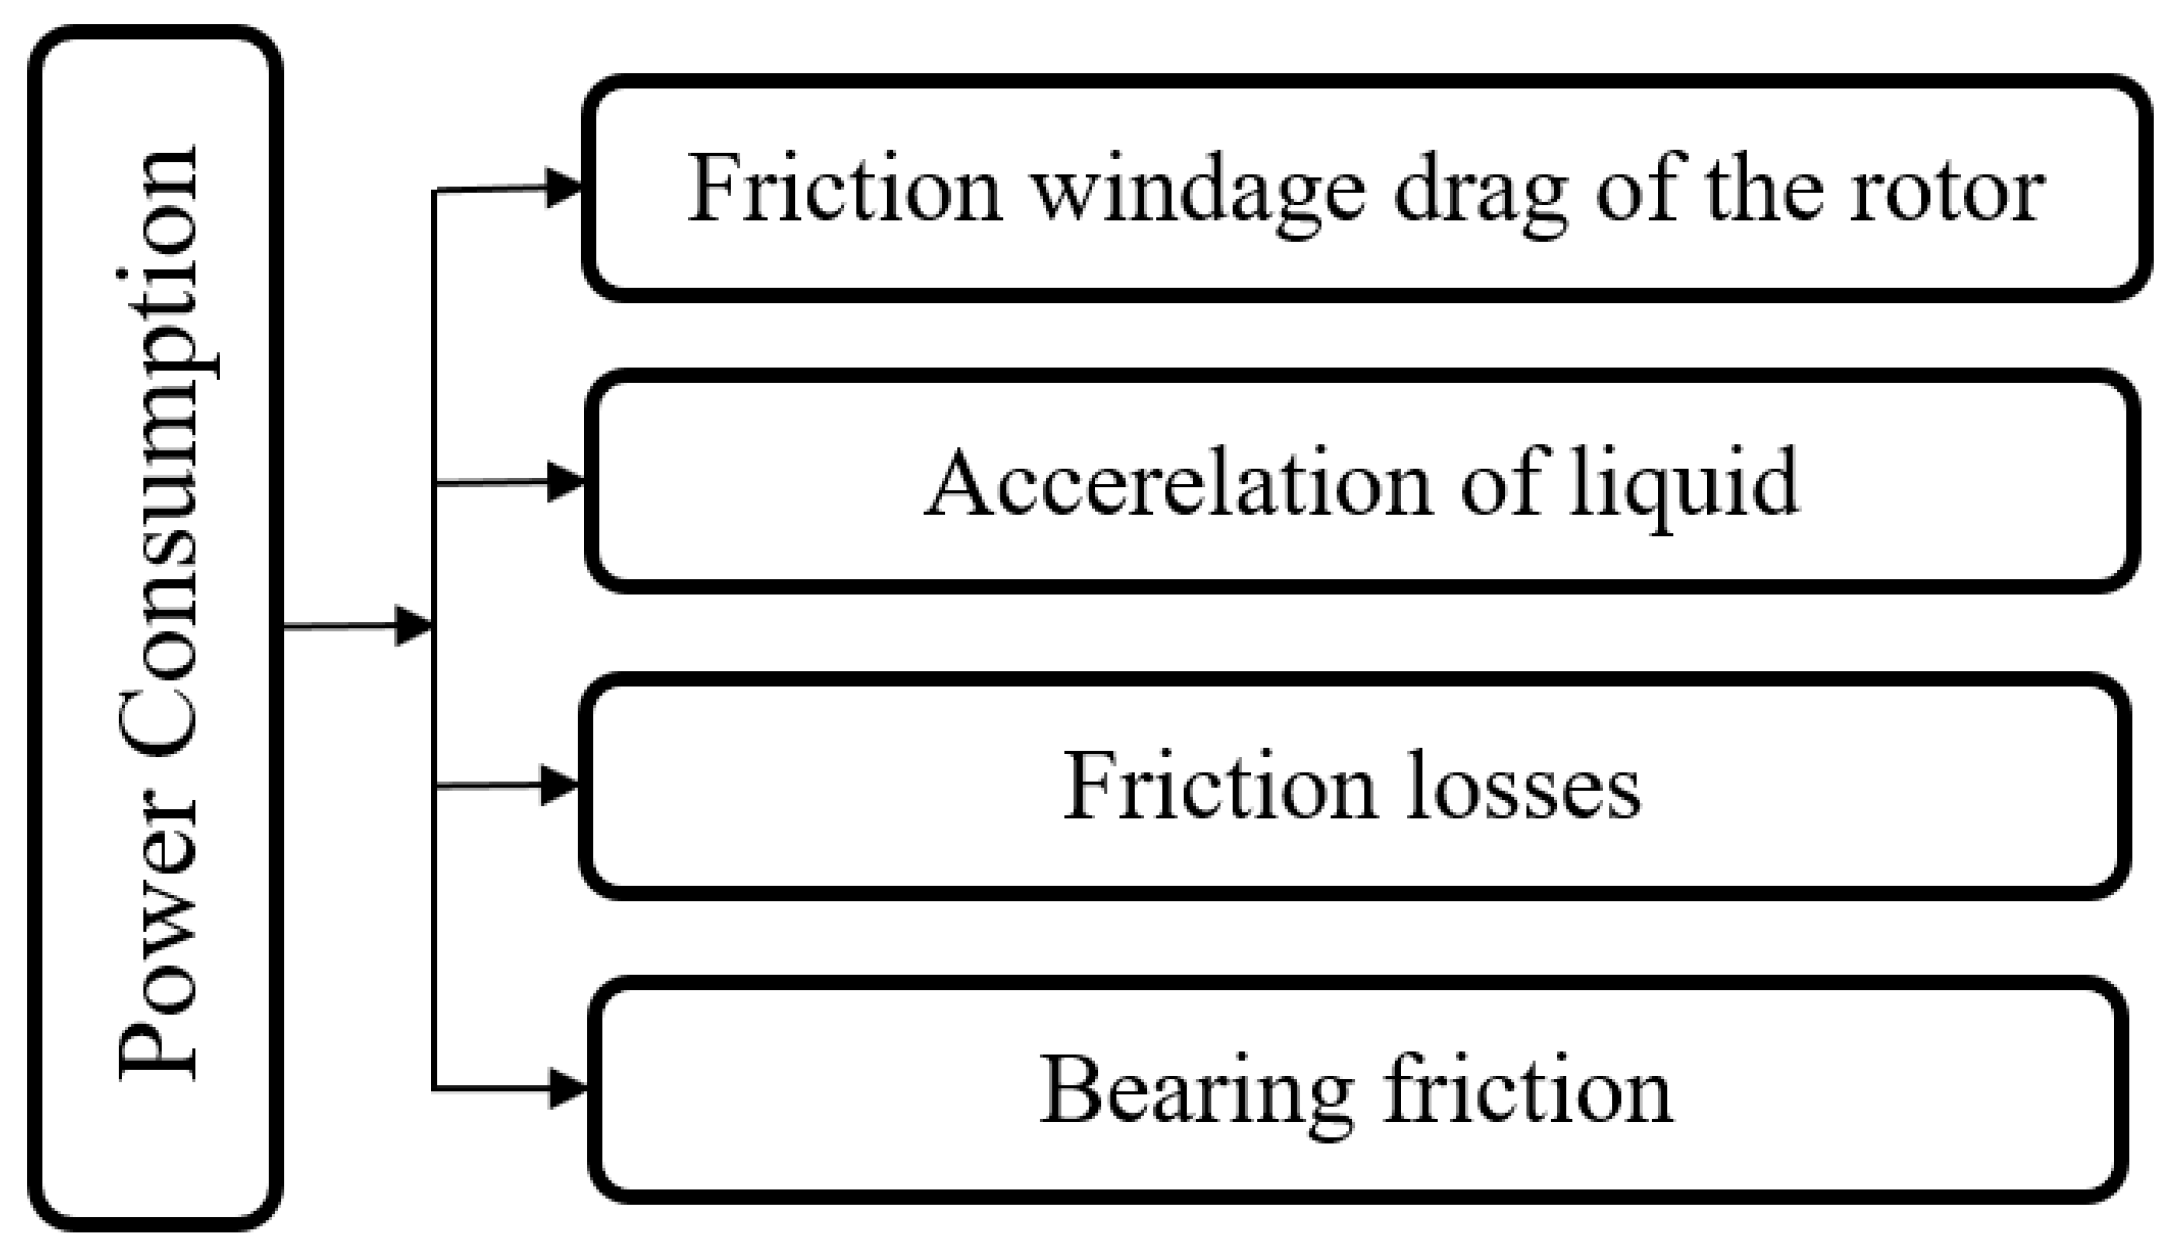
5. Power Consumption

Keyvani and Gardner [206] reported that the total power consumption of RPBs, as shown in Figure 6, includes rotor power consumption, mechanical friction, and friction loss due to liquid passing through the bed. Singh et al. [119] defined this parameter as follows:
N t = 1.2 + 1.1 × 10 3 ( ρ L R o 2 ω 2 Q L )
and for CRBs, Wang et al. [128] proposed the following correlation:
N tot = 5.5 n 0.67 + 0.338 n Q s , L 0.16 u g 0.33
Agarwal et al. developed a model to calculate the total power consumption of RSBs via Equation (58) [207]:
N t o t = 1.2 + 1.1 × 10 3 ρ L Q L r o 2 ω 2 + ρ L ω Q L 2 { 2 r i ( s + 1 / 2 ) + s ( s + 1 ) ( w + t ) } 4 π h l × 10 3
As Jiang et al. reported, high rotational speeds in RPBs cause increases in the device cost [208].
Jonathan Lee et al. [209] calculated the total power consumption of a simple counter-current RPB equipped with a stainless steel mesh, using Equation (59):
N t o t = ω m L t o r F t o r
where ωm is the rotational speed of the motor (1/s), Ltor is the torque arm length (m), and Ftor is the force required to hold the torque arm horizontal (N).
Finally, it is worth noting that detailed cost estimation formula have been developed for RPBs by Gudena et al. [122].

6. Future Perspective

Analyses and evaluations of the above research results show that further research is required for achieving MT and reaction models with greater result transparency; wet and effective interfacial gas–liquid surface area measurements, computed with theoretical and empirical models for physical absorption and volumes in the cavity, bulk, and end-effect zones in various kinds of RPB with different kinds of packing; the analysis of MT rate computations and liquid distribution patterns in RSBs and RZBs. It is also clear that conceptual systematic dimensional analysis, rigorous scale-up methods, cost estimation, residence time, and power consumption formulations with greater accuracy require further study as well. Other subjects that can be considered in future investigations include the effects of magnetic fields (DC and AC) and ultrasonic induction on the MT and hydrodynamics in RPBs when ionic fluids or nanofluids are employed as the solvent; the development of more suitable and accurate models for the simplification of various kinds of packing, hydrodynamics and mass transfer analyses for wire mesh packing, especially when the layers of mesh are placed together horizontally, as in a sandwich, rather than vertically, as in [149]; performance comparisons between RPBs and PBCs in terms of the MT rate and the reduction in energy consumption in the stripping process when using nanofluids or other advanced solvents; the analysis of industrial applications, which can reduce the environmental effects, especially with the use of CFD tools; finally, more 3D CFD simulations of multiphase RPBs to investigate the real definition of hydrodynamics and MT, and the further development of simple and acceptable accuracy models to define porous media that can reduce the time and cost of computation, especially in 3D simulations.

7. Conclusions

In this study, a comprehensive review was conducted of the process intensification equipment used for gas absorption processes, which are known as rotating packed beds (RPB) or HiGee contactors. Using centrifugal acceleration in RPBs intensifies the MT coefficient, and this leads to a reduction in the packing volume and energy consumption in comparison with packed beds. The gas velocity and flow area change radially in RPBs; therefore, MT coefficients change from point to point in contactors, but there is no general theory for this, and the prediction of MT coefficients in RPBs is theoretically complicated. Past investigations have shown that the local KGa in the end-effect zone is higher than the value of this coefficient in the bulk zone of the packing, and the MT coefficient strongly depends on the hydrodynamics of two phases. Therefore, further evaluation of this subject is necessary to improve and optimize RPBs. Previous studies have shown that MT coefficients are increase by reductions in boundary layer thickness, as a result of which the HTU will be decreased. Then, the liquid hold-up and pressure drop in RPBs were investigated. Past researchers have demonstrated that suitable dimensionless numbers, such as Re, Ga, and Ka, make hold-up predictions more accurate. Research results have shown that pressure drops are mainly related to the outer radius of the RPB and its packing type. Moreover, a suitable estimation of pressure drop can be achieved using the channel model. Moreover, by adding blades and baffles, one can reduce the total pressure. Unlike in PBCs, the effective MT surface area is not equal to the wet surface area or total surface area in RPBs. A contact area covered by flying droplets, which can be defined by the We number, affects the size of the effective surface area in RPBs. Previous studies have demonstrated that, in addition to the packing type, a good distribution of the fluid increases the effective surface area in the cavity and packing zones, and is considered as a parameter that effects flooding. The dimensionless numbers that affect MT description correlations are Re, Gr, Sc, Fr and We, which were recently improved by adding the geometry factor. The MT rate can be changed locally via the alteration of the flow area, gas, and liquid velocity. CFD and dimensional analysis are efficient tools for studying the RPB. CFD is a suitable tool for surveying hydrodynamic details and the MT rate. The results reveal that, for the achievement of maximum accuracy in the modeling of RPB in the gas–liquid transition process, one can use innovative models that use CT reconstruction for the generation of packing geometry, the VOF model for two-phase modeling, and the realizable k-ε turbulence model for hydrodynamic analysis. Dimensional analysis is an efficient method for the scaling up and benchmarking of RPB systems.

Author Contributions

The present research has been prepared and compiled by all three authors. The main idea of this investigation was performed by all three authors. The literature review was conducted by F.G. under the supervision of A.A. in consultation with A.V. The main structure of this review paper was done in consultation with all three authors. This review paper was written and reviewed by F.G., reviewed and analyzed by A.A. and supervised by A.V. The management of compiling and analyzing the results of this research was done by A.A. The manuscript of this review paper has been approved by all three authors. All authors have read and agreed to the published version of the manuscript.

Funding

This research received no external funding.

Institutional Review Board Statement

Not applicable.

Informed Consent Statement

Not applicable.

Data Availability Statement

Not applicable.

Conflicts of Interest

The authors declare no conflict of interest.

Nomenclature

aEffective gas–liquid surface (interfacial) area per unit volume of the packed bed, m2/m3
acCentrifugal acceleration, = ω 2 r avg m/s2
ae,asSpecific surface area, m2/m3
atSurface area of the packing per unit volume of the bed, m2/m3
awWetted surface area, m2/m3
A, B, CExperimental constant,
Ci, CO2Absorbing component (CO2) inlet concentration, ppm
Co, CO2Absorbing component (CO2) outlet concentration, ppm
CaConcentration of absorbent media, mol/L or g/L
CsConcentration of absorbent salt, g/L
CCO2* C CO 2 * = H CO 2 P CO 2
dDiameter of packing or equivalent spherical diameter = 6 ( 1 ε ) a t , m
dbAverage droplet diameter in bulk zone, m
deAverage droplet diameter in end zone, m
dhHydraulic diameter, m
diInner diameter of RZB rotor, m
doInner diameter of RZB rotor, m
dpPore diameter, mm
dNDiameter of nozzles, mm
dwDimeter of wire/fiber, mm
d ¯ Average diameter of droplet, mm
d1Diameter of droplet at demarcation point, m
DDiffusivity of the phase, m2/s
DiInner diameter of the casing of rotating bed, m
EReaction enhancement factor
EiInstantaneous reaction enhancement factor
fFriction factor in RPB or friction coefficient of mechanical seal in RZBs
fdThe fraction of volume the liquid distributer occupies in the inner radius of RPBs
fGDry resistance coefficient, which depends on the QG and ω
fwWetted resistance coefficient, which depends on QL, ω and β,
F ¯ G , int : F ¯ L , int : FvF-factor, kg1/2/m1/2s
gGravitational acceleration of earth, m/s2
GGas mass flow rate, kg/s or kg/h
hThe (axial) height of packing in RPBs or the height of the annual space at the inner edge of the RZB‘s rotor, m
hcThe height of the concentric rings, rotors and packing beds in CRBs, m
hfThe minimum height of the RPB required to prevent its operation in a flooding regime
HHenry’s constant, atm.m3/mol
HsSolubility coefficient of CO2 in solution, kmol/m3·Pa
HTUHeight of a transfer unit, m
kGGas phase mass transfer coefficient, g mol/(atm·m2·s)
kLLiquid phase mass transfer coefficient, m/s
k1Reaction rate constant, m3/s
k2Second-order rate of reaction, m3/kmol·s
k 2 KCollision kinetic energy loss
KGaOverall volumetric gas phase mass transfer coefficient, gmol/(atm·m3·s)
KLaOverall volumetric liquid phase mass transfer coefficient, 1/s
K1Departure coefficient of gas (the departure of power for a real liquid flow with a gas flow equal to zero) in RZBs
K2Departure coefficient of real liquid (the departure of power for a real liquid flow from that of the ideal liquid flow when no gas flows through the rotor) in RZBs
kRPseudo first-order rate constant, 1/s
L, L ˙ Liquid mass flow rate, kg/s or kg/h
LpPerimeter of rotational baffle channel in contact with fluid, m
m ˙ Mass flow rate, kg/s or ton/h
n or NRotational speed, rpm and number
NGPower requirement for a gas flow through the rotor, W
NiAbsorption rate of a component, kmol/m2·s
NLPower requirement for the liquid flow through the rotor, including liquid acceleration and friction losses, W
NLDPower transmitted to liquid flow by a rotation disk and rotational baffles for the ideal liquid flow at a zero gas flow, W
NLRPower requirement for a liquid flow at a zero gas flow, W
NMPower requiremnt due to mechanical friction, proportional to ω, W
NwPower requiremnt due to frictional windage drag of a rotor, proportional to ω1.5, W
NtotTotal power (Load) consumption, W
NTNumber of theoretical trays
PcPressing pressure between the stationary and rotational rings in RZBs
ΔPTotal pressure drop, kPa
ΔPcPressure drop due to centrifugal force, kPa
ΔPcwWet pressure drop due to centrifugal force without a gas flow, kPa
ΔPdDry pressure drop, kPa
ΔPfPressure drop due to frictional force, kPa
ΔPkPressure drop due to kinetic energy, kPa
ΔPmPressure drop due to momentum gain by gas radial motion in rotors, kPa
ΔPwWet pressure drop, kPa
ΔPTsTotal pressure drop through stationary rotors (of RSBs), kPa
qDimensionless initial velocity of liquid
QFlow rate, m3/h
QC, CO2Captured CO2, L/min
QCO2CO2 flow rate, L/min
QmMinimum wetting rate of packing, m3/m·h
QsSpecific flow rate, m3/h
rRadius of packing or coordinate direction parallel to disk surface, m
ravgAverage radius of a packed bed, m
rRBRadius of rotational baffle in RZBs, m
riInside radial length of packing, mm
roOutside radial length of packing, mm
rhHydraulic radius, m
rsRadius of the stationary housing, m
rM1Outer radius of the annular face with a stationary ring against the rotating ring in RZBs, m
rM2Inner radius of the annular face with a stationary ring against the rotating ring in RZBs, m
ΔrDistance between the rotational and stationary baffles, m
RCO2Rate of CO2 absorption per unit volume, mol/m3·s
RiInner rotor radius, m
RoOuter rotor diameter, m
RpQuadratic mean of radius of packing, m
sNumber of packing splits in RSB
SArea of rotational baffle channel through which fluid passes in a radial direction, m2
tTreatment time, min
t ¯ : TTemperature, K
u L ¯ Liquid mean radial velocity, m/s
uL,rLiquid velocity in the radial direction, m/s
ugGas superficial velocity, m/s
uL,sLiquid superficial velocity, m/s
ujetLiquid jet velocity, m/s
u0Liquid initial velocity, m/s
uθGas tangential velocity, m/s
VbPacking volume = π ( r o 2 r i 2 ) h , m3
ViVolume inside the inner radius of the bed, m3
VoVolume between the outer radius of the bed and the stationary housing, m3
VLThe volume held by liquid in the packing, m3
WTEGTEG concentration, %
YMole fraction, %
YiMole fraction of a component in the inlet gas stream, %
YoMole fraction of a component in the outlet gas stream, %
YwMole fractions of water in a gas phase, %
Y*Gas phase mole fraction of CO2 in equilibrium with the concentration of CO2 in liquid

Abbreviations

AMP2-amino-2-mthyl-1-propanol
ATUarea per transfer unit, m2
CCDCharge-coupled device camera
CRBConcentric ring rotating bed
DEADiethanolamine
DEAB4-diethylamino-2-butanol
DEEAN,N-diethyl ethanolamine
DIPADiisopropandamine
DMEAN,N-dimethyl ethanolamine
1DMA2P1-dimethylamino-2-propanol
DODissolved oxygen in water
GSGamma scanning
LDVLaser doppler velocimetry
LIFLaser-induced fluorescence
LESLarge eddy simulation
IPAIsopropyl alcohol
HETPHeight equivalent to a theoretical plate
MEAMonoethanolamine
MDEAMethyldiethanolamine
NMPN-methyl-2-pyrrolidone
NTUnumber of transfer units
PIVParticle image velocimetry
PZPiperazine
RSBRotating split bed
RTNRReal-time neutron radiography
RZBRotating zigzag bed
SSTShear–stress transport
TEGTriethylene glycol
VOFVolume of fluid
XCTX-ray computational tomography scanner
Greek Letters
βLiquid hold-up, volume of liquid sustained per unit volume of packing, dimensionless
βvmean saturation of packing, the ratio of the overall liquid volume and of the PB total void volume
<β>radial saturation mean of the RPB
γContacting angle, degree
δLiquid film thickness, m
δ ¯ Mean thickness of liquid, m
εPorosity of packing
ζLiquid maldistribution of injector, %
νKinematic viscosity of liquid, m2/s
ρdensity, kg/m3
ωAngular speed, rad/s or s−1
σSurface tension of liquid, N/m or kg/s2
σwSurface tension of water in 25 °C, 0.072 kg/s2
σcCritical surface tension of packing, N/m or kg/s2
ξthe ratio of liquid jet to the exit-gas kinetic energy
φFractional opening area of rotational baffle in RZBs, dimensionless shape factor number
λGravity factor
τGas treatment capacity of packing, 1/hr
Subscripts
B, bPacking
LLiquid phase
GGas phase
WWater
IMZInner wire mesh packing zone
OPZOuter resin pin zone
Dimensionless groups
AAbsorption factor, = Q L H Q G
CaCapillary number
Froude number Fr = Q L 2 a t ρ L 2 g
Galileo number Ga = gd p 3 ρ L 2 μ L 2
Hatta numbers Ha = kD CO 2 C OH k L (where k is reaction rate constant of CO2, m3/kmol·s in case of NaOH solution)
HyDimensionless Henry’s constant
Kapitza number Ka = μ 4 r ω 2 ρ σ 3
Modified Galileo number Ga * = d 3 ρ L ( ρ L a c Δ P r o r i ) μ L 2
Molar Ratio Mr = Q L C a Q G C i
Ohnesorge number Oh in = μ L ρ L σ d m
Reynolds number Re = ud p ( 2 π R h ) ν L
Re in = ρ L u r d m μ L
Particle Reynolds number Re p = m ˙ g d p μ g
Rotational Reynolds number Re ω = ω r avg 2 ν L
Schmidt number Sc = μ ρ D
Weber number We = Q L 2 ρ L d p ( 2 π R h ) 2 σ

References

  1. Reay, D. The Role of Process Intensification in Cutting Greenhouse Gas Emissions. Appl. Therm. Eng. 2008, 28, 2011–2019. [Google Scholar] [CrossRef]
  2. Harmsen, J. Process Intensification in the Petrochemicals Industry: Drivers and Hurdles for Commercial Implementation. Chem. Eng. Process. Process Intensif. 2010, 49, 70–73. [Google Scholar] [CrossRef]
  3. Keil, F.J. Process Intensification. Rev. Chem. Eng. 2018, 34, 135–200. [Google Scholar] [CrossRef] [Green Version]
  4. Neumann, K.; Gladyszewski, K.; Groß, K.; Qammar, H.; Wenzel, D.; Górak, A.; Skiborowski, M. A Guide on the Industrial Application of Rotating Packed Beds. Chem. Eng. Res. Design. 2018, 134, 443–462. [Google Scholar] [CrossRef]
  5. Stankiewicz, A.I.; Moulijn, J.A. Process Intensification: Transforming Chemical Engineering. Chem. Eng. Prog. 2000, 96, 22–34. [Google Scholar]
  6. Rao, D.P. The Story of “HIGEE”. Indian Chem. Eng. 2015, 57, 282–299. [Google Scholar] [CrossRef]
  7. Ehinmowo, A.; Aliyu, A.; Alagbe, S.; Adedipe, O.; Olumi, O. Offshore Topside Rotating Packed Bed as Process Intensified Alternative for Natural Gas Sweetening and Dehydration. Am. Chem. Sci. J. 2015, 8, 1–12. [Google Scholar] [CrossRef]
  8. Ramshaw, C.; Mallinson, R.H. Mass Transfer Process. U.S. Patent 4,283,255A, 11 August 1981. [Google Scholar]
  9. Peel, J.; Howarth, C.R.; Ramshaw, C. Process Intensification: Higee Seawater Deaeration. Chem. Eng. Res. Des. 1998, 76, 585–593. [Google Scholar] [CrossRef]
  10. Garcia, G.E.C.; Van Der Schaaf, J.; Kiss, A.A. A Review on Process Intensification in HiGee Distillation. J. Chem. Technol. Biotechnol. 2017, 92, 1136–1156. [Google Scholar] [CrossRef] [Green Version]
  11. Guo, J.; Jiao, W.; Qi, G.; Yuan, Z.; Liu, Y. Applications of High-Gravity Technologies in Gas Purifications: A Review. Chin. J. Chem. Eng. 2019, 27, 1361–1373. [Google Scholar] [CrossRef]
  12. Merkel, T.C.; Lin, H.; Wei, X.; Baker, R. Power Plant Post-Combustion Carbon Dioxide Capture: An Opportunity for Membranes. J. Memb. Sci. 2010, 359, 126–139. [Google Scholar] [CrossRef]
  13. Kunze, C.; Spliethoff, H. Assessment of Oxy-Fuel, Pre- and Post-Combustion-Based Carbon Capture for Future IGCC Plants. Appl. Energy 2012, 94, 109–116. [Google Scholar] [CrossRef]
  14. Kang, J.L.; Wong, D.S.H.; Jang, S.S.; Tan, C.S. A Comparison between Packed Beds and Rotating Packed Beds for CO2 Capture Using Monoethanolamine and Dilute Aqueous Ammonia Solutions. Int. J. Greenh. Gas Control 2016, 46, 228–239. [Google Scholar] [CrossRef]
  15. Yeh, J.T.; Pennline, H.W.; Resnik, K.P. Study of CO2 Absorption and Desorption in a Packed Column. Energy Fuels 2001, 15, 274–278. [Google Scholar] [CrossRef]
  16. Pourkargar, D.B.; Shahri, S.M.K.; Rioux, R.M.; Armaou, A. Spatiotemporal Modeling and Parametric Estimation of Isothermal CO2 Adsorption Columns. Ind. Eng. Chem. Res. 2016, 55, 6443–6453. [Google Scholar] [CrossRef]
  17. Rosli, S.S.; Wong, C.Y.; Yunus, N.M.; Lam, M.K.; Show, P.L.; Cheng, C.K.; Wang, D.K.; Da Oh, W.; Lim, J.W. Optimum Interaction of Light Intensity and CO2 Concentration in Bioremediating N-Rich Real Wastewater via Assimilation into Attached Microalgal Biomass as the Feedstock for Biodiesel Production. Process Saf. Environ. Prot. 2020, 141, 355–365. [Google Scholar] [CrossRef]
  18. Harbold, G.; Park, J. Using the GasTran Deaeration System to Achieve Low Dissolved Oxygen Levels for Superior Line Speed and Product Quality: A Case Study in Carbonated Soft Drink Bottling. In Proceedings of the 7th International Conference on Process Intensification, Albany, NY, USA, 15–17 September 2008. [Google Scholar]
  19. Hosseinzadeh, A.; Hosseinzadeh, M.; Vatani, A.; Mohammadi, T. Mathematical Modeling for the Simultaneous Absorption of CO2 and SO2 Using MEA in Hollow Fiber Membrane Contactors. Chem. Eng. Process. Process Intensif. 2017, 111, 35–45. [Google Scholar] [CrossRef]
  20. Thiels, M.; Wong, D.S.; Yu, C.-H.; Kang, J.-L.; Jang, S.S.; Tan, C.-S. Modelling and Design of Carbon Dioxide Absorption in Rotating Packed Bed and Packed Column. IFAC-PapersOnLine 2016, 49, 895–900. [Google Scholar] [CrossRef]
  21. Cheng, H.-H.; Lai, C.-C.; Tan, C.-S. Thermal regeneration of alkanolamine solutions in a rotating packed bed. Int. J. Greenh. Gas Control. 2013, 16, 206–216. [Google Scholar] [CrossRef]
  22. Mohammaddoost, H.; Azari, A.; Ansarpour, M.; Osfouri, S. Experimental investigation of CO2 removal from N2 by metal oxide nanofluids in a hollow fiber membrane contactor. Int. J. Greenh. Gas Control. 2018, 69, 60–71. [Google Scholar] [CrossRef]
  23. Luo, Y.; Luo, J.-Z.; Yue, X.-J.; Song, Y.-J.; Chu, G.-W.; Liu, Y.; Le, Y.; Chen, J.-F. Feasibility studies of micromixing and mass-transfer in an ultrasonic assisted rotating packed bed reactor. Chem. Eng. J. 2018, 331, 510–516. [Google Scholar] [CrossRef]
  24. Song, C.; Liu, Q.; Ji, N.; Deng, S.; Zhao, J.; Li, Y.; Song, Y.; Li, H. Alternative pathways for efficient CO2 capture by hybrid processes—A review. Renew. Sustain. Energy Rev. 2018, 82, 215–231. [Google Scholar] [CrossRef]
  25. Sang, L.; Luo, Y.; Chu, G.-W.; Liu, Y.-Z.; Liu, X.-Z.; Chen, J.-F. Modeling and experimental studies of mass transfer in the cavity zone of a rotating packed bed. Chem. Eng. Sci. 2017, 170, 355–364. [Google Scholar] [CrossRef]
  26. Yue, X.-J.; Luo, Y.; Chen, Q.-Y.; Chu, G.-W.; Luo, J.-Z.; Zhang, L.-L.; Chen, J.-F. Investigation of micromixing and precipitation process in a rotating packed bed reactor with PTFE packing. Chem. Eng. Process. Process. Intensif. 2018, 125, 227–233. [Google Scholar] [CrossRef]
  27. Guo, F.; Zheng, C.; Guo, K.; Feng, Y.; Gardner, N.C. Hydrodynamics and mass transfer in cross-flow rotating packed bed. Chem. Eng. Sci. 1997, 52, 3853–3859. [Google Scholar] [CrossRef]
  28. Liu, H.-S.; Lin, C.-C.; Wu, S.-C.; Hsu, H.-W. Characteristics of a Rotating Packed Bed. Ind. Eng. Chem. Res. 1996, 35, 3590–3596. [Google Scholar] [CrossRef]
  29. Tsai, C.-Y.; Chen, Y.-S. Effective interfacial area and liquid-side mass transfer coefficients in a rotating bed equipped with baffles. Sep. Purif. Technol. 2015, 144, 139–145. [Google Scholar] [CrossRef]
  30. Munjal, S.; Dudukovć, M.P.; Ramachandran, P. Mass-transfer in rotating packed beds—I. Development of gas—liquid and liquid—solid mass-transfer correlations. Chem. Eng. Sci. 1989, 44, 2245–2256. [Google Scholar] [CrossRef]
  31. Munjal, S.; Duduković, M.P.; Ramachandran, P. Mass-transfer in rotating packed beds—II. Experimental results and comparison with theory and gravity flow. Chem. Eng. Sci. 1989, 44, 2257–2268. [Google Scholar] [CrossRef]
  32. Lin, C.C.; Chien, K.S. Mass-Transfer Performance of Rotating Packed Beds Equipped with Blade Packings in VOCs Absorption into Water. Sep. Purif. Technol. 2008, 63, 138–144. [Google Scholar] [CrossRef]
  33. Chen, Y.H.; Chang, C.Y.; Su, W.L.; Chen, C.C.; Chiu, C.Y.; Yu, Y.H.; Chiang, P.C.; Chiang, S.I.M. Modeling Ozone Contacting Process in a Rotating Packed Bed. Ind. Eng. Chem. Res. 2004, 43, 228–236. [Google Scholar] [CrossRef]
  34. Jassim, M.S.; Rochelle, G.; Eimer, D.; Ramshaw, C. Carbon Dioxide Absorption and Desorption in Aqueous Monoethanolamine Solutions in a Rotating Packed Bed. Ind. Eng. Chem. Res. 2007, 46, 2823–2833. [Google Scholar] [CrossRef]
  35. Zheng, C.; Guo, K.; Feng, Y.; Yang, C.; Gardner, N.C. Pressure Drop of Centripetal Gas Flow through Rotating Beds. Ind. Eng. Chem. Res. 2000, 39, 829–834. [Google Scholar] [CrossRef]
  36. Sandilya, P.; Rao, D.P.; Sharma, A.; Biswas, G. Gas-Phase Mass Transfer in a Centrifugal Contactor. Ind. Eng. Chem. Res. 2001, 40, 384–392. [Google Scholar] [CrossRef]
  37. Cheng, H.H.; Tan, C.S. Carbon Dioxide Capture by Blended Alkanolamines in Rotating Packed Bed. Energy Procedia 2009, 1, 925–932. [Google Scholar] [CrossRef] [Green Version]
  38. Lin, C.C.; Lin, Y.H.; Tan, C.S. Evaluation of Alkanolamine Solutions for Carbon Dioxide Removal in Cross-Flow Rotating Packed Beds. J. Hazard. Mater. 2010, 175, 344–351. [Google Scholar] [CrossRef]
  39. Chu, G.W.; Luo, Y.; Shan, C.Y.; Zou, H.K.; Xiang, Y.; Shao, L.; Chen, J.F. Absorption of SO2 with Ammonia-Based Solution in a Cocurrent Rotating Packed Bed. Ind. Eng. Chem. Res. 2014, 53, 15731–15737. [Google Scholar] [CrossRef]
  40. Lin, C.-C.; Chen, B.-C. Carbon Dioxide Absorption into NaOH Solution in a Cross-Flow Rotating Packed Bed. J. Ind. Eng. Chem. 2007, 13, 1083–1090. [Google Scholar]
  41. Podbielniak, W.J. Centrifugal Fluid-Treating Apparatus and Seal. Google Pat. 2172222, 5 September 1939. [Google Scholar]
  42. Podbielniak, W.J. Art of Effecting Countercurrent Contact between Fluids. U.S. Patent 2,281,796, 8 March 1935. [Google Scholar]
  43. Podbielniak, W.J. Centrifugal Countercurrent Exchange Device. U.S. Patent 2758783A, 5 November 1951. [Google Scholar]
  44. Podbielniak, W.J. Centrifugal Countercurrent Contacting Method and Apparatus. U.S. Patent 2878993, 5 July 1959. [Google Scholar]
  45. Wilhelm, P.C.; Wilhelm, D.S. Apparatus for Intimate Contacting of Two Fluid Media Having Different Specific Weight. U.S. Patent 2,941,872, 9 June 1960. [Google Scholar]
  46. Pilo, C.W.; Dahlbeck, S.W. Means for the Distribution of a Liquid on Rotating Surfaces. U.S. Patent 3034730, 23 September 1962. [Google Scholar]
  47. Podbielniak, W.J. Continuous Centrifugal Vaporliquid Contactor. U.S. Patent 3,233,880, 3 August 1962. [Google Scholar]
  48. Podbielniak, W.J. Centrifugal Apparatus with Axially-Extended Rotor. U.S. Patent 3,344,981, 8 February 1965. [Google Scholar]
  49. Pilo, C.W. Centrifugal Contact Apparatus. U.S. Patent 3,415,501, 27 December 1965. [Google Scholar]
  50. Todd, D.B. Multistage Vapor-Liquid Contactor. U.S. Patent 3,486,743, 16 June 1967. [Google Scholar]
  51. Pilo, C.W. Rotary Gas Washers. U.S. Patent 4,397,794, 7 December 1981. [Google Scholar]
  52. Yang, S.; Lin, C.-C.; Tseng, I.-M.; Liu, W.-T.; Yu, H.-T. Method for Removing Volatile Components from a High Viscosity Liquid by Using Rotation Pack Bed. U.S. Patent 6,884,401 B2, 17 July 2002. [Google Scholar]
  53. Ji, Z.J.; Xu, Y.Y. Equipment of Zigzag High-Gravity Rotating Beds. U.S. Patent 7,344,126 B2, 12 April 2004. [Google Scholar]
  54. Marcus, D.E.M.; Mannel, L.; Krishniah, P.; David, B. Liquid Distributor for a Rotating Packed Bed. U.S. Patent 8,448,926 B2, 9 June 2011. [Google Scholar]
  55. Hartwing, W.; Petar, A.; Klaus Ennebach, M.H.T. Rotating Packed Bed. U.S. Patent 20130319235A1, 3 August 2012. [Google Scholar]
  56. Murali, K.; Namdeo, B.K.; Gandham, S.G.; Sheshachala, S.N.; Annaji, R.K.T. Rotating Packed Bed Unit. U.S. Patent 2016/0317967 A1, 16 November 2016. [Google Scholar]
  57. Namdeo, B.K.; Gandham, G.; Sheshachala, S.N.; Annaji, R.K.T. Rotating Packed Bed Assembly. U.S. Patent 20170028311A1, 2 February 2017. [Google Scholar]
  58. Tan, C.H.; Yu, C.S. Apparatus for Absorbing a Component from a Gas Mixture. U.S. Patent 20170157554A1, 8 June 2017. [Google Scholar]
  59. E Mello, M.V.D.; Huang, H.-M. System and Methods for Deaerating Sea Water Using a Rotating Packed Bed. U.S. Patent 20180016159A1, 18 January 2018. [Google Scholar]
  60. Lin, C.C.; Chu, C.R. Feasibility of Carbon Dioxide Absorption by NaOH Solution in a Rotating Packed Bed with Blade Packings. Int. J. Greenh. Gas Control 2015, 42, 117–123. [Google Scholar] [CrossRef]
  61. Liu, Y.; Gu, D.; Xu, C.; Qi, G.; Jiao, W. Mass Transfer Characteristics in a Rotating Packed Bed with Split Packing. Chin. J. Chem. Eng. 2015, 23, 868–872. [Google Scholar] [CrossRef]
  62. Wang, G.Q.; Xu, O.G.; Xu, Z.C.; Ji, J.B. New HIGEE-Rotating Zigzag Bed and Its Mass Transfer Performance. Ind. Eng. Chem. Res. 2008, 47, 8840–8846. [Google Scholar] [CrossRef]
  63. Lin, C.C.; Chen, B.C.; Chen, Y.S.; Hsu, S.K. Feasibility of a Cross-Flow Rotating Packed Bed in Removing Carbon Dioxide from Gaseous Streams. Sep. Purif. Technol. 2008, 62, 507–512. [Google Scholar] [CrossRef]
  64. Kapitza, P.L. Rectification Apparatus. U.S. Patent 2,593,763, 22 April 1952. [Google Scholar]
  65. Visscher, F.; Van Der Schaaf, J.; Nijhuis, T.A.; Schouten, J.C. Rotating Reactors-A Review. Chem. Eng. Res. Des. 2013, 91, 1923–1940. [Google Scholar] [CrossRef]
  66. Wang, Z.; Yang, T.; Liu, Z.; Wang, S.; Gao, Y.; Wu, M. Mass Transfer in a Rotating Packed Bed: A Critical Review. Chem. Eng. Process. Process Intensif. 2019, 139, 78–94. [Google Scholar] [CrossRef]
  67. Wang, G.Q.; Zhou, Z.J.; Li, Y.M.; Ji, J.B. Qualitative relationships between structure and performance of rotating zigzag bed in distillation. Chem. Eng. Process. Process Intensif. 2019, 135, 141–147. [Google Scholar] [CrossRef]
  68. Chu, G.W.; Luo, Y.; Xing, Z.Y.; Sang, L.; Zou, H.K.; Shao, L.; Chen, J.F. Mass-Transfer Studies in a Novel Multiliquid-Inlet Rotating Packed Bed. Ind. Eng. Chem. Res. 2014, 53, 18580–18584. [Google Scholar] [CrossRef]
  69. Liu, Y.; Zhang, F.; Gu, D.; Qi, G.; Jiao, W.; Chen, X. Gas-Phase Mass Transfer Characteristics in a Counter Airflow Shear Rotating Packed Bed. Can. J. Chem. Eng. 2014, 53, 18580–18584. [Google Scholar] [CrossRef]
  70. Chamchan, N.; Chang, J.Y.; Hsu, H.C.; Kang, J.L.; Wong, D.S.H.; Jang, S.S.; Shen, J.F. Comparison of Rotating Packed Bed and Packed Bed Absorber in Pilot Plant and Model Simulation for CO2 Capture. J. Taiwan Inst. Chem. Eng. 2017, 73, 20–26. [Google Scholar] [CrossRef]
  71. Yu, C.H.; Chen, M.T.; Chen, H.; Tan, C.S. Effects of Process Configurations for Combination of Rotating Packed Bed and Packed Bed on CO2 Capture. Appl. Energy 2016, 175, 269–276. [Google Scholar] [CrossRef]
  72. Zhao, B.; Tao, W.; Zhong, M.; Su, Y.; Cui, G. Process, Performance and Modeling of CO2 Capture by Chemical Absorption Using High Gravity: A Review. Renew. Sustain. Energy Rev. 2016, 65, 44–56. [Google Scholar] [CrossRef]
  73. Saha, D. Prediction of Mass Transfer Coefficient in Rotating Bed Contactor (Higee) Using Artificial Neural Network. Heat Mass Transf. 2009, 45, 451–457. [Google Scholar] [CrossRef]
  74. Lashkarbolooki, M.; Vaferi, B.; Mowla, D. Using Artificial Neural Network to Predict the Pressure Drop in a Rotating Packed Bed. Sep. Sci. Technol. 2012, 47, 2450–2459. [Google Scholar] [CrossRef]
  75. Zhao, B.; Su, Y.; Tao, W. Mass Transfer Performance of CO2 Capture in Rotating Packed Bed: Dimensionless Modeling and Intelligent Prediction. Appl. Energy 2014, 136, 132–142. [Google Scholar] [CrossRef]
  76. Li, W.; Wei, S.; Jiao, W.; Qi, G.; Liu, Y. Modelling of Adsorption in Rotating Packed Bed Using Artificial Neural Networks (ANN). Chem. Eng. Res. Des. 2016, 114, 89–95. [Google Scholar] [CrossRef]
  77. Liu, Z.W.; Liang, F.N.; Liu, Y.Z. Artificial Neural Network Modeling of Biosorption Process Using Agricultural Wastes in a Rotating Packed Bed. Appl. Therm. Eng. 2018, 140, 95–101. [Google Scholar] [CrossRef]
  78. Liu, T.; Liu, Y.; Wang, D.; Li, Y.; Shao, L. Artificial neural network modeling on the prediction of mass transfer coefficient for ozone absorption in RPB. Chem. Eng. Res. Des. 2019, 152, 38–47. [Google Scholar] [CrossRef]
  79. Mirzaei, S.; Shamiri, A.; Aroua, M.K. A review of different solvents, mass transfer, and hydrodynamics for postcombustion CO2 capture. Rev. Chem. Eng. 2015, 31, 521–561. [Google Scholar] [CrossRef]
  80. Neumann, K.; Hunold, S.; Skiborowski, M.; Górak, A. Dry Pressure Drop in Rotating Packed Beds-Systematic Experimental Studies. Ind. Eng. Chem. Res. 2017, 56, 12395–12405. [Google Scholar] [CrossRef]
  81. Hendry, J.R.; Lee, J.G.M.; Attidekou, P.S. Pressure Drop and Flooding in Rotating Packed Beds. Chem. Eng. Process. Process Intensif. 2020, 151, 107908. [Google Scholar] [CrossRef]
  82. Burns, J.R.; Ramshaw, C. Process Intensification: Visual Study of Liquid Maldistribution in Rotating Packed Beds. Chem. Eng. Sci. 1996, 51, 1347–1352. [Google Scholar] [CrossRef]
  83. Yang, Y.; Xiang, Y.; Chu, G.; Zou, H.; Luo, Y.; Arowo, M.; Chen, J.F. A Noninvasive X-ray Technique for Determination of Liquid Holdup in a Rotating Packed Bed. Chem. Eng. Sci. 2015, 138, 244–255. [Google Scholar] [CrossRef]
  84. Kelleher, T.; Fair, J.R. Distillation Studies in a High-Gravity Contactor. Ind. Eng. Chem. Res. 1996, 35, 4646–4655. [Google Scholar] [CrossRef]
  85. Vásquez, P.A.S.; Costa, F.E.; Rela, P.R.; Calvo, W.A.P.; LeRoux, G.A.C.; Hamada, M.M. Gamma Scanning Evaluation for Random Packed Columns. In Proceedings of the IEEE Nuclear Science Symposium Conference Record, Fajardo, PR, USA, 23–29 October 2005. [Google Scholar] [CrossRef]
  86. Aferka, S.; Viva, A.; Brunazzi, E.; Marchot, P.; Crine, M.; Toye, D. Tomographic Measurement of Liquid Hold up and Effective Interfacial Area Distributions in a Column Packed with High Performance Structured Packings. Chem. Eng. Sci. 2011, 66, 3413–3422. [Google Scholar] [CrossRef]
  87. Gao, X.Y.; Chu, G.W.; Ouyang, Y.; Zou, H.K.; Luo, Y.; Xiang, Y.; Chen, J.F. Gas Flow Characteristics in a Rotating Packed Bed by Particle Image Velocimetry Measurement. Ind. Eng. Chem. Res. 2017, 56, 14350–14361. [Google Scholar] [CrossRef]
  88. Shoji, E.; Yamagiwa, K.; Kubo, M.; Tsukada, T.; Takami, S.; Sugimoto, K.; Ito, D.; Saito, Y.; Teratani, S. Flow Visualization of Heavy Oil in a Packed Bed Using Real-Time Neutron Radiography. Chem. Eng. Sci. 2019, 196, 425–432. [Google Scholar] [CrossRef]
  89. Li, H.; Yuan, Z.; Liu, Y.; Liu, H. Characteristics of Liquid Flow in a Countercurrent Rotating Bed. Chem. Eng. Process. Process Intensif. 2019, 136, 72–81. [Google Scholar] [CrossRef]
  90. Li, X.; Liu, Y. Characteristics of Fin Baffle Packing Used in Rotating Packed Bed. Chin. J. Chem. Eng. 2010, 18, 55–60. [Google Scholar] [CrossRef]
  91. Sang, L.; Luo, Y.; Chu, G.W.; Zhang, J.P.; Xiang, Y.; Chen, J.F. Liquid Flow Pattern Transition, Droplet Diameter and Size Distribution in the Cavity Zone of a Rotating Packed Bed: A Visual Study. Chem. Eng. Sci. 2017, 158, 429–438. [Google Scholar] [CrossRef]
  92. Burns, J.R.; Jamil, J.N.; Ramshaw, C. Process Intensification: Operating Characteristics of Rotating Packed Beds-Determination of Liquid Hold-Up for a High-Voidage Structured Packing. Chem. Eng. Sci. 2000, 55, 2401–2415. [Google Scholar] [CrossRef]
  93. Lin, C.C.; Chen, Y.S.; Liu, H.S. Prediction of Liquid Holdup in Countercurrent-Flow Rotating Packed Bed. Chem. Eng. Res. Des. 2000, 78, 397–403. [Google Scholar] [CrossRef]
  94. Yi, F.; Zou, H.K.; Chu, G.W.; Shao, L.; Chen, J.F. Modeling and Experimental Studies on Absorption of CO2 by Benfield Solution in Rotating Packed Bed. Chem. Eng. J. 2009, 145, 377–384. [Google Scholar] [CrossRef]
  95. Li, W.; Wu, W.; Zou, H.; Chu, G.; Shao, L.; Chen, J. Process Intensification of VOC Removal from High Viscous Media by Rotating Packed Bed. Chin. J. Chem. Eng. 2009, 17, 389–393. [Google Scholar] [CrossRef]
  96. Xiang, Y.; Wen, L.; Chu, G.; Shao, L.; Xiao, G.; Chen, J. Modeling of the Precipitation Process in a Rotating Packed Bed and Its Experimental Validation. Chin. J. Chem. Eng. 2010, 18, 249–257. [Google Scholar] [CrossRef]
  97. Sang, L.; Luo, Y.; Chu, G.W.; Sun, B.C.; Zhang, L.L.; Chen, J.F. A Three-Zone Mass Transfer Model for a Rotating Packed Bed. AIChE J. 2019, 65. [Google Scholar] [CrossRef]
  98. Wang, D.; Liu, T.; Ma, L.; Wang, F.; Shao, L. Modeling and Experimental Studies on Ozone Absorption into Phenolic Solution in a Rotating Packed Bed. Ind. Eng. Chem. Res. 2019, 58, 7052–7062. [Google Scholar] [CrossRef]
  99. Su, M.J.; Le, Y.; Chu, G.W.; Li, Y.B.; Zhang, L.L.; Luo, Y. Intensification of Droplet Dispersion by Using Multilayer Wire Mesh and Its Application in a Rotating Packed Bed. Ind. Eng. Chem. Res. 2020, 59, 3584–3592. [Google Scholar] [CrossRef]
  100. Hacking, J.A.; Delsing, N.F.E.J.; de Beer, M.M.; van der Schaaf, J. Improving Liquid Distribution in a Rotating Packed Bed. Chem. Eng. Process. Process Intensif. 2020, 149, 107861. [Google Scholar] [CrossRef]
  101. Razi, N.; Bolland, O.; Svendsen, H. Review of Design Correlations for CO2 Absorption into MEA Using Structured Packings. Int. J. Greenh. Gas Control 2012, 9, 193–219. [Google Scholar] [CrossRef]
  102. Suess, P.; Spiegel, L. Hold-up of Mellapak Structured Packings. Chem. Eng. Process. Process Intensif. 1992, 31, 119–124. [Google Scholar] [CrossRef]
  103. Wolf-Zöllner, V.; Seibert, F.; Lehner, M. Extended Performance Comparison of Different Pressure Drop, Hold-up and Flooding Point Correlations for Packed Columns. Chem. Eng. Res. Des. 2019, 147, 699–708. [Google Scholar] [CrossRef]
  104. Muzen, A.; Cassanello, M.C. Liquid Holdup in Columns Packed with Structured Packings: Countercurrent vs. Cocurrent Operation. Che. Eng. Sci. 2005, 60, 6226–6234. [Google Scholar] [CrossRef]
  105. Alix, P.; Raynal, L. Liquid Distribution and Liquid Hold-up in Modern High Capacity Packings. Chem. Eng. Res. Des. 2008, 86, 585–591. [Google Scholar] [CrossRef]
  106. Lashkarbolooki, M. A General Model for Pressure Drop Prediction across a Rotating Packed Bed. Sep. Sci. Technol. 2017, 52, 1843–1851. [Google Scholar] [CrossRef]
  107. Bašić, A.; Duduković, M.P. Liquid Holdup in Rotating Packed Beds: Examination of the Film Flow Assumption. AIChE J. 1995, 41, 301–316. [Google Scholar] [CrossRef]
  108. Piché, S.; Larachi, F.; Grandjean, B.P.A. Improved Liquid Hold-up Correlation for Randomly Packed Towers. Chem. Eng. Res. Des. 2001, 79, 71–80. [Google Scholar] [CrossRef]
  109. Liu, W.; Chu, G.W.; Luo, Y.; Liu, Y.Z.; Meng, F.Y.; Sun, B.C.; Chen, J.F. Mass Transfer in a Rotating Packed Bed Reactor with a Mesh-Pin Rotor: Modeling and Experimental Studies. Chem. Eng. J. 2019, 369, 600–610. [Google Scholar] [CrossRef]
  110. Guo, K.; Guo, F.; Feng, Y.; Chen, J.; Zheng, C.; Gardner, N.C. Synchronous Visual and RTD Study on Liquid Flow in Rotating Packed-Bed Contractor. Chem. Eng. Sci. 2000, 55, 1699–1706. [Google Scholar] [CrossRef]
  111. Xinlin, D.; Xiaoyong, H.; Yigang, D.; Yuanxin, W.; Dinghuo, L. A Model for the Mass Transfer Coefficient in Rotating Packed Bed. Chem. Eng. Commun. 2000, 178, 249–256. [Google Scholar] [CrossRef]
  112. Rao, D.P.; Bhowal, A.; Goswami, P.S. Process Intensification in Rotating Packed Beds (HIGEE): An Appraisal. Ind. Eng. Chem. Res. 2004, 43, 1150–1162. [Google Scholar] [CrossRef]
  113. Sivakumar, S.V.; Kaistha, N.; Rao, D.P. Innovations for Process Intensification in the Process Industry. 2004. Available online: https://www.rgipt.ac.in/oldsite/author_doc/S%20-%20122%20.pdf (accessed on 19 February 2021).
  114. Neumann, K.; Hunold, S.; Groß, K.; Górak, A. Experimental Investigations on the Upper Operating Limit in Rotating Packed Beds. Chem. Eng. Process. Process Intensif. 2017, 121, 240–247. [Google Scholar] [CrossRef]
  115. Li, Y.; Lu, Y.; Wang, G.; Nie, Y.; Ying, H.; Ji, J.; Liu, X. Liquid Entrainment and Flooding in a Rotating Zigzag Bed. Ind. Eng. Chem. Res. 2015, 54, 2554–2563. [Google Scholar] [CrossRef]
  116. Kuźniewska-Lach, I. Estimation of Phase Velocities at Flooding Point in Packed Columns for Any Gas/Liquid System. Can. J. Chem. Eng. 1999, 77, 439–446. [Google Scholar] [CrossRef]
  117. Stankiewicz, A.; Moulijn, J.A. Re-Engineering the Chemical Processing Plant, 1st ed.; CRC Press: Boca Raton, FL, USA, 2003. [Google Scholar] [CrossRef]
  118. Lockett, M.J.; Victor, R.A.; Billingham, J.F. Structured Packing Flooding: Its Measurement and Prediction, 8th Conference of Distillation and Absorption; Symposium Series 152; IChemE: London, UK, 2006; pp. 400–408. ISBN 0852955057. [Google Scholar]
  119. Singh, S.P.; Counce, R.M.; Wilson, J.H.; Villiers-Fisher, J.F.; Jennings, H.L.; Lucero, A.J.; Reed, G.D.; Ashworth, R.A.; Elliott, M.G. Removal of Volatile Organic Compounds from Groundwater Using a Rotary Air Stripper. Ind. Eng. Chem. Res. 1992, 31, 574–580. [Google Scholar] [CrossRef]
  120. Lockett, M.J. Flooding of Rotating Structured Packing and Its Application to Conventional Packed Columns. Chem. Eng. Res. Des. 1995, 73, 379–384. [Google Scholar]
  121. Rajan, S.; Kumar, M.; Ansari, M.J.; Rao, D.P.; Kaistha, N. Limiting Gas Liquid Flows and Mass Transfer in a Novel Rotating Packed Bed (HiGee). Ind. Eng. Chem. Res. 2011, 50, 986–997. [Google Scholar] [CrossRef]
  122. Gudena, K.; Rangaiah, G.P.; Lakshminarayanan, S. Optimal Design of a Rotating Packed Bed for VOC Stripping from Contaminated Groundwater. Ind. Eng. Chem. Res. 2011, 51, 835–847. [Google Scholar] [CrossRef]
  123. Li, S.; Deng, S.; Zhao, L.; Zhao, R.; Lin, M.; Du, Y.; Lian, Y. Mathematical Modeling and Numerical Investigation of Carbon Capture by Adsorption: Literature Review and Case Study. Appl. Energy 2018, 221, 437–449. [Google Scholar] [CrossRef]
  124. Kumar, M.P.; Rao, D.P. Studies on a High-Gravity Gas-Liquid Contactor. Ind. Eng. Chem. Res. 1990, 29, 917–920. [Google Scholar] [CrossRef]
  125. Foumeny, E.A.; Kulkarni, A.; Roshani, S.; Vatani, A. Elucidation of Pressure Drop in Packed-Bed Systems. Appl. Therm. Eng. 1996, 16, 195–202. [Google Scholar] [CrossRef]
  126. Chandra, A.; Goswami, P.S.; Rao, D.P. Characteristics of Flow in a Rotating Packed Bed (HIGEE) with Split Packing. Ind. Eng. Chem. Res. 2005, 44, 4051–4060. [Google Scholar] [CrossRef]
  127. Sung, W.D.; Chen, Y.S. Characteristics of a Rotating Packed Bed Equipped with Blade Packings and Baffles. Sep. Purif. Technol. 2012, 93, 52–58. [Google Scholar] [CrossRef]
  128. Wang, G.Q.; Jiao, Y.Q.; Xu, Z.C.; Ji, J.B. Studies on Performance of Crossflow Concentric-Ring Rotating Bed. Ind. Eng. Chem. Res. 2009, 48, 10643–10649. [Google Scholar] [CrossRef]
  129. Llerena-Chavez, H.; Larachi, F. Analysis of Flow in Rotating Packed Beds via CFD Simulations-Dry Pressure Drop and Gas Flow Maldistribution. Chem. Eng. Sci. 2009, 64, 2113–2126. [Google Scholar] [CrossRef]
  130. Jiao, W.Z.; Liu, Y.Z.; Qi, G.S. Gas Pressure Drop and Mass Transfer Characteristics in a Cross-Flow Rotating Packed Bed with Porous Plate Packing. Ind. Eng. Chem. Res. 2010, 49, 3732–3740. [Google Scholar] [CrossRef]
  131. Li, Y.; Ji, J.; Xu, Z.; Wang, G.; Li, X.; Liu, X. Pressure Drop Model on Rotating Zigzag Bed as a New High-Gravity Technology. Ind. Eng. Chem. Res. 2013, 52, 4638–4649. [Google Scholar] [CrossRef]
  132. Treybal, R.E. Mass-Transfer Operations, 3rd ed.; McGraw-Hill Book Company: London, UK, 1980. [Google Scholar] [CrossRef] [Green Version]
  133. Tan, L.S.; Shariff, A.M.; Lau, K.K.; Bustam, M.A. Factors Affecting CO2 Absorption Efficiency in Packed Column: A Review. J. Ind. Eng. Chem. 2012, 18, 1874–1883. [Google Scholar] [CrossRef]
  134. Reddy, K.J.; Gupta, A.; Rao, D.P.; Rama, O.P. Process Intensification in a HIGEE with Split Packing. Ind. Eng. Chem. Res. 2006, 45, 4270–4277. [Google Scholar] [CrossRef]
  135. Tung, H.H.; Mah, R.S.H. Modeling Liquid Mass Transfer in Higee Separation Process. Chem. Eng. Commun. 1985, 39, 147–153. [Google Scholar] [CrossRef]
  136. Kang, J.L.; Sun, K.; Wong, D.S.H.; Jang, S.S.; Tan, C.S. Modeling Studies on Absorption of CO2 by Monoethanolamine in Rotating Packed Bed. Int. J. Greenh. Gas Control 2014, 25, 141–150. [Google Scholar] [CrossRef]
  137. Joel, A.S.; Wang, M.; Ramshaw, C. Modelling and Simulation of Intensified Absorber for Post-Combustion CO2 Capture Using Different Mass Transfer Correlations. Appl. Therm. Eng. 2015, 74, 47–53. [Google Scholar] [CrossRef]
  138. Oko, E.; Wang, M.; Ramshaw, C. Study of Mass Transfer Correlations for Intensified Absorbers in Post-Combustion CO2 Capture Based on Chemical Absorption. Energy Procedia 2017, 114, 1630–1636. [Google Scholar] [CrossRef]
  139. Sun, B.; Zou, H.; Chu, G.; Shao, L.; Zeng, Z.; Chen, J. Determination of Mass-Transfer Coefficient of CO2 in NH3 and CO2 Absorption by Materials Balance in a Rotating Packed Bed. Ind. Eng. Chem. Res. 2012, 51, 10949–10954. [Google Scholar] [CrossRef]
  140. Yu, C.H.; Wu, T.W.; Tan, C.S. CO2 Capture by Piperazine Mixed with Non-Aqueous Solvent Diethylene Glycol in a Rotating Packed Bed. Int. J. Greenh. Gas Control 2013, 19, 503–509. [Google Scholar] [CrossRef]
  141. Yu, C.H.; Cheng, H.H.; Tan, C.S. CO2 Capture by Alkanolamine Solutions Containing Diethylenetriamine and Piperazine in a Rotating Packed Bed. Int. J. Greenh. Gas Control 2012, 9, 136–147. [Google Scholar] [CrossRef]
  142. Chu, G.W.; Fei, J.; Cai, Y.; Liu, Y.Z.; Gao, Y.; Luo, Y.; Chen, J.F. Removal of SO2 with Sodium Sulfite Solution in a Rotating Packed Bed. Ind. Eng. Chem. Res. 2018, 57, 2329–2335. [Google Scholar] [CrossRef]
  143. Zhang, L.; Wu, S.; Gao, Y.; Sun, B.; Luo, Y.; Zou, H.; Chu, G.; Chen, J. Absorption of SO2 with Calcium-Based Solution in a Rotating Packed Bed. Sep. Purif. Technol. 2019, 214, 148–155. [Google Scholar] [CrossRef]
  144. Zhan, J.; Wang, B.; Zhang, L.; Sun, B.C.; Fu, J.; Chu, G.W.; Zou, H. Simultaneous Absorption of H2S and CO2 into the MDEA + PZ Aqueous Solution in a Rotating Packed Bed. Ind. Eng. Chem. Res. 2020, 59, 8295–8303. [Google Scholar] [CrossRef]
  145. Chen, Y.S.; Liu, H.S. Absorption of VOCs in a Rotating Packed Bed. Ind. Eng. Chem. Res. 2002, 41, 1583–1588. [Google Scholar] [CrossRef]
  146. Lin, C.C.; Liu, W.T.; Tan, C.S. Removal of Carbon Dioxide by Absorption in a Rotating Packed Bed. Ind. Eng. Chem. Res. 2003, 42, 2381–2386. [Google Scholar] [CrossRef]
  147. Chen, Y.S.; Lin, C.C.; Liu, H.S. Mass Transfer in a Rotating Packed Bed with Various Radii of the Bed. Ind. Eng. Chem. Res. 2005, 44, 7868–7875. [Google Scholar] [CrossRef]
  148. Chen, Y.S.; Lin, F.Y.; Lin, C.C.; Tai, C.Y.D.; Liu, H.S. Packing Characteristics for Mass Transfer in a Rotating Packed Bed. Ind. Eng. Chem. Res. 2006, 45, 6846–6853. [Google Scholar] [CrossRef]
  149. Chen, Q.Y.; Chu, G.W.; Luo, Y.; Sang, L.; Zhang, L.L.; Zou, H.K.; Chen, J.F. Polytetrafluoroethylene Wire Mesh Packing in a Rotating Packed Bed: Mass-Transfer Studies. Ind. Eng. Chem. Res. 2016, 55, 11606–11613. [Google Scholar] [CrossRef]
  150. Chen, T.L.; Chen, Y.H.; Chiang, P.C. Enhanced Performance on Simultaneous Removal of NOx-SO2-CO2 Using a High-Gravity Rotating Packed Bed and Alkaline Wastes towards Green Process Intensification. Chem. Eng. J. 2020, 393, 124678. [Google Scholar] [CrossRef]
  151. Luo, Y.; Chu, G.W.; Zou, H.K.; Wang, F.; Xiang, Y.; Shao, L.; Chen, J.F. Mass Transfer Studies in a Rotating Packed Bed with Novel Rotors: Chemisorption of CO2. Ind. Eng. Chem. Res. 2012, 51, 9164–9172. [Google Scholar] [CrossRef]
  152. Yang, K.; Chu, G.; Zou, H.; Sun, B.; Shao, L.; Chen, J.F. Determination of the Effective Interfacial Area in Rotating Packed Bed. Chem. Eng. J. 2011, 168, 1377–1382. [Google Scholar] [CrossRef]
  153. Guo, K.; Zhang, Z.; Luo, H.; Dang, J.; Qian, Z. An Innovative Approach of the Effective Mass Transfer Area in the Rotating Packed Bed. Ind. Eng. Chem. Res. 2014, 53, 4052–4058. [Google Scholar] [CrossRef]
  154. Luo, Y.; Luo, J.Z.; Chu, G.W.; Zhao, Z.Q.; Arowo, M.; Chen, J.F. Investigation of Effective Interfacial Area in a Rotating Packed Bed with Structured Stainless Steel Wire Mesh Packing. Chem. Eng. Sci. 2017, 170, 347–354. [Google Scholar] [CrossRef]
  155. Lin, C.C.; Jian, G.S. Characteristics of a Rotating Packed Bed Equipped with Blade Packings. Sep. Purif. Technol. 2007, 54, 51–60. [Google Scholar] [CrossRef]
  156. Lin, C.C.; Wei, T.Y.; Liu, W.T.; Shen, K.P. Removal of VOCs from Gaseous Streams in a High-Voidage Rotating Packed Bed. J. Chem. Eng. Japan 2004, 37, 1471–1477. [Google Scholar] [CrossRef]
  157. Chen, Y.S.; Lin, C.C.; Liu, H.S. Mass Transfer in a Rotating Packed Bed with Viscous Newtonian and Non-Newtonian Fluids. Ind. Eng. Chem. Res. 2005, 44, 1043–1051. [Google Scholar] [CrossRef]
  158. Chen, Y.S. Correlations of Mass Transfer Coefficients in a Rotating Packed Bed. Ind. Eng. Chem. Res. 2011, 50, 1778–1785. [Google Scholar] [CrossRef]
  159. Bai, S.; Chu, G.-W.; Li, S.-C.; Zou, H.-K.; Xiang, Y.; Luo, Y.; Chen, J.-F. SO2 Removal in a Pilot Scale Rotating Packed Bed. Environ. Eng. Sci. 2015, 32, 806–815. [Google Scholar] [CrossRef]
  160. Mei-ying, D.; Gui-sheng, Q.; You-zhi, L.; Qiang, G.; Song Bin, W.T. Experimental Study on Influential Factors of Mass Transfer in a Cross-Flow Rotating Packed Bed. Chin. J. Process Eng. 2015, 15, 929–934. [Google Scholar] [CrossRef]
  161. Cao, S.; Liu, P.; Zhang, L.; Sun, B.; Zou, H.; Chu, G.; Luo, Y.; Chen, J. Mass Transfer Study of Dehydration by Triethylene Glycol in Rotating Packed Bed for Natural Gas Processing. Ind. Eng. Chem. Res. 2018. [Google Scholar] [CrossRef]
  162. Su, M.J.; Luo, Y.; Chu, G.W.; Liu, W.; Zheng, X.H.; Chen, J.F. Gas-Side Mass Transfer in a Rotating Packed Bed with Structured Nickel Foam Packing. Ind. Eng. Chem. Res. 2018, 57, 5394–5400. [Google Scholar] [CrossRef]
  163. Li, W.; Liu, H.; Li, S.; Li, W.; Chen, Y.; Gao, J.; Cao, Y. Removal of Hydrophobic Volatile Organic Compounds with Sodium Hypochlorite and Surfactant in a Co-Current Rotating Packed Bed. J. Environ. Sci. 2018, 64, 190–196. [Google Scholar] [CrossRef]
  164. Kolev, N. Packed Bed Columns: For Absorption, Desorption, Rectification and Direct Heat Transfer; Elsevier Science: Amsterdam, The Netherlands, 2006. [Google Scholar] [CrossRef]
  165. Wagner, I.; Stichlmair, J.; Fair, J.R. Mass Transfer in Beds of Modern, High-Efficiency Random Packings. Ind. Eng. Chem. Res. 1997, 36, 227–237. [Google Scholar] [CrossRef]
  166. Liu, T.; Wang, D.; Wang, W.; Liang, Q.; Shao, L. Study on the Efficient Production of Ozone Water by a Rotating Packed Bed. Ind. Eng. Chem. Res. 2019, 58, 7227–7232. [Google Scholar] [CrossRef]
  167. Luo, Y.; Chu, G.W.; Zou, H.K.; Zhao, Z.Q.; Dudukovic, M.P.; Chen, J.F. Gas-Liquid Effective Interfacial Area in a Rotating Packed Bed. Ind. Eng. Chem. Res. 2012, 51, 16320–16325. [Google Scholar] [CrossRef]
  168. Onda, K.; Takeuchi, H.; Okumoto, Y. Mass Transfer Coefficients between Gas and Liquid Phases in Packed Columns. J. Chem. Eng. Jpn. 1968, 1, 56–62. [Google Scholar] [CrossRef] [Green Version]
  169. Puranik, S.S.; Vogelpohl, A. Effective Interfacial Area in Irrigated Packed Columns. Chem. Eng. Sci. 1974, 29, 501–507. [Google Scholar] [CrossRef]
  170. Xie, P.; Lu, X.; Ding, H.; Yang, X.; Ingham, D.; Ma, L.; Pourkashanian, M. A Mesoscale 3D CFD Analysis of the Liquid Flow in a Rotating Packed Bed. Chem. Eng. Sci. 2019, 199, 528–545. [Google Scholar] [CrossRef] [Green Version]
  171. Lu, Y.-Z.; Liu, W.; Xu, Y.-C.; Luo, Y.; Chu, G.-W.; Chen, J.-F. Initial Liquid Dispersion and Mass Transfer Performance in a Rotating Packed Bed. Chem. Eng. Process. Process Intensif. 2019, 140, 136–141. [Google Scholar] [CrossRef]
  172. Sheng, M.; Sun, B.; Zhang, F.; Chu, G.; Zhang, L.; Liu, C.; Chen, J.-F.; Zou, H. Mass-Transfer Characteristics of the CO2 Absorption Process in a Rotating Packed Bed. Energy Fuels 2015, 30, 4215–4220. [Google Scholar] [CrossRef]
  173. Yang, Y.C.; Ouyang, Y.; Zhang, N.; Yu, Q.J.; Arowo, M. A Review on Computational Fluid Dynamic Simulation for Rotating Packed Beds. J. Chem. Technol. Biotechnol. 2019, 94, 1017–1031. [Google Scholar] [CrossRef]
  174. Lu, X.; Xie, P.; Ingham, D.B.; Ma, L.; Pourkashanian, M. A Porous Media Model for CFD Simulations of Gas-Liquid Two-Phase Flow in Rotating Packed Beds. Chem. Eng. Sci. 2018, 189, 123–134. [Google Scholar] [CrossRef]
  175. Liu, Y.; Wu, W.; Luo, Y.; Chu, G.W.; Liu, W.; Sun, B.C.; Chen, J.F. CFD Simulation and High-Speed Photography of Liquid Flow in the Outer Cavity Zone of a Rotating Packed Bed Reactor. Ind. Eng. Chem. Res. 2019, 58, 5280–5290. [Google Scholar] [CrossRef]
  176. Yang, W.; Wang, Y.; Chen, J.; Fei, W. Computational Fluid Dynamic Simulation of Fluid Flow in a Rotating Packed Bed. Chem. Eng. J. 2010, 156, 582–587. [Google Scholar] [CrossRef]
  177. Martínez, E.L.; Jaimes, R.; Gomez, J.L.; Filho, R.M. CFD Simulation of Three-Dimensional Multiphase Flow in a Rotating Packed Bed. In Computer Aided Chemical Engineering; Elsevier BV: Amsterdam, The Netherlands, 2012. [Google Scholar] [CrossRef]
  178. Shi, X.; Xiang, Y.; Wen, L.X.; Chen, J.F. CFD Analysis of Liquid Phase Flow in a Rotating Packed Bed Reactor. Chem. Eng. J. 2013, 228, 1040–1049. [Google Scholar] [CrossRef]
  179. Chengcheng, X.; Weizhou, J.; Youzhi, L.; Liang, G.; Zhiguo, Y.; Qiaoling, Z. Effects of Airflow Field on Droplets Diameter inside the Corrugated Packing of a Rotating Packed Bed. China Pet. Process. Petrochem. Technol. 2014, 16, 38–46. [Google Scholar]
  180. Sun, Y.; Zhang, Y.; Zhang, L.; Jiang, B.; Zhao, Z. Structure Optimization of a Rotating Zigzag Bed via Computational Fluid Dynamics Simulation. Ind. Eng. Chem. Res. 2014, 53, 13764–13772. [Google Scholar] [CrossRef]
  181. Yang, Y.; Xiang, Y.; Chu, G.; Zou, H.; Sun, B.; Arowo, M.; Chen, J.F. CFD Modeling of Gas-Liquid Mass Transfer Process in a Rotating Packed Bed. Chem. Eng. J. 2016, 294, 111–121. [Google Scholar] [CrossRef]
  182. Gao, X.Y.; Liu, L.; Hu, M.L.; Xiang, Y.; Chu, G.W.; Zou, H.K.; Sun, B.C.; Chen, J.F. Numerical Simulation for Mass Transfer Characteristics of CO2 Capture in a Rotating Packed Bed. Chem. Eng. Process. Process Intensif. 2016, 109, 68–79. [Google Scholar] [CrossRef]
  183. Liu, Y.; Luo, Y.; Chu, G.W.; Luo, J.Z.; Arowo, M.; Chen, J.F. 3D Numerical Simulation of a Rotating Packed Bed with Structured Stainless Steel Wire Mesh Packing. Chem. Eng. Sci. 2017, 170, 365–377. [Google Scholar] [CrossRef]
  184. Hu, D.D.; Shan, W.Y.; Zhu, G.W. Numerical Simulation of Counter-Current Flow Field in Double Packing Rotating Packed Bed. Key Eng. Mater. 2013, 561, 672–676. [Google Scholar] [CrossRef]
  185. Zhang, X.; Cheng, Y.; Nie, S.; Ji, H.; Liu, L. Simulation of Multiphase Flow of the Oil-Water Separation in a Rotating Packed Bed for Oil Purification. Math. Probl. Eng. 2013, 2013, 1–9. [Google Scholar] [CrossRef]
  186. Guo, T.Y.; Shi, X.; Chu, G.W.; Xiang, Y.; Wen, L.X.; Chen, J.F. Computational Fluid Dynamics Analysis of the Micromixing Efficiency in a Rotating-Packed-Bed Reactor. Ind. Eng. Chem. Res. 2016, 55, 4856–4866. [Google Scholar] [CrossRef]
  187. Xie, P.; Lu, X.; Ingham, D.; Ma, L.; Pourkashanian, M. Mass Transfer Characteristics of the Liquid Film Flow in a Rotating Packed Bed for CO2 Capture: A Micro-Scale CFD Analysis. Energy Procedia 2017, 142, 3407–3414. [Google Scholar] [CrossRef]
  188. Xie, P.; Lu, X.; Yang, X.; Ingham, D.; Ma, L.; Pourkashanian, M. Characteristics of Liquid Flow in a Rotating Packed Bed for CO2 Capture: A CFD Analysis. Chem. Eng. Sci. 2017, 172, 216–229. [Google Scholar] [CrossRef]
  189. Guo, T.-Y.; Cheng, K.-P.; Wen, L.-X.; Andersson, R.; Chen, J.-F. Three-Dimensional Simulation on Liquid Flow in a Rotating Packed Bed Reactor. Ind. Eng. Chem. Res. 2017, 56, 8169–8179. [Google Scholar] [CrossRef]
  190. Ouyang, Y.; Xiang, Y.; Gao, X.Y.; Li, W.L.; Zou, H.K.; Chu, G.W.; Chen, J.F. Micromixing Efficiency in a Rotating Packed Bed with Non-Newtonian Fluid. Chem. Eng. J. 2018, 354, 162–171. [Google Scholar] [CrossRef]
  191. Wu, W.; Luo, Y.; Chu, G.W.; Liu, Y.; Zou, H.K.; Chen, J.F. Gas Flow in a Multiliquid-Inlet Rotating Packed Bed: Three-Dimensional Numerical Simulation and Internal Optimization. Ind. Eng. Chem. Res. 2018, 57, 2031–2040. [Google Scholar] [CrossRef]
  192. Ouyang, Y.; Wang, S.; Xiang, Y.; Zhao, Z.; Wang, J.; Shao, L. CFD Analyses of Liquid Flow Characteristics in a Rotor-Stator Reactor. Chem. Eng. Res. Des. 2018, 134, 186–197. [Google Scholar] [CrossRef]
  193. Wang, Z.; Wu, X.; Yang, T.; Wang, S.; Liu, Z.; Dan, X. Droplet Characteristics of Rotating Packed Bed in H2S Absorption: A Computational Fluid Dynamics Analysis. Processes 2019, 7, 724. [Google Scholar] [CrossRef] [Green Version]
  194. Wu, W.; Luo, Y.; Chu, G.W.; Su, M.J.; Cai, Y.; Zou, H.K.; Chen, J.F. Liquid Flow Behavior in a Multiliquid-Inlet Rotating Packed Bed Reactor with Three-Dimensional Printed Packing. Chem. Eng. J. 2020, 386, 121537. [Google Scholar] [CrossRef]
  195. Ouyang, Y.; Xiang, Y.; Gao, X.-Y.; Zou, H.-K.; Chu, G.-W.; Agarwal, R.K.; Chen, J.-F. Micromixing Efficiency Optimization of the Premixer of a Rotating Packed Bed by CFD. Chem. Eng. Process.Process Intensif. 2019, 142, 107543. [Google Scholar] [CrossRef]
  196. Liu, Y.; Luo, Y.; Chu, G.W.; Larachi, F.; Zou, H.K.; Chen, J.F. Liquid Microflow inside the Packing of a Rotating Packed Bed Reactor: Computational, Observational and Experimental Studies. Chem. Eng. J. 2020, 386, 121134. [Google Scholar] [CrossRef]
  197. Xu, Y.C.; Li, Y.B.; Liu, Y.Z.; Luo, Y.; Chu, G.W.; Zhang, L.L.; Chen, J.F. Liquid Jet Impaction on the Single-Layer Stainless Steel Wire Mesh in a Rotating Packed Bed Reactor. AIChE J. 2019, 65. [Google Scholar] [CrossRef]
  198. Wang, J.Q.; Ouyang, Y.; Li, W.L.; Esmaeili, A.; Xiang, Y.; Chen, J.F. CFD Analysis of Gas Flow Characteristics in a Rotating Packed Bed with Randomly Arranged Spherical Packing. Chem. Eng. J. 2020, 385, 123812. [Google Scholar] [CrossRef]
  199. Harmsen, G.J. Reactive Distillation: The Front-Runner of Industrial Process Intensification. A Full Review of Commercial Applications, Research, Scale-up, Design and Operation. Chem. Eng. Process. Process Intensif. 2007, 46, 774–780. [Google Scholar] [CrossRef] [Green Version]
  200. Khang, S.J.; Levenspiel, O. New Scale-up and Design Method for Stirrer Agitated Batch Mixing Vessels. Chem. Eng. Sci. 1976, 31, 569–577. [Google Scholar] [CrossRef]
  201. Kapic, A.; Heindel, T.J. Correlating Gas-Liquid Mass Transfer in a Stirred-Tank Reactor. Chem. Eng. Res. Des. 2006, 84, 239–245. [Google Scholar] [CrossRef]
  202. Gui, H.; Li, X. Removing Ammonia from Skim by Air Stripping with Rotating Packed Bed. Chin. J. Chem. Eng. 2019, 27, 528–533. [Google Scholar] [CrossRef]
  203. Vivian, J.E.; Brian, P.L.T.; Krukonis, V.J. The Influence of Gravitational Force on Gas Absorption in a Packed Column. AIChE J. 1965, 11, 1088–1091. [Google Scholar] [CrossRef]
  204. Chakravarti, S.A.; Shenoy, U.V. Dimensional Analysis of Heat and Mass Transfer Correlations Using Micro-and Macro Scales. Chem. Eng. Commun. 1993, 124, 29–37. [Google Scholar] [CrossRef]
  205. Shivhare, M.K.; Rao, D.P.; Kaistha, N. Mass Transfer Studies on Split-Packing and Single-Block Packing Rotating Packed Beds. Chem. Eng. Process. Process Intensif. 2013, 71, 115–124. [Google Scholar] [CrossRef]
  206. Keyvani, M.; Gardner, N.C. Operating Characteristics of Rotating Beds. Chem. Eng. Prog. 1989, 85, 48–52. [Google Scholar]
  207. Agarwal, L.; Pavani, V.; Rao, D.P.; Kaistha, N. Process Intensification in HiGee Absorption and Distillation: Design Procedure and Applications. Ind. Eng. Chem. Res. 2010, 49, 10046–10058. [Google Scholar] [CrossRef]
  208. Jiang, X.; Liu, Y.; Gu, M. Absorption of Sulphur Dioxide with Sodium Citrate Buffer Solution in a Rotating Packed Bed. Chinese J. Chem. Eng. 2011, 19, 687–692. [Google Scholar] [CrossRef]
  209. Lee, J.; Kolawole, T.; Attidekou, P. Carbon Capture from a Simulated Flue Gas Using a Rotating Packed Bed Adsorber and Mono Ethanol Amine (MEA). Energy Procedia 2017, 114, 1834–1840. [Google Scholar] [CrossRef]
Figure 1. RPB categories.
Sustainability 13 08046 g001
Figure 2. RPB modeling approaches.
Sustainability 13 08046 g002
Figure 3. Approaches to the modeling of hydrodynamic parameters.
Sustainability 13 08046 g003
Figure 4. Liquid flow patterns in an RPB.
Sustainability 13 08046 g004
Figure 5. Effective interfacial surface area determination methods.
Sustainability 13 08046 g005
Figure 6. Total power consumption in different sections of RPBs.
Sustainability 13 08046 g006
Publisher’s Note: MDPI stays neutral with regard to jurisdictional claims in published maps and institutional affiliations.

