
Mobility Trends before and after the Pandemic Outbreak: Analyzing the Metropolitan Area of Barcelona through the Lens of Equality and Sustainability


Abstract
:1. Introduction
1.1. Background
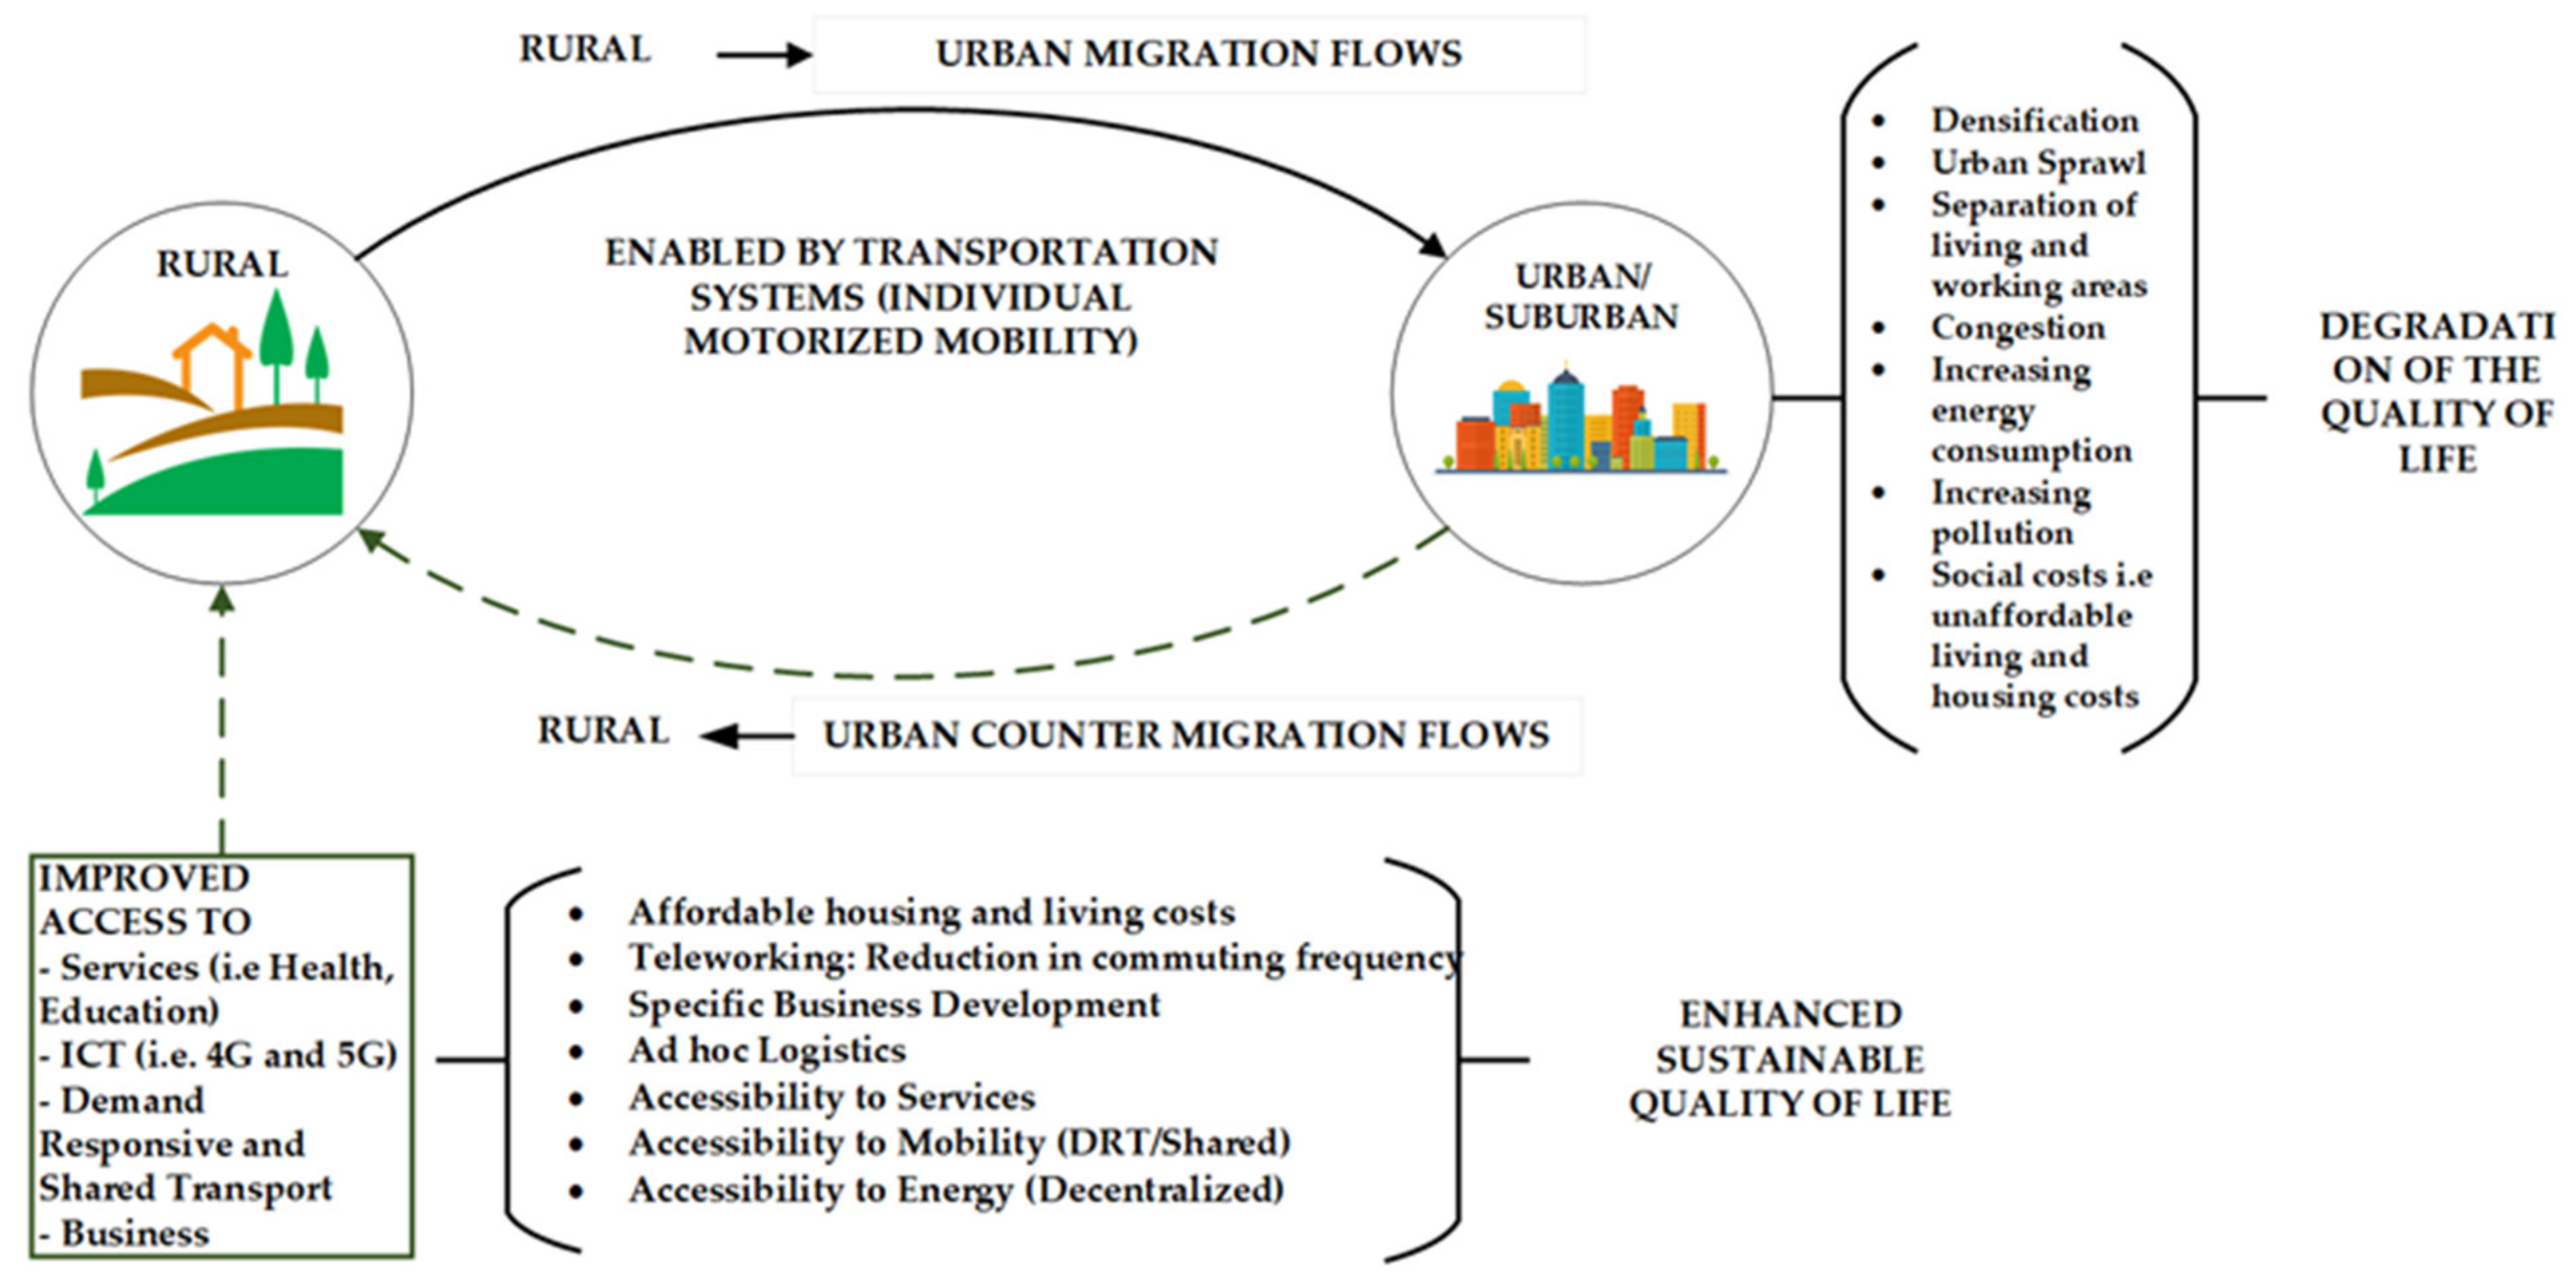
1.2. Cities and Migration Impacts
1.3. Consequences of the COVID-19 Pandemic
2. Materials and Methods
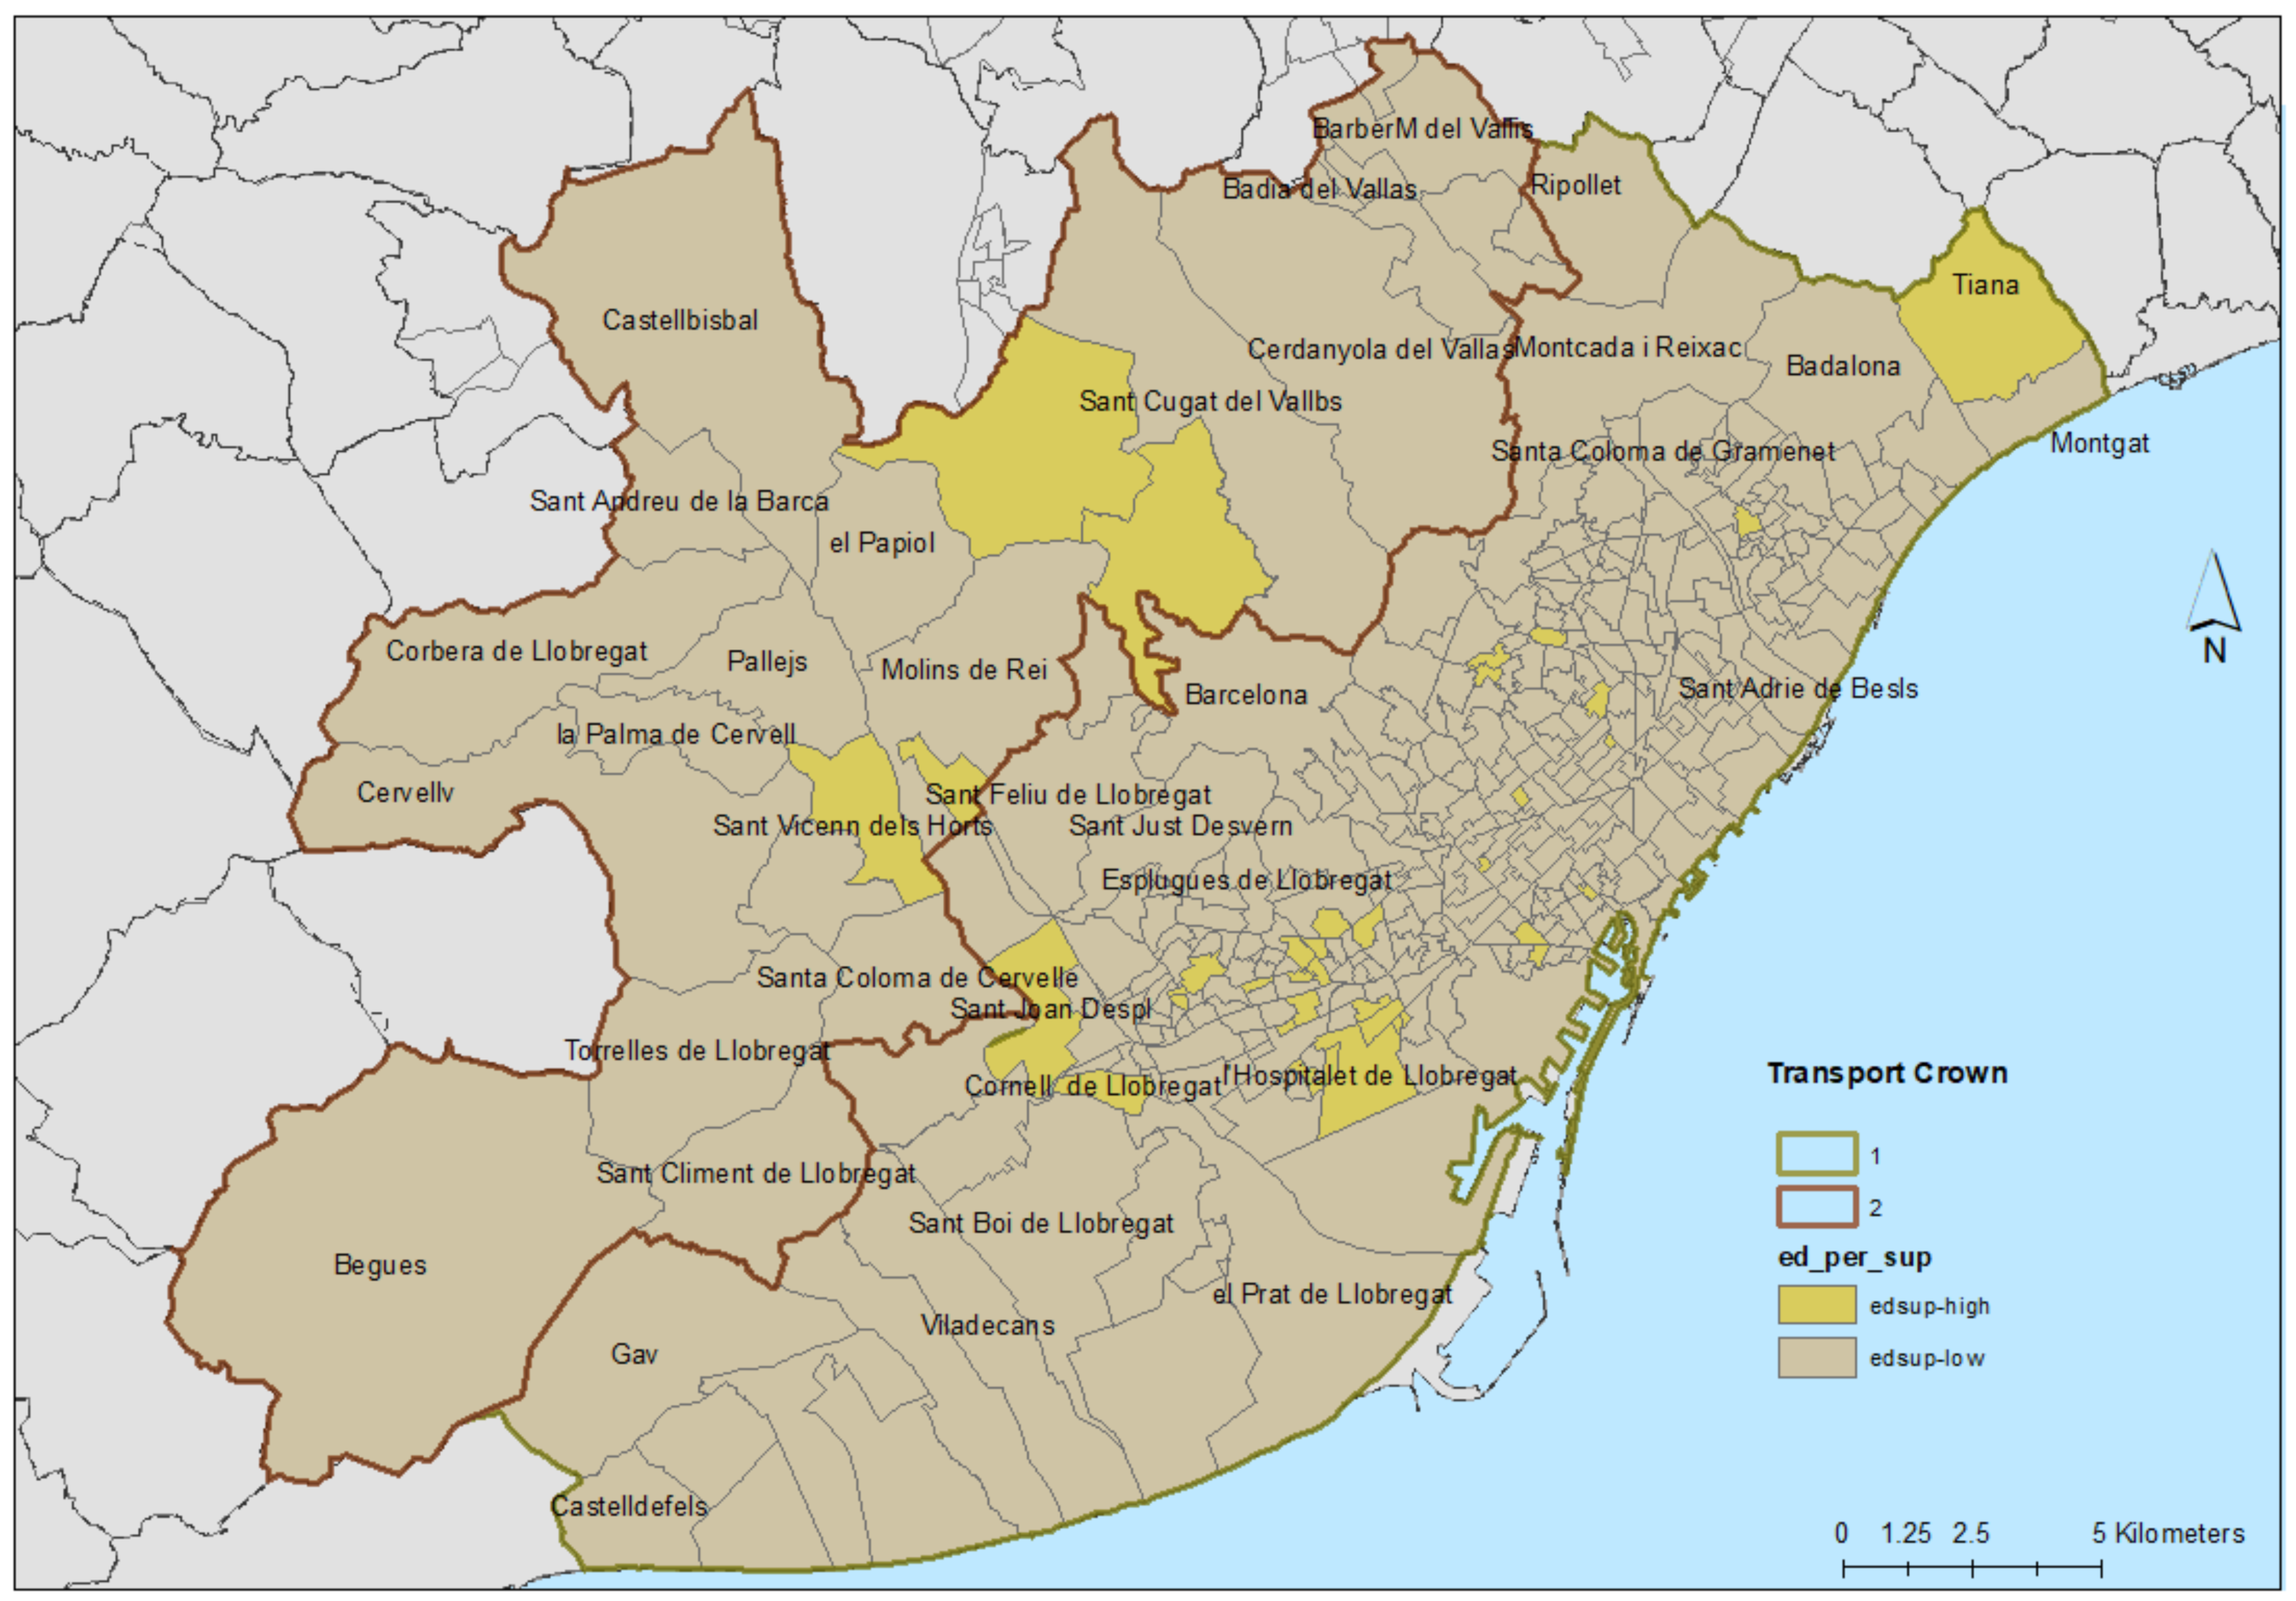
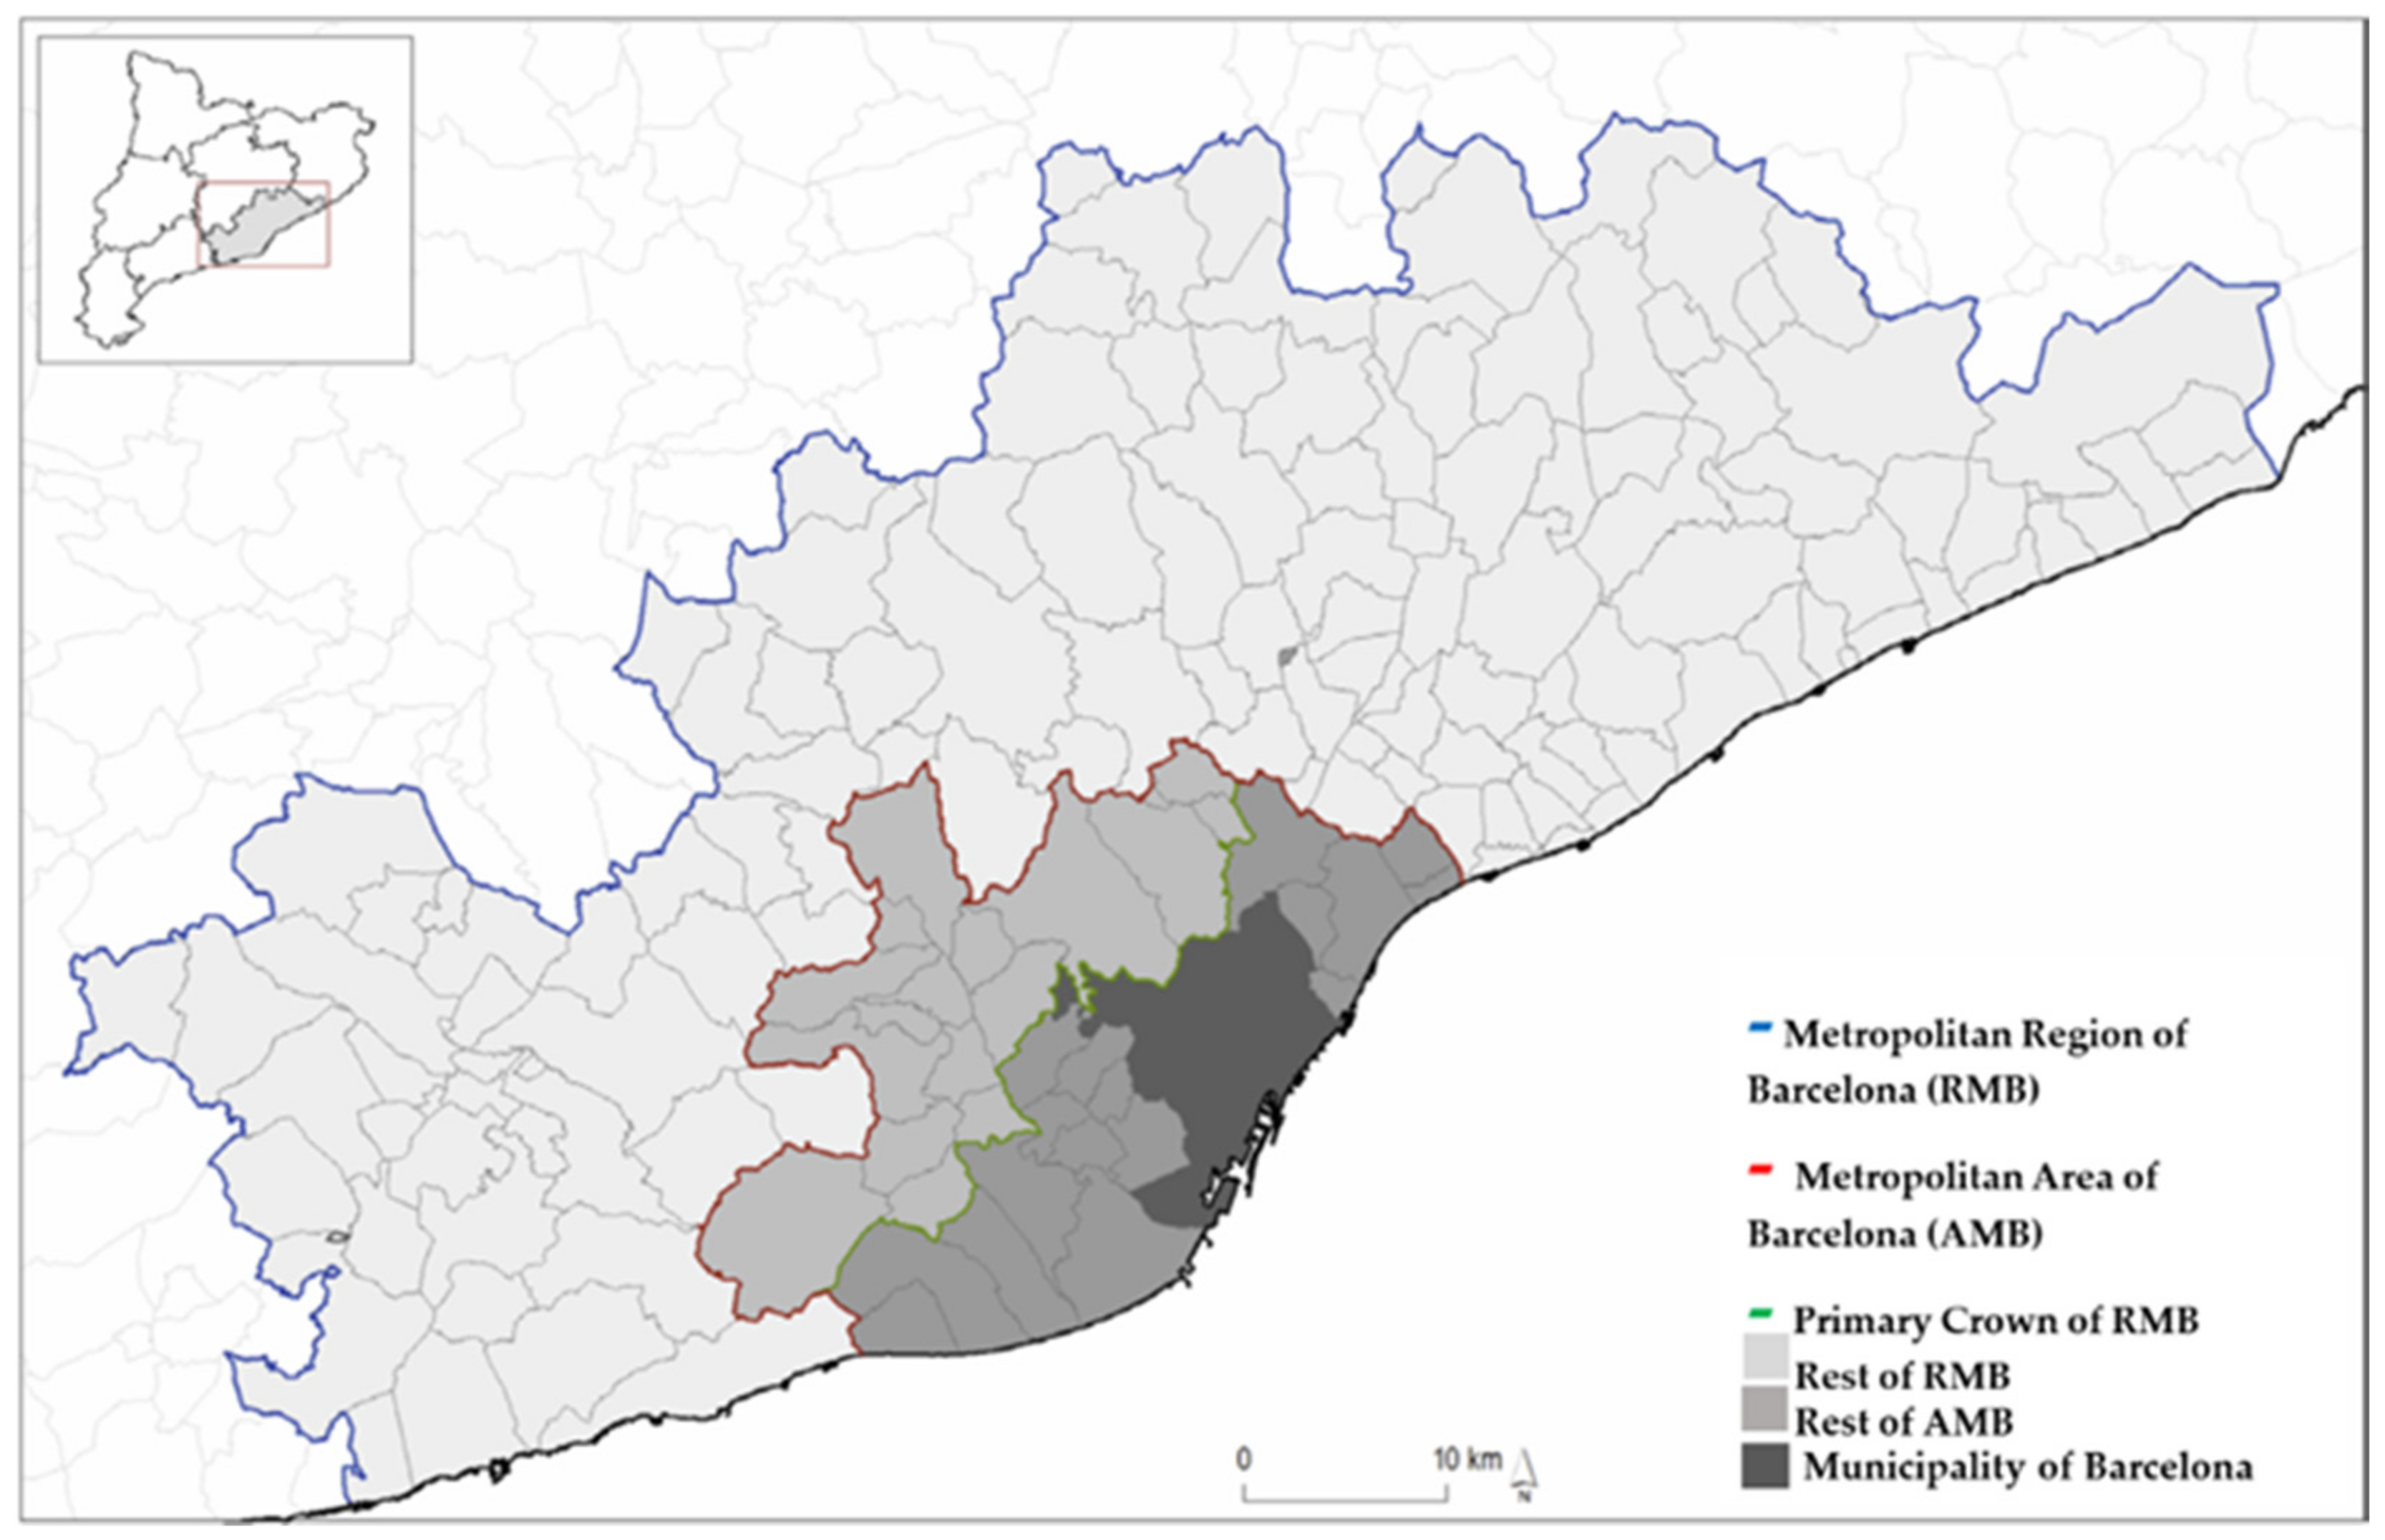
2.1. The Case Study of Barcelona Metropolitan Area
2.1.1. Migration as a Result of Technological Changes
- Barcelona is smoothly losing population, breaking the growing trend in recent years.
- Emigration is higher than immigration.
- Emigrants from Barcelona choose as destination small municipalities outside the Metropolitan Region.
- Emigration flows are originated in city zones with medium-high and high incomes.
- The destination municipalities are namely of fewer than 5000 inhabitants, and the emigration is homogeneous from all districts.
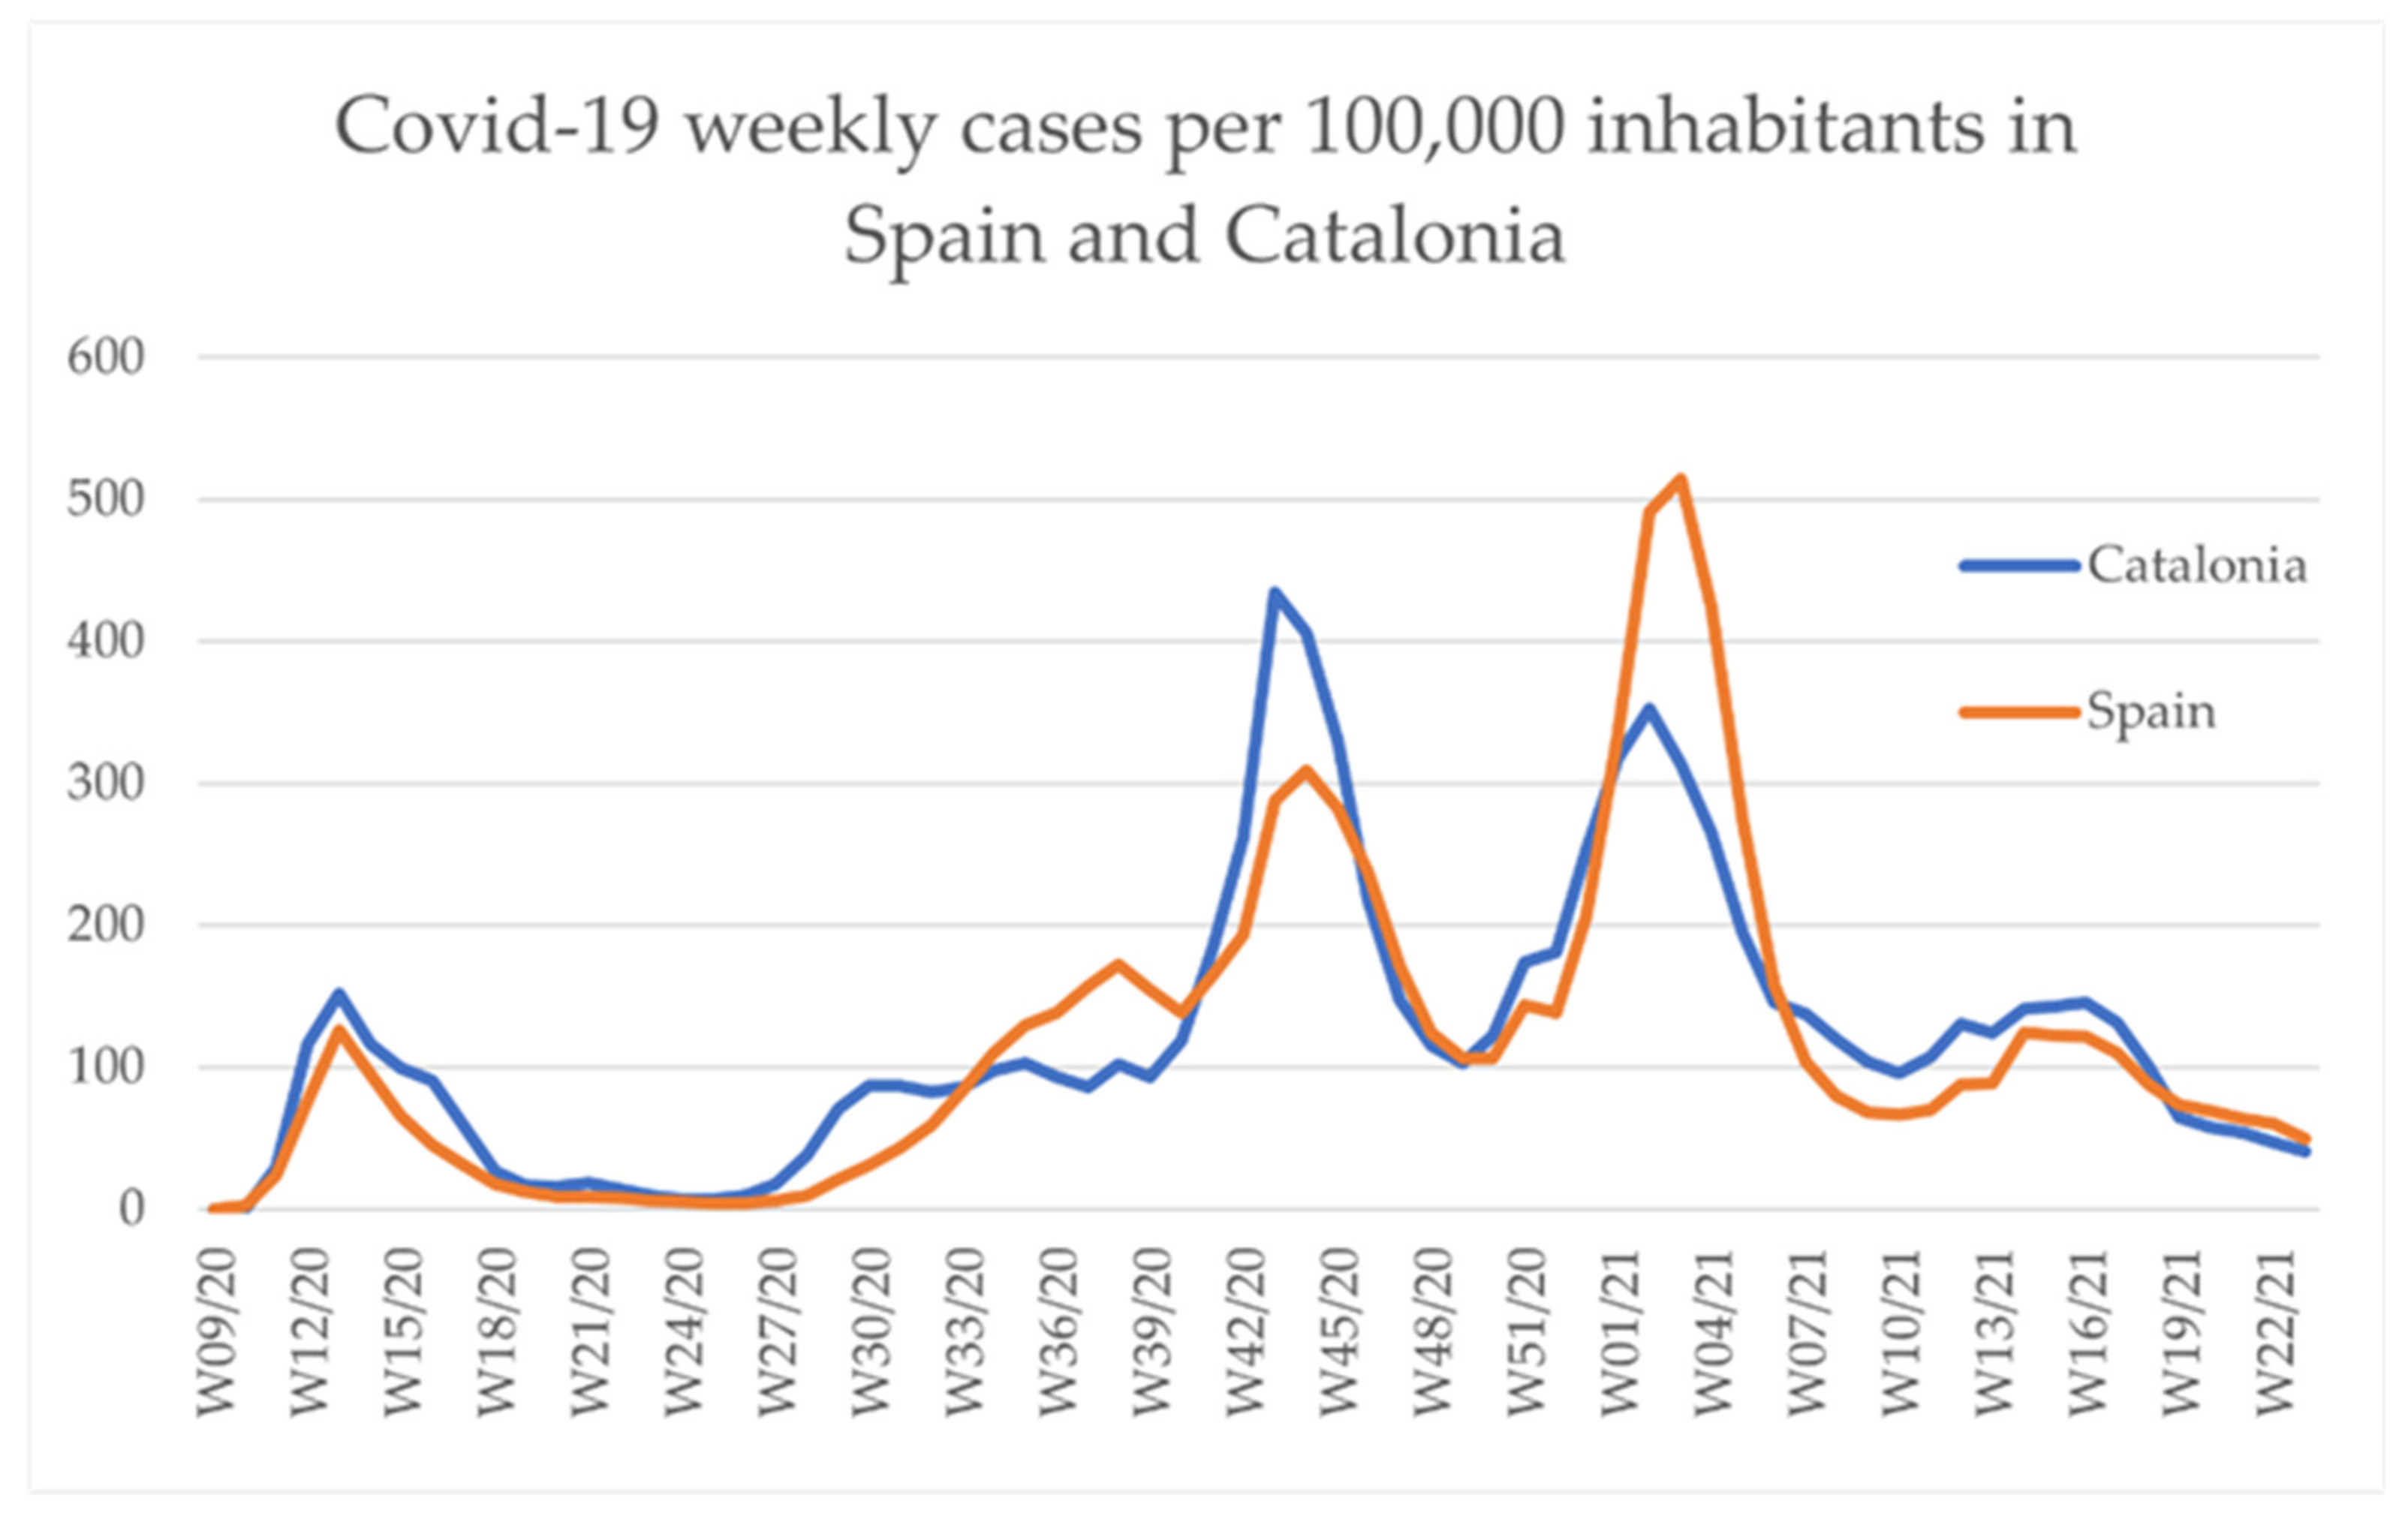
2.1.2. The COVID-19 Impact
2.2. Methodological Approach
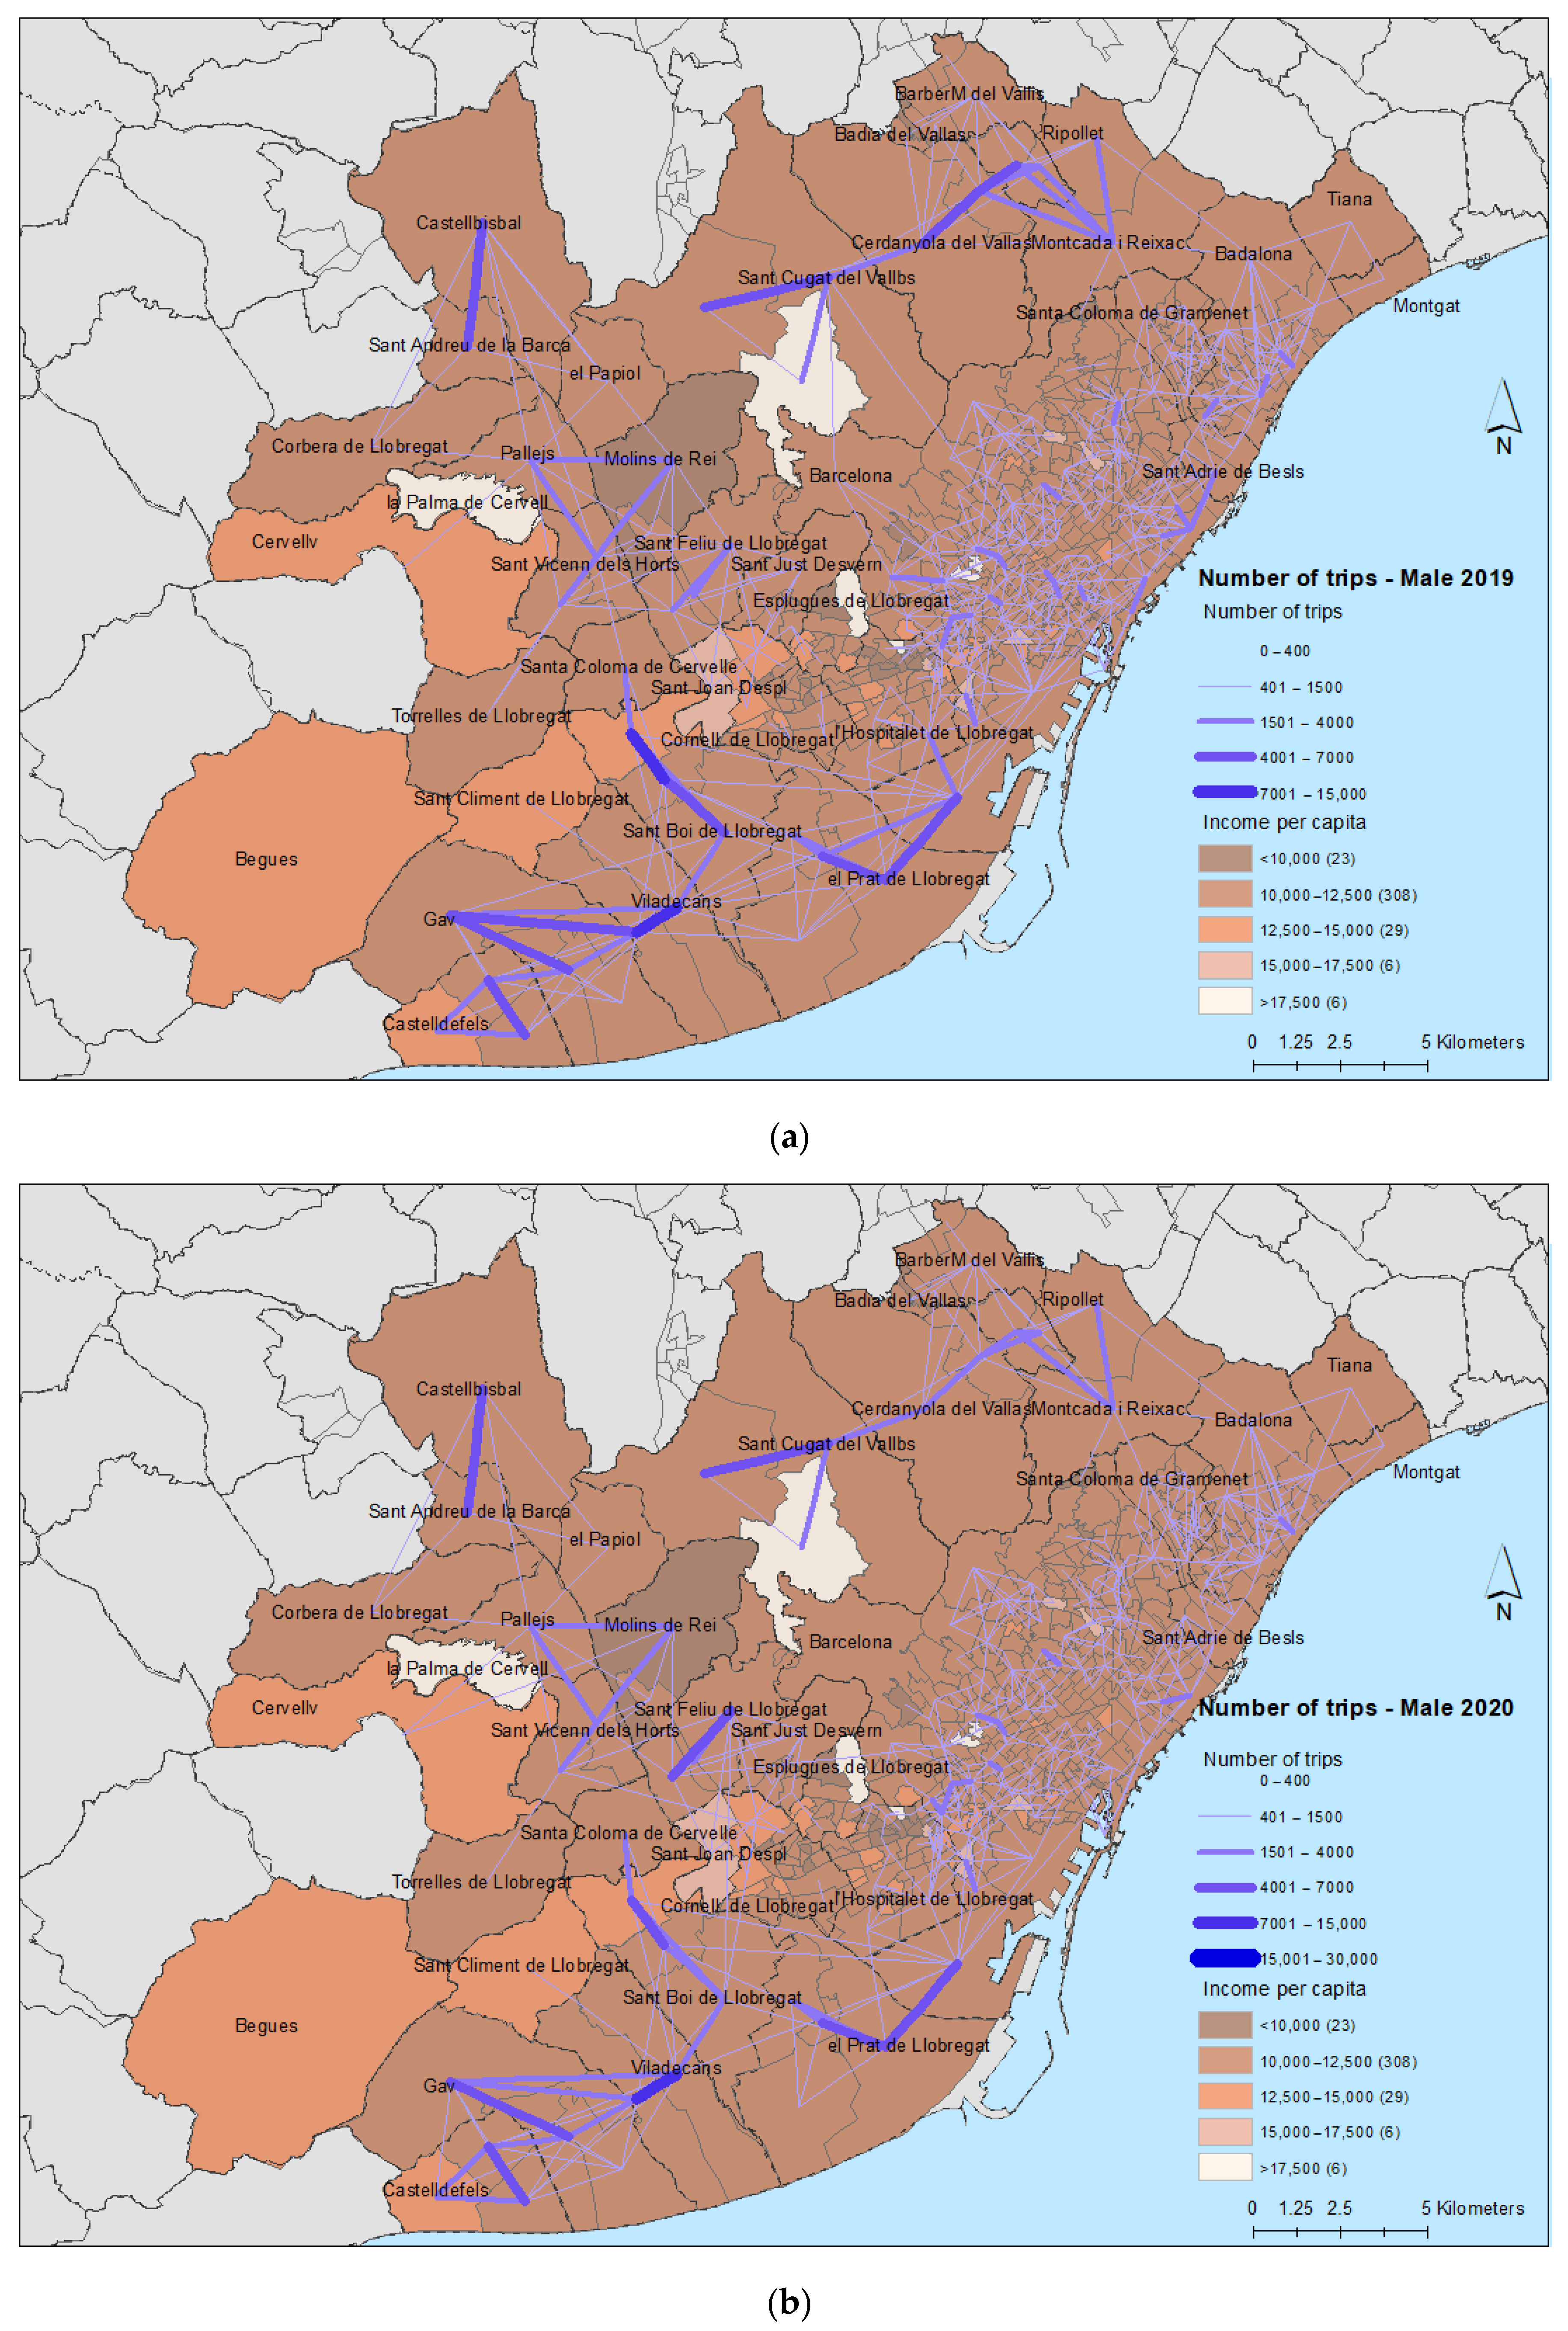
- OD matrices produced by NOMMON (2019–2020): They provide an expanded number of trips segmented by daily periods, gender, age group (in four groups defined as 16–29, 30–44, 45–64, and >64), purpose on origin and purpose on destination (H-home, W-work, NF-casual, and O-others) and TAZ-EMO origin, TAZ-EMO destination and TAZ-EMO residential in the Metropolitan Region of Barcelona (AMB). Neither trip travel times, nor lengths are included. The TAZ-EMO Transportation Analysis Zones (TAZ-EMO) are defined by transport authorities. The study area (AMB) is split into 372 TAZ-EMO and the Broad the Metropolitan Region of Barcelona (RMB) into 582 TAZ-EMO, but only 14 according to NOMMON macrozones are included in the RMB subarea out of AMB. NOMMON is a technological company that elaborates OD matrices from smartphone data of Orange cellphone customers. The NOMMON 2020 data collection was extracted in June 2020 (see Figure 3, week 23–27).
- EMEF 2018–2019: These are traditional mobility surveys that analyze the mobility of residents in a working day in the broad Metropolitan Region of Barcelona (RMB) for citizens aged 16 and over. The spatial granularity is at the municipality level, but Barcelona is divided into districts (10), leading to a total of 296 macrozones, only 45 of them in the AMB study area. The approach given in the analysis of this mobility is twofold: firstly, characterization of mobility in general made by the resident population; and secondly, analysis of the territorial relations that are established based on the origins and destinations of the trips. The information collected for each journey refers to the origin and destination macrozones, purpose, mode, travel start time and duration (min), vehicle use, parking use, etc. A second part of the survey provides information on the assessment of general elements related to public transport.
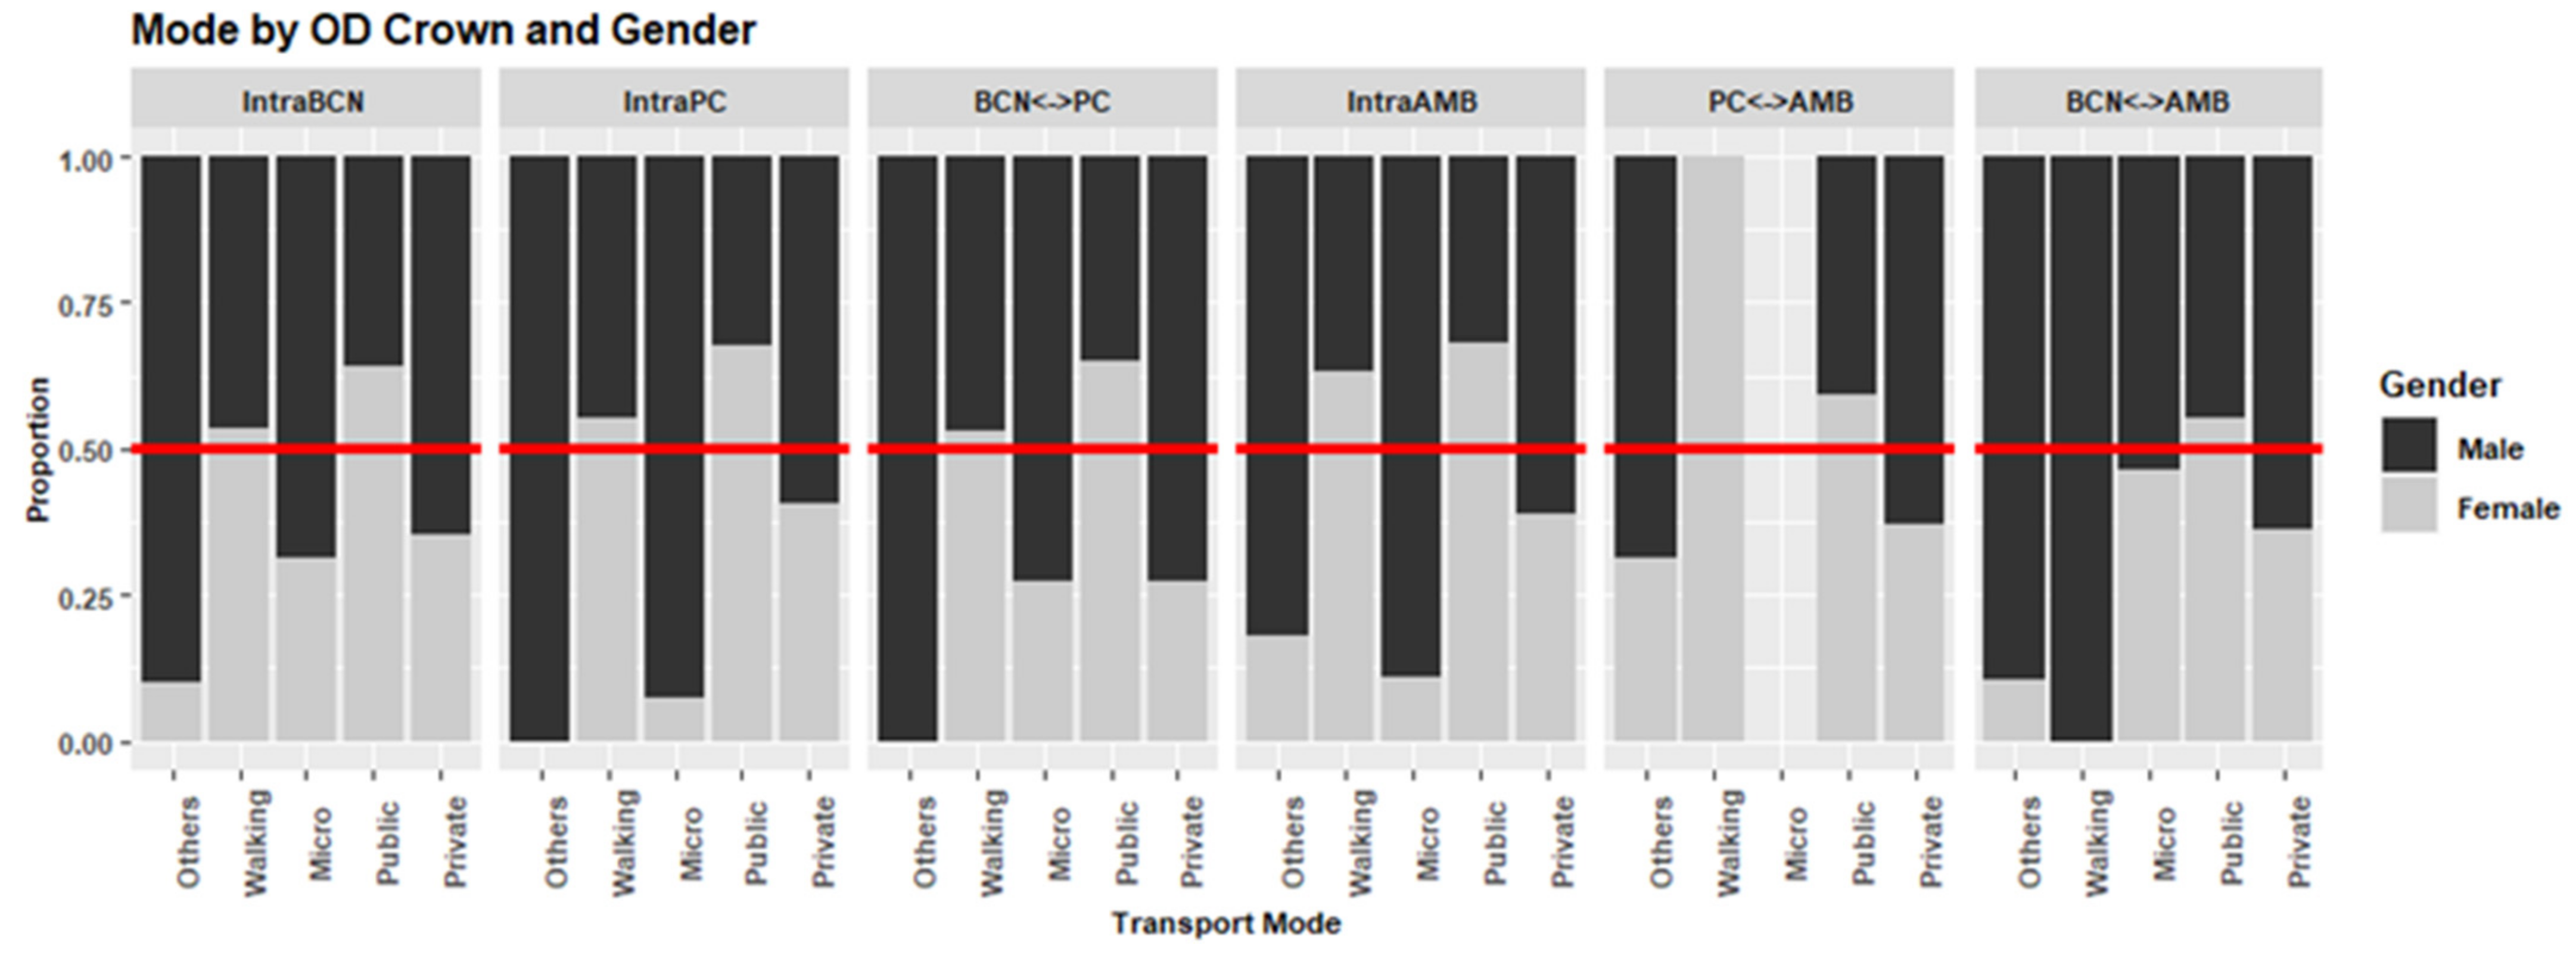
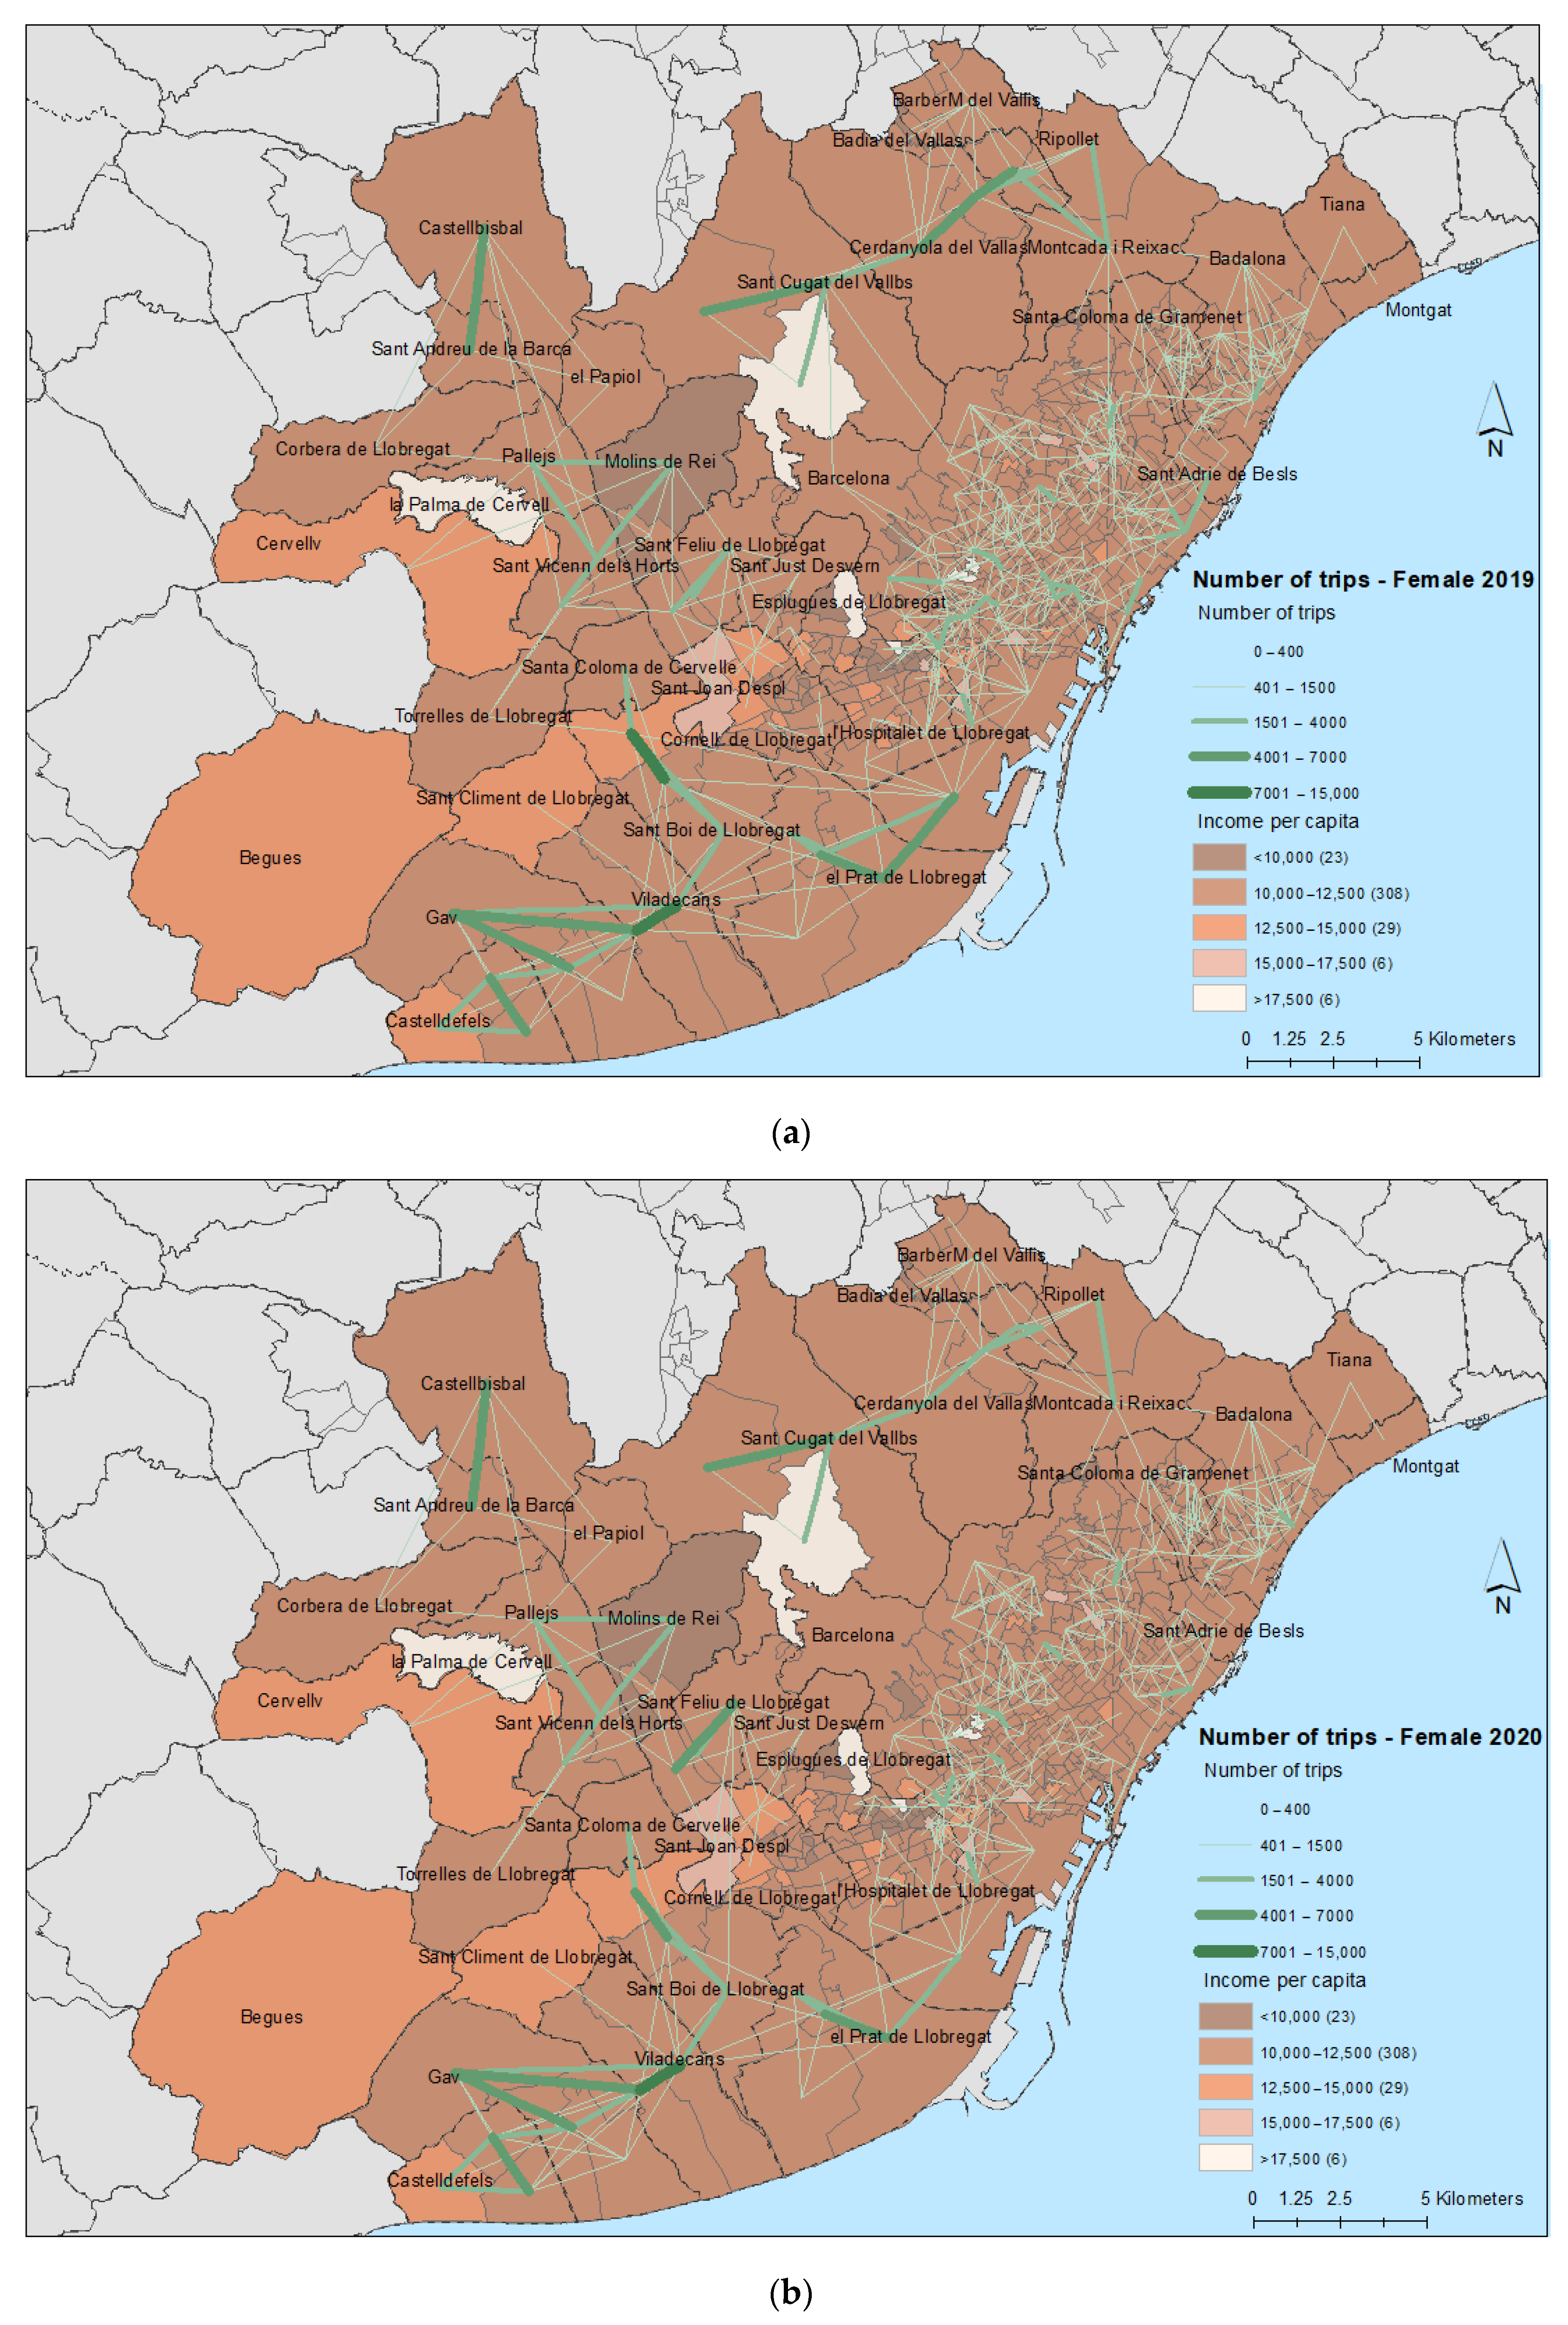
3. Results
4. Discussion
5. Conclusions
Author Contributions
Funding
Institutional Review Board Statement
Informed Consent Statement
Data Availability Statement
Acknowledgments
Conflicts of Interest
References
- Miralles-Guasch, C.; Frontera, À.C. Movilidad y Transporte. Opciones Políticas Para la Ciudad. Available online: https://www.fundacionalternativas.org/laboratorio/documentos/documentos-de-trabajo/movilidad-y-transporte-opciones-politicas-para-la-ciudad (accessed on 27 May 2021).
- Rodrigue, J.P.; Comtois, C.; Slack, B. The Geography of Transport Systems; Taylor and Francis: London, UK, 2016; ISBN 9781317210108. [Google Scholar]
- Lyons, G.; Mokhtarian, P.; Dijst, M.; Böcker, L. The dynamics of urban metabolism in the face of digitalization and changing lifestyles: Understanding and influencing our cities. Resour. Conserv. Recycl. 2018, 132, 246–257. [Google Scholar] [CrossRef] [Green Version]
- Mejía-Dorantes, L.; Soto Villagrán, P. A review on the influence of barriers on gender equality to access the city: A synthesis approach of Mexico City and its Metropolitan Area. Cities 2020, 96. [Google Scholar] [CrossRef]
- Levy, C. Travel choice reframed: “Deep distribution” and gender in urban transport. Environ. Urban. 2013, 25, 47–63. [Google Scholar] [CrossRef]
- Vacchelli, E.; Kofman, E. Towards an inclusive and gendered right to the city. Cities 2018, 76, 1–3. [Google Scholar] [CrossRef]
- Hayden, D. What would a non-sexist city be like? Speculations on housing, urban design, and human work on JSTOR. Signs 1980, 5, 18. [Google Scholar] [CrossRef]
- Jirón, P.; Carrasco, J.A.; Rebolledo, M. Observing gendered interdependent mobility barriers using an ethnographic and time use approach. Transp. Res. Part A Policy Pract. 2020, 140, 204–214. [Google Scholar] [CrossRef]
- Joelsson, T.; Lindkvist Scholten, C. Integrating Gender into Transport Planning: From One to Many Tracks; Palgrave Macmillan: Cham, Germany, 2019; ISBN 9783030050429. [Google Scholar]
- Abduljabbar, R.L.; Liyanage, S.; Dia, H. The role of micro-mobility in shaping sustainable cities: A systematic literature review. Transp. Res. Part D Transp. Environ. 2021, 92, 102734. [Google Scholar] [CrossRef]
- Christoforou, Z.; Gioldasis, C.; de Bortoli, A.; Seidowsky, R. Who is using e-scooters and how? Evidence from Paris. Transp. Res. Part D Transp. Environ. 2021, 92, 102708. [Google Scholar] [CrossRef]
- Christidis, P.; Christodoulou, A.; Navajas-Cawood, E.; Ciuffo, B. The post-pandemic recovery of transport activity: Emerging mobility patterns and repercussions on future evolution. Sustainability 2021, 13, 6359. [Google Scholar] [CrossRef]
- Ceccato, R.; Rossi, R.; Gastaldi, M. Travel demand prediction during COVID-19 pandemic: Educational and working trips at the university of Padova. Sustainability 2021, 13, 6596. [Google Scholar] [CrossRef]
- Politis, I.; Georgiadis, G.; Nikolaidou, A.; Kopsacheilis, A.; Fyrogenis, I.; Sdoukopoulos, A.; Verani, E.; Papadopoulos, E. Mapping travel behavior changes during the COVID-19 lock-down: A socioeconomic analysis in Greece. Eur. Transp. Res. Rev. 2021, 13, 1–19. [Google Scholar] [CrossRef]
- Politis, I.; Georgiadis, G.; Papadopoulos, E.; Fyrogenis, I.; Nikolaidou, A.; Kopsacheilis, A.; Sdoukopoulos, A.; Verani, E. COVID-19 lockdown measures and travel behavior: The case of Thessaloniki, Greece. Transp. Res. Interdiscip. Perspect. 2021, 10, 100345. [Google Scholar] [CrossRef]
- Lefebvre, H.; Kofman, E.; Lebas, E. Writings on Cities; Wiley-Blackwell: Hoboken, NJ, USA, 1996; ISBN 978-0-631-19188-9. [Google Scholar]
- Bamberger, M.; Lebo, J.; Gwilliam, K.; Gannon, C. Gender and Transport: A Rationale for Action; World Bank: Washington, DC, USA, 1999. [Google Scholar]
- Cubells, J.; Marquet, O.; Miralles-Guasch, C. Gender and age differences in metropolitan car use. Recent gender gap trends in private transport. Sustainability 2020, 12, 7286. [Google Scholar] [CrossRef]
- Cresswell, T. Gendering Mobility: Insights into the Construction of Spatial Concepts. In Gendered Mobilities; Uteng, T., Cresswell, T., Eds.; Routledge Taylor and Francis Group: London, UK, 2008; pp. 97–112. [Google Scholar]
- Eurostat How do Women and Men Use Their Time-Statistics-Statistics Explained. Available online: https://ec.europa.eu/eurostat/statistics-explained/index.php?title=How_do_women_and_men_use_their_time_-_statistics&oldid=463738#Overview (accessed on 25 May 2021).
- European Institute for Gender Equality Browse Gender Statistics | Gender Statistics Database|European Institute for Gender Equality. Available online: https://eige.europa.eu/gender-statistics/dgs/data-talks/what-lies-behind-gender-pay-gap (accessed on 21 May 2021).
- Hanson, S. Gender and mobility: New approaches for informing sustainability. Gend. Place Cult. 2010, 17, 5–23. [Google Scholar] [CrossRef]
- United Nations Department of Economic and Social Affairs (UN DESA). World’s Population Increasingly Urban with more than Half Living in Urban Areas. Available online: https://www.un.org/en/development/desa/news/population/world-urbanization-prospects-2014.html (accessed on 21 May 2021).
- Final Report Summary—LIVINGRAIL (Living in a Sustainable World Focused on Electrified Rail) | Report Summary | LIVINGRAIL | FP7 | CORDIS | European Commission. Available online: https://cordis.europa.eu/project/id/314036/reporting/de (accessed on 21 May 2021).
- Doll, C.; Mejia-Dorantes, L.; Dönitz, E. Applying visioning, roadmapping and simulation techniques for planning the european railway sector-results from the livingrail study. In Proceedings of the Transportation Research Board Annual 95th Meeting, Washington, DC, USA, 10–14 January 2016. [Google Scholar]
- European Commission Transport Emissions. Climate Action; European Commission: Brussels, Belgium, 2014. [Google Scholar]
- Faulin, J.; Grasman, S.E.; Juan, A.A.; Hirsch, P. Sustainable Transportation and Smart Logistics: Decision-Making Models and Solutions; Elsevier: Amsterdam, The Netherlands, 2018; ISBN 9780128142431. [Google Scholar]
- Paramati, S.R.; Roca, E. Does tourism drive house prices in the OECD economies? Evidence from augmented mean group estimator. Tour. Manag. 2019, 74, 392–395. [Google Scholar] [CrossRef]
- Fahra, L.; OHCHR. The Human Right to Adequate Housing. Available online: https://www.ohchr.org/EN/Issues/Housing/Pages/AboutHRandHousing.aspx (accessed on 21 May 2021).
- Lerondeau, M. Le Développement du Télétravail Prépare-t-il un Exode Urbain ? Available online: https://www.lafabriquedelacite.com/publications/le-developpement-du-teletravail-prepare-t-il-un-exode-urbain/ (accessed on 25 May 2021).
- El éxodo al Revés: De la Ciudad al Campo | La Estela de la Pandemia. Available online: https://elpais.com/masterdeperiodismo/la-estela-de-la-pandemia/2020-08-02/el-exodo-al-reves-de-la-ciudad-al-campo.html?event_log=oklogin&prod=REGINCOG&o=incognito (accessed on 25 May 2021).
- Marsch, S. Escape to the Country: How Covid is Driving an Exodus from Britain’s Cities | Coronavirus. Available online: https://www.theguardian.com/world/2020/sep/26/escape-country-covid-exodus-britain-cities-pandemic-urban-green-space (accessed on 25 May 2021).
- Scholz, K.-A. Are Berlin Residents Packing up and Leaving the City to Flee the Coronavirus? Available online: https://www.dw.com/en/berlin-coronavirus/a-54471392 (accessed on 25 May 2021).
- Ahrendt, D.; Cabrita, J.; Clerice, E.; Hurley, J.; Leoncikas, T.; Mascherini, M.; Riso, S.; Sándor, E. Living, Working and COVID-19 | Eurofound. Available online: https://www.eurofound.europa.eu/publications/report/2020/living-working-and-covid-19 (accessed on 28 May 2021).
- European Institute for Gender Equality. Available online: https://eige.europa.eu/ (accessed on 21 May 2021).
- Essential Workers | EIGE. Available online: https://eige.europa.eu/covid-19-and-gender-equality/essential-workers (accessed on 22 May 2021).
- Madgavkar, A.; White, O.; Krishnan, M.; Mahajan, D.; Azcue, X. COVID-19 and Gender Equality: Countering the Regressive Effects; McKinsey Global Institute: New York, NY, USA, 2020. [Google Scholar]
- Territori-Àrea Metropolitana de Barcelona. Available online: https://www.amb.cat/s/web/territori/territori.html (accessed on 21 May 2021).
- Annual Indicators. Average Expenditure by Households. Base. 2017. Available online: https://www.idescat.cat/indicadors/?id=anuals&n=10423&lang=en&t=201700 (accessed on 25 May 2021).
- IDESCAT Extended results on commuting. Available online: https://www.idescat.cat/mobilitat/?n=1&lang=en&t=2001 (accessed on 27 May 2021).
- Base Municipal. Institut Cartogràfic i Geològic de Catalunya. Available online: https://www.icgc.cat/ca/Descarregues/Cartografia-vectorial/Base-municipal (accessed on 25 May 2021).
- Perez, N.; Argomedo, D.A. La Mobilitat Quotidiana des d’una Perspectiva de Gènere-IERMB. Available online: https://iermb.uab.cat/ca/estudi/la-mobilitat-quotidiana-des-duna-perspectiva-de-genere/ (accessed on 21 May 2021).
- Marquet, O.; Miralles-Guasch, C. Walking short distances. The socioeconomic drivers for the use of proximity in everyday mobility in Barcelona. Transp. Res. Part A Policy Pract. 2014, 70, 210–222. [Google Scholar] [CrossRef]
- Oficina Municipal de Datos | Barcelona Ciudad Digital. Available online: https://ajuntament.barcelona.cat/digital/es/transformacion-digital/city-data-commons/oficina-municipal-de-datos (accessed on 28 May 2021).
- Instituto de la Mujer y Para la Igualdad de Oportunidades-Noticias y Novedades. Available online: https://www.inmujeres.gob.es/actualidad/noticias/2020/Mayo/InformeCOVID19.htm (accessed on 22 May 2021).
- Statistical Institute of Catalonia. Segregation and quality of work indicators. In Gender Equality Index; Statistical Institute of Catalonia: Barcelona, Spain, 2018. [Google Scholar]
- Productos y Servicios/Publicaciones/Colección Cifras INE. Available online: https://www.ine.es/ss/Satellite?L=es_ES&c=INECifrasINE_C&cid=1259952649680&p=1254735116567&pagename=ProductosYServicios%2FINECifrasINE_C%2FPYSDetalleCifrasINE (accessed on 21 May 2021).
- How Usual Is It to Work from Home?—Products Eurostat News-Eurostat. Available online: https://ec.europa.eu/eurostat/web/products-eurostat-news/-/ddn-20200206-1 (accessed on 22 May 2021).
- Pérez, G.R. La Pandemia Impulsa el Teletrabajo en España: Casi Tres Millones de Empleados a Distancia; El Pais: Madrid, Spain, 2021. [Google Scholar]
- Checa, J.; Martín, J.; López, J.; Nello, O. Those who cannot stay at home: Urban mobility and social vulnerability in Barcelona during the COVID-19 pandemic. Bol. Asoc. Geogr. Esp. 2020. [Google Scholar] [CrossRef]
- Sharifi, A.; Khavarian-Garmsir, A.R. The COVID-19 pandemic: Impacts on cities and major lessons for urban planning, design, and management. Sci. Total Environ. 2020, 749, 142391. [Google Scholar] [CrossRef] [PubMed]
- Cómo se Mueve Alemania: Datos Móviles Para Mejorar Planes de Transporte. Available online: https://empresas.blogthinkbig.com/planes-movilidad-alemania/ (accessed on 22 May 2021).
- EMEF Daily Mobility Data in Metropolitan Area of Barcelona (Enquesta de Mobilitat en Dia Feiner-EMEF). Available online: https://www.amtu.cat/enquestes-de-mobilitat-interurbana/1746-emef-2015 (accessed on 11 May 2021).
- Montero, L.; Ros-Roca, X.; Herranz, R.; Barceló, J. Fusing mobile phone data with other data sources to generate input OD matrices for transport models. Transp. Res. Procedia 2019, 37, 417–424. [Google Scholar] [CrossRef]
- PTV AG VISUM 2020. Available online: https://www.ptvgroup.com/fileadmin/user_upload/Products/PTV_Visum/Documents/Release-Highlights/Overview_Visum2020.pdf (accessed on 22 May 2021).
- R: The R Project for Statistical Computing. Available online: https://www.r-project.org/ (accessed on 22 May 2021).
- RStudio. Open Source & Professional Software for Data Science Teams—RStudio. Available online: https://www.rstudio.com/ (accessed on 22 May 2021).
- CIVITAS Policy Note: Gender Equality and Mobility: Mind the Gap! | CIVITAS. Available online: http://civitas.eu/content/civitas-policy-note-gender-equality-and-mobility-mind-gap (accessed on 28 May 2021).
- Idescat. Survey on Living Conditions. Renda Mitjana Neta Anual per Unitat de Consum Després de Pensions Però Abans D’altres Transferències Socials per Edat. Catalunya. Available online: https://idescat.cat/pub/?id=ecv&n=9349&lang=en (accessed on 22 May 2021).
- Lee, J.N.; Mahmud, M.; Morduch, J.; Ravindran, S.; Shonchoy, A.S. Migration, externalities, and the diffusion of COVID-19 in South Asia☆. J. Public Econ. 2021, 193. [Google Scholar] [CrossRef]
- Barcelona Analitza el Moviment Migratori en Temps de Pandèmia: Servei de Premsa. Available online: https://ajuntament.barcelona.cat/premsa/2021/02/27/barcelona-analitza-el-moviment-migratori-en-temps-de-pandemia/ (accessed on 28 May 2021).


| Type of Dataset | Travel Survey | Cell Phone Data |
|---|---|---|
| Monetary and time costs | Higher | Lower |
| Personal information | Detailed personal, educational level, socioeconomic. | Gender, age (in groups 16–29, 30–44, 45–64, 65+) |
| Sample size | Sample which needs to be expanded | approx. 40% trips, expanded to population |
| Empty cells | 80% | 20% |
| Travel choices | Yes | No |
| Opinion | Yes | No |
| Travel purpose | Yes (detailed) | Yes; but broader |
| Number of trips | Yes | No |
| Trip Travel time | Yes | No |
| Trips time slot | Yes | Yes |
| Variable Name | Description |
|---|---|
| mun.res | Residential TAZ-EMO |
| mun.ori | Trip TAZ-EMO origin |
| mun.des | Trip TAZ-EMO destination |
| franja | Daily period: 7–10, 13–15, 17–20 and others |
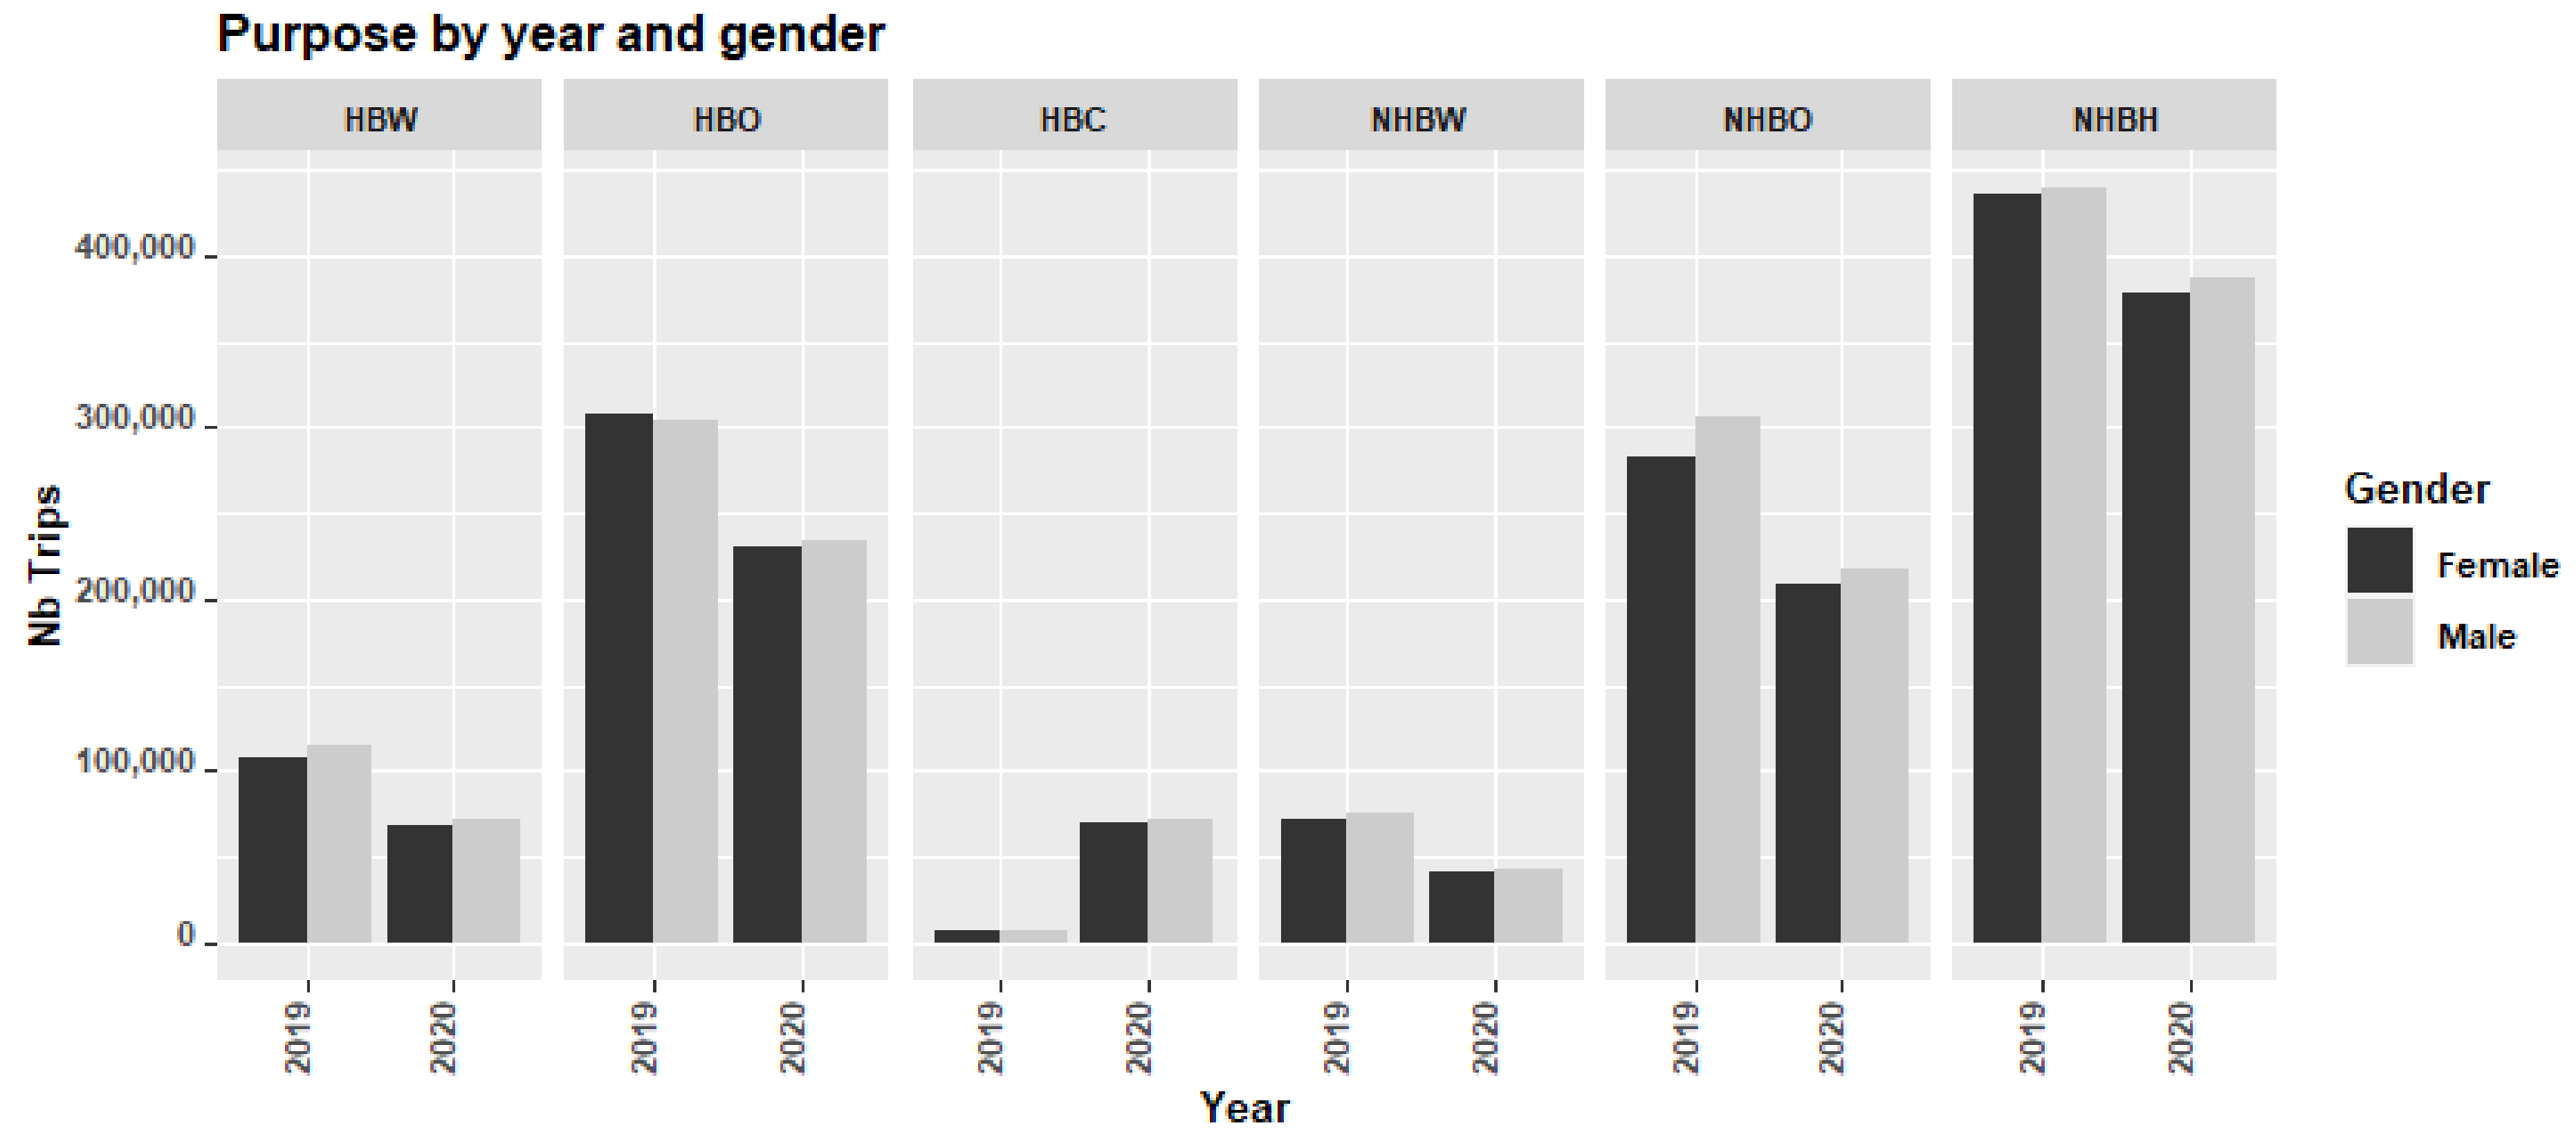
| PURMOD | Trip purpose (aggregated). Either HBW (Home-Based to Work), HBC (Home-based casual), HBO (Home-based others), NHBH (Return to home), NHBW (Non-Home-Based to Work) and NHBO (Non-Home-Based Others) |
| gender | Gender (Male/Female) |
| gedat | Age group factor (4 levels, 16–29, 30–44, 45–64 and 65 and more) |
| corori | Origin Crown (3 levels, AMB, RMB and others) |
| cordes | Destination Crown (3 levels, AMB, RMB and others) |
| corres | Residential Crown (3 levels, AMB, RMB and others) |
| nbtrips | Expansion coefficient of OD trips according to the residential area by the gender and age-group segment they belong to. |
| year | Either 2019 or 2020 |
| r_rm_pond_pob | Average income per capita for the residential zone of commuters |
| ed_per_pri | Average primary education percentage for the residential zone of commuters |
| ed_per_sec | Average secondary education percentage for the residential zone of commuters |
| ed_per_sup | Average high education percentage for the residential zone of commuters |
| taz.emef | Macrozone of residential area for commuters |
| munnom | Residential municipality name for commuters |
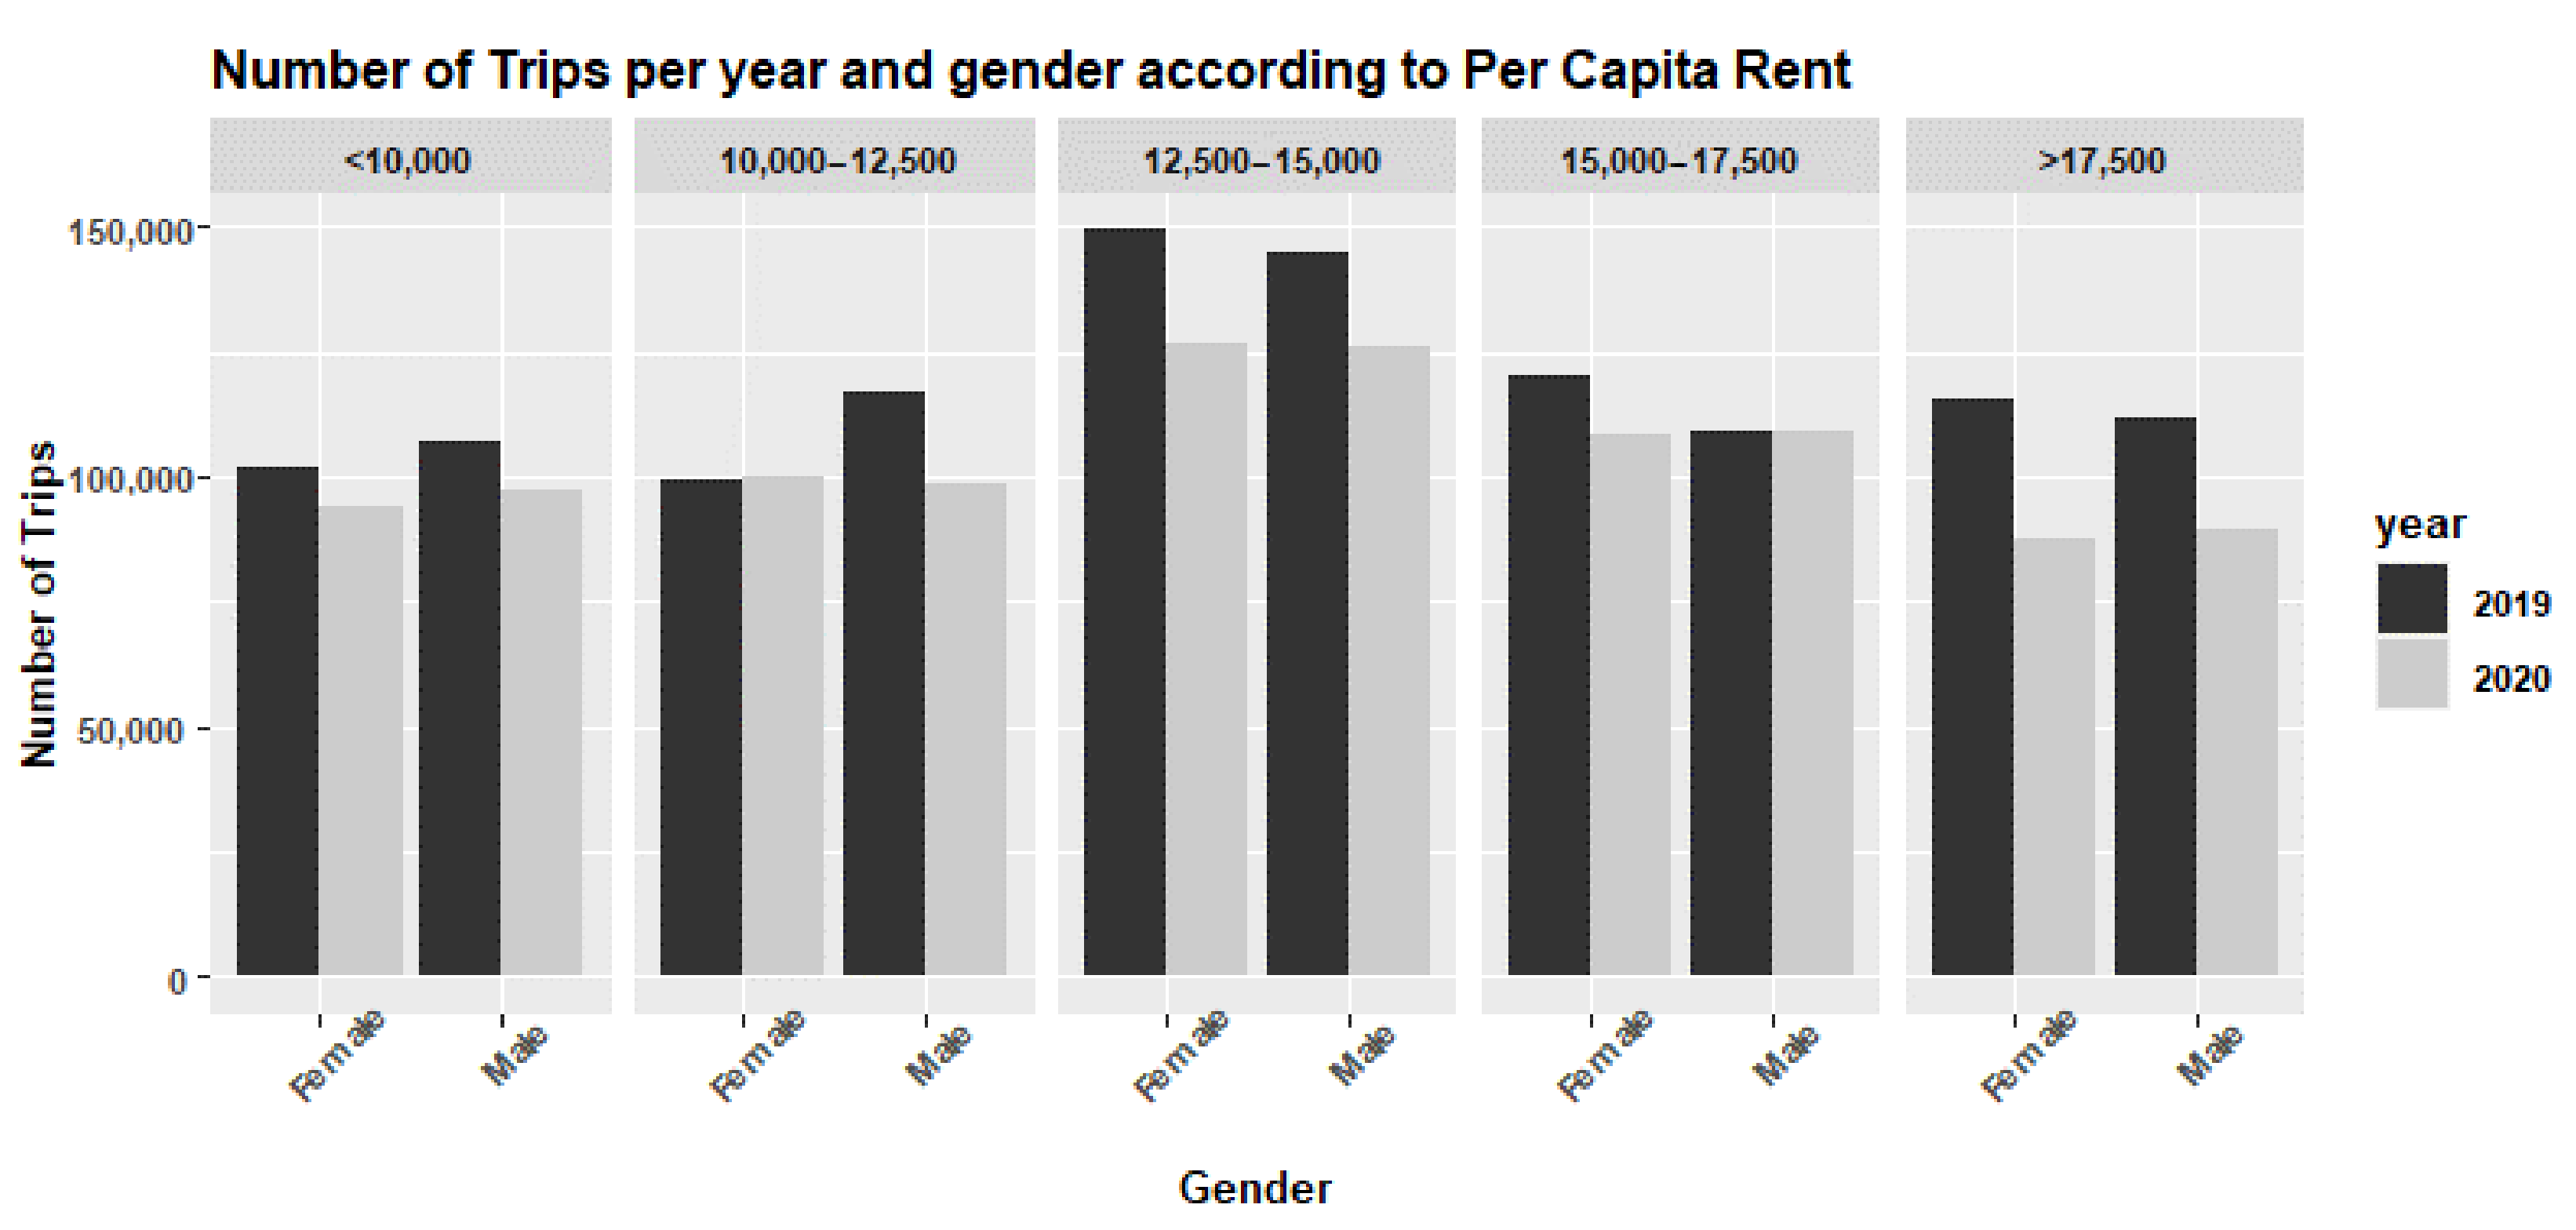
| f.pcrent | Income per capita for residential zone of commuters in 5 levels |
| f.edupri | Binary factor containing low–high percentage of primary educated residents for residential area commuters |
| f. edusec | Binary factor containing low–high percentage of secondary educated residents for residential area trip makers |
| f. edusup | Binary factor containing low–high percentage of highly educated residents for residential area commuters |
| taz.emef.x | Origin macrozone of the trips |
| taz.emef.y | Destination macrozone of the trips |
| munnom.x | Origin TAZ-EMO code of the trips |
| munnom.y | Destination TAZ-EMO code of the trips |
| ODcor | OD Crown of the trips |
| nn | Number of inhabitants in the residential TAZ-EMO of commuters by gender and age-group segment they belong to. |
| triprate | Number of inhabitants in the residential TAZ-EMO of commuters by gender and age-group segment they belong to. |
| Deviance Test for Net-Effects and Interactions | ||||
|---|---|---|---|---|
| Variable | Deviance | Degrees of Freedom | F Value | Pr (>F) |
| gender | 13 | 1 | 97,193 | 0.0018251 |
| age_group | 50 | 3 | 125,544 | 3.37 × 10−05 |
| activity | 99 | 5 | 150,037 | 9.61 × 10⁻¹² |
| education | 257 | 5 | 390,317 | <2.2 × 10⁻¹⁶ |
| purpose | 305 | 7 | 331,174 | <2.2 × 10⁻¹⁶ |
| mode | 2584 | 4 | 491,378 | <2.2 × 10⁻¹⁶ |
| gender:purpose | 32 | 7 | 35,079 | 9.124 × 10⁻⁴ |
| gender:mode | 122 | 4 | 231,661 | <2.2 × 10⁻¹⁶ |
| Residuals | 41,770 | 31,768 | ||
| Metropolitan Subarea | 2019 | 2020 | 2020 Decrement |
|---|---|---|---|
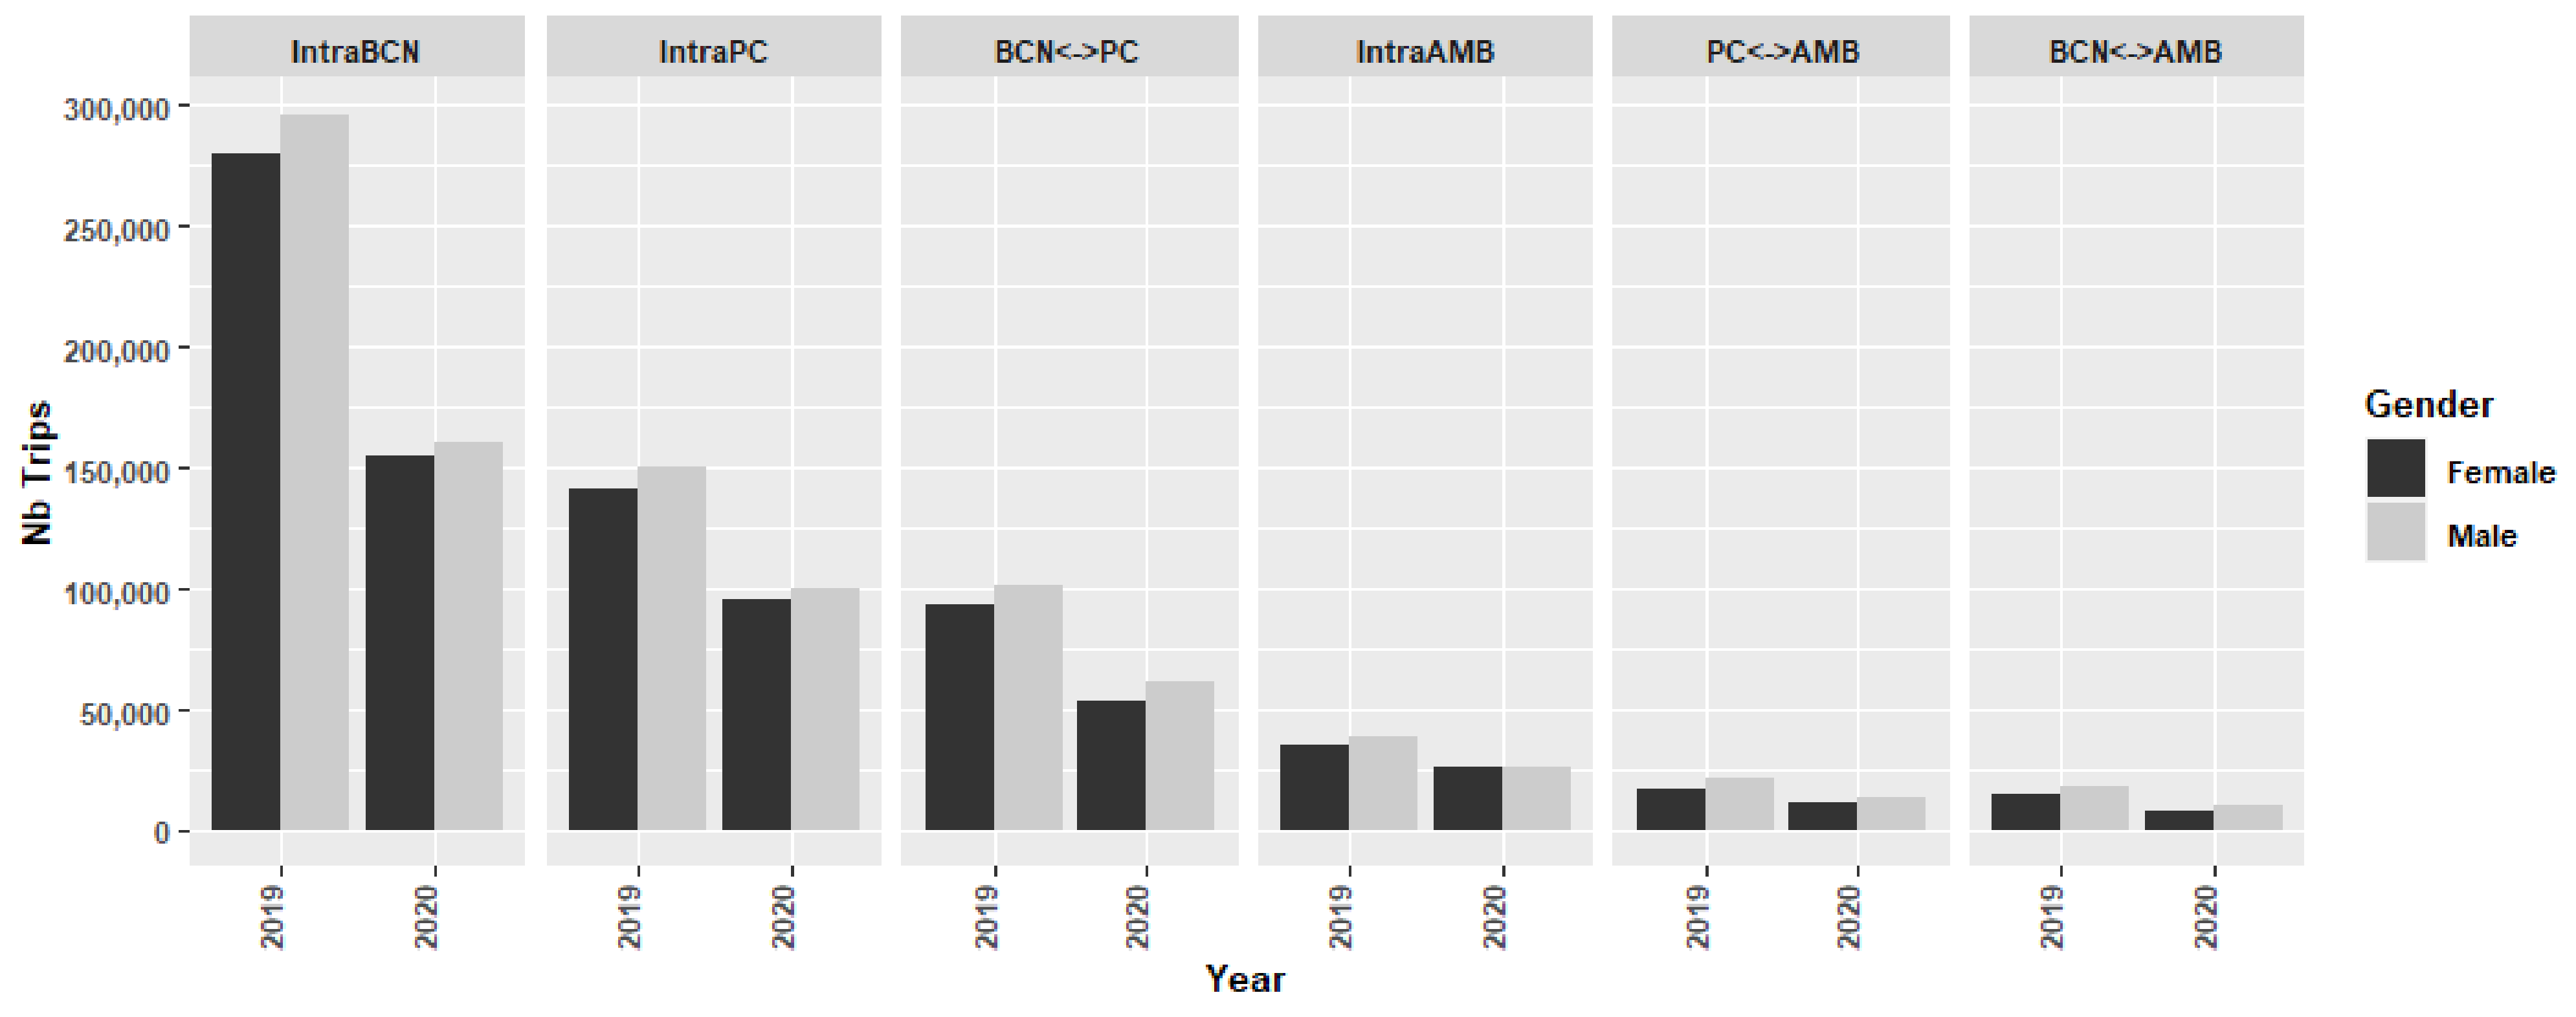
| Barcelona-City (intra) | 3,879,090 | 3,005,290 | 22.5% |
| Primary Crown (intra) | 2,040,975 | 1,916,593 | 6.1% |
| Barcelona- Primary Crown | 1,206,404 | 910,357 | 24.5% |
| Second Crown-RMB (intra) | 490,621 | 473,821 | 3.4% |
| Primary ↔ Second Crowns | 231,517 | 190,350 | 17.8% |
| Barcelona ↔ Second Crowns | 177,169 | 116,660 | 34.2% |
| Variable Name | Description |
|---|---|
| Triprate (target variable) | Number of trips per number of inhabitants in the residential TAZ-EMO of commuters |
| mun.res | Residential TAZ-EMO |
| PURMOD | Trip purpose (aggregated). Either HBW (Home-Based to Work), HBC (Home-Based Casual), HBO (Home-Based Others), NHBH (Return to Home), NHBW (Non-Home-Based to Work) and NHBO (Non-Home-Based Others) |
| gender | Gender (Male/Female) |
| gedat | Age group factor (4 levels, 16–29, 30–44, 45–64 and 65 and more) |
| nbtrips | Total number of trips by residents in mun.res in the age group and gender segment they belong to. |
| year | Either 2019, or 2020 |
| r_rm_pond_pob | Average per capita rent for the residential zone of commuters |
| ed_per_pri | Average primary education percentage for the residential zone of commuters |
| ed_per_sec | Average secondary education percentage for the residential zone of commuters |
| ed_per_sup | Average high education percentage for the residential zone of commuters |
| munnom | Residential municipality name of commuters |
| f.pcrent | Income per capita for residential zone of commuters in 5 levels |
| f.edupri | Binary factor containing low–high percentage of primary educated residents for residential area commuters |
| f. edusec | Binary factor containing low–high percentage of secondary educated residents for residential area commuters |
| f. edusup | Binary factor containing low–high percentage of highly educated residents for residential area commuters |
| nn | Number of inhabitants in the residential TAZ-EMO of commuters by gender and age-group segment they belong to |
| Estimates | Coefficients |
|---|---|
| Gender Male | 0.095 *** (0.008) |
| PURMOD HBO | 0.984 *** (0.021) |
| PURMOD HBC | −2.383 *** (0.025) |
| PURMOD NHBW | −1.056 *** (0.019) |
| PURMOD NHBO | 0.141 *** (0.019) |
| PURMOD NHBH | 1.205 *** (0.021) |
| age.group 30–44 | 0.098 *** (0.011) |
| age.group 45–64 | 0.058 *** (0.011) |
| age.group 65–100 | −0.320 *** (0.012) |
| Year 2020 | −0.415 *** (0.028) |
| f.pcrent 10,000–12,500 | −0.020 (0.017) |
| f.pcrent 12,500–15,000 | 0.030 * (0.017) |
| f.pcrent 15,000–17,500 | 0.046 ** (0.021) |
| f.pcrent > 17,500 | −0.117 *** (0.019) |
| year2020:f.pcrent 10,000–12,500 | 0.015 (0.025) |
| year2020:f.pcrent 12,500–15,000 | −0.037 (0.024) |
| year2020:f.pcrent 15,000–17,500 | −0.084 *** (0.030) |
| year2020:f.pcrent > 17,500 | −0.045 (0.028) |
| year2020: PURMOD HBO | 0.244 *** (0.031) |
| year2020: PURMOD HBC | 2.453 *** (0.033) |
| year2020: PURMOD NHBW | 0.058 ** (0.028) |
| year2020: PURMOD NHBO | 0.194 *** (0.027) |
| year2020: PURMOD NHBH | 0.279 *** (0.030) |
| Constant | −2.399 *** (0.021) |
| Observations | 117,061 |
| Log Likelihood | −641,480.600 |
| Akaike Inf. Crit. | 1,283,009.000 |
| Variable | Sum Sq | Degrees of Freedom | F Value | Pr(>F) |
|---|---|---|---|---|
| gender | 263 | 1 | 141,505 | <2.2 × 10⁻¹⁶ *** |
| PURMOD | 74,653 | 5 | 8,036,593 | <2.2 × 10⁻¹⁶ *** |
| age.group | 2669 | 3 | 478,924 | <2.2 × 10⁻¹⁶ *** |
| year | 305 | 1 | 164,306 | <2.2 × 10⁻¹⁶ *** |
| f.pcrent | 304 | 4 | 40,855 | <2.2 × 10⁻¹⁶ *** |
| year:f.pcrent | 30 | 4 | 4063 | 0.002696 ** |
| year:PURMOD | 11,912 | 5 | 1,282,362 | <2.2 × 10⁻¹⁶ *** |
| Residuals | 217,434 | 117,037 |
Publisher’s Note: MDPI stays neutral with regard to jurisdictional claims in published maps and institutional affiliations. |
© 2021 by the authors. Licensee MDPI, Basel, Switzerland. This article is an open access article distributed under the terms and conditions of the Creative Commons Attribution (CC BY) license (https://creativecommons.org/licenses/by/4.0/).
Share and Cite
Mejía-Dorantes, L.; Montero, L.; Barceló, J. Mobility Trends before and after the Pandemic Outbreak: Analyzing the Metropolitan Area of Barcelona through the Lens of Equality and Sustainability. Sustainability 2021, 13, 7908. https://doi.org/10.3390/su13147908
Mejía-Dorantes L, Montero L, Barceló J. Mobility Trends before and after the Pandemic Outbreak: Analyzing the Metropolitan Area of Barcelona through the Lens of Equality and Sustainability. Sustainability. 2021; 13(14):7908. https://doi.org/10.3390/su13147908
Chicago/Turabian StyleMejía-Dorantes, Lucía, Lídia Montero, and Jaume Barceló. 2021. "Mobility Trends before and after the Pandemic Outbreak: Analyzing the Metropolitan Area of Barcelona through the Lens of Equality and Sustainability" Sustainability 13, no. 14: 7908. https://doi.org/10.3390/su13147908
APA StyleMejía-Dorantes, L., Montero, L., & Barceló, J. (2021). Mobility Trends before and after the Pandemic Outbreak: Analyzing the Metropolitan Area of Barcelona through the Lens of Equality and Sustainability. Sustainability, 13(14), 7908. https://doi.org/10.3390/su13147908