Author Contributions
C.W.; methodology, software, investigation, data curation, formal analysis, data curation, conceptualization, writing—original draft preparation, visualization, Y.Z., J.Z., Z.W.; validation, resources, writing—review and editing, supervision, project administration, funding acquisition. All authors have read and agreed to the published version of the manuscript.
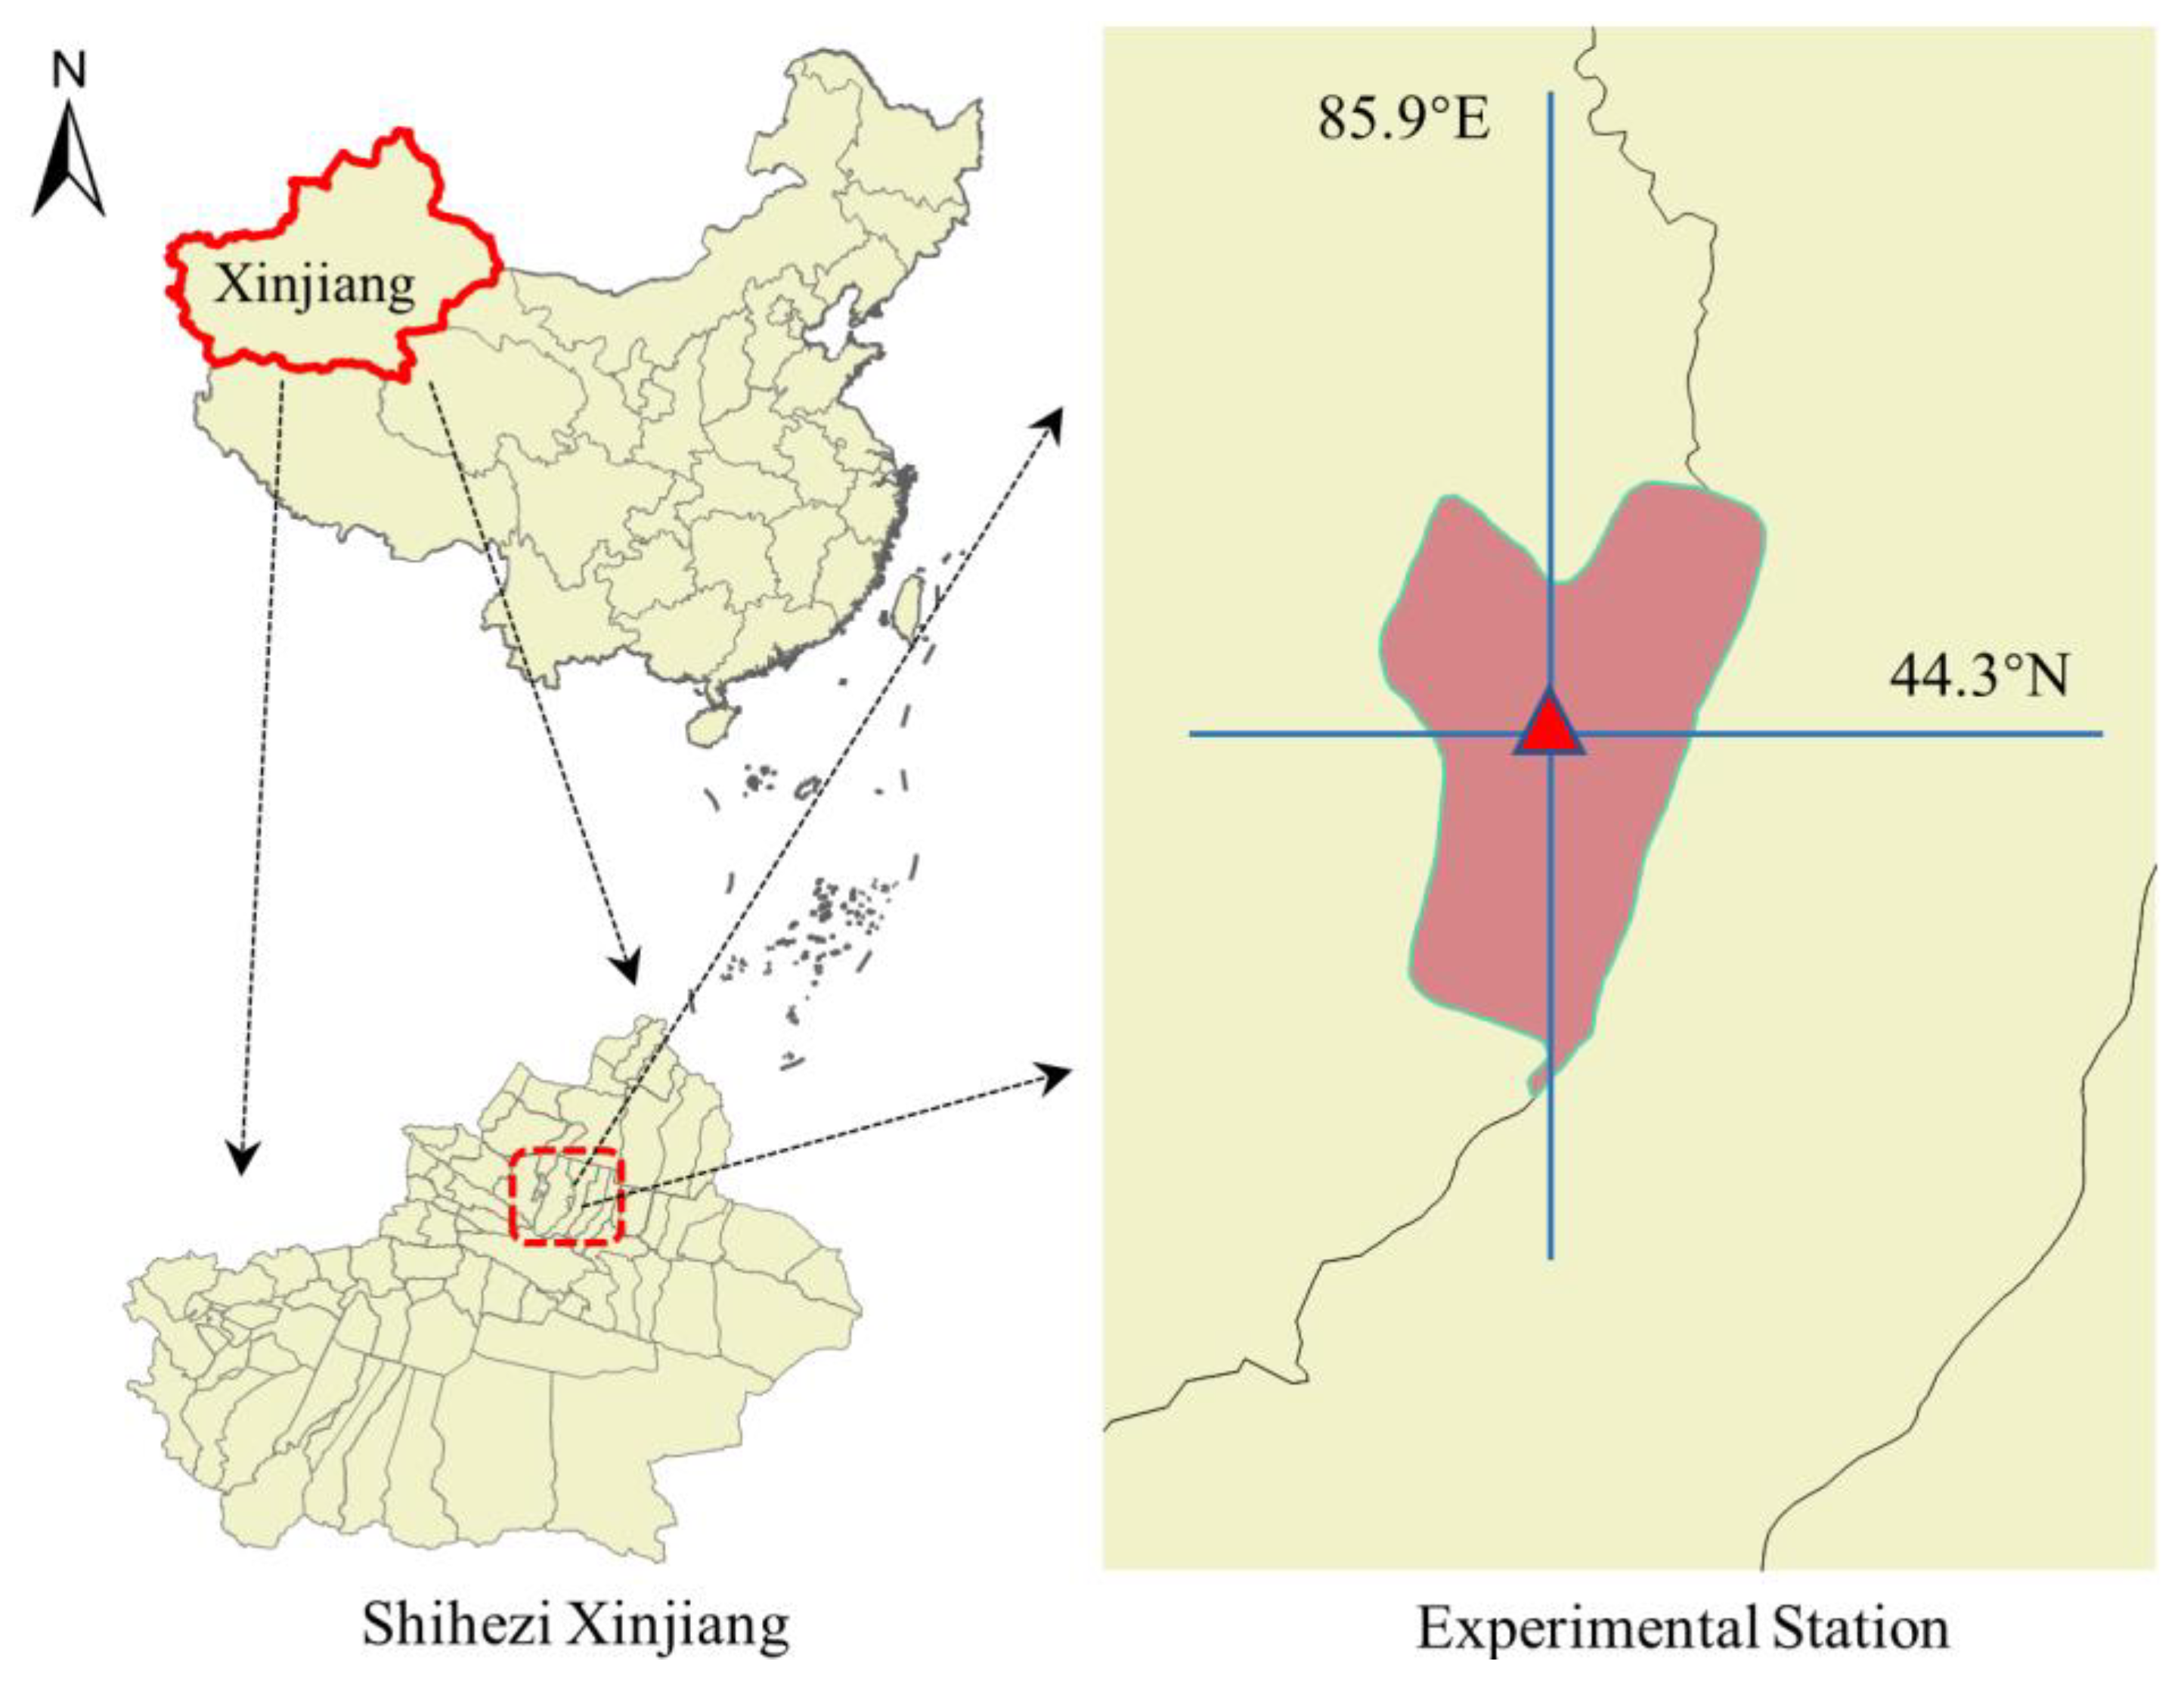
Figure 1.
Maps and imagery of the study site, the Key Laboratory of Modern Water-saving Irrigation, Shihezi University, Shihezi city, Xinjiang.
Figure 1.
Maps and imagery of the study site, the Key Laboratory of Modern Water-saving Irrigation, Shihezi University, Shihezi city, Xinjiang.
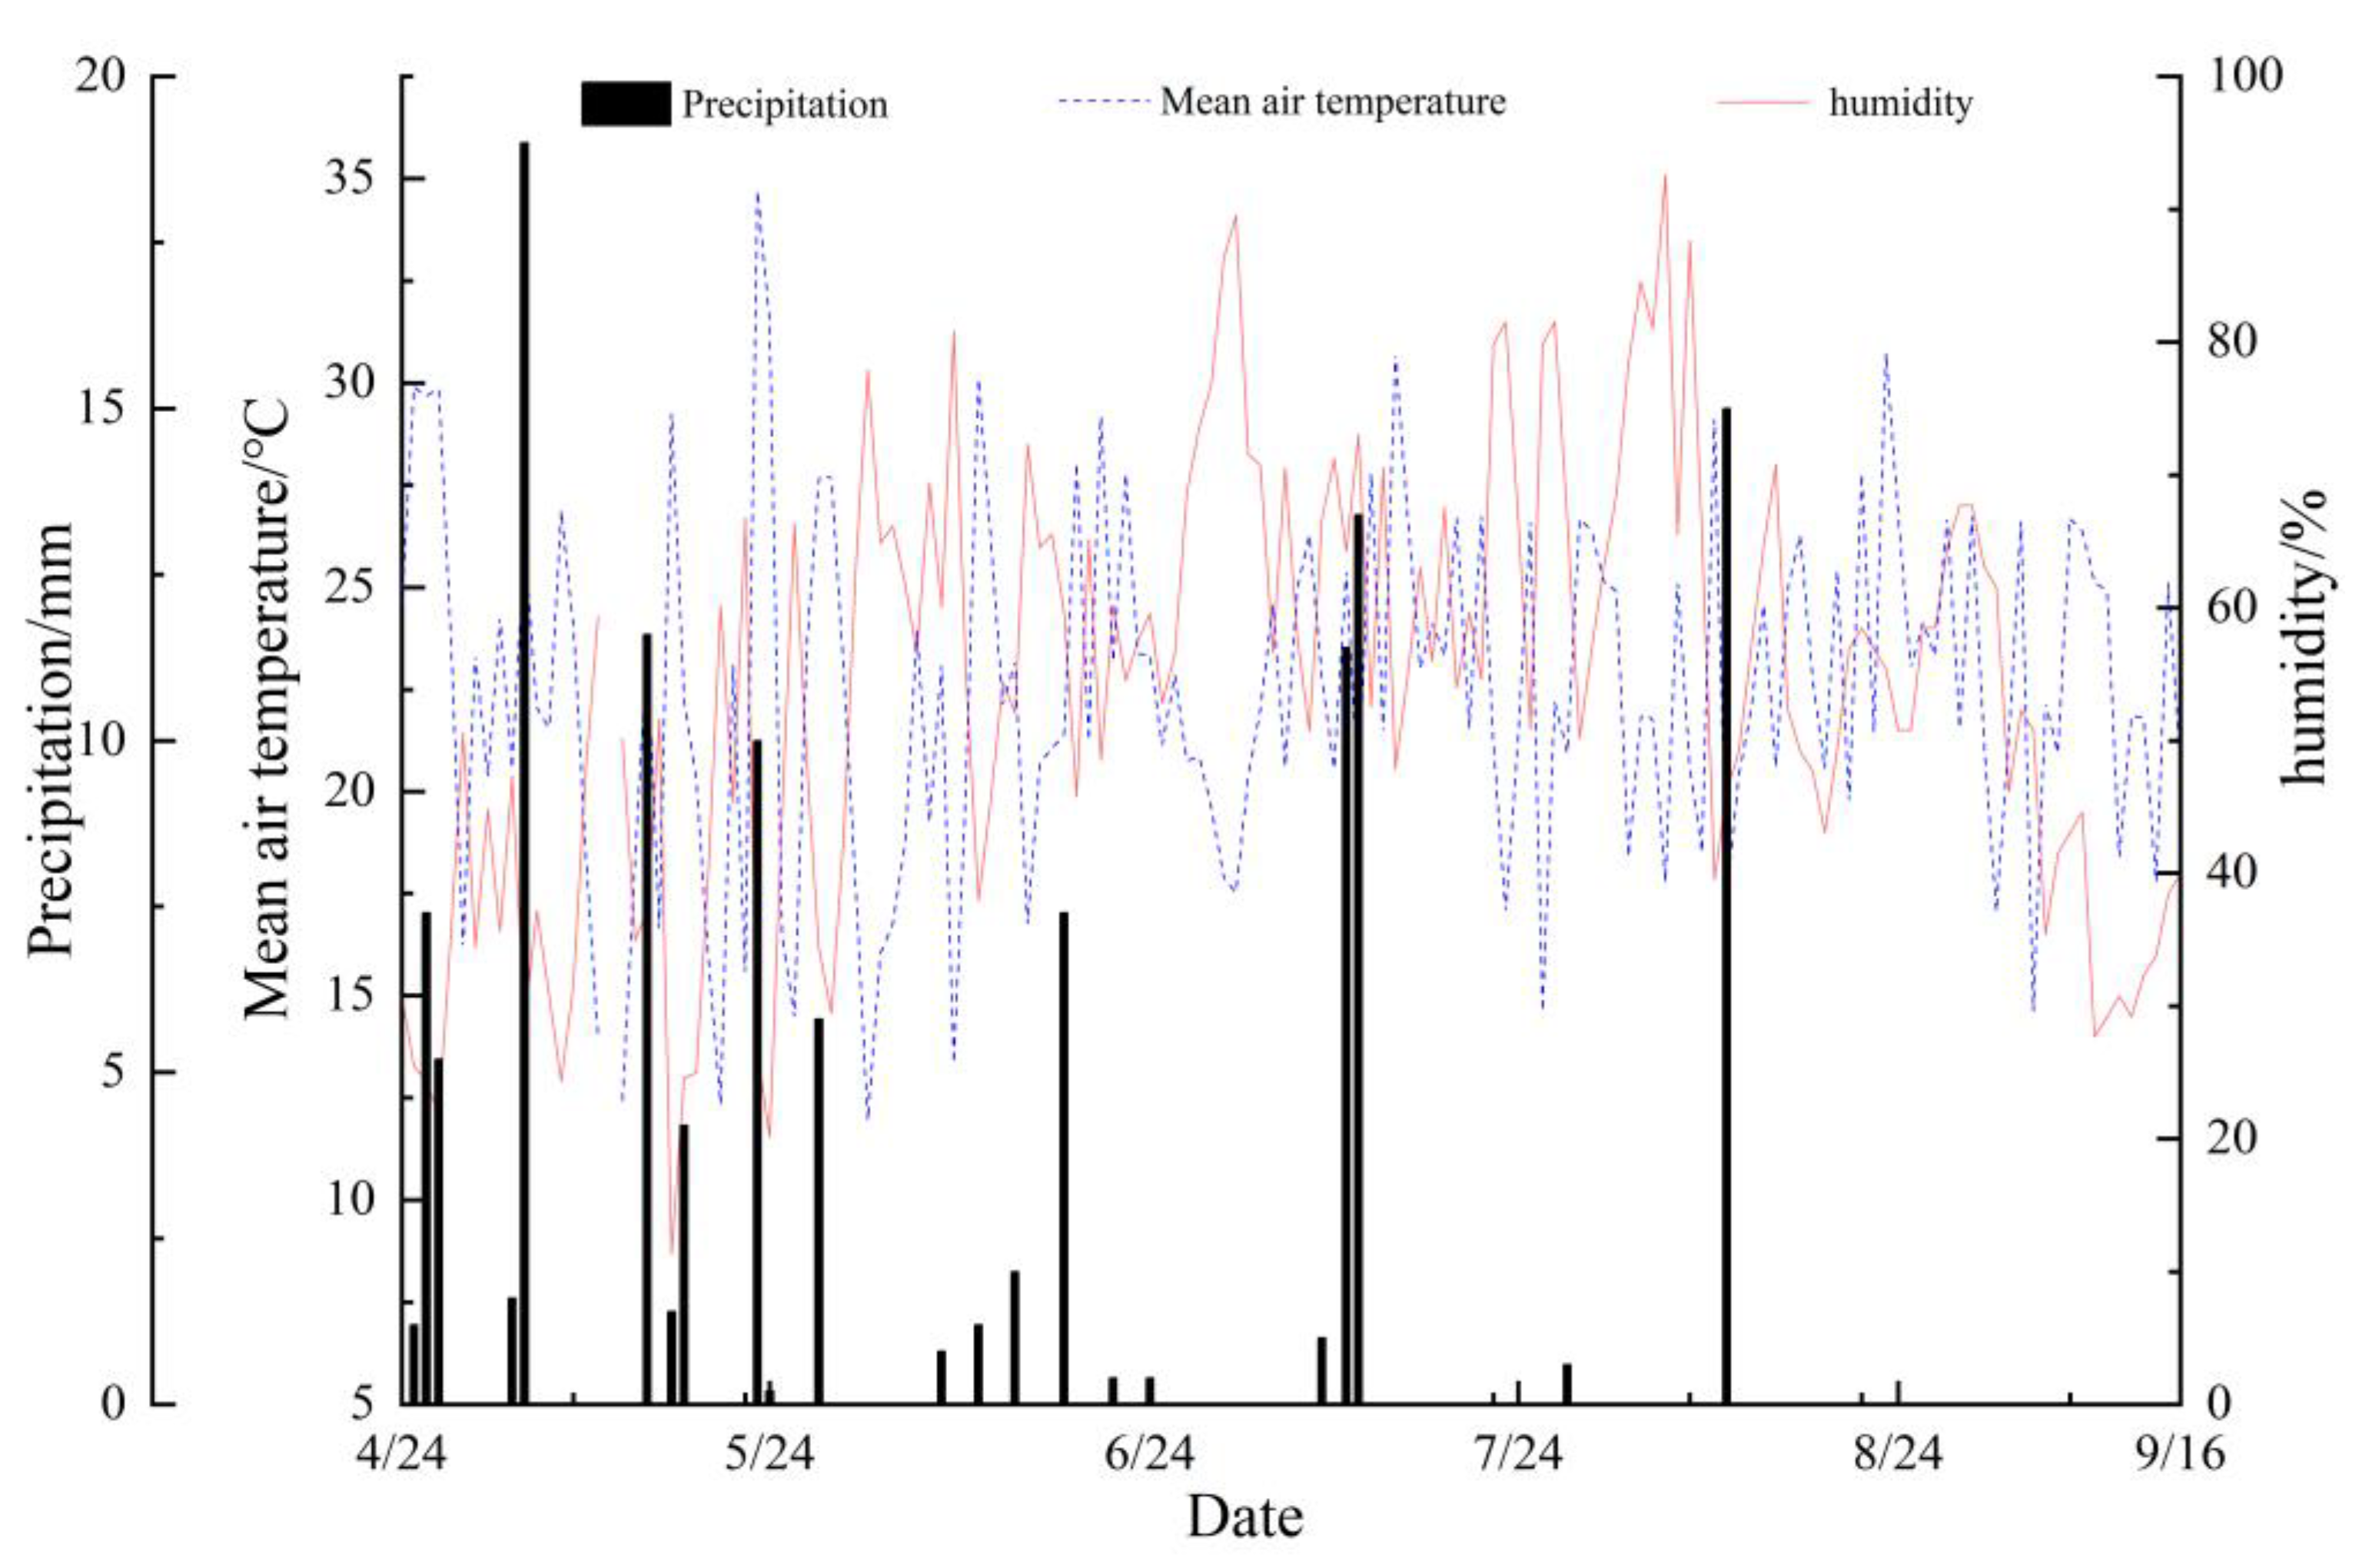
Figure 2.
Daily precipitation (black bars), mean air temperature (blue) and humidity (red) from 24 April to 16 September for the study years (2019).
Figure 2.
Daily precipitation (black bars), mean air temperature (blue) and humidity (red) from 24 April to 16 September for the study years (2019).
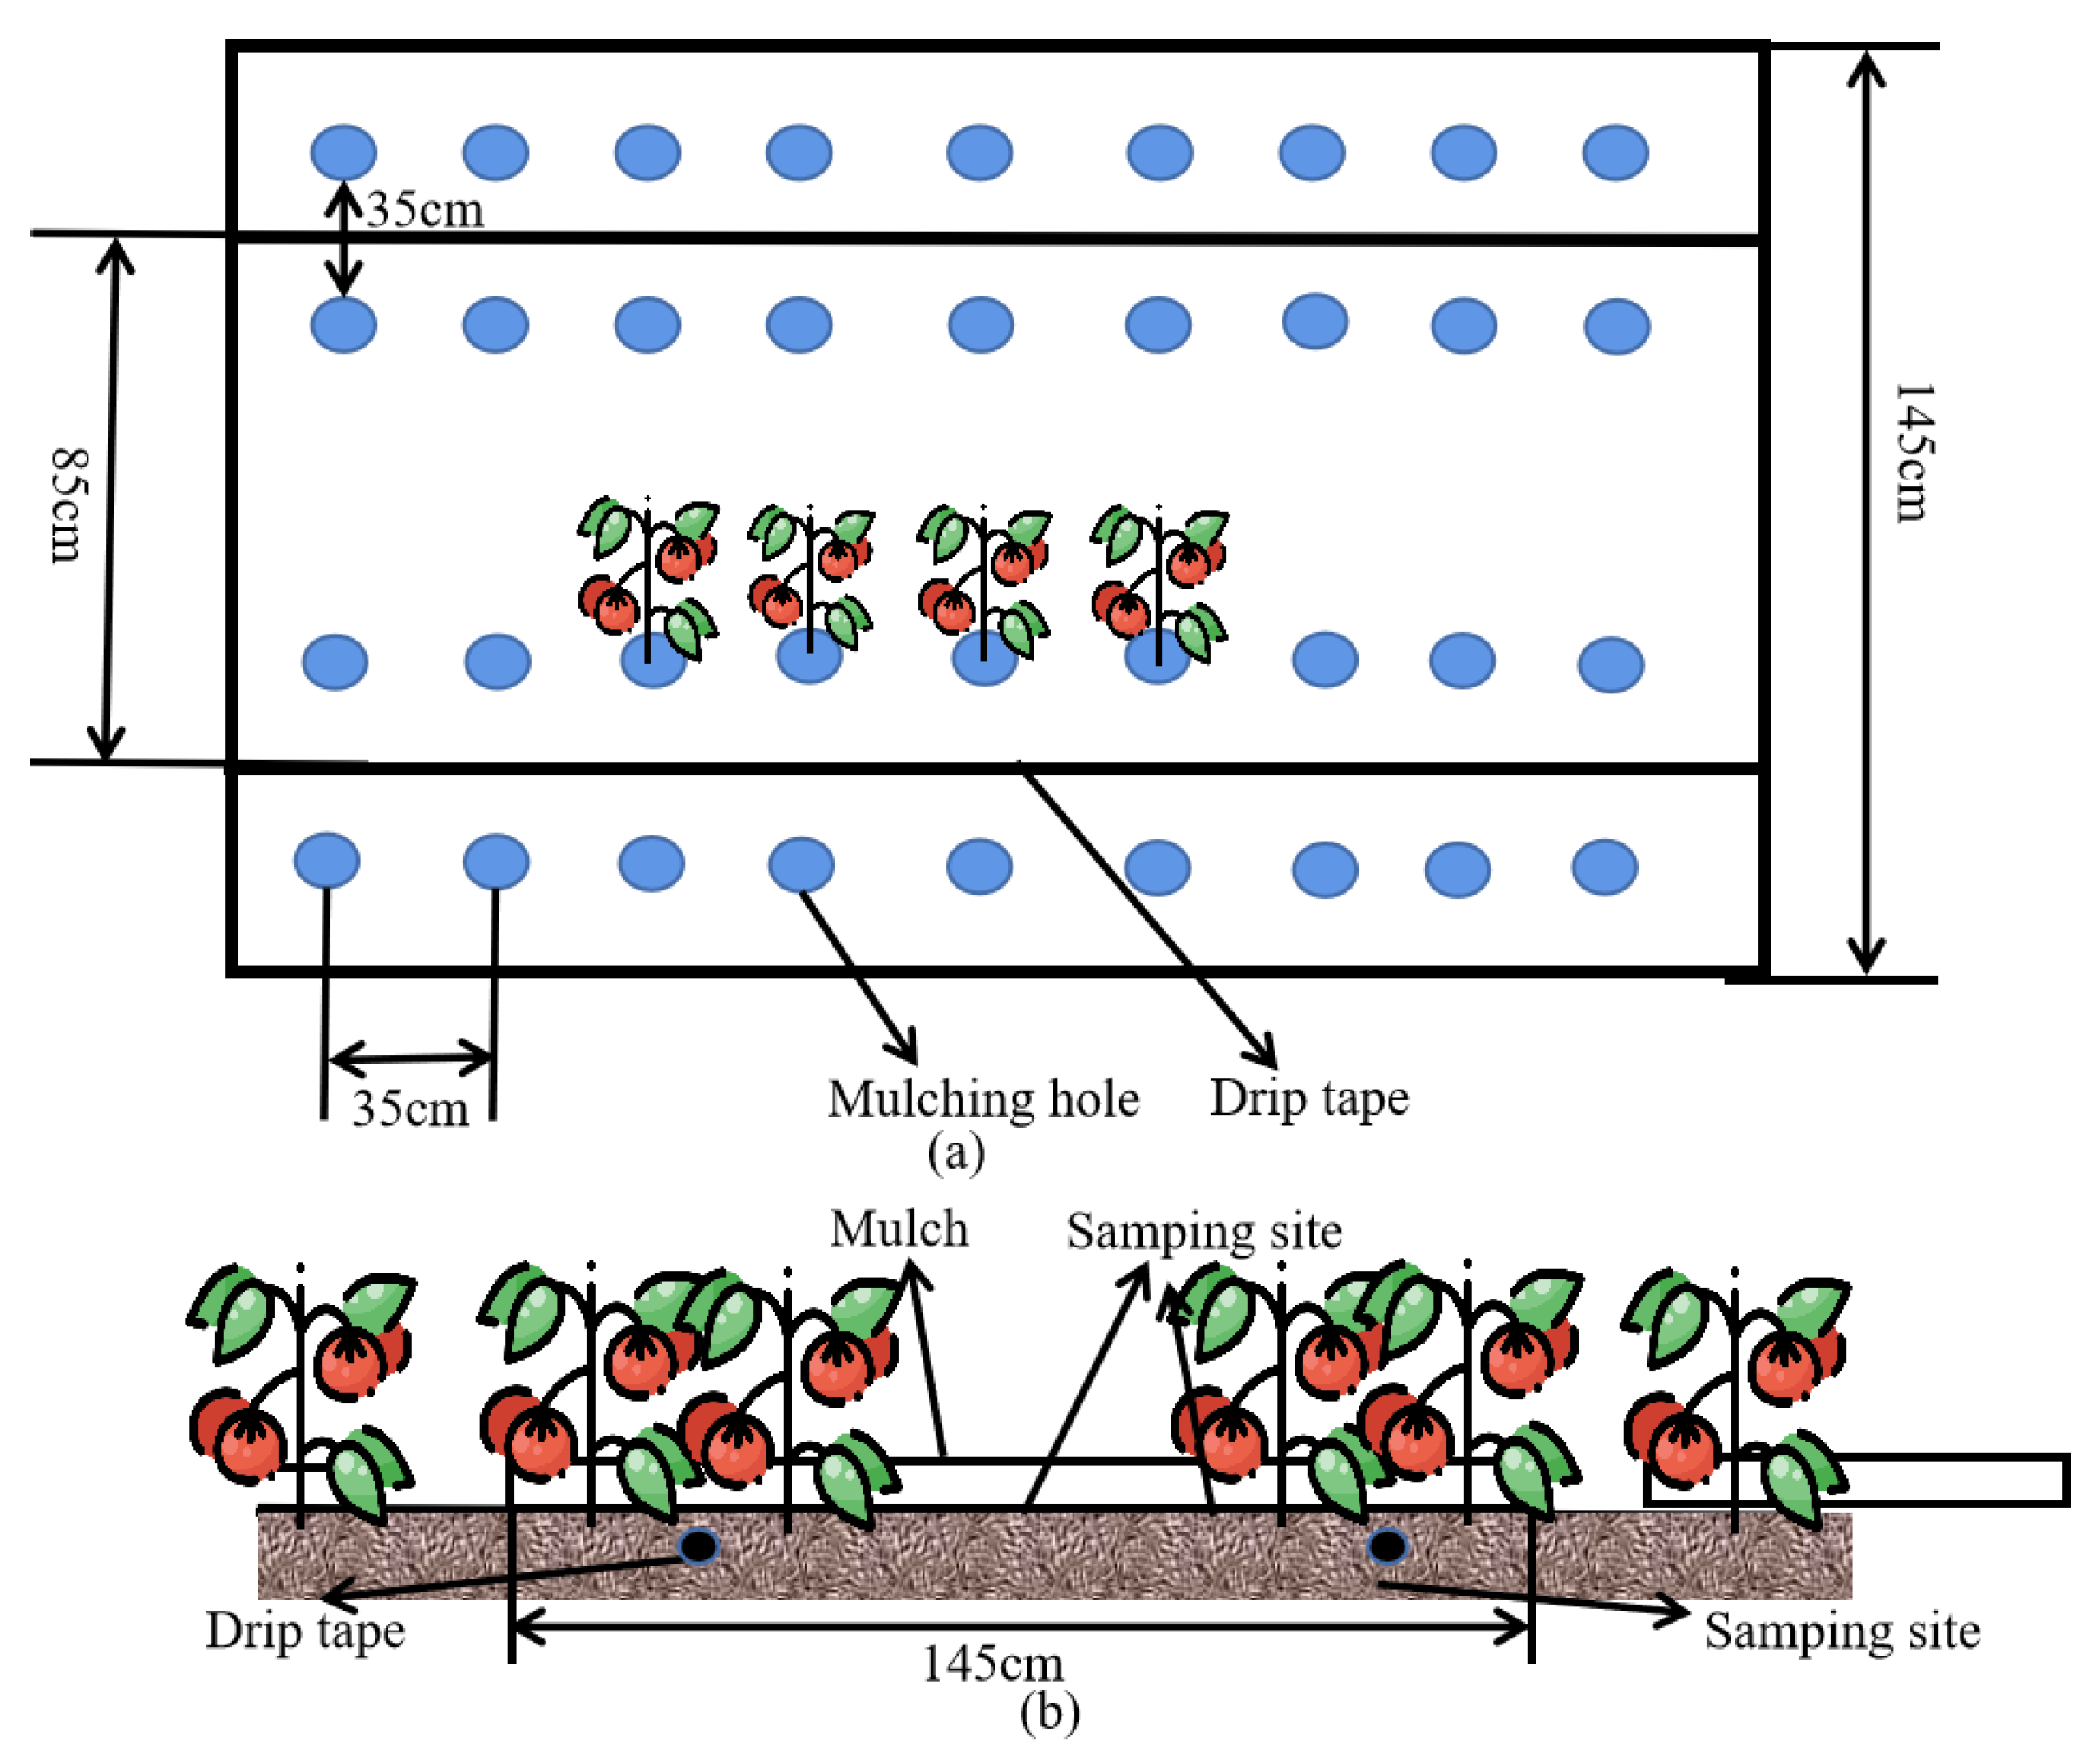
Figure 3.
Vertical view (a) and front view (b) of processing tomato planting patterns.
Figure 3.
Vertical view (a) and front view (b) of processing tomato planting patterns.
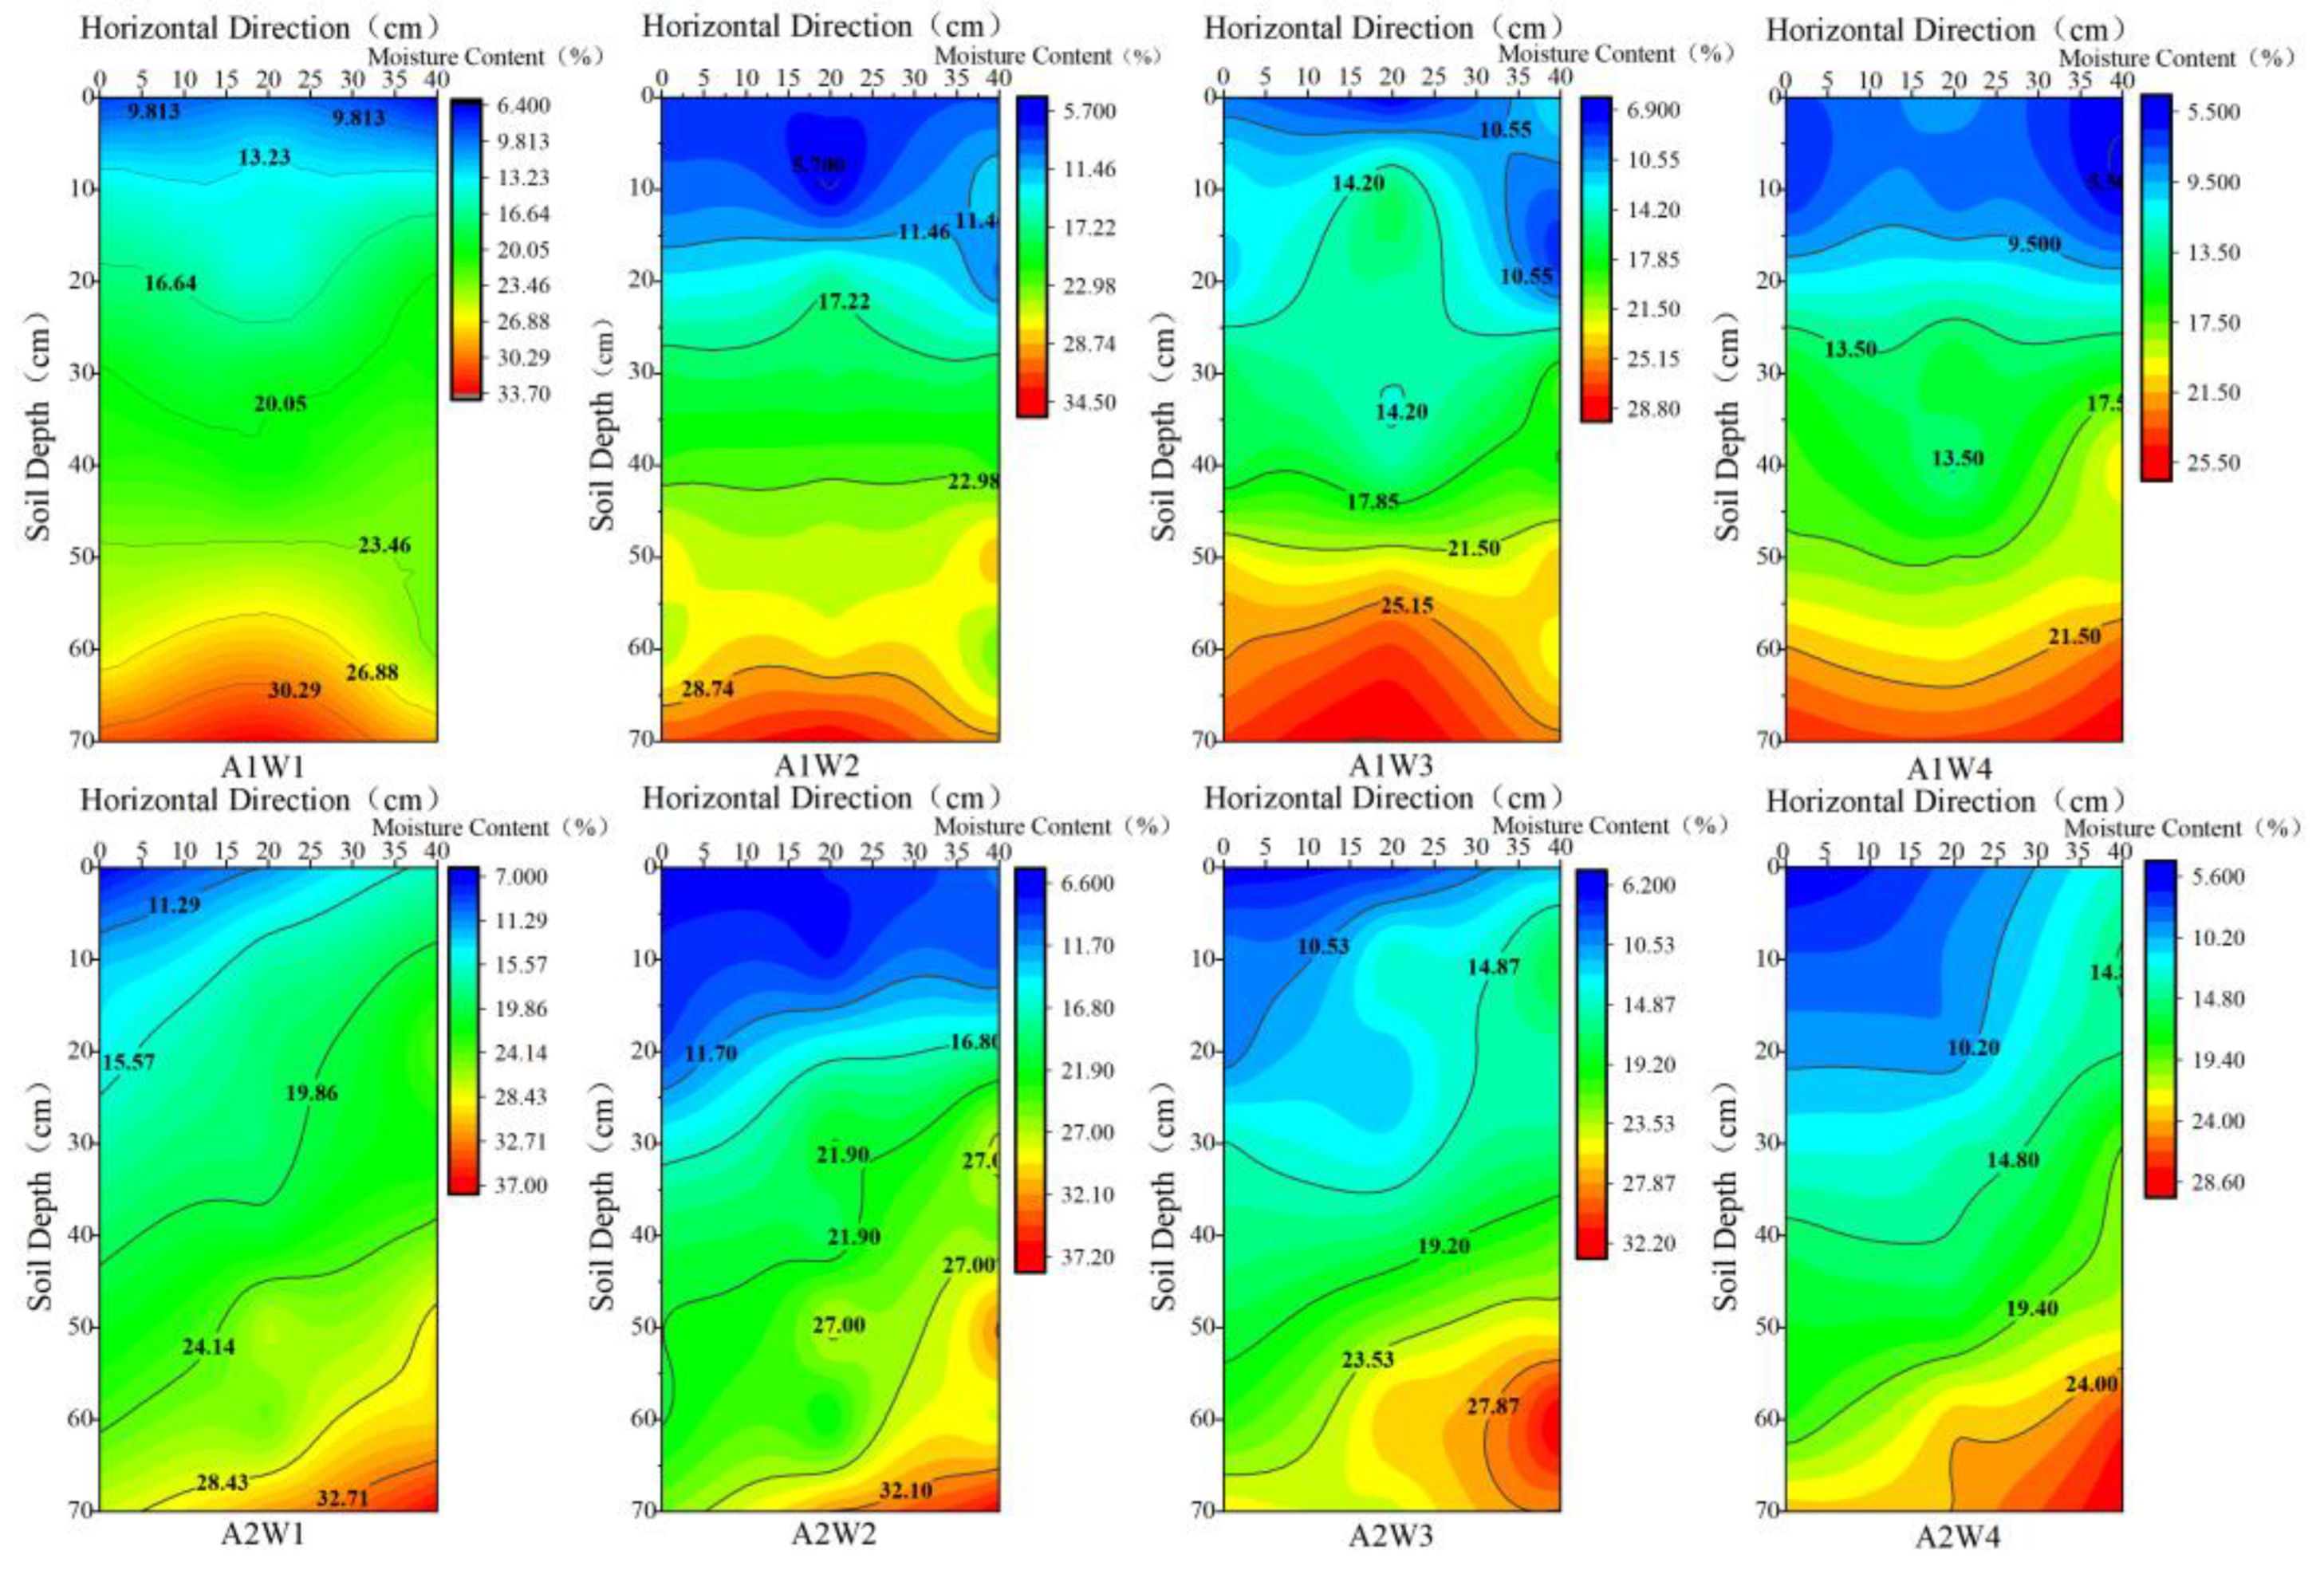
Figure 4.
Soil moisture content of processing tomato in horizontal direction of 0~40 cm and vertical direction of 0~70 cm measured on 14 July (two days after irrigation) for A1 and A2 treatments under W1, W2, W3 and W4 irrigation levels.
Figure 4.
Soil moisture content of processing tomato in horizontal direction of 0~40 cm and vertical direction of 0~70 cm measured on 14 July (two days after irrigation) for A1 and A2 treatments under W1, W2, W3 and W4 irrigation levels.
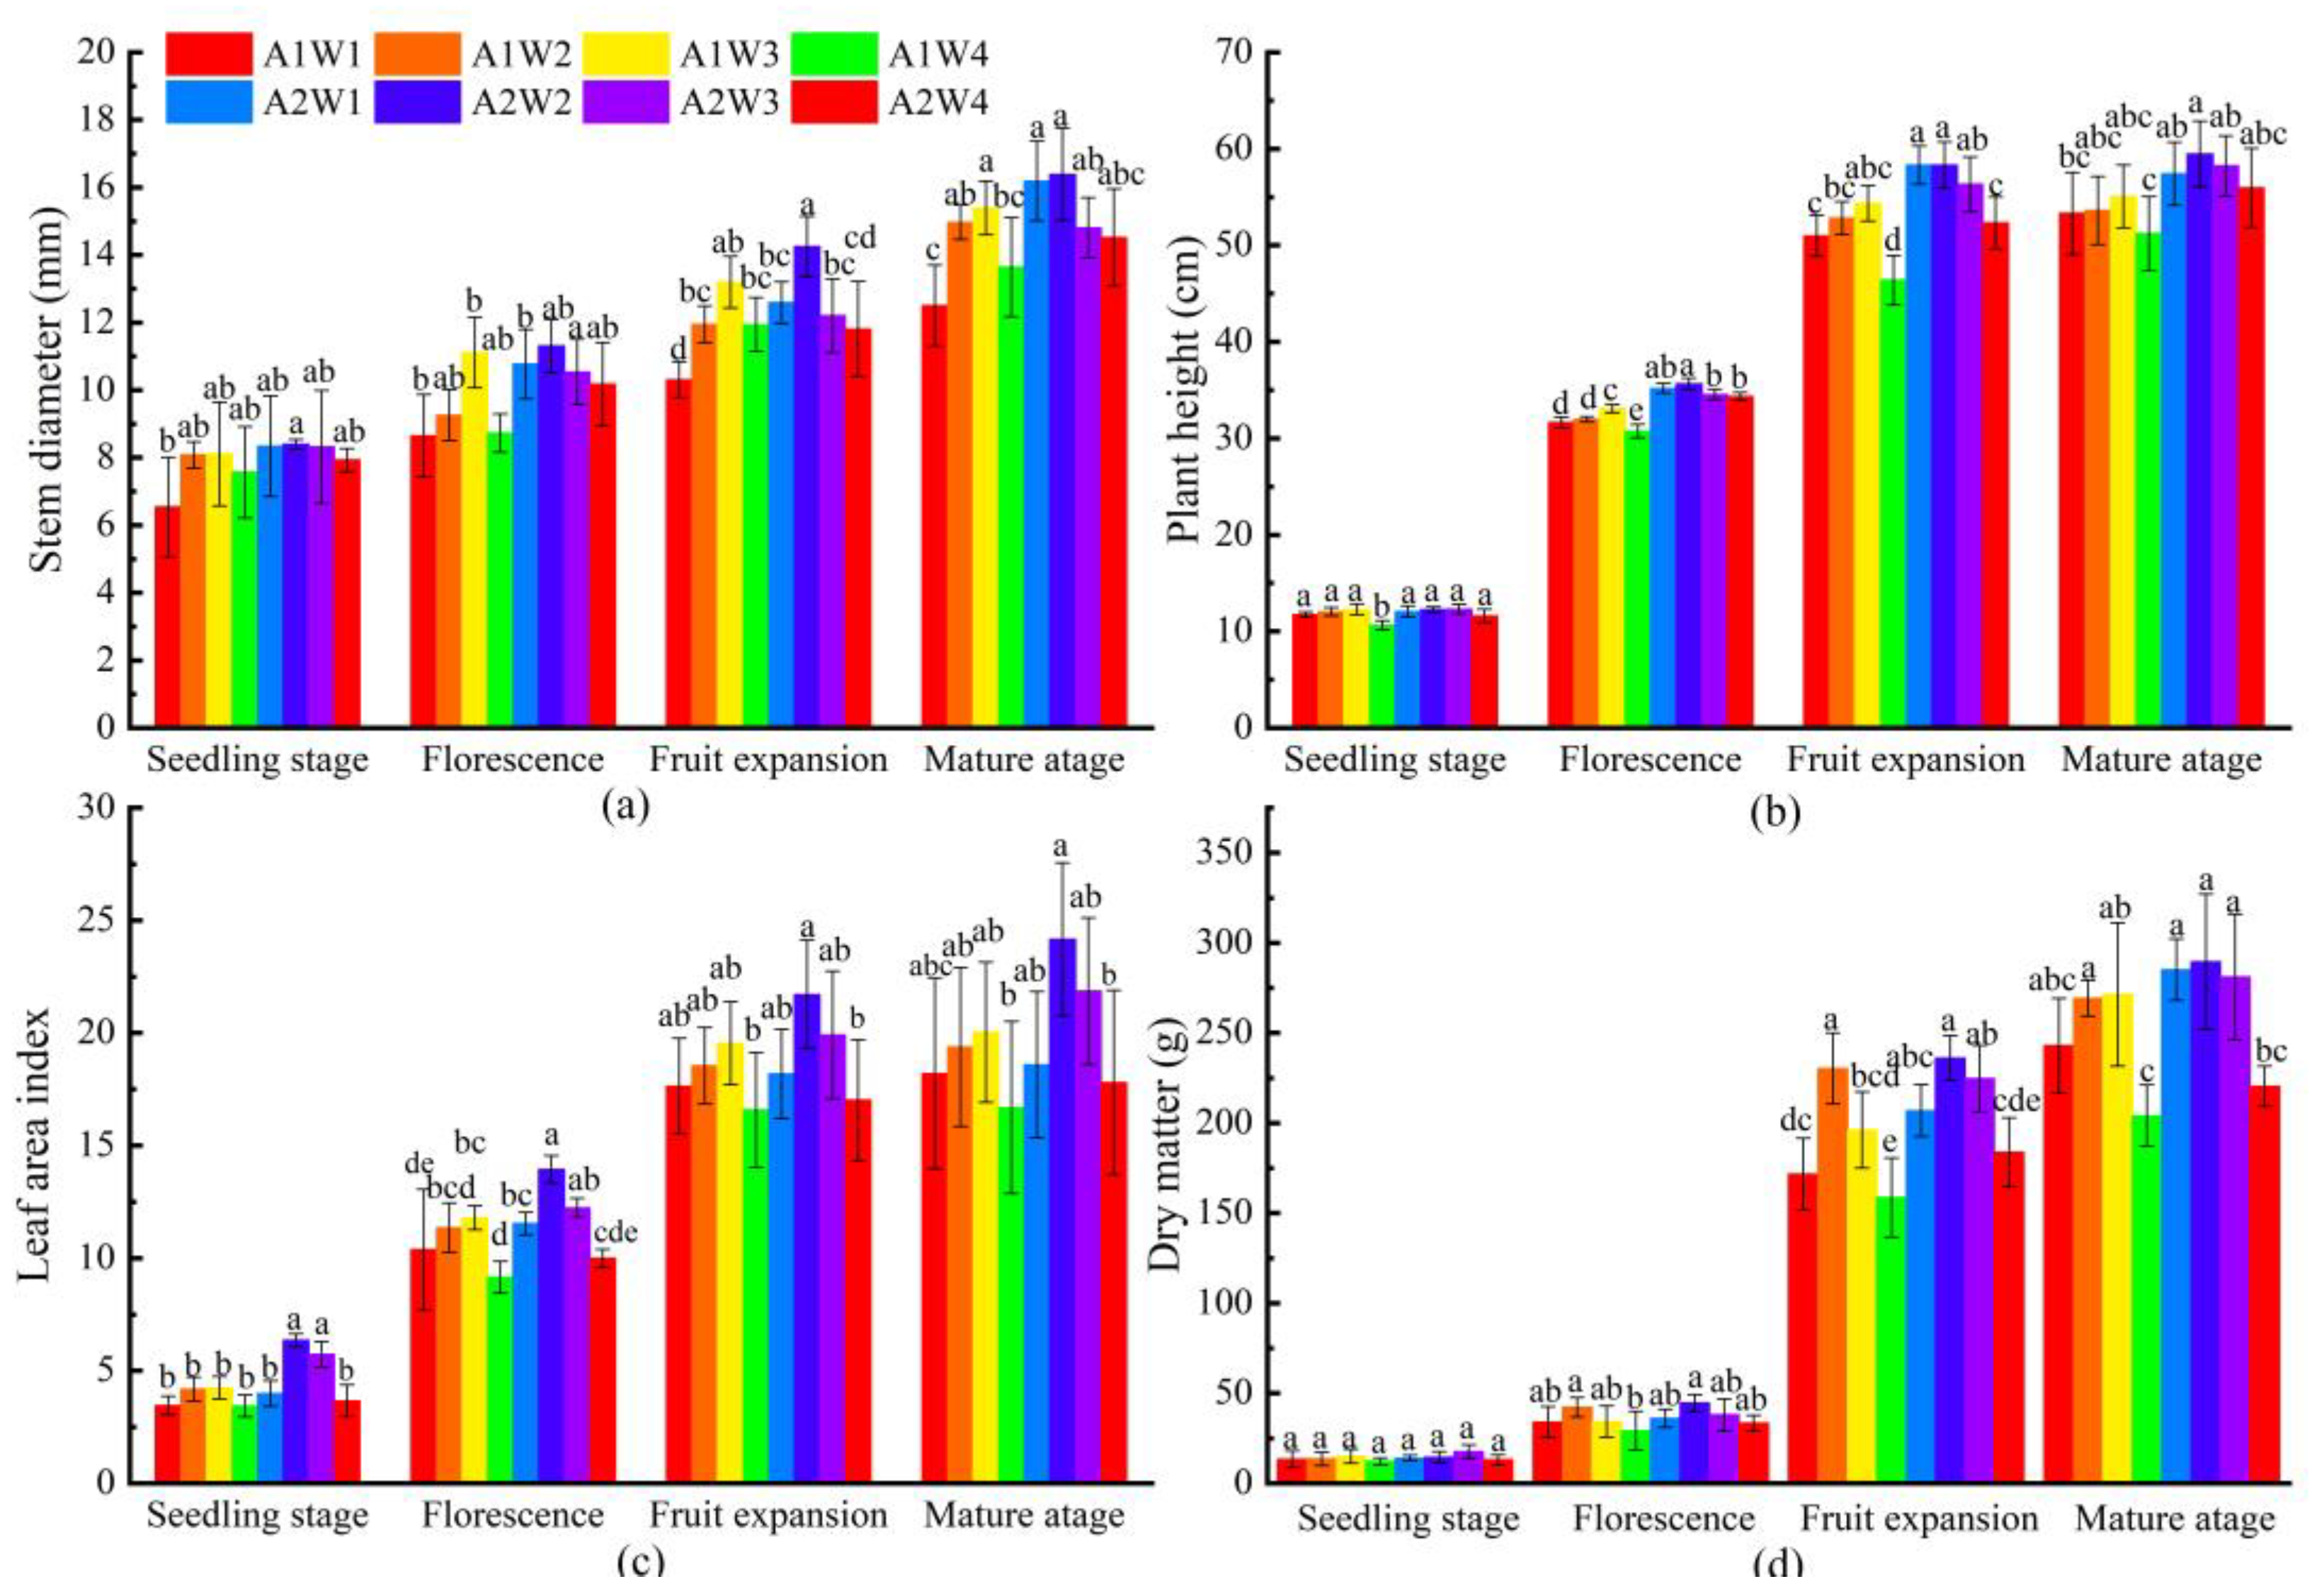
Figure 5.
Stem diameter (a), plant height (b), leaf area index (c) and biomass (d) of processing tomato in seeding stage, florescence, fruit expansion and mature stage for eight treatments. Different letters in the same column indicate significance at p < 0.05. The error bars show ± standard deviation and the n value is 3 (replicated three times).
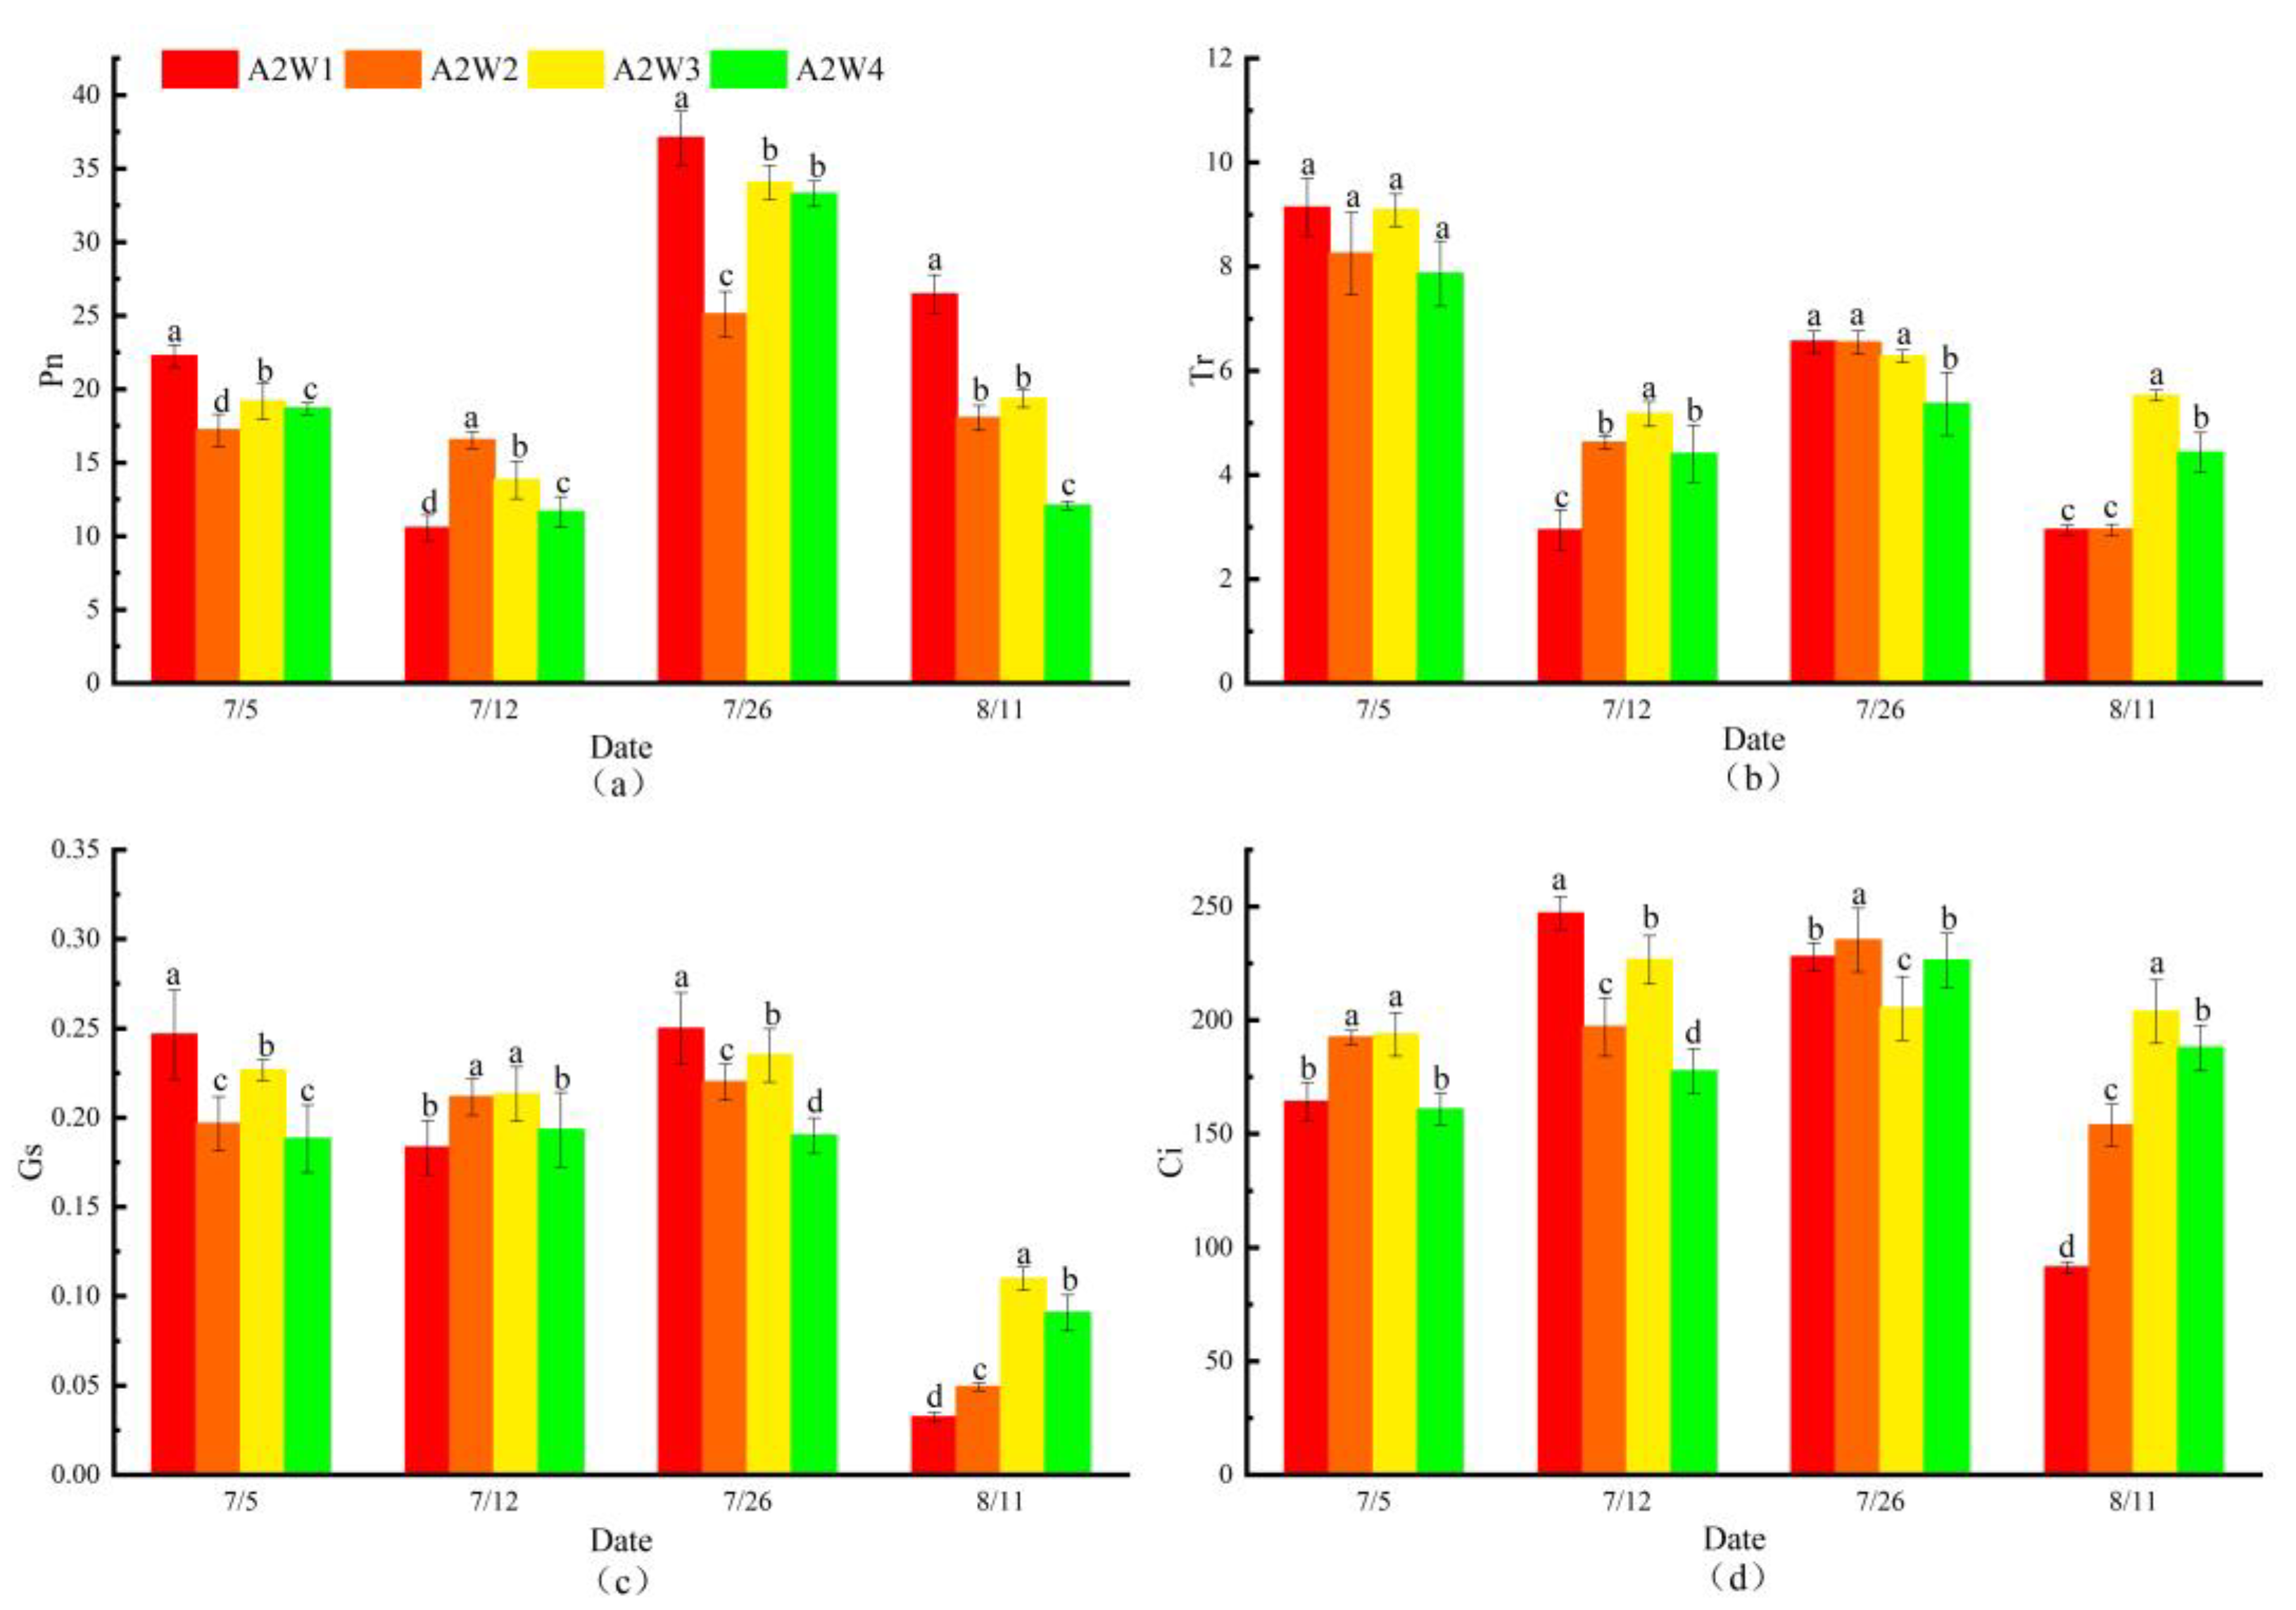
Figure 6.
The variation photosynthetic index which includes Pn—net photosynthetic rate (a), Tr—transpiration rate (b), Gs—stomatal conductance (c) and Ci—intercellular CO2 concentration (d) for aeration treatments at four (W1, W2, W3, and W4) irrigation levels. Different letters in the same column indicate significance at p < 0.05. The error bars show ± standard deviation and the n value is 3 (replicated three times).
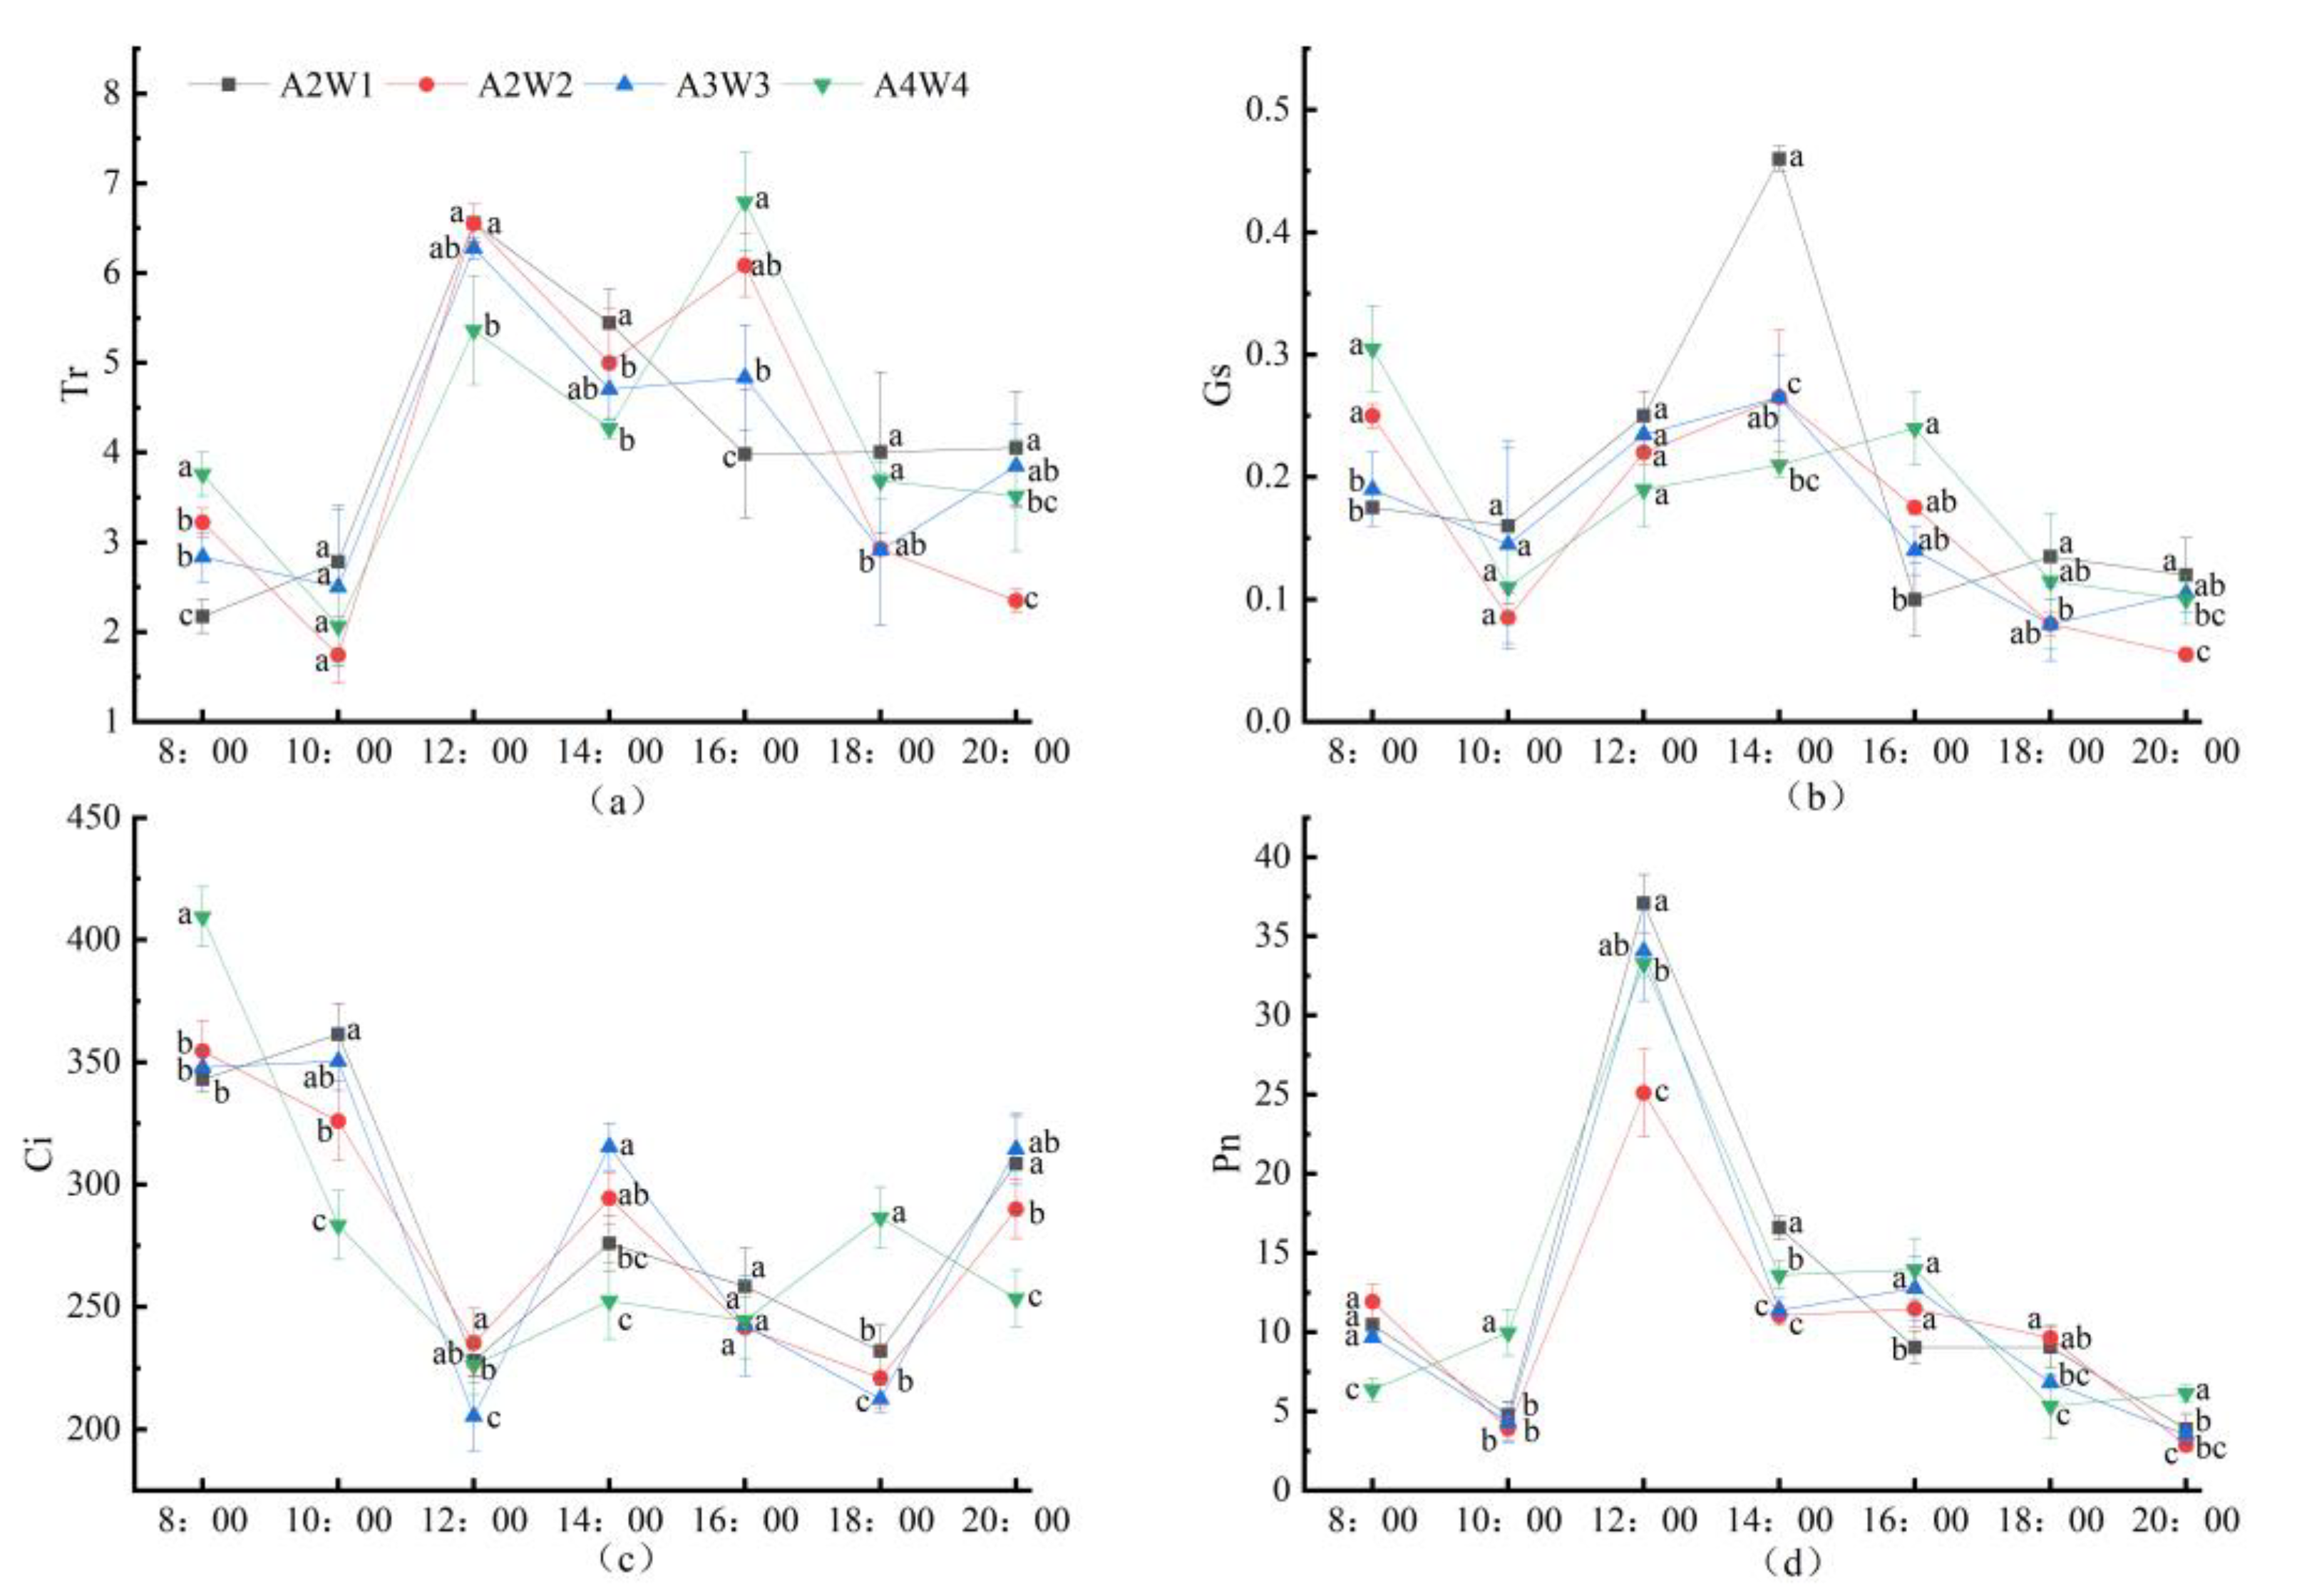
Figure 7.
The variation photosynthetic index which includes Pn—net photosynthetic rate (a), Tr—transpiration rate (b), Gs—stomatal conductance (c) and Ci—intercellular CO2 concentration (d) for aeration treatments at different times on 14 July. Different letters in the same column indicate significance at p < 0.05. The error bars show ± standard deviation and the n value is 3 (replicated three times).
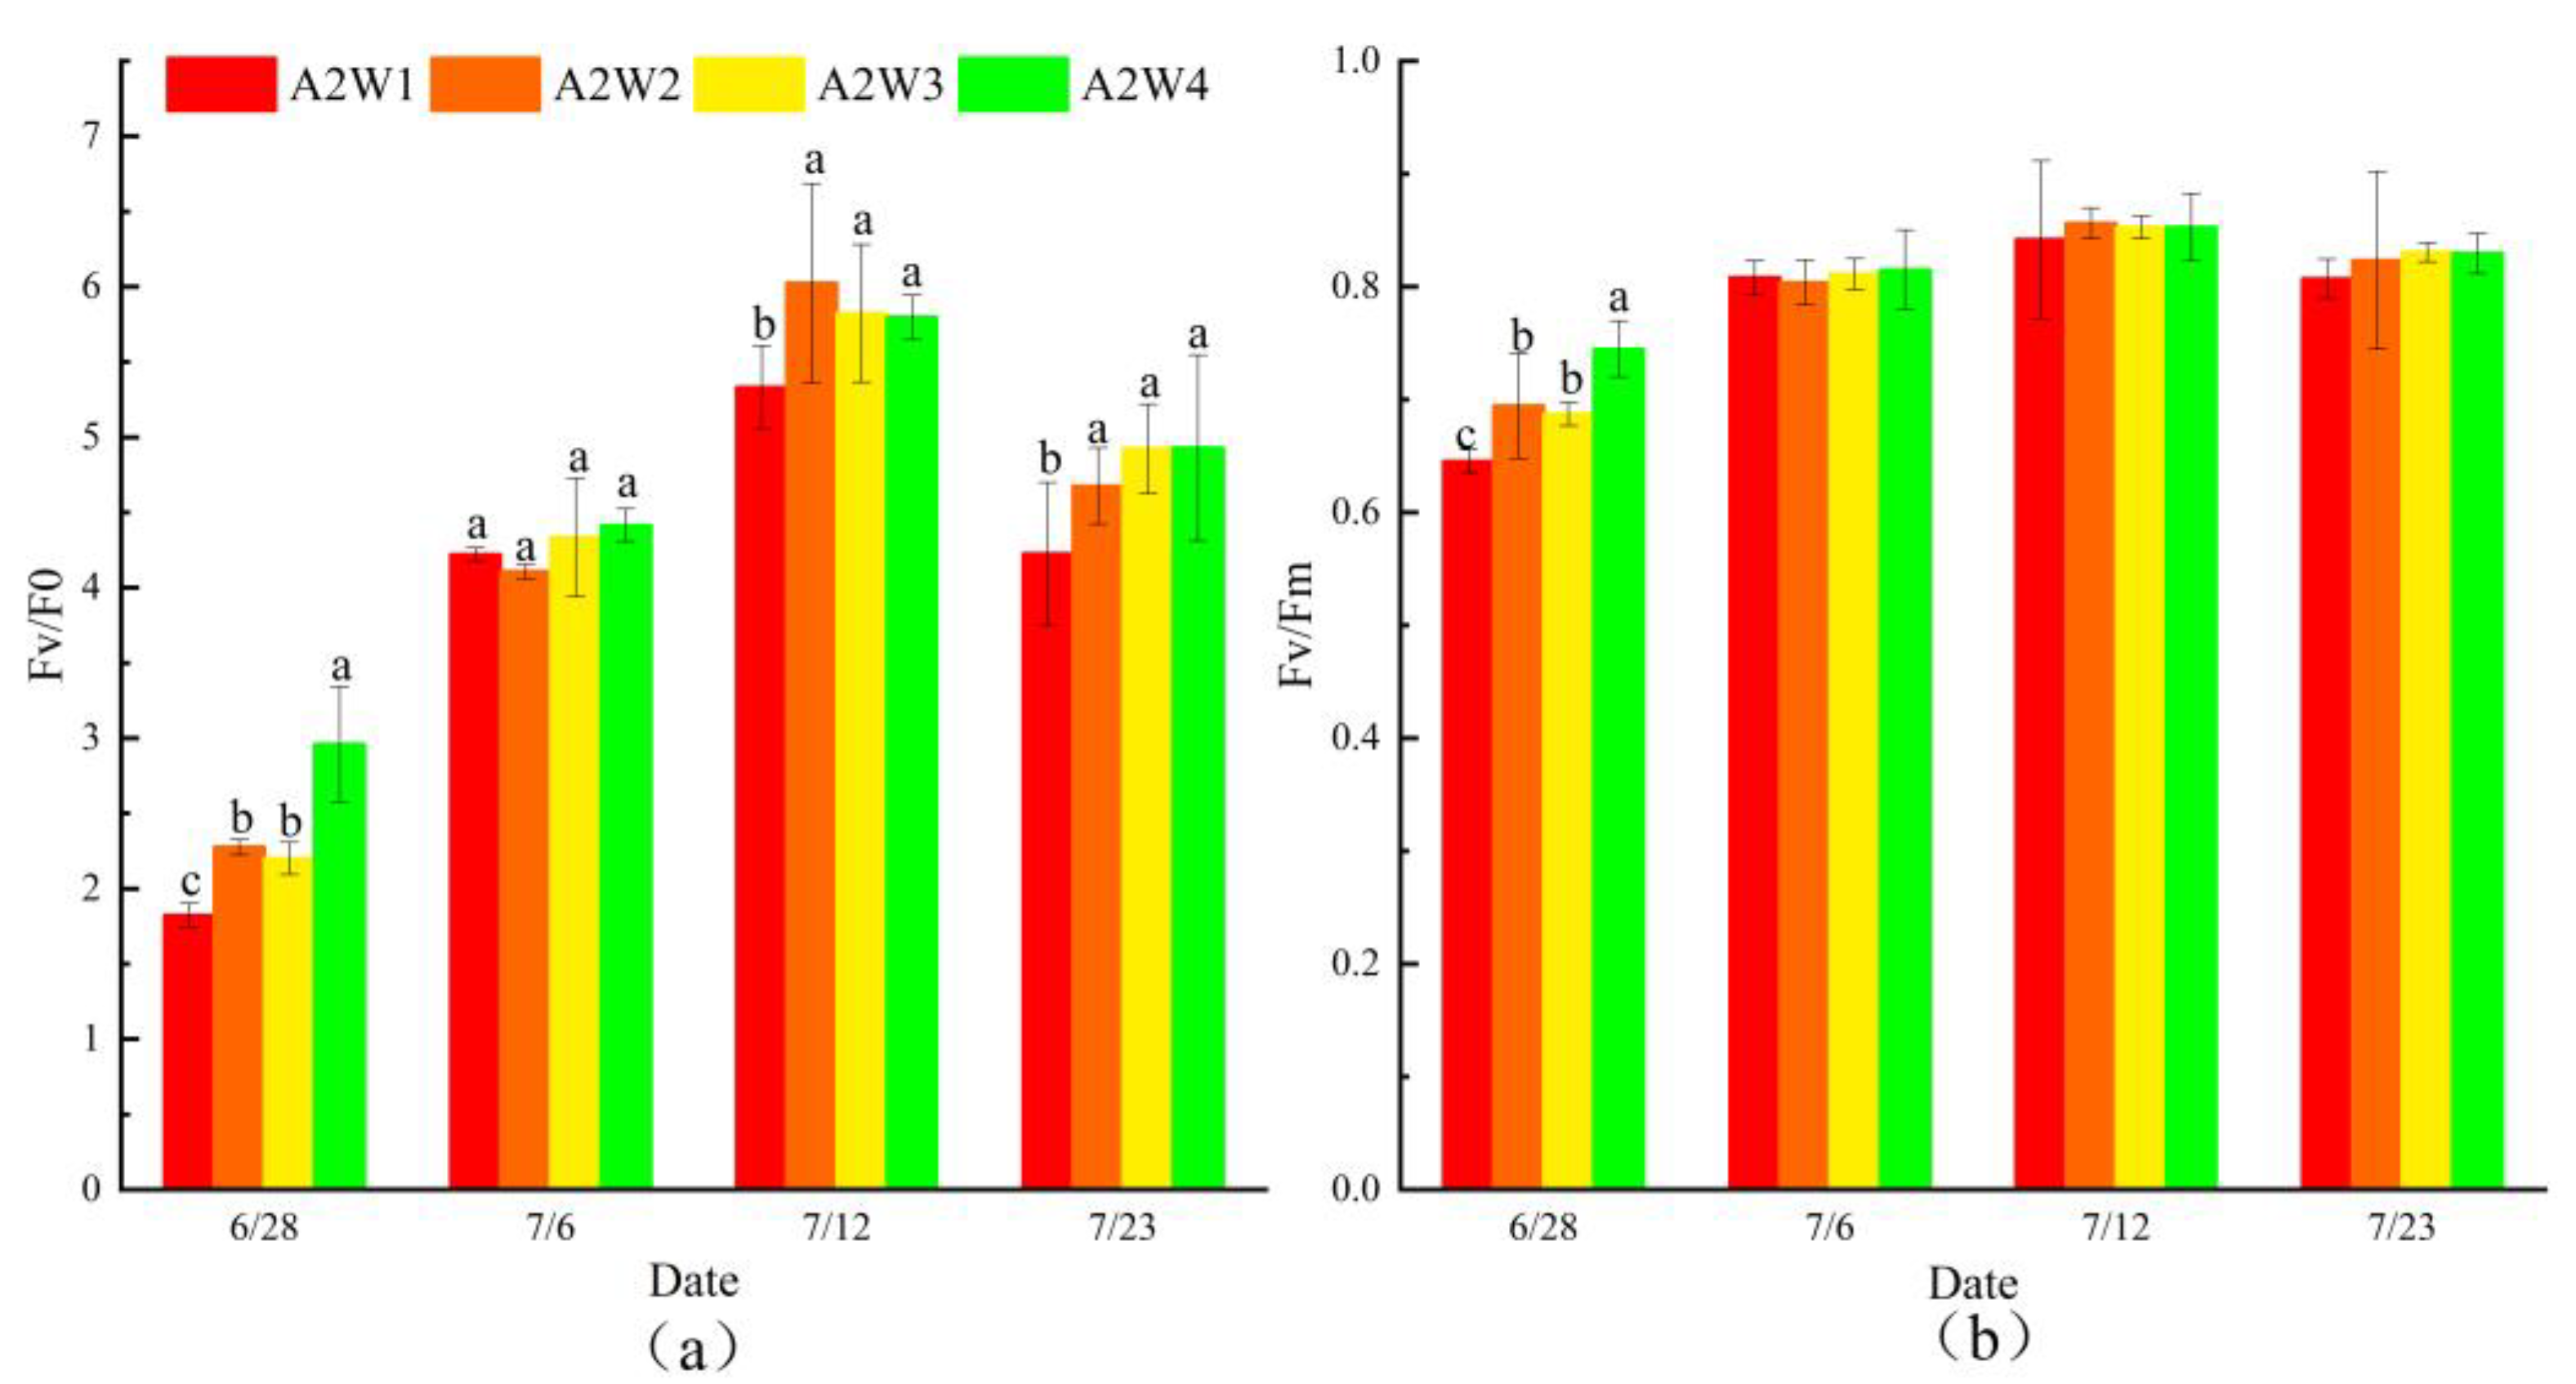
Figure 8.
Fluorescence changes in aerated group, the horizontal axis shows the test date. Test indicators include (a) and (b). is the initial fluorescence yield, is the variable fluorescence yield and Fm is the maximum fluorescence yield. Different letters in the same column indicate significance at p < 0.05. The error bars show ± standard deviation and the n value is 3 (replicated three times).
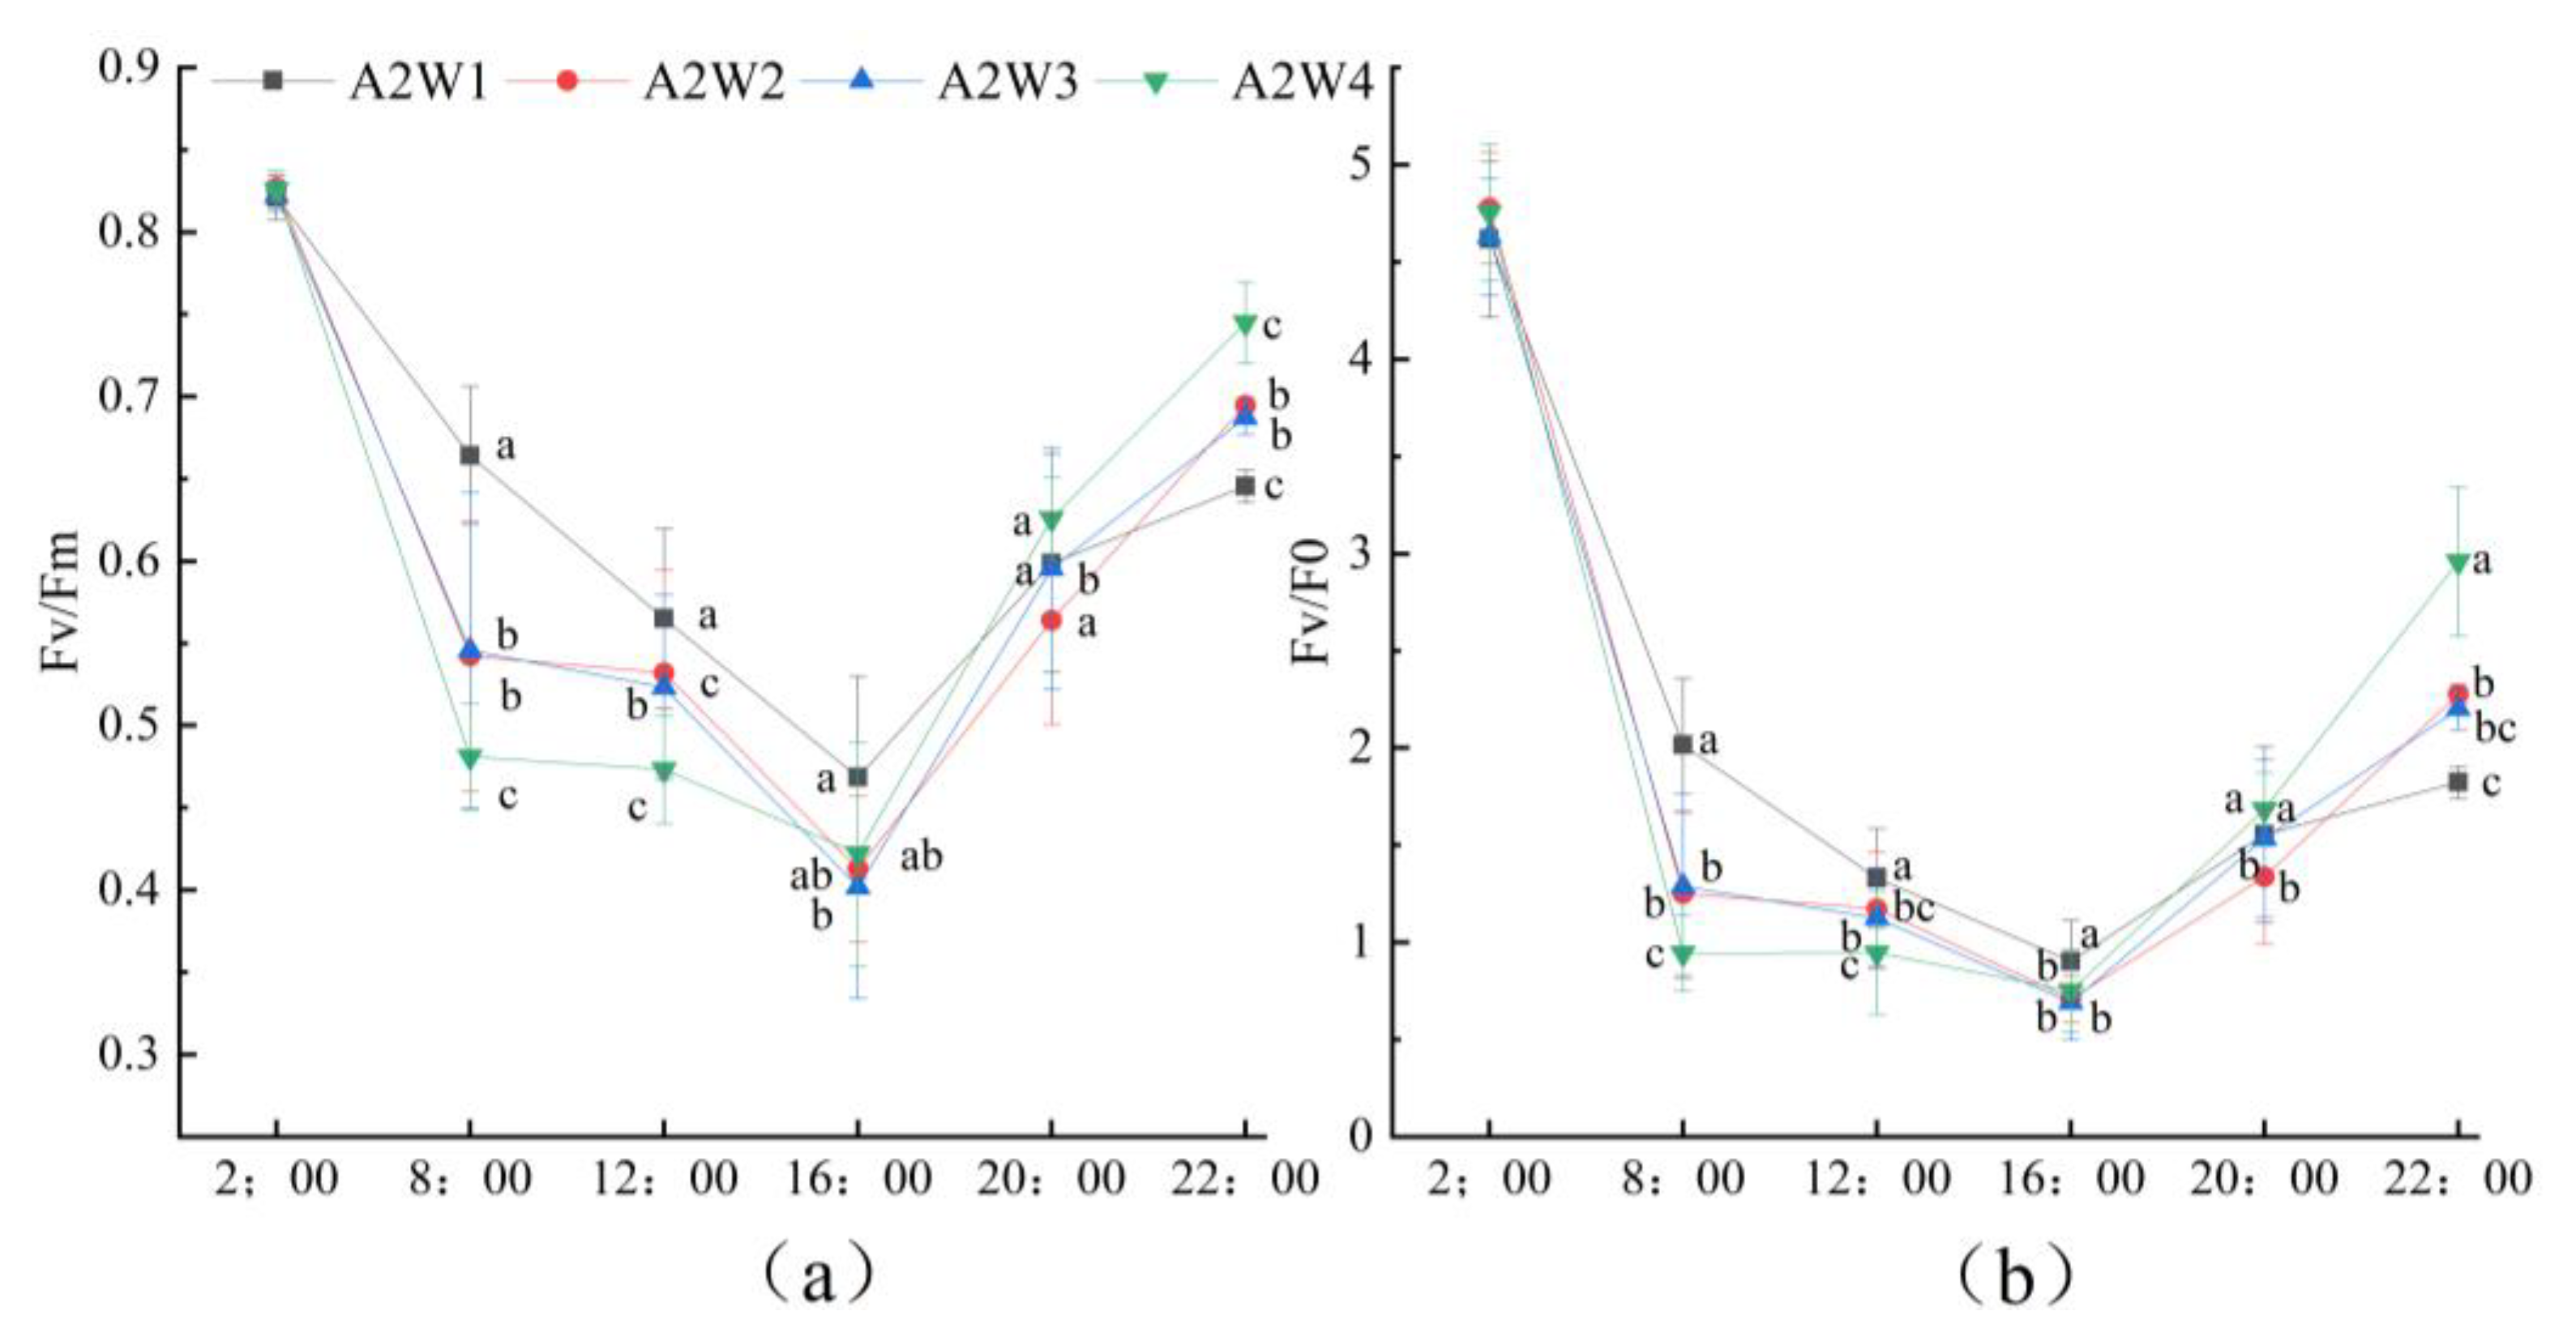
Figure 9.
Diurnal changes in fluorescence characteristics of aerated group on 28 June, and the horizontal axis shows the test time. Test indicators include (a) and (b). is the initial fluorescence yield, is the variable fluorescence yield and Fm is the maximum fluorescence yield. Different letters in the same column indicate significance at p < 0.05. The error bars show ± standard deviation and the n value is 3 (replicated three times).
Table 1.
Soil physical and chemical properties and contents of N, P and K at different depths in the experimental area.
Table 1.
Soil physical and chemical properties and contents of N, P and K at different depths in the experimental area.
| Soil Depth/(cm) | Grain Size Distribution /(mm) | Soil Type | Soil Bulk Density/(g cm−3) | Field Capacity/(%) | The Organic Matter/(g kg−1) | N/(mg kg−1) | P/(mg kg−1) | K/(mg kg−1) |
|---|
| 0–20 | 1.203 | Sandy soil | 1.55 | 30.89 | 15.16 | 120.02 | 45.21 | 203.98 |
| 20–40 | 0.985 | Sandy clay loam | 1.49 | 28.84 | 14.55 | 95.29 | 37.51 | 174.56 |
| 40–60 | 0.897 | Sandpaper clay loam | 1.51 | 25.12 | 11.49 | 82.38 | 32.12 | 197.38 |
| 60–80 | 1.157 | Sandy soil | 1.58 | 22.39 | 12.79 | 76.12 | 29.66 | 155.98 |
| 80–100 | 1.098 | Sandy soil | 1.59 | 20.76 | 9.42 | 64.09 | 22.78 | 176.97 |
Table 2.
Irrigation schedule of processing tomato during the whole growth period.
Table 2.
Irrigation schedule of processing tomato during the whole growth period.
| Treatment Group | Irrigation Amount/ m3 hm−2 | Irrigation Times | Irrigation Norm/ m3 hm−2 |
|---|
| A1W1 | 4950 m3 hm−2 | 8 | 618.25 |
| A1W2 | 4750 m3 hm−2 | 8 | 590.62 |
| A1W3 | 4500 m3 hm−2 | 8 | 562.50 |
| A1W4 | 4050 m3 hm−2 | 8 | 506.25 |
| A2W1 | 4950 m3 hm−2 | 8 | 618.25 |
| A2W2 | 4750 m3 hm−2 | 8 | 590.62 |
| A2W3 | 4500 m3 hm−2 | 8 | 562.50 |
| A2W4 | 4050 m3 hm−2 | 8 | 506.25 |
Table 3.
Fertilizer schedule of processing tomato during the whole growth period.
Table 3.
Fertilizer schedule of processing tomato during the whole growth period.
| Growth Period | Date | Irrigation and Fertilization Cycle/d | Ratio of Irrigation and Fertilization/% | Frequency of Irrigations and Fertilizations |
|---|
| Seedling stage | 6 May–9 June | 35 | 16.7 | 1 |
| Florescence | 10 June–2 July | 23 | 16.7 | 2 |
| Fruit expansion | 3 July–4 August | 33 | 50 | 4 |
| Mature stage | 5 August–22 August | 18 | 16.6 | 1 |
| Whole growth period | 6 May–22 August | 109 | 100.0 | 8 |
Table 4.
Effects of different treatment methods on the yield factors (yield per plant, single fruit weight, number of fruits per plant, irrigation water use efficiency) of processing tomato fruits.
Table 4.
Effects of different treatment methods on the yield factors (yield per plant, single fruit weight, number of fruits per plant, irrigation water use efficiency) of processing tomato fruits.
| Treatment Group | Yield per Plant | Single Fruit Weight | Number of Fruits per Plant | Irrigation Water Use Efficiency |
|---|
| A1W1 | 3.87 ± 0.25 abc | 60.25 ± 3.40 abc | 60.67 ± 1.15 a | 34.71 ± 2.38 a |
| A1W2 | 3.49 ± 0.40 bc | 61.30 ± 7.66 abc | 57.00 ± 2.00 bc | 34.53 ± 3.96 a |
| A1W3 | 3.27 ± 0.11 cd | 59.74 ± 5.36 bc | 55.00 ± 3.61 cd | 34.18 ± 1.15 a |
| A1W4 | 3.02 ± 0.07 d | 55.82 ± 2.07 c | 53.00 ± 1.73 de | 34.31 ± 0.82 a |
| A2W1 | 4.03 ± 0.13 a | 68.36 ± 1.39 ab | 59.00 ± 1.00 ab | 38.29 ± 1.19 a |
| A2W2 | 3.84 ± 0.18 ab | 69.36 ± 3.78 a | 55.33 ± 0.58 cd | 37.96 ± 1.74 a |
| A2W3 | 3.57 ± 0.29 bc | 66.55 ± 6.79 ab | 53.67 ± 1.15 cde | 37.25 ± 3.07 a |
| A2W4 | 3.24 ± 0.14 cd | 63.70 ± 5.39 abc | 51.00 ± 2.65 e | 37.59 ± 1.64a |
| F value test |
| W | 12.744 ** | 1.443 | 16.932 ** | 0.142 |
| A | 12.891 ** | 14.676 ** | 4.301 | 13.412 ** |
| W × A | 0.06 | 0.023 | 0.029 | 0.014 |
Table 5.
Effects of different treatment methods on fruit quality factors (vitamin C, soluble solids, soluble sugar, organic acid, sugar-acid ratio) of processing tomato.
Table 5.
Effects of different treatment methods on fruit quality factors (vitamin C, soluble solids, soluble sugar, organic acid, sugar-acid ratio) of processing tomato.
| Treatment Group | Vitamin C/mg 100 g−1 | Soluble Solids/% | Soluble Sugar/% | Organic Acid/% | Sugar-Acid Ratio |
|---|
| A1W1 | 15.87 ± 0.15 e | 4.75 ± 0.23 e | 5.11 ± 0.11 g | 0.24 ± 0.00 f | 21.46 ± 0.40 a |
| A1W2 | 18.35 ± 0.67 abc | 5.88 ± 0.23 ab | 5.49 ± 0.06 e | 0.25 ± 0.00 e | 21.69 ± 0.33 a |
| A1W3 | 17.77 ± 0.46 bc | 5.55 ± 0.08 bc | 5.64 ± 0.05 d | 0.27 ± 0.00 d | 21.13 ± 0.28 ab |
| A1W4 | 16.54 ± 0.59 de | 5.04 ± 0.15 de | 5.88 ± 0.11 b | 0.29 ± 0.00 b | 20.61 ± 0.06 b |
| A2W1 | 16.17 ± 0.34 e | 4.98 ± 0.22 de | 5.28 ± 0.02 f | 0.25 ± 0.01 e | 21.00 ± 0.47 ab |
| A2W2 | 19.13 ± 0.92 a | 6.12 ± 0.31 a | 5.70 ± 0.05 cd | 0.27 ± 0.00 d | 21.43 ± 0.14 a |
| A2W3 | 18.51 ± 0.44 ab | 5.73 ± 0.26 b | 5.82 ± 0.05 bc | 0.28 ± 0.00 c | 21.11 ± 0.35 ab |
| A2W4 | 17.47 ± 0.56 cd | 5.33 ± 0.05 cd | 6.03 ± 0.13 a | 0.29 ± 0.00 a | 20.45 ± 0.72 b |
| F-value |
| W | 28.245 ** | 34.328 ** | 99.316 ** | 147.996 ** | 7.19 |
| A | 9.068 ** | 7.471 * | 31.26 ** | 50.748 ** | 1.931 |
| W×A | 0.353 | 0.068 | 0.228 | 0.572 | 0.336 |
Table 6.
Correlations among various fruit yield factors (yield per plant, single fruit weight, number of fruits per plant, irrigation water use efficiency) and fruit quality factors (vitamin C, soluble solids, soluble sugar, organic acid, sugar-acid ratio).
Table 6.
Correlations among various fruit yield factors (yield per plant, single fruit weight, number of fruits per plant, irrigation water use efficiency) and fruit quality factors (vitamin C, soluble solids, soluble sugar, organic acid, sugar-acid ratio).
| Index | Yield per Plant | Single Fruit Weight | Number of Fruits per Plant | Irrigation Water Use Efficiency | Vitamin C | Soluble Solids | Soluble Sugar | Organic Acid | Sugar-Acid Ratio |
|---|
| Yield per plant | 1.000 | 0.813 * | 0.661 | 0.611 | 0.041 | 0.097 | −0.626 | −0.656 | 0.523 |
| Single fruit weight | | 1.000 | 0.102 | 0.908 ** | 0.407 | 0.411 | −0.061 | −0.131 | 0.183 |
| Number of fruits per plant | | | 1.000 | −0.137 | −0.435 | −0.346 | −0.995 ** | −0.966 ** | 0.681 |
| Irrigation water use efficiency | | | | 1.000 | 0.224 | 0.197 | 0.166 | 0.144 | −0.217 |
| Vitamin C | | | | | 1.000 | 0.988 ** | 0.485 | 0.305 | 0.312 |
| Soluble solids | | | | | | 1.000 | 0.399 | 0.210 | 0.391 |
| Soluble sugar | | | | | | | 1.000 | 0.966 ** | −0.641 |
| Organic acid | | | | | | | | 1.000 | −0.761 * |
| Sugar−acid ratio | | | | | | | | | 1.000 |
Table 7.
Eigenvalue and variance contribution rates based on the principal component analysis.
Table 7.
Eigenvalue and variance contribution rates based on the principal component analysis.
| Principle Components | Eigenvalue | Variance Contribution Rate/% | Cumulative Variance Contribution Rate/% |
|---|
| 1 | 4.207 | 46.750 | 46.750 |
| 2 | 3.029 | 33.660 | 80.409 |
| 3 | 1.698 | 18.864 | 99.274 |
| 4 | 0.036 | 0.394 | 99.668 |
| 5 | 0.020 | 0.227 | 99.895 |
| 6 | 0.009 | 0.101 | 99.996 |
| 7 | 0.000 | 0.004 | 100.000 |
| 8 | 1.381 × 10⁻¹⁶ | 1.535 × 10⁻¹⁵ | 100.000 |
| 9 | −2.669 × 10⁻¹⁶ | −2.965 × 10⁻¹⁵ | 100.000 |
Table 8.
The component matrix based on the rotary factor method.
Table 8.
The component matrix based on the rotary factor method.
| Index | Principle Components |
|---|
| 1 | 2 | 3 |
|---|
| Yield per plant | 0.756 | 0.582 | −0.292 |
| Single fruit weight | 0.241 | 0.886 | −0.392 |
| Number of fruits per plant | 0.987 | −0.139 | 0.032 |
| Irrigation water use efficiency | −0.012 | 0.732 | −0.677 |
| Vc | −0.347 | 0.781 | 0.518 |
| Soluble solids | −0.260 | 0.783 | 0.558 |
| Soluble sugar | −0.979 | 0.195 | −0.011 |
| Organic acid | −0.976 | 0.054 | −0.145 |
| Sugar-acid ratio | 0.709 | 0.294 | 0.632 |
Table 9.
The comprehensive score of the eight treatments, calculated by principal component analysis based on the impacts of these treatments on fruit yield index, IWUE and fruit quality index.
Table 9.
The comprehensive score of the eight treatments, calculated by principal component analysis based on the impacts of these treatments on fruit yield index, IWUE and fruit quality index.
| Treatment | Main 1 Factor Z1 | Main 2 Factor Z2 | Main 3 Factor Z3 | Comprehensive Score Z | Comprehensive Ranking |
|---|
| A1W1 | 3.021389341 | −1.942167085 | −0.042102298 | 0.756314743 | 4 |
| A1W2 | 1.015580301 | 0.301942387 | 2.059624611 | 0.972001919 | 2 |
| A1W3 | −0.573979059 | −0.776880757 | 1.136918415 | −0.317671277 | 6 |
| A1W4 | −2.285599218 | −2.453827944 | −0.049594969 | −1.917754614 | 8 |
| A2W1 | 2.365940698 | 0.387204693 | −2.120478134 | 0.842520076 | 3 |
| A2W2 | 0.119291817 | 2.873421523 | 0.379559188 | 1.102567293 | 1 |
| A2W3 | −0.989880052 | 1.516464695 | −0.058859821 | 0.036837213 | 5 |
| A2W4 | −2.672743827 | 0.093825085 | −1.305053961 | −1.474818779 | 7 |


